Manufacturing, Engineering & Technology, Fifth Edition, by Serope Kalpakjian and Steven R. Schmid.
ISBN 0-13-148965-8. © 2006 Pearson Education, Inc., Upper Saddle River, NJ. All rights reserved.
Chapter 21
Fundamentals of Machining
Manufacturing, Engineering & Technology, Fifth Edition, by Serope Kalpakjian and Steven R. Schmid.
ISBN 0-13-148965-8. © 2006 Pearson Education, Inc., Upper Saddle River, NJ. All rights reserved.
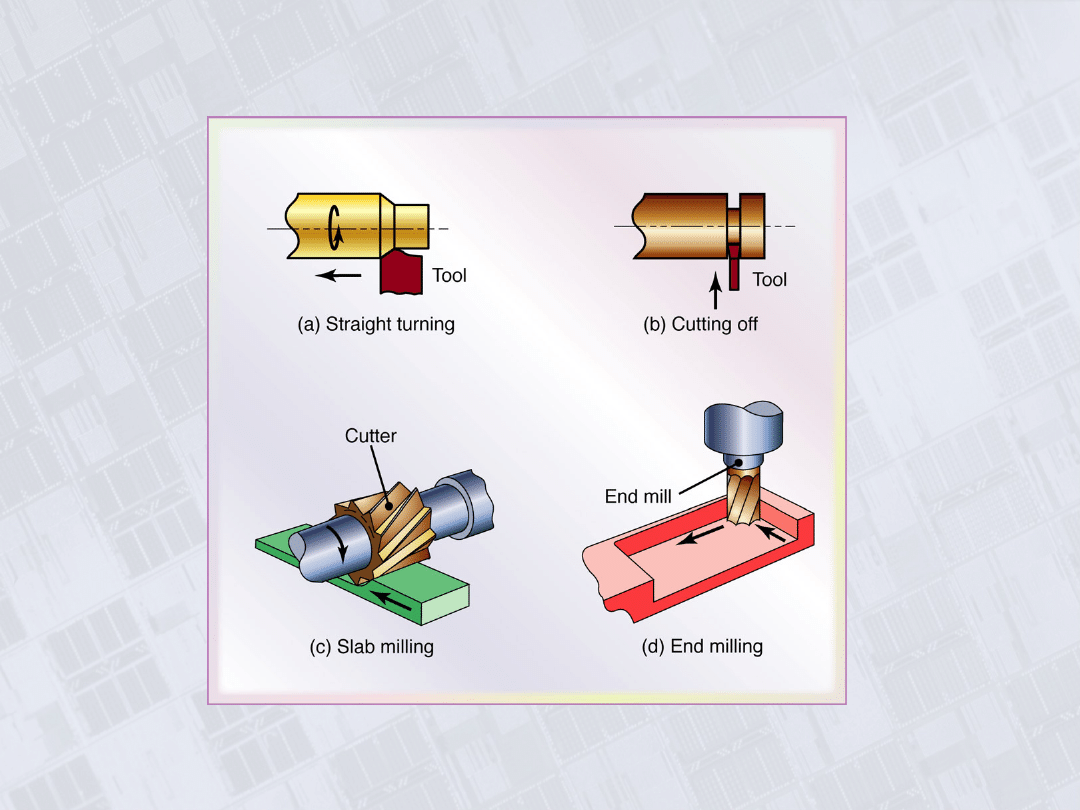
Common Machining Operations
Figure 21.1 Some examples of common machining
operations.
Manufacturing, Engineering & Technology, Fifth Edition, by Serope Kalpakjian and Steven R. Schmid.
ISBN 0-13-148965-8. © 2006 Pearson Education, Inc., Upper Saddle River, NJ. All rights reserved.
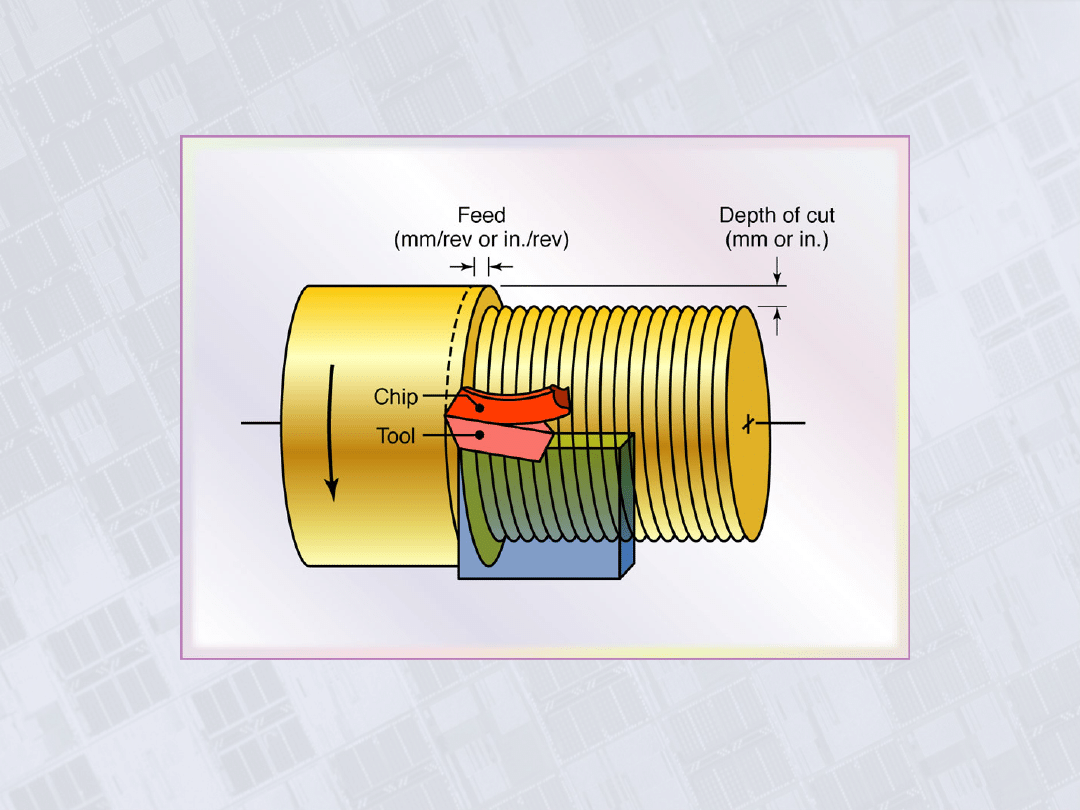
The Turning Operation
Figure 21.2 Schematic illustration of the turning operation showing various
features.
Manufacturing, Engineering & Technology, Fifth Edition, by Serope Kalpakjian and Steven R. Schmid.
ISBN 0-13-148965-8. © 2006 Pearson Education, Inc., Upper Saddle River, NJ. All rights reserved.
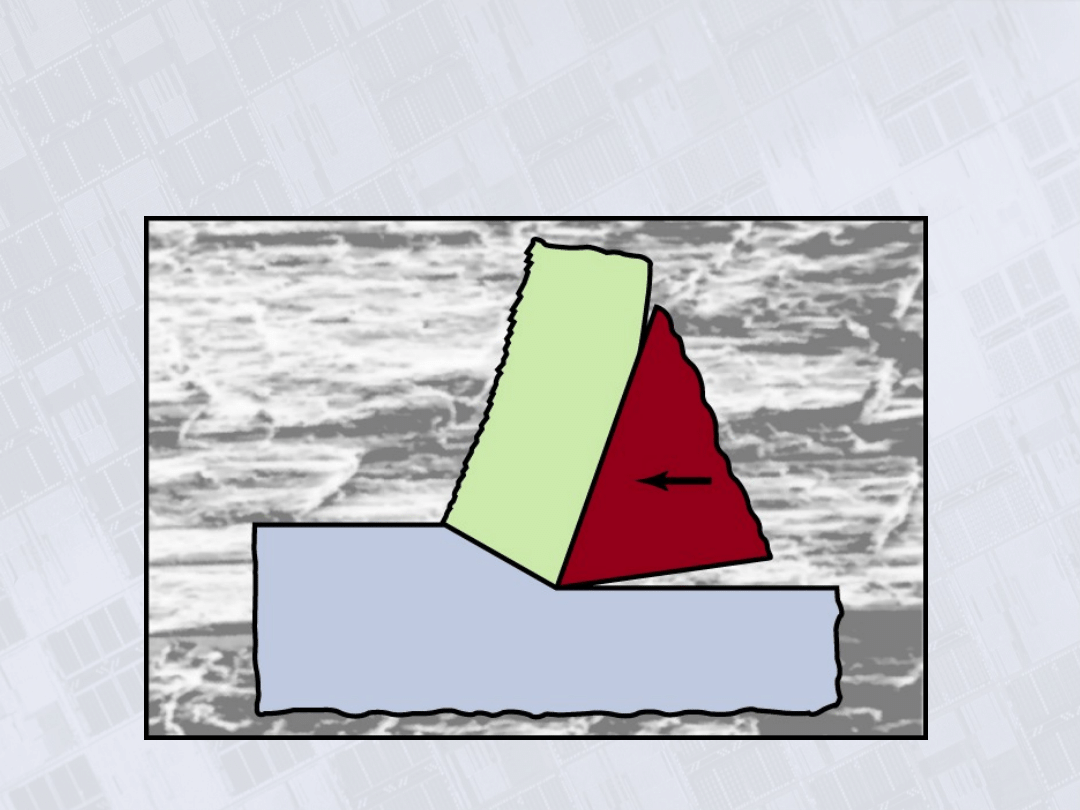
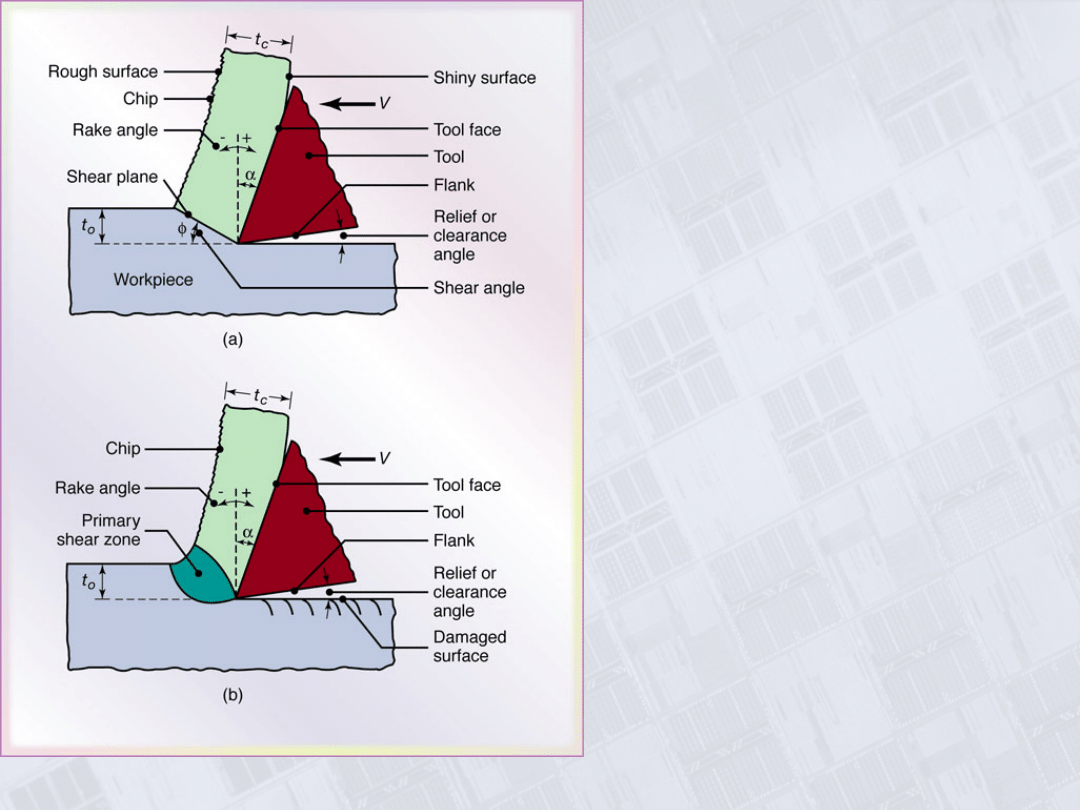
Two-Dimensional
Cutting Process
Figure 21.3 Schematic illustration
of a two-dimensional cutting
process, also called orthogonal
cutting: (a) Orthogonal cutting
with a well-defined shear plane,
also known as the Merchant
Model. Note that the tool shape,
depth of cut, t
o
, and the cutting
speed, V, are all independent
variables, (b) Orthogonal cutting
without a well-defined shear
plane.
Manufacturing, Engineering & Technology, Fifth Edition, by Serope Kalpakjian and Steven R. Schmid.
ISBN 0-13-148965-8. © 2006 Pearson Education, Inc., Upper Saddle River, NJ. All rights reserved.
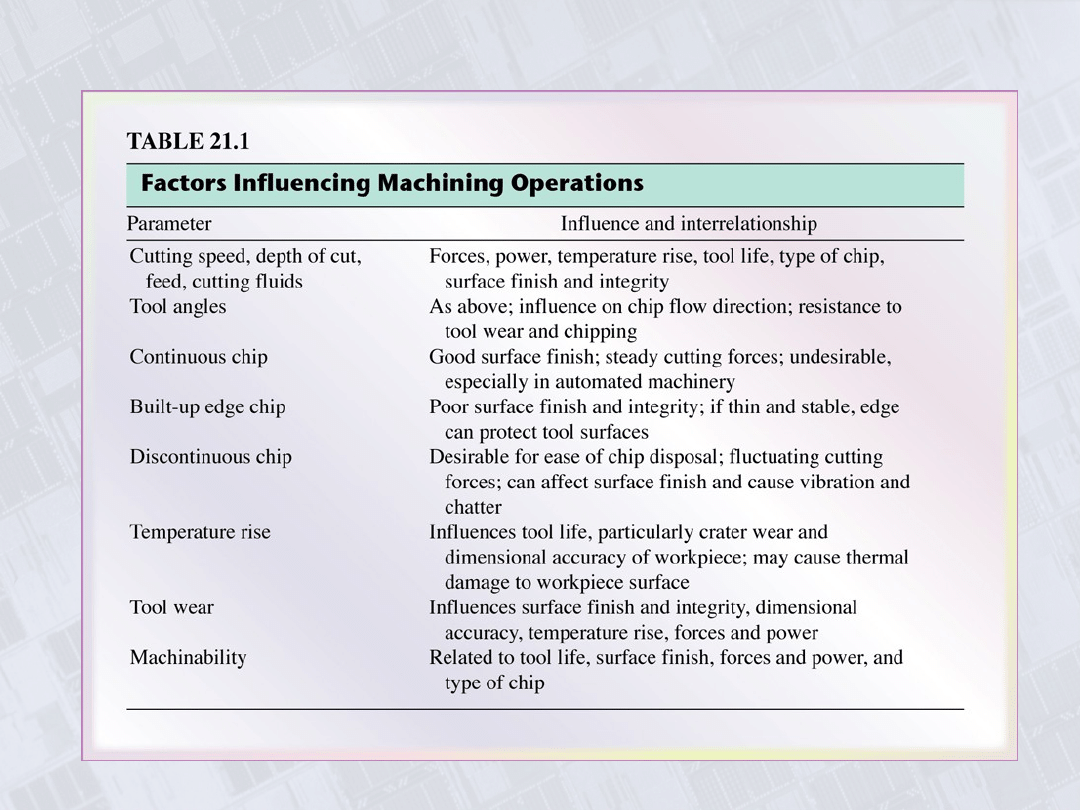
Factors Influencing Machining Operations

Manufacturing, Engineering & Technology, Fifth Edition, by Serope Kalpakjian and Steven R. Schmid.
ISBN 0-13-148965-8. © 2006 Pearson Education, Inc., Upper Saddle River, NJ. All rights reserved.
Mechanics of Cutting
€
Cutting ratio,
r =
t
o
t
c
=
sinφ
cosφ−α
(
)
€
Shear angle preditions
:
φ=45°+
α
2
−
β
2
φ=45°+α −β
€
Velocities,
V
c
=
Vsinφ
cosφ−α
(
)
Manufacturing, Engineering & Technology, Fifth Edition, by Serope Kalpakjian and Steven R. Schmid.
ISBN 0-13-148965-8. © 2006 Pearson Education, Inc., Upper Saddle River, NJ. All rights reserved.
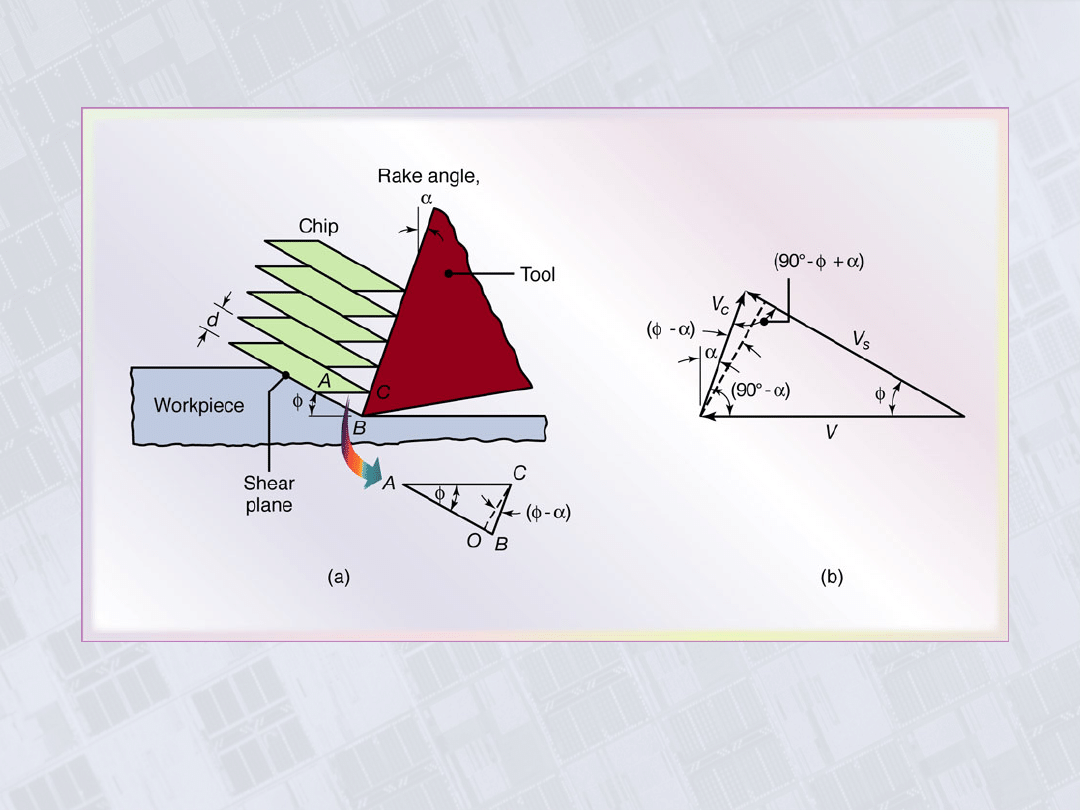
Chip Formation by Shearing
Figure 21.4 (a) Schematic illustration of the basic mechanism of
chip formation by shearing. (b) Velocity diagram showing angular
relationships among the three speeds in the cutting zone.
Manufacturing, Engineering & Technology, Fifth Edition, by Serope Kalpakjian and Steven R. Schmid.
ISBN 0-13-148965-8. © 2006 Pearson Education, Inc., Upper Saddle River, NJ. All rights reserved.
Chips Produced in
Orthogonal Metal
Cutting
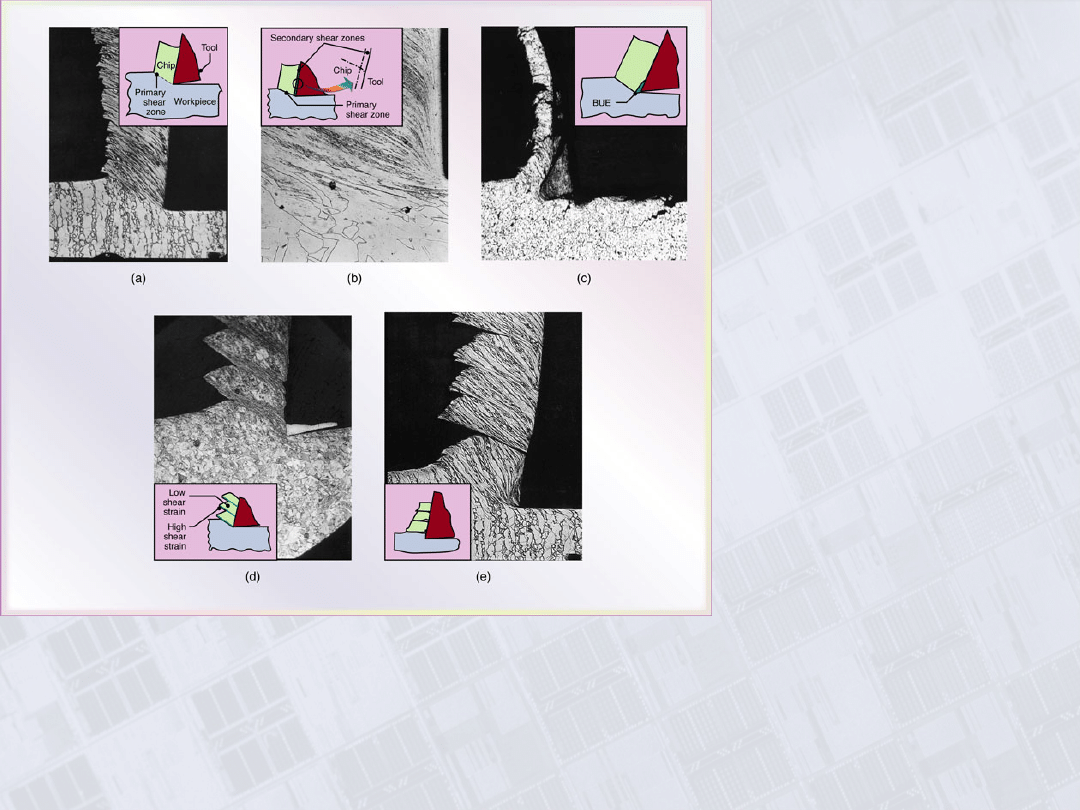
Figure 21.5 Basic types of chips produced in orthogonal metal cutting, their
schematic representation, and photomicrographs of the cutting zone: (a)
continuous chip with narrow, straight, and primary shear zone; (b) continuous
chip with secondary shear zone at the cip-tool interface; (c) built-up edge; (d)
segmented or nonhomogeneous chip; and (e) discontinuous chip. Source:
After M.C. Shaw, P.K. Wright, and S. Kalpakjian.
Manufacturing, Engineering & Technology, Fifth Edition, by Serope Kalpakjian and Steven R. Schmid.
ISBN 0-13-148965-8. © 2006 Pearson Education, Inc., Upper Saddle River, NJ. All rights reserved.
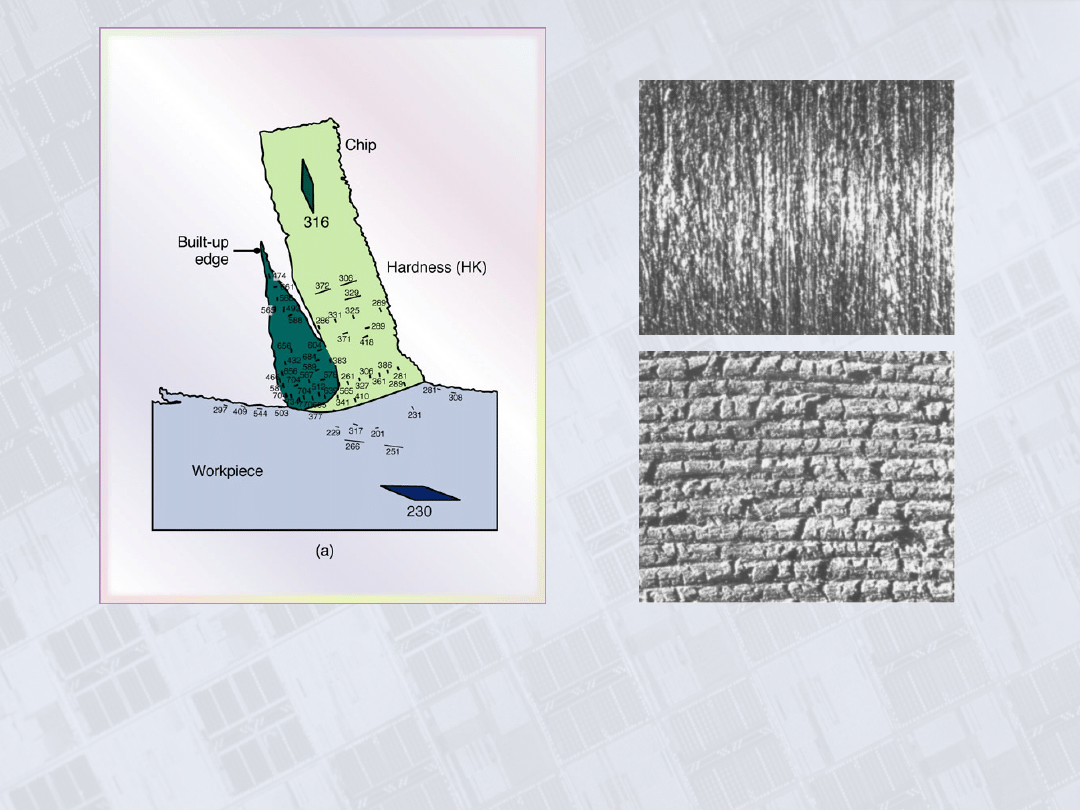
Built-up Edge
Figure 21.6 (a) Hardness distribution with a built-up edge in the cutting zone
(material, 3115 steel). Note that some regions in the built-up edge are as
much as three times harder than the bulk metal of the workpiece. (b) Surface
finish produced in turning 5130 steel with a built-up edge. (c) Surface finish
on 1018 steel in face milling. Magnifications: 15x. Source: Courtesy of
Metcut Research Associates, Inc.
(b
)
(c)
Manufacturing, Engineering & Technology, Fifth Edition, by Serope Kalpakjian and Steven R. Schmid.
ISBN 0-13-148965-8. © 2006 Pearson Education, Inc., Upper Saddle River, NJ. All rights reserved.
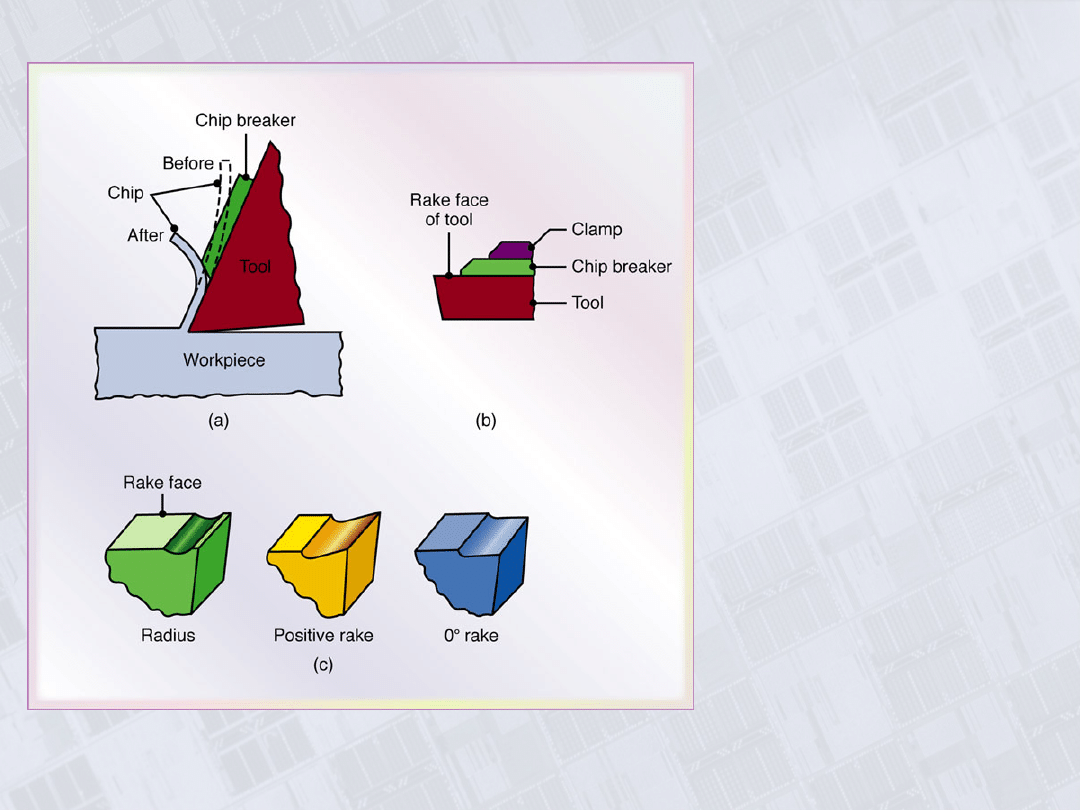
Chip Breaker
Figure 21.7 (a) Schematic
illustration of the action of a
chip breaker. Note that the
chip breaker decreases the
radius of curvature of the chip
and eventually breaks it. (b)
Chip breaker clamped on the
rake face of a cutting tool. (c)
Grooves in cutting tools
acting as chip breakers. Most
cutting toold used now are
inserts with built-in chip
breaker features.
Manufacturing, Engineering & Technology, Fifth Edition, by Serope Kalpakjian and Steven R. Schmid.
ISBN 0-13-148965-8. © 2006 Pearson Education, Inc., Upper Saddle River, NJ. All rights reserved.
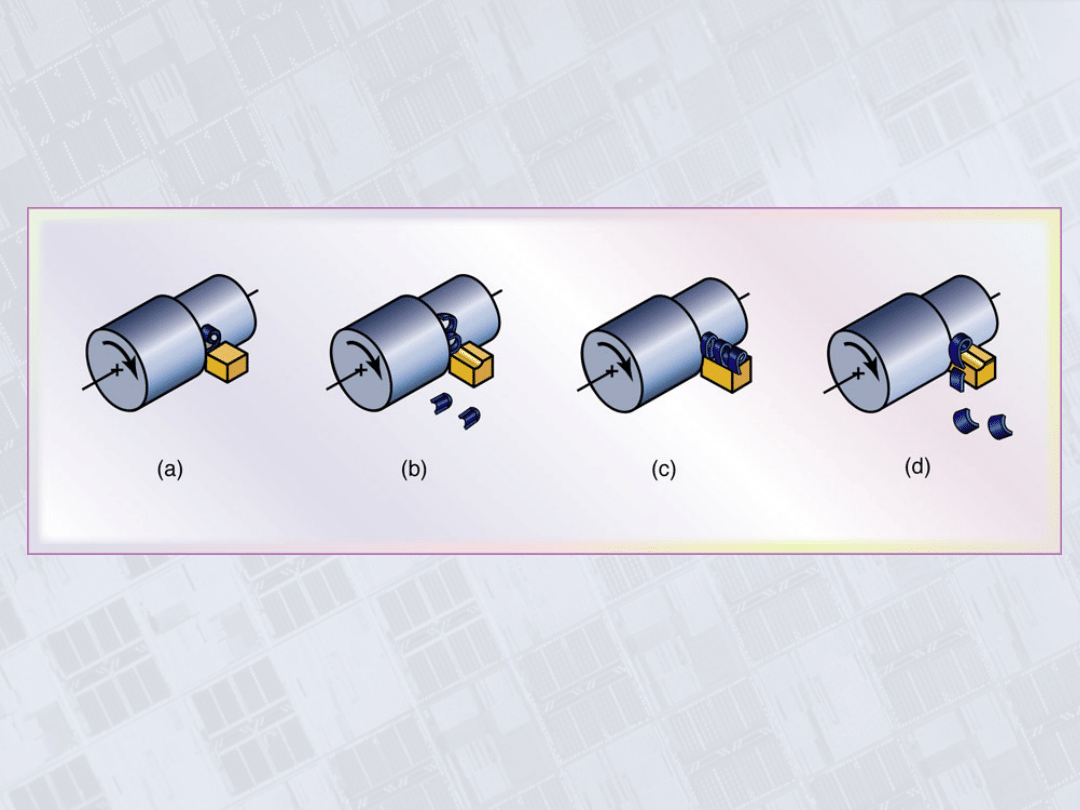
Chips Produced in Turning
Figure 21.8 Chips produced in turning: (a) tightly curled chip; (b) chip hits
workpiece and breaks; (c) continuous chip moving radially away from workpiece;
and (d) chip hits tool shank and breaks off. Source: After G. Boothroyd.
Manufacturing, Engineering & Technology, Fifth Edition, by Serope Kalpakjian and Steven R. Schmid.
ISBN 0-13-148965-8. © 2006 Pearson Education, Inc., Upper Saddle River, NJ. All rights reserved.
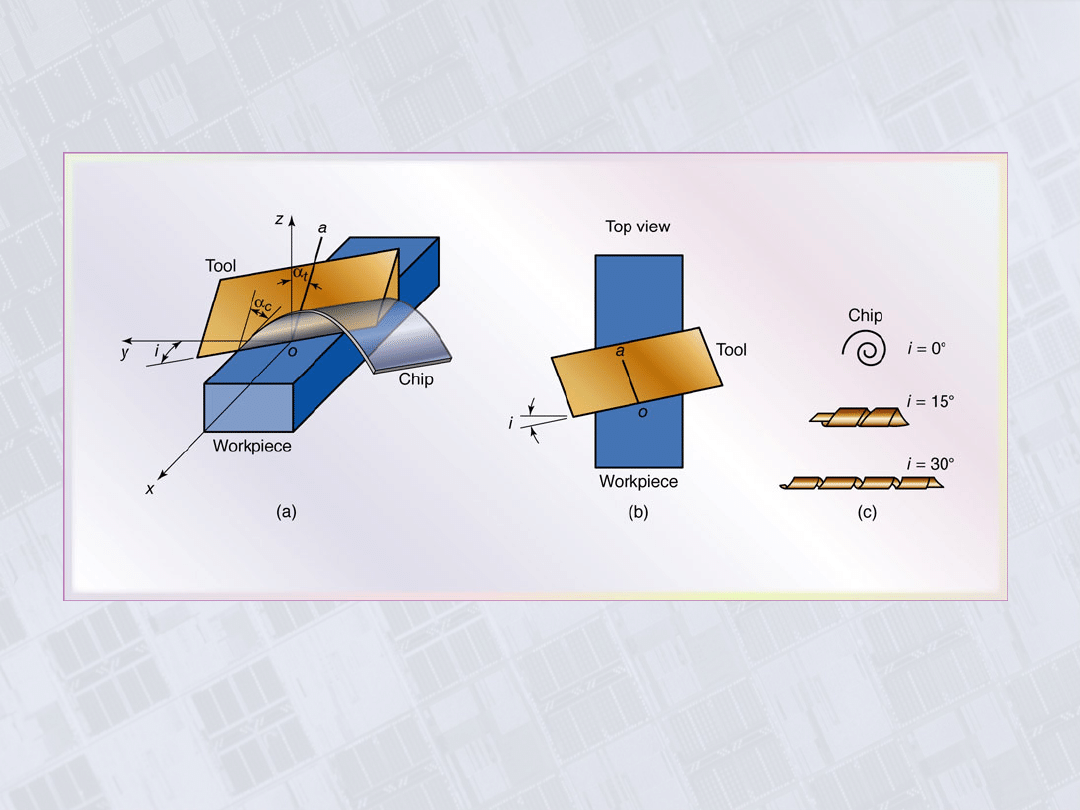
Cutting with an Oblique Tool
Figure 21.9 (a) Schematic illustration of cutting with an oblique
tool. Note the direction of chip movement. (b) Top view, showing
the inclination angle, i,. (c) Types of chips produced with tools at
increasing inclination angles.
Manufacturing, Engineering & Technology, Fifth Edition, by Serope Kalpakjian and Steven R. Schmid.
ISBN 0-13-148965-8. © 2006 Pearson Education, Inc., Upper Saddle River, NJ. All rights reserved.
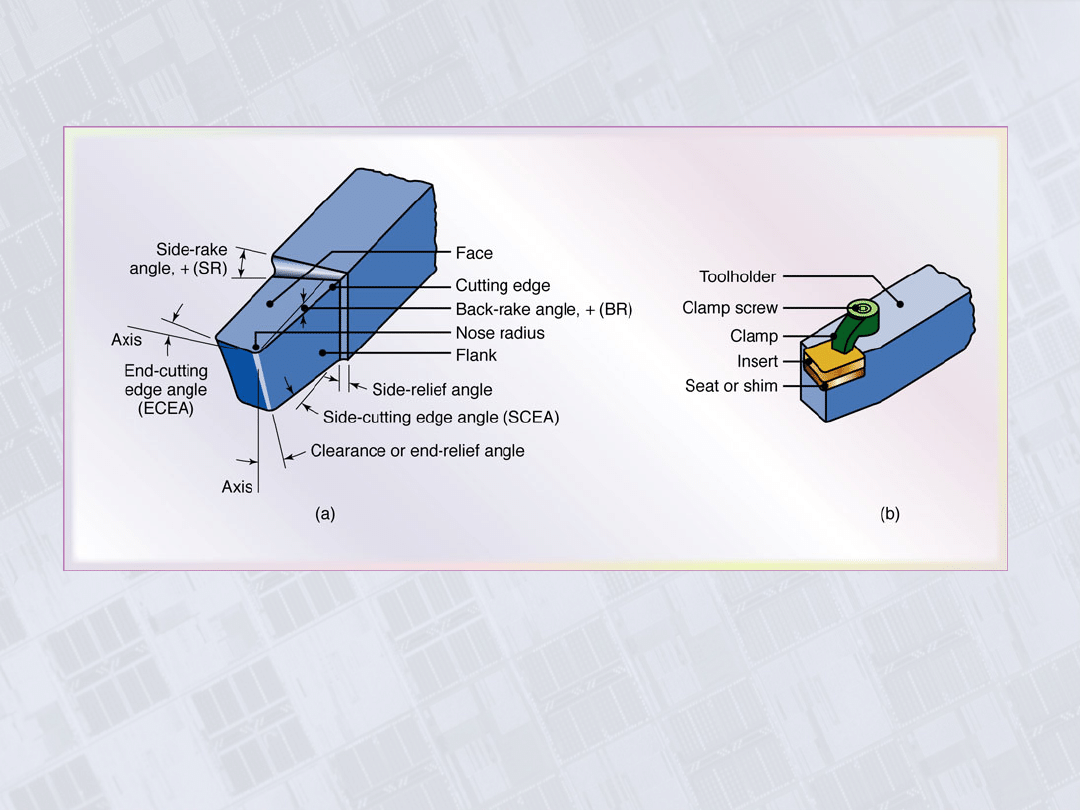
Right-hand Cutting Tool and Insert
Figure 21.20 (a) Schematic illustration of right-hand cutting tool. The
various angles on these tools and their effects on machining are
described in Section 23.3.1 Although these tools traditionally have been
produced from solid tool-steel bars, they have been replaced largely with
(b) inserts made of carbides and other materials of various shapes and
sizes.
Manufacturing, Engineering & Technology, Fifth Edition, by Serope Kalpakjian and Steven R. Schmid.
ISBN 0-13-148965-8. © 2006 Pearson Education, Inc., Upper Saddle River, NJ. All rights reserved.
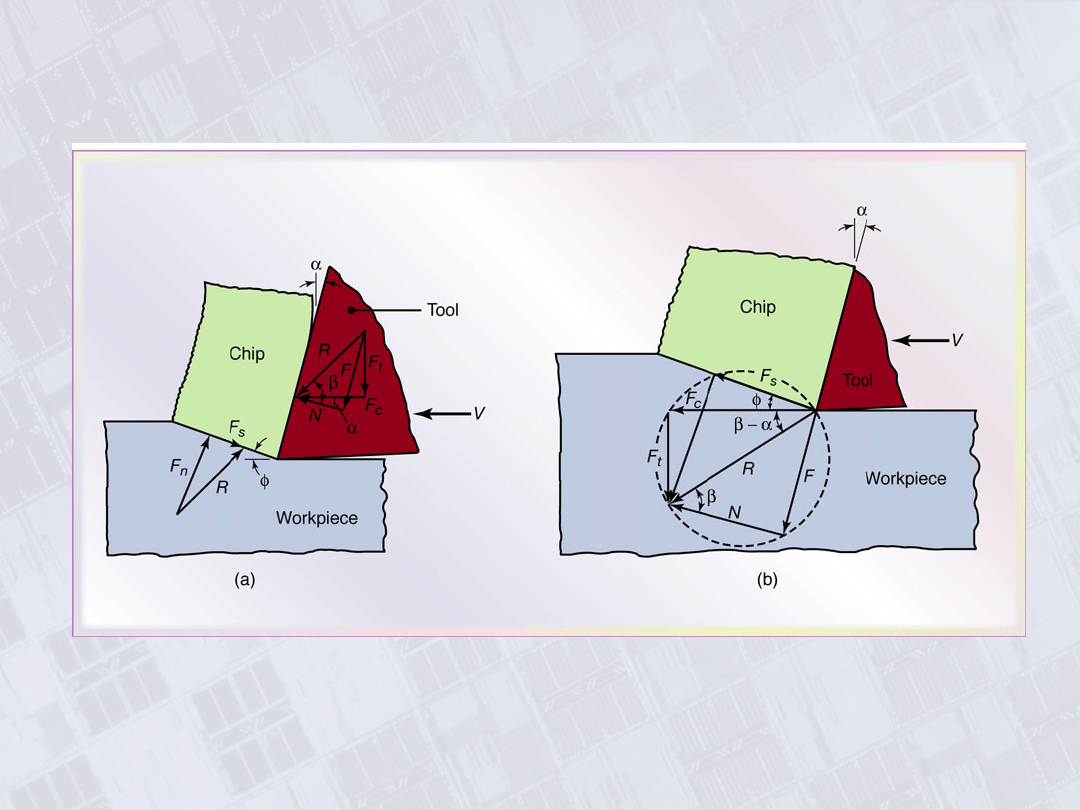
Cutting Forces
Figure 21.11 (a) Forces acting on a cutting tool during two-
dimensional cutting. Note that the resultant force, R, must be
collinear to balance the forces. (b) Force circle to determine various
forces acting in the cutting zone.

Manufacturing, Engineering & Technology, Fifth Edition, by Serope Kalpakjian and Steven R. Schmid.
ISBN 0-13-148965-8. © 2006 Pearson Education, Inc., Upper Saddle River, NJ. All rights reserved.
Cutting Forces and Power
€
Shear force,
F
s
=F
c
cosφ−F
t
sinφ
€
Normal force,
F
n
=F
c
sinφ+F
t
cosφ
€
Coefficient of friction,
μ =
F
N
=
F
t
+F
c
tanα
F
c
−F
t
tanα
€
Power=F
c
V
Manufacturing, Engineering & Technology, Fifth Edition, by Serope Kalpakjian and Steven R. Schmid.
ISBN 0-13-148965-8. © 2006 Pearson Education, Inc., Upper Saddle River, NJ. All rights reserved.
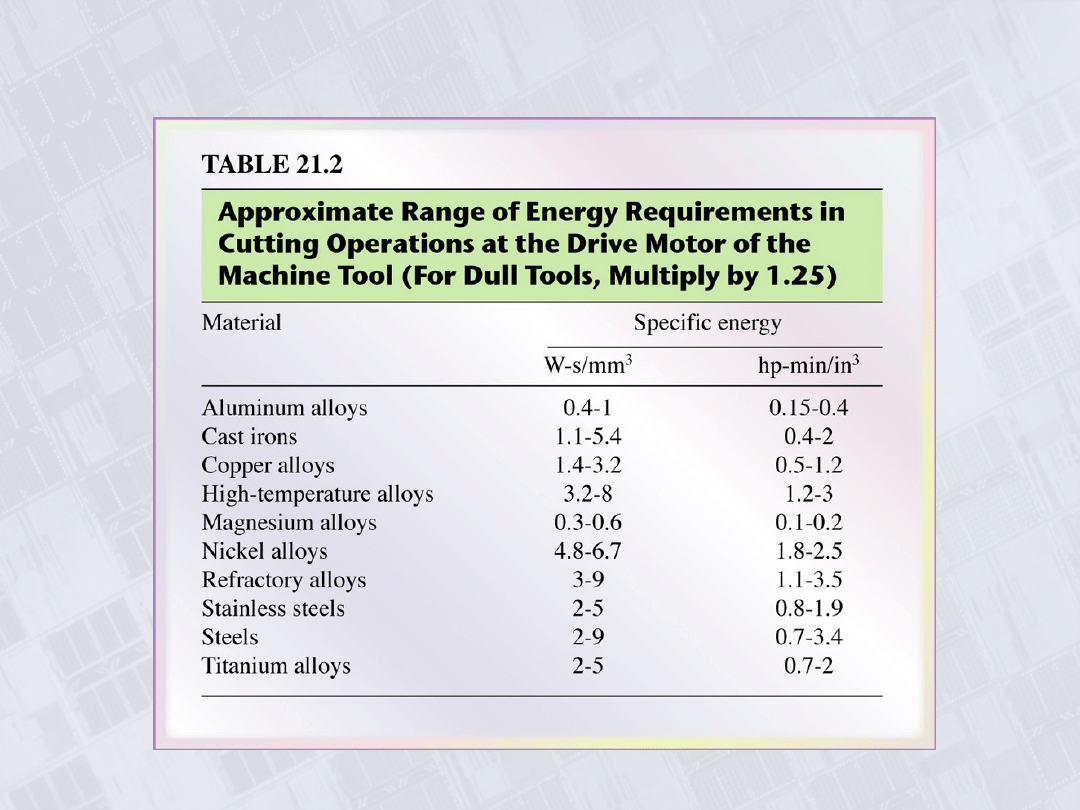
Range of Energy Requirements in Cutting
Operations
Manufacturing, Engineering & Technology, Fifth Edition, by Serope Kalpakjian and Steven R. Schmid.
ISBN 0-13-148965-8. © 2006 Pearson Education, Inc., Upper Saddle River, NJ. All rights reserved.
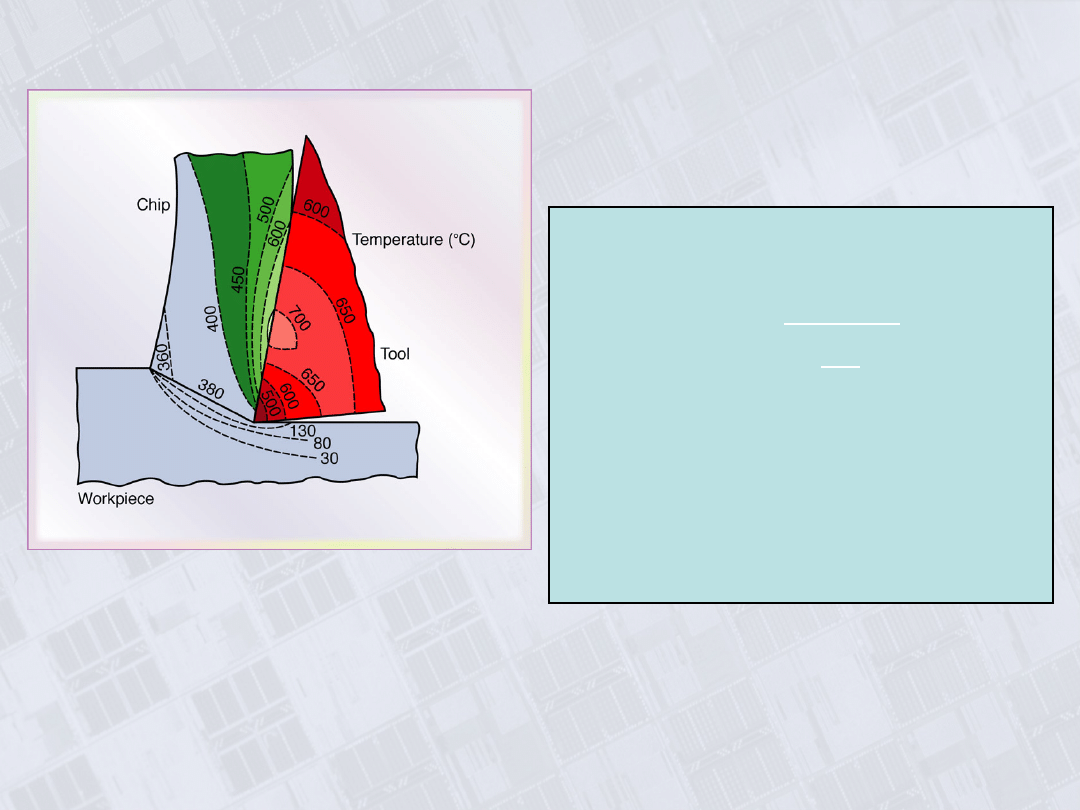
Temperatures in
Cutting Zone
Figure 21.12 Typical temperature
distribution in the cutting zone. Note
the severe temperature gradients
within the tool and the chip, and that
the workpiece is relatively cool.
Source: After G. Vieregge.
€
T
mean
=
1.2Y
f
ρc
Vt
o
K
⎡
⎣
⎢
⎤
⎦
⎥
1/3
where
Y
f
=flow stress,
psi
ρc=volumetric specific heat,
in.- lb/in
3
-°F
K =thermal diffusivity
Mean temperature in cutting:
Manufacturing, Engineering & Technology, Fifth Edition, by Serope Kalpakjian and Steven R. Schmid.
ISBN 0-13-148965-8. © 2006 Pearson Education, Inc., Upper Saddle River, NJ. All rights reserved.
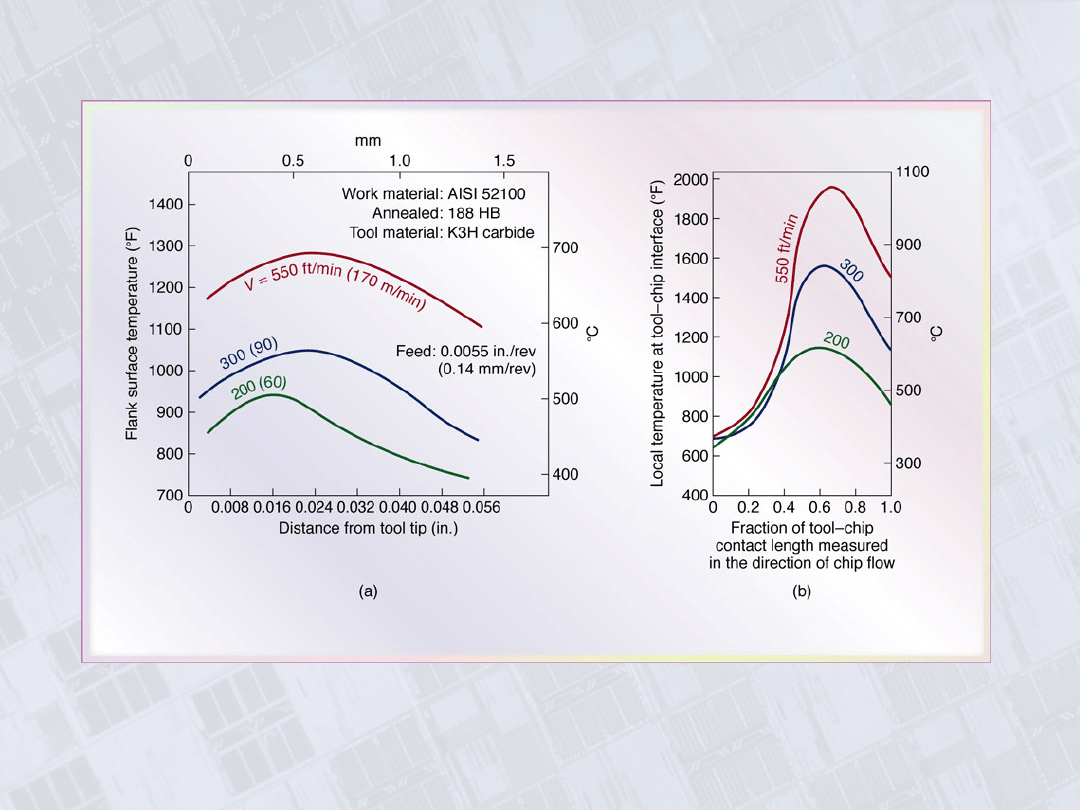
Temperatures Developed in Turning 52100
Steel
Figure 21.13 Temperatures developed in turning 52100 steel: (a)
flank temperature distribution and (b) tool-ship interface
temperature distribution. Source: After B. T. Chao and K. J.
Trigger.
Manufacturing, Engineering & Technology, Fifth Edition, by Serope Kalpakjian and Steven R. Schmid.
ISBN 0-13-148965-8. © 2006 Pearson Education, Inc., Upper Saddle River, NJ. All rights reserved.
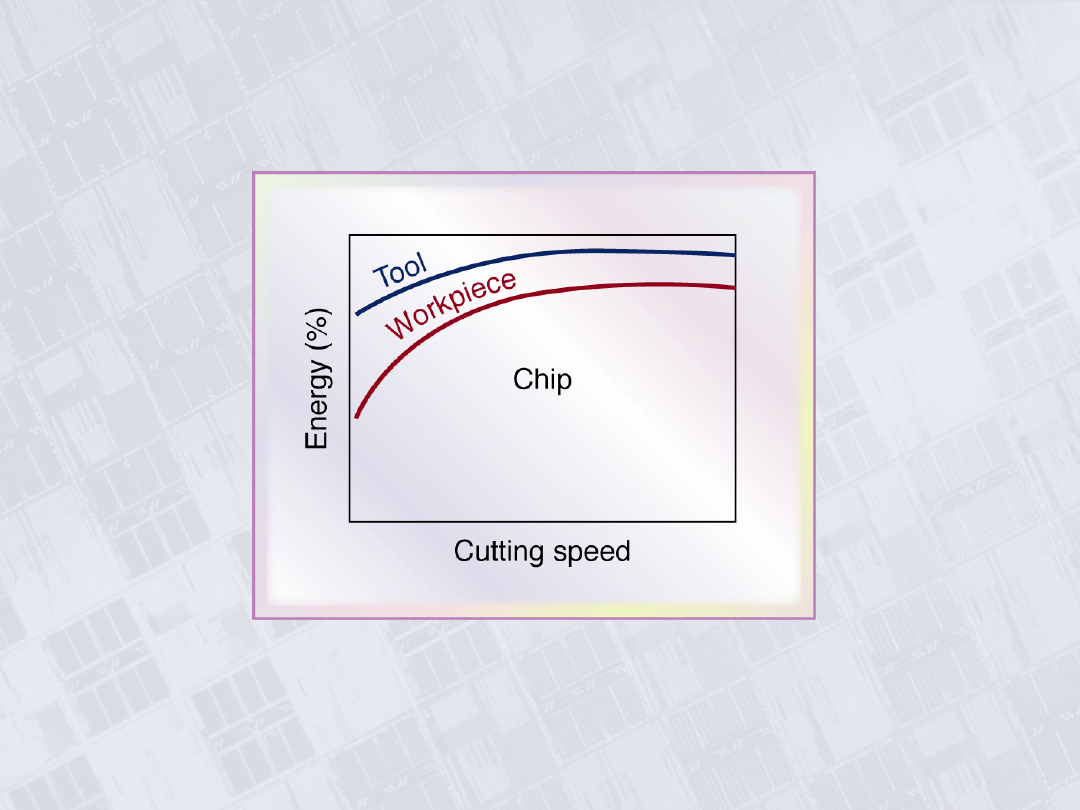
Proportion of Heat from Cutting Transferred
as a Function of Cutting Speed
Figure 21.14 Proportion of the heat generated in cutting
transferred into the tool, workpiece, and chip as a
function of the cutting speed. Note that the chip
removes most of the heat.
Manufacturing, Engineering & Technology, Fifth Edition, by Serope Kalpakjian and Steven R. Schmid.
ISBN 0-13-148965-8. © 2006 Pearson Education, Inc., Upper Saddle River, NJ. All rights reserved.
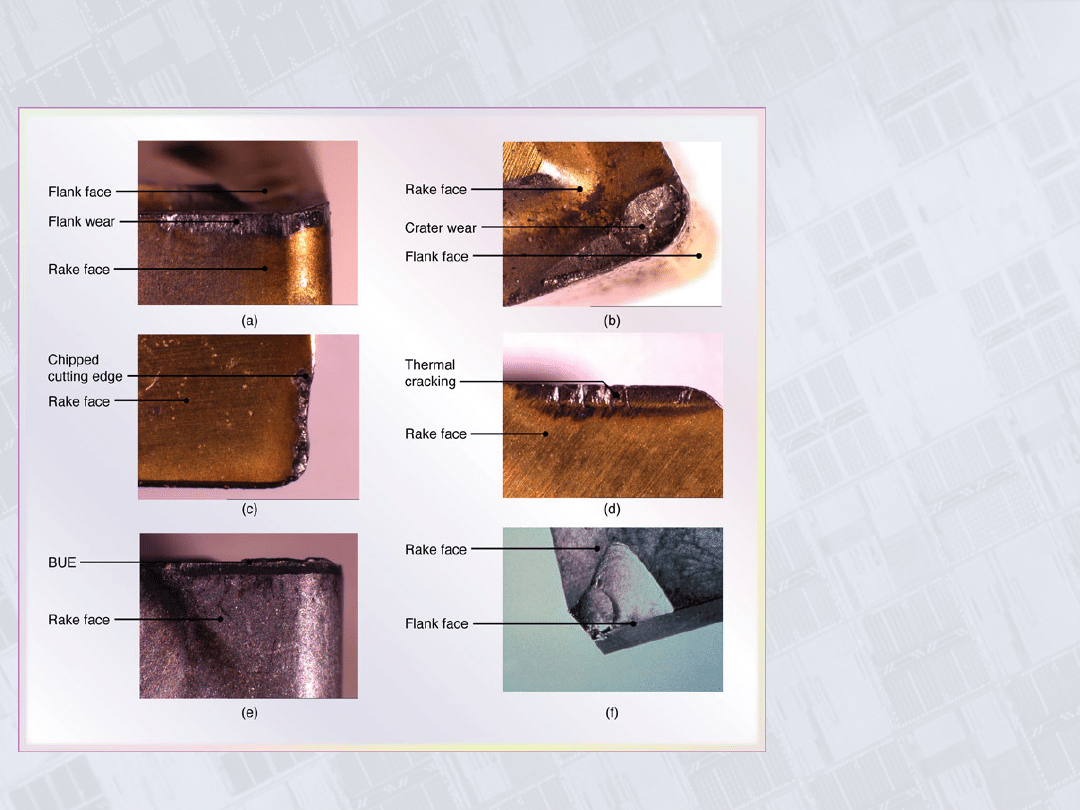
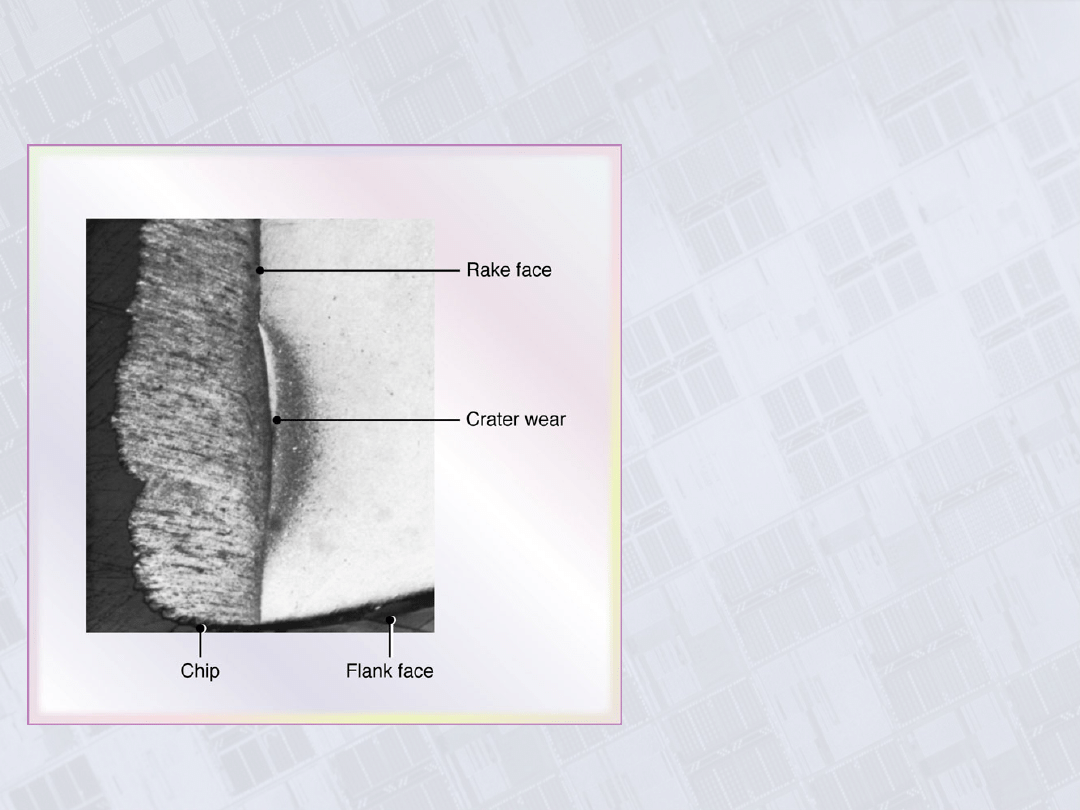
Wear Patterns on Tools
Figure 21.15 (a)
Flank wear and crater
wear in a cutting tool;
the tool moves to the
left as in Fig. 21.3.
(b) View of the rake
face of a turning tool,
showing various wear
patterns. (c) View of
the flank face of a
turning tool, showing
various wear
patterns. (d) Types
of wear on a turning
tool: 1. flank wear; 2.
crater wear; 3.
chipped cutting edge;
4. thermal cracking
on rake face; 5. built-
up edge; 6.
catastrophic failure.
(See also Fig. 21.18.)
Source: Courtesy of
Kennametal, Inc.
Manufacturing, Engineering & Technology, Fifth Edition, by Serope Kalpakjian and Steven R. Schmid.
ISBN 0-13-148965-8. © 2006 Pearson Education, Inc., Upper Saddle River, NJ. All rights reserved.
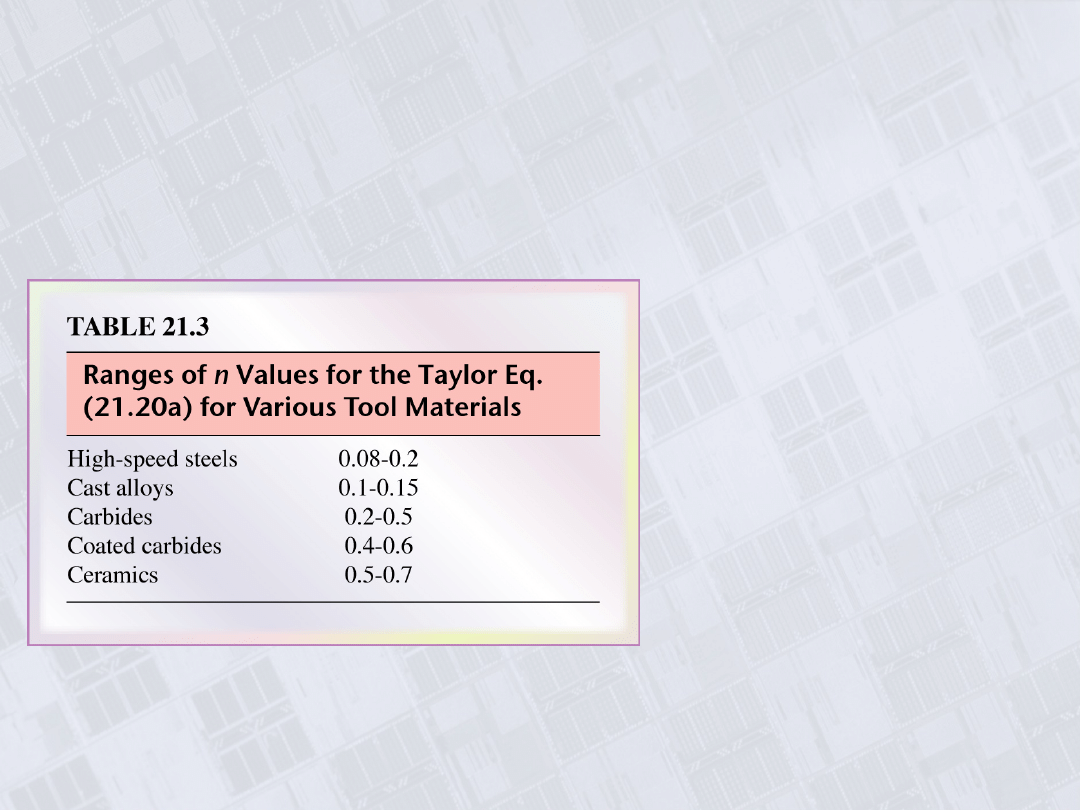
Taylor Tool Lofe Equation
€
VT
n
=C
VT
n
d
x
f
y
=C
Taylor Equation:
Manufacturing, Engineering & Technology, Fifth Edition, by Serope Kalpakjian and Steven R. Schmid.
ISBN 0-13-148965-8. © 2006 Pearson Education, Inc., Upper Saddle River, NJ. All rights reserved.
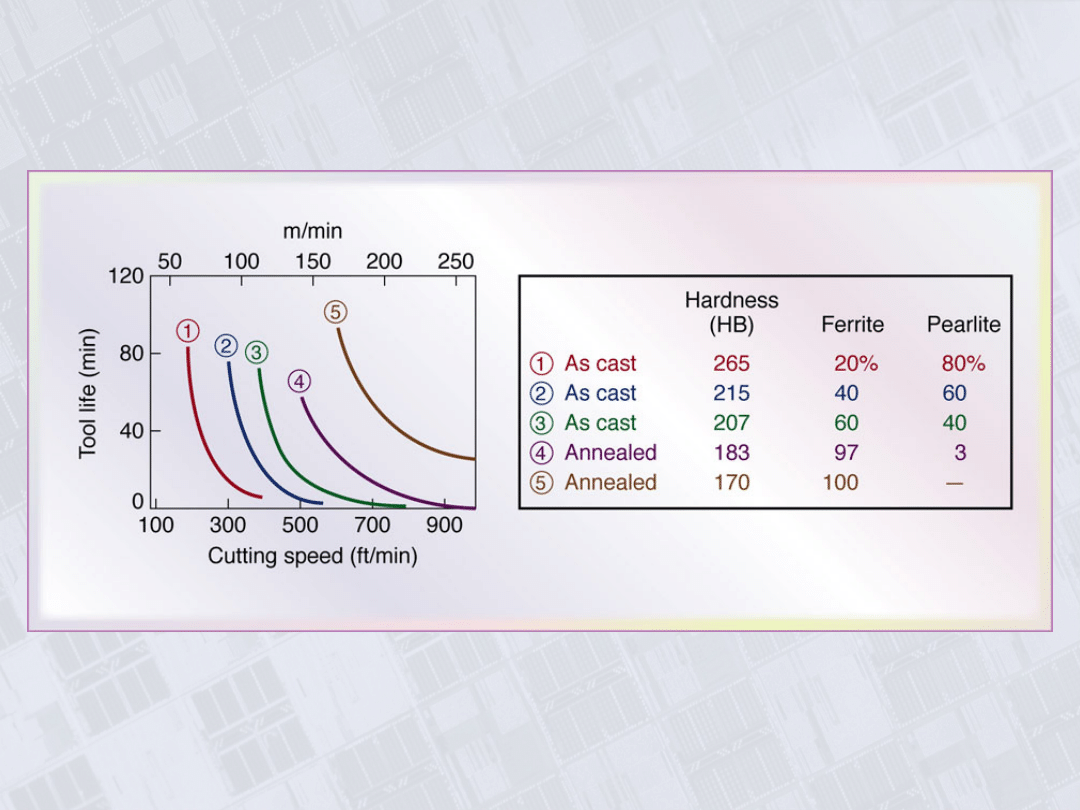
Effect of Workpiece Hardness and
Microstructure on Tool Life
Figure 21.16 Effect of workpiece hardness and microstructure on tool life in turning
ductile cast iron. Note the rapid decrease in tool life (approaching zero) as the
cutting speed increases. Tool materials have been developed that resist high
temperatures, such as carbides, ceramics, and cubic boron nitride, as will be
described in Chapter 22.
Manufacturing, Engineering & Technology, Fifth Edition, by Serope Kalpakjian and Steven R. Schmid.
ISBN 0-13-148965-8. © 2006 Pearson Education, Inc., Upper Saddle River, NJ. All rights reserved.
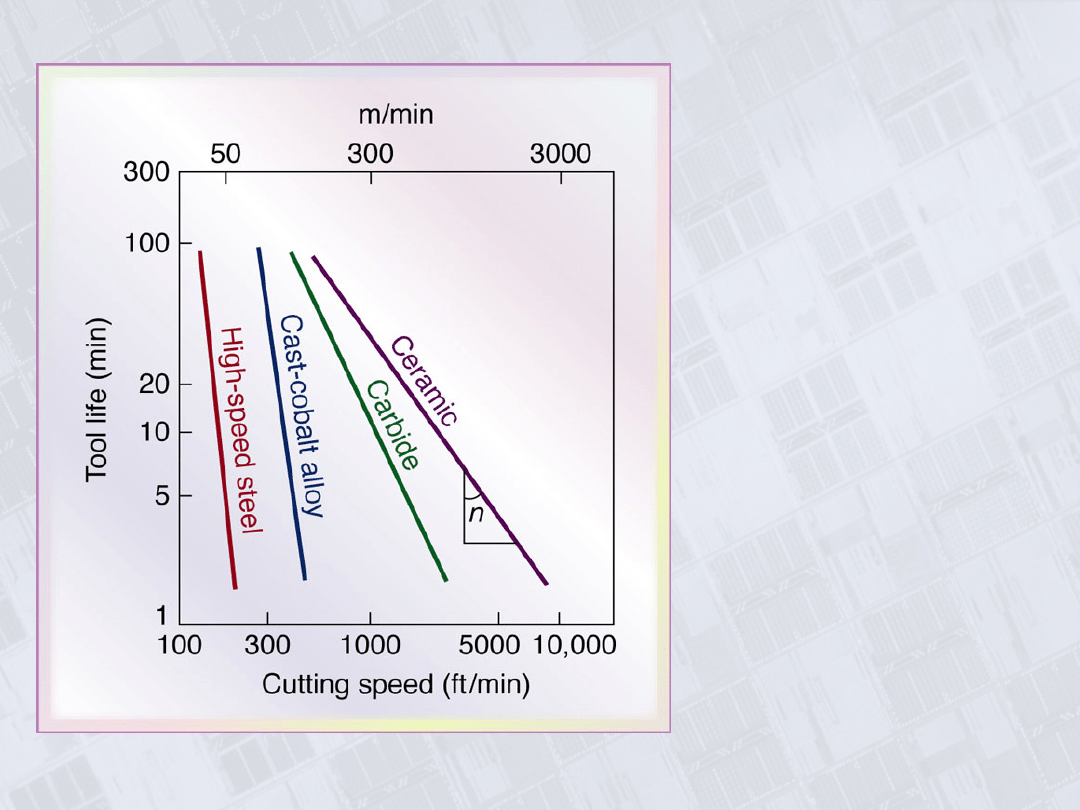
Tool-life Curves
Figure 21.17 Tool-life curves
for a variety of cutting-tool
materials. The negative
inverse of the slope of these
curves is the exponent n in
the Taylor tool-life equation
and C is the cutting speed at
T = 1 min, ranging from about
200 to 10,000 ft./min in this
figure.
Manufacturing, Engineering & Technology, Fifth Edition, by Serope Kalpakjian and Steven R. Schmid.
ISBN 0-13-148965-8. © 2006 Pearson Education, Inc., Upper Saddle River, NJ. All rights reserved.
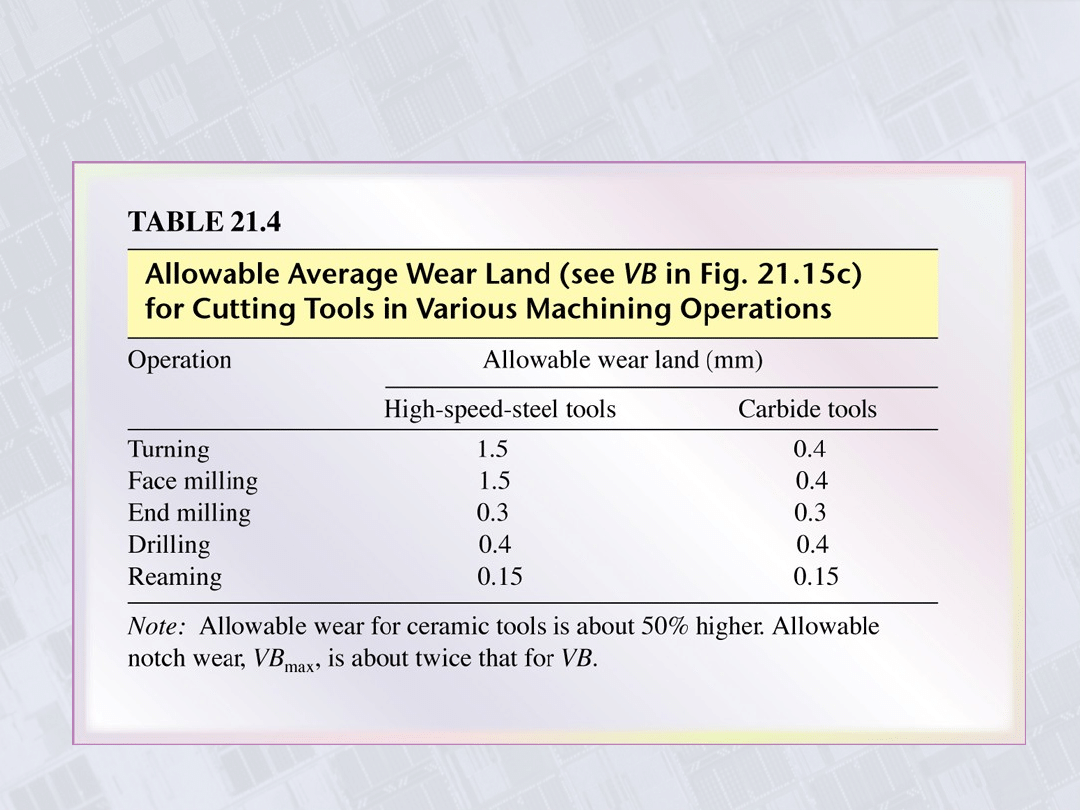
Allowable Average Wear Land for Cutting
Tools
Manufacturing, Engineering & Technology, Fifth Edition, by Serope Kalpakjian and Steven R. Schmid.
ISBN 0-13-148965-8. © 2006 Pearson Education, Inc., Upper Saddle River, NJ. All rights reserved.
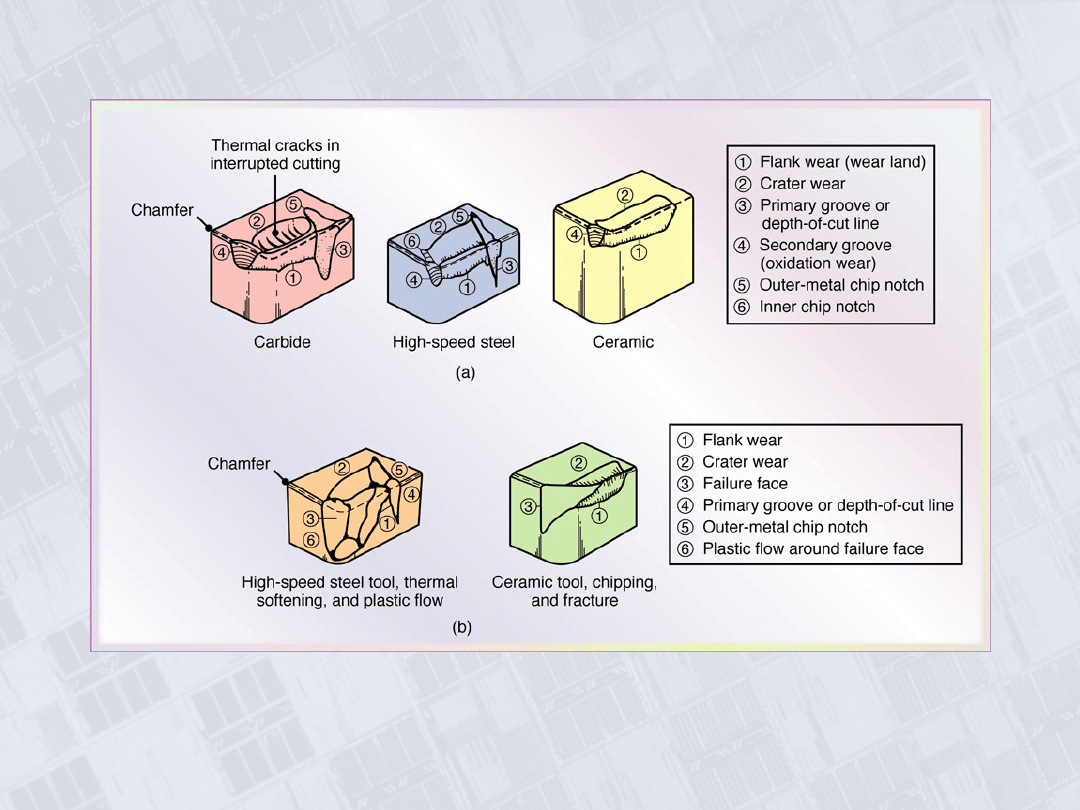
Types of Wear seen in Cutting Tools
Figure 21.28 (a) Schematic illustration of types of wear observed on various
cutting tools. (b) Schematic illustrations of catastrophic tool failures. A wide
range of parameters influence these wear and failure patterns. Source:
Courtesy of V. C. Venkatesh.
Manufacturing, Engineering & Technology, Fifth Edition, by Serope Kalpakjian and Steven R. Schmid.
ISBN 0-13-148965-8. © 2006 Pearson Education, Inc., Upper Saddle River, NJ. All rights reserved.
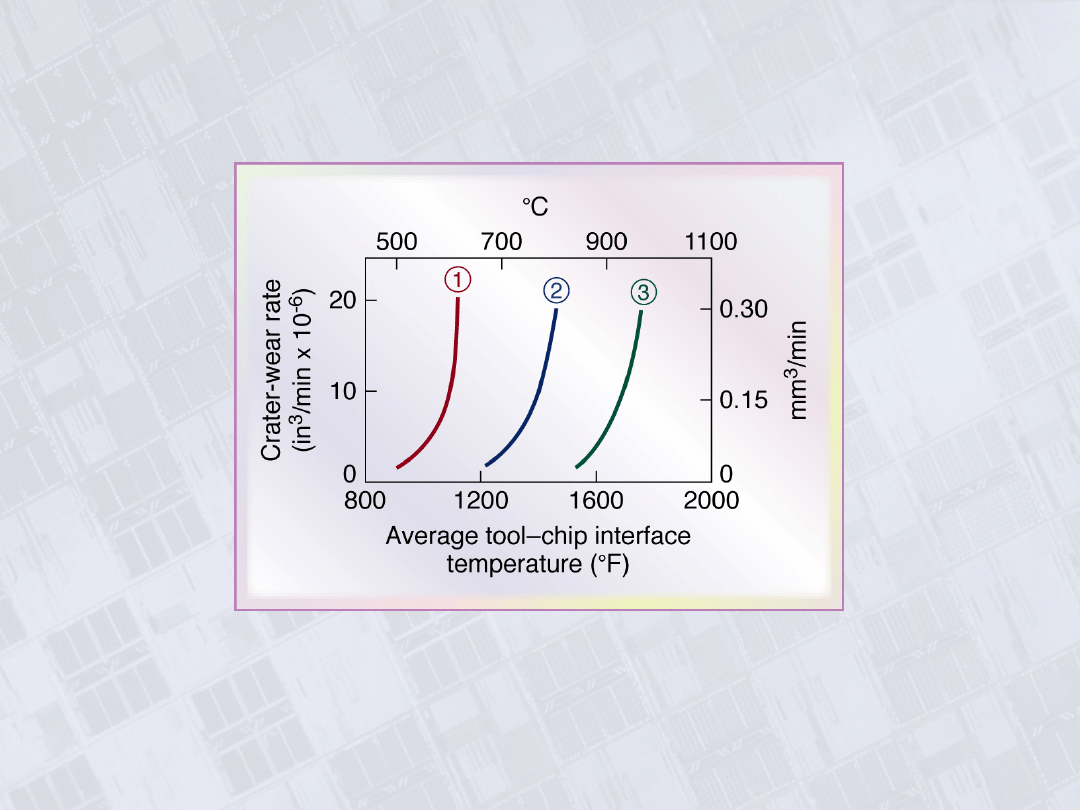
Relationship between Crater-Wear Rate and
Average Tool-Chip Interface Temperature
Figure 21.19 Relationship between crater-wear rate and average tool-chip
interface temperature: 1) High-speed steel, 2) C-1 carbide, and 3) C-5 carbide
(see Table 22.4). Note how rapidly crater-wear rate increases with an
incremental increase in temperature. Source: After B. T Chao and K. J Trigger.
Manufacturing, Engineering & Technology, Fifth Edition, by Serope Kalpakjian and Steven R. Schmid.
ISBN 0-13-148965-8. © 2006 Pearson Education, Inc., Upper Saddle River, NJ. All rights reserved.
Cutting Tool Interface and Chip
Figure 21.20 Interface of a
cutting tool (right) and chip
(left) in machining plain-
carbon steel. The
discoloration of the tool
indicates the presence of high
temperatures. Compare this
figure with the temperature
profiles shown in Fig. 21.12.
Source: Courtesy of P. K.
Wright.
Manufacturing, Engineering & Technology, Fifth Edition, by Serope Kalpakjian and Steven R. Schmid.
ISBN 0-13-148965-8. © 2006 Pearson Education, Inc., Upper Saddle River, NJ. All rights reserved.
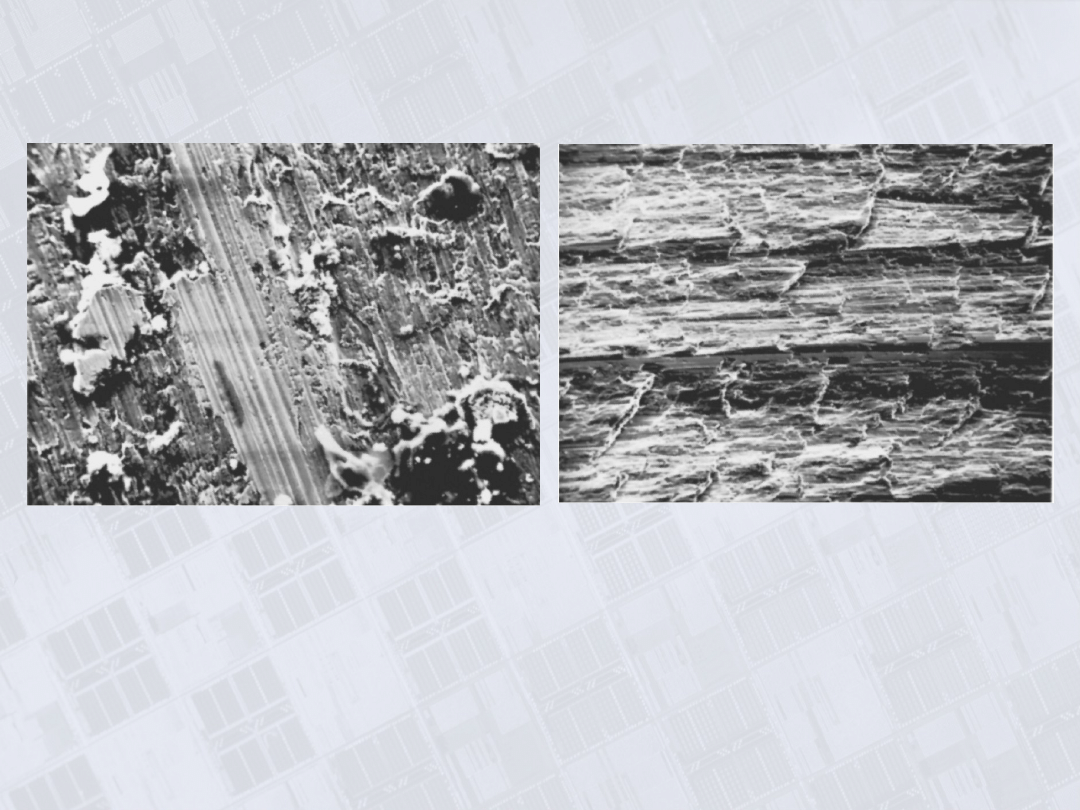
Machined Surfaces Produced on Steel
(a
)
(b)
Figure 21.21 Machined surfaces produced on steel (highly magnified),
as observed with a scanning electron microscope: (a) turned surface
and (b) surface produced by shaping. Source: Courtesy of J. T. Black
and S. Ramalingam.
Manufacturing, Engineering & Technology, Fifth Edition, by Serope Kalpakjian and Steven R. Schmid.
ISBN 0-13-148965-8. © 2006 Pearson Education, Inc., Upper Saddle River, NJ. All rights reserved.
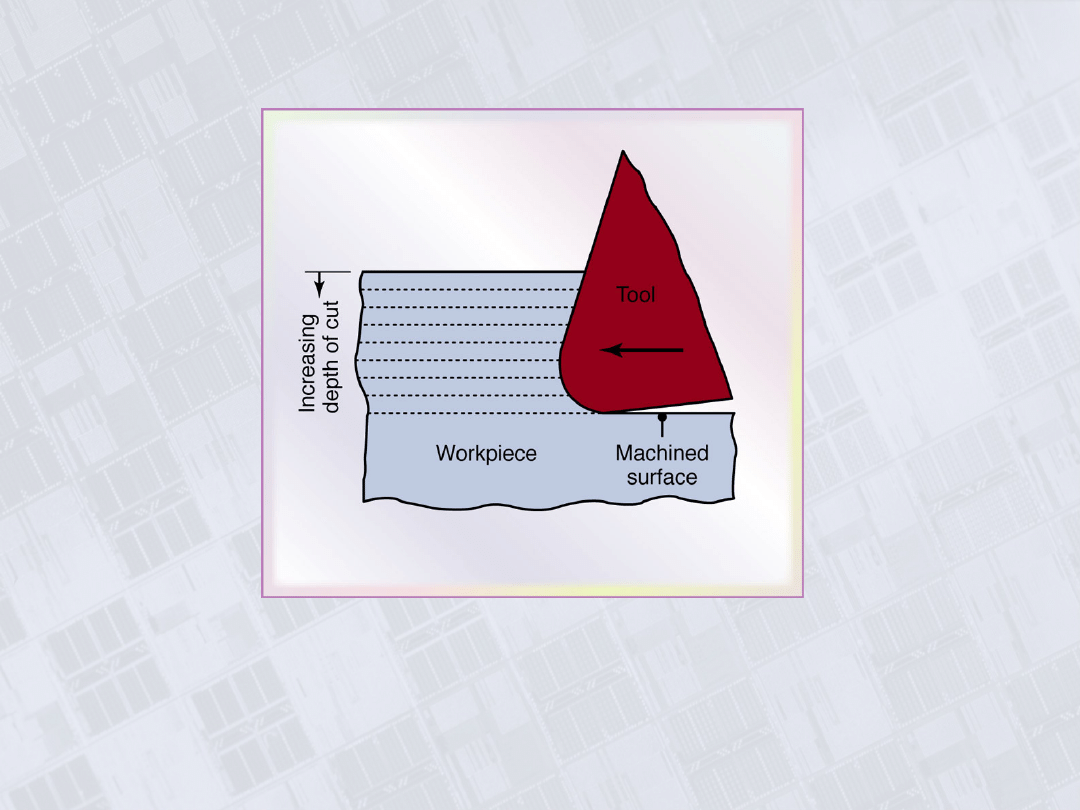
Dull Tool in Orthogonal Machining
Figure 21.22 Schematic illustration of a dull tool with respect to the depth of
cut in orthogonal machining (exaggerated). Note that the tool has a positive
rake angle, but as the depth of cut decreases, the rake angle effectively can
become negative. The tool then simply rides over the workpiece (without
cutting) and burnishes its surface; this action raises the workpiece
temperature and causes surface residual stresses.
Manufacturing, Engineering & Technology, Fifth Edition, by Serope Kalpakjian and Steven R. Schmid.
ISBN 0-13-148965-8. © 2006 Pearson Education, Inc., Upper Saddle River, NJ. All rights reserved.
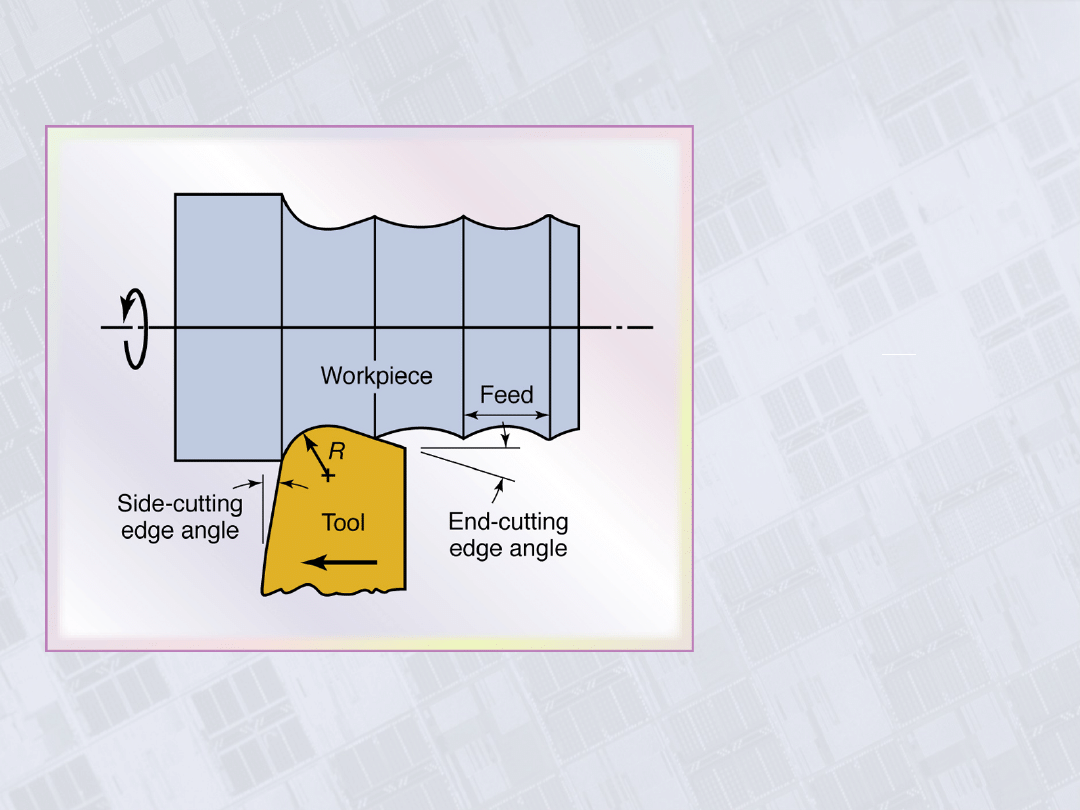
Feed Marks on a Turned Surface
Figure 21.23 Schematic illustration of
feed marks on a surface being turned
(exaggerated).
€
R
a
=
f
2
8R
where
f =feed
R=tool- nose radius
Surface roughness:
Document Outline
- Chapter 21
- Common Machining Operations
- The Turning Operation
- Two-Dimensional Cutting Process
- Factors Influencing Machining Operations
- Mechanics of Cutting
- Chip Formation by Shearing
- Chips Produced in Orthogonal Metal Cutting
- Built-up Edge
- Chip Breaker
- Chips Produced in Turning
- Cutting with an Oblique Tool
- Right-hand Cutting Tool and Insert
- Cutting Forces
- Cutting Forces and Power
- Range of Energy Requirements in Cutting Operations
- Temperatures in Cutting Zone
- Temperatures Developed in Turning 52100 Steel
- Proportion of Heat from Cutting Transferred as a Function of Cutting Speed
- Wear Patterns on Tools
- Taylor Tool Lofe Equation
- Effect of Workpiece Hardness and Microstructure on Tool Life
- Tool-life Curves
- Allowable Average Wear Land for Cutting Tools
- Types of Wear seen in Cutting Tools
- Relationship between Crater-Wear Rate and Average Tool-Chip Interface Temperature
- Cutting Tool Interface and Chip
- Machined Surfaces Produced on Steel
- Dull Tool in Orthogonal Machining
- Feed Marks on a Turned Surface
Wyszukiwarka
Podobne podstrony:
p 43 ZASADY PROJEKTOWANIA I KSZTAŁTOWANIA FUNDAMENTÓW POD MASZYNY
Rodzaje fundamentów
Fundamentals
RF04 T07 Analiza fundamentalna
21 Fundamnety przyklady z praktyki
Fundamenty bezpośrednie
55 06 TOB Fundametowanie II
Mathcad fundamenty ramowe
Ch21 pg655 690
A2 Fundamenty
fundamentowanie1
Building A Wind Machine
FUNDAMENTOWANIE 2 b materia
Próbne Obciążenie Gruntu, BUDOWNICTWO, Fundamenty, Fundamentowanie i Mechanika Gruntów, fund, fundam
więcej podobnych podstron