MEMS Sensors and Actuators Laboratory (MSAL)
Electrostatic Micromotors Supported on
Electrostatic Micromotors Supported on
Microball Bearings
Microball Bearings
Nima Ghalichechian, Alireza Modafe, Mustafa Beyaz, Nick Ganing, and Reza Ghodssi
Dept. of Electrical and Computer Engineering, Institute for Systems Research, University of Maryland – College Park, MD 20742, USA
INTRODUCTION
SUMMARY AND FUTURE WORK
•
The
dynamic characterization
of a 6-phase, bottom-drive, linear, variable-capacitance
micromotor (B-LVCM) supported on microball bearing was presented.
•
The motion of the micromotor was captured using a high-speed video camera.
• Instantaneous velocity (11 mm/s), acceleration (1.9 mm/s
2
), and net force (0.19 mN) (all
in amplitude) were measured.
•
The motor was modeled with a mass-dashpot-spring system and
dashpot coefficient
was
measured to be b=6.25×10
-4
Kg/s.
• Future work:
Design, fabrication, and characterization of a
rotary
variable-
capacitance micromotor supported on microball bearings.
CHARACTERIZATION
DESIGN AND FABRICATION
CHARACTERIZATION
OBJECTIVE:
To characterize the dynamic behavior of a bottom-drive, linear,
variable-capacitance (B-LVCM) micromotor supported on microball bearings.
•
Microball bearing technology in silicon provides a reliable support mechanism for the
rotor of micromotors and microgenerators.
•
The primary application of the B-LVCM is long-range, high-speed, linear micro-
positioning.
•
Mechanical properties of roller bearing can be studied by characterization of the B-
LVCM.
•
B-LVCM is a platform for developing a rotary micromotor.
Time (s)
0.00
0.02
0.04
0.06
0.08
0.10
0.12
0.14
Di
s
p
la
c
e
m
e
n
t
(m
m
)
-0.05
0.00
0.05
0.10
0.15
0.20
0.25
0.30
Time (s)
0.00
0.02
0.04
0.06
0.08
0.10
0.12
0.14
D
is
p
la
c
e
m
e
n
t
(m
m
)
8.75
8.80
8.85
8.90
8.95
9.00
9.05
9.10
Time (s)
0.04
0.06
0.08
0.10
0.12
0.14
D
is
p
la
c
e
m
e
n
t
(m
m
)
8.76
8.78
8.80
8.82
8.84
8.86
8.88
Time (s)
0.04
0.06
0.08
0.10
0.12
0.14
V
e
lo
c
it
y
(
m
m
/s
)
-8
-6
-4
-2
0
2
4
6
8
10
12
Time (s)
0.04
0.06
0.08
0.10
0.12
0.14
A
c
c
e
le
ra
ti
o
n
(
m
m
/S
2
)
-2000
-1000
0
1000
2000
N
e
t
F
o
rc
e
(
m
N
)
Schematic 3D view of the B-LVCM.
Optical micrograph (top-view)
of the 6-phase stator.
Optical micrograph
(top-view) of the slider.
440C stainless
steel
Microball material
290
Trench width, µm
284.5
Microball diameter, µm
26-34
Air gap, µm
84/36
Electrode/pole number
120/180
Electrode/pole pitch, µm
90/90
Electrode/pole width, µm
Value
Parameter
•
The micromotor comprises three major components:
stator, slider, and microballs
.
•
Bottom-drive
design results in increased active area
and increased motor force.
•
Six-phase design results in small force ripples.
•
Microball bearing
design provides a mechanical
support for maintaining a uniform air gap.
•
A thick film of
Benzocyclobutene (BCB)
low-k polymer
(k=2.65) was used as an insulating layer to
1.
Reduce the parasitic capacitances and increase the
motor efficiency.
2.
Reduce wafer curvature (compared to SiO
2
) due to
low residual stress.
•
The stator fabrication process comprises of three BCB
deposition, two metal deposition steps, and a deep
reactive ion etching (DRIE) step.
Micromotor geometry specifications.
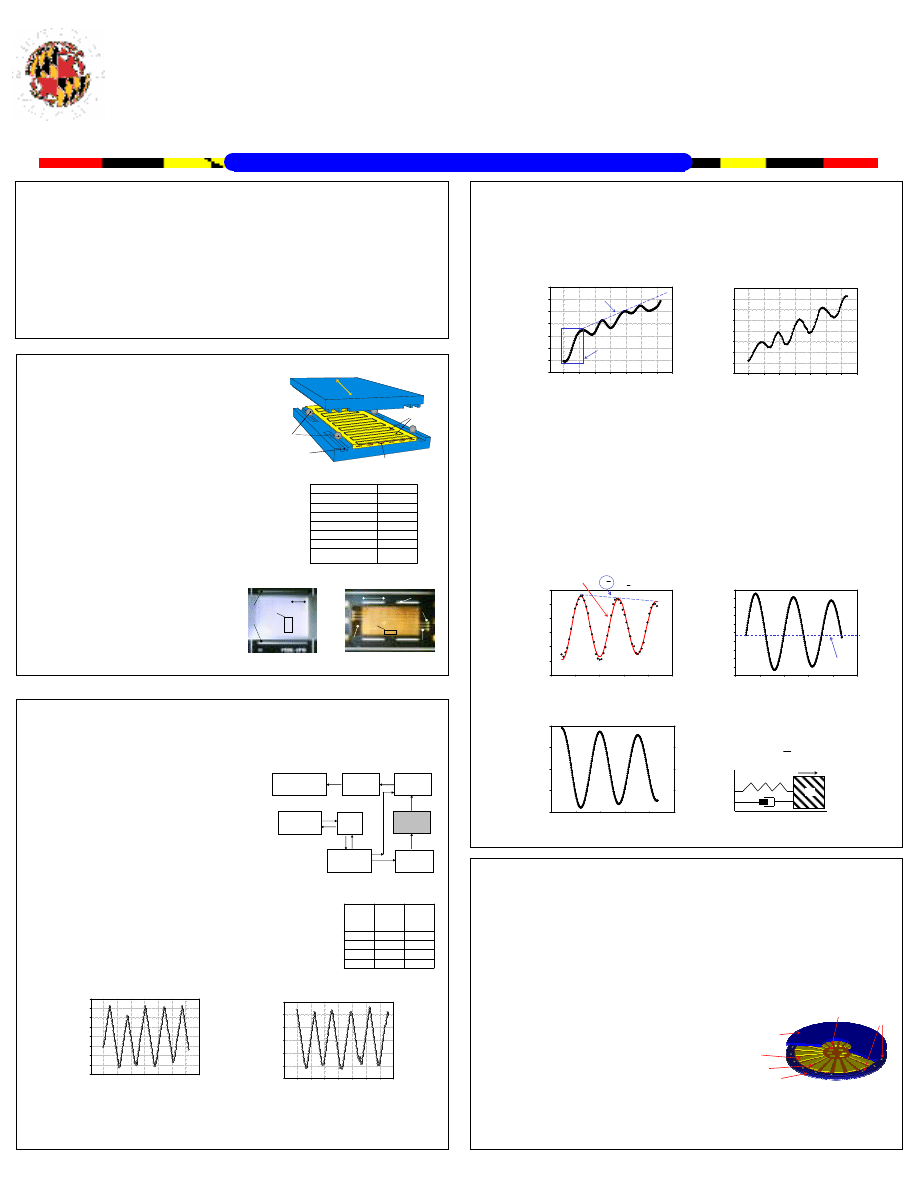
(C) Transient Response Measurement at 635-1000 fps
•
Transient response of the micromotor to 120-V square pulses was measured using
high-speed camera system.
•
Micromotor has a second-order step response modeled as a damped sinusoidal
function.
Startup of the micromotor from rest
position captured at 1000 fps.
Position of the slider, X(t), in 130-ms
time window captured at 635 fps.
Local slider displacement, X(t)-V
avg
×t,
showing damped sinusoidal transient
response captured at 635 fps.
Instantaneous velocity of the slider.
Instantaneous acceleration and the net
force of the slider.
Microballs
Electrodes
Motion
Stator
Slider
Microball Housing
Interconnect
3945
µ
µµ
µm
BCB Island
Test pad
Trench
Interconnect
Electrodes
Trenches
Poles
1600
µ
µµ
µm
Phase A:
V(t=0
−
)= 0 V
V(t=0
+
)= 120 V
Region 2: V
avg
=1.9 mm/s
Region 1: Acceleration
from rest position
Average Velocity
+
+
=
′
−
ϕ
β
π
α
t
e
X
X
t
m
b
2
sin
2
0
•
Velocity
and
acceleration
of the slider were calculated from the first and second
derivatives of the displacement data, respectively.
•
Instantaneous
net force
on the 0.1-gram slider was calculated to be 0.19 mN in
amplitude.
•
The micromotor was modeled as a
mass-dashpot-spring
system where m is the mass of
the slider, b is the dashpot coefficient representing the friction of microballs and silicon
housing, and k is the spring constant of the electrode-pole variable capacitance.
•
The differential equation describing such a system is given by
•
Dashpot coefficient was found to be b=6.25×10
-4
Kg/s (at V=120 V and f
e
=10 Hz).
Schematic 3D view of the rotary micromotor
X
k
b
m
Mass-dashpot-spring model for the
B-LVCM.
R
2
=0.9999
)
1
(
0
=
+
+
kx
x
b
x
m
&
&
&
AKNOWLEDEMENTS
•
This research was funded by Army Research Office through MURI Program under Grant No. ARMY-
W911NF0410176, with Dr. Tom Doligalski as the technical monitor, the Army Research Lab under Grant
No. CA#W911NF-05-2-0026, and the National Science Foundation under Grant No. ECS-0224361. The
authors would like to thank Nitta Hass Company, Japan for providing the CMP supplies.
•
Advantages of the proposed design
to other rotary micromotors are:
1.
microball bearings support: reliable
2.
BCB electrical isolation: highly efficient
3.
Bottom-drive design: large active area and torque
4.
Wide variety of applications
Dynamic characterization of the 6-phase B-LVCM is performed to obtain
instantaneous velocity, acceleration, net force, and friction coefficient from the
displacement measurement.
(a) Test Setup
•
The micromotor test station comprises the
following units
•
Six-channel, high-voltage actuation
•
Low noise, monochromic,
high-speed video
camera
: 1000 frames-per-second (fps)
•
Image processing and tracking
PC and Proanalyst
TM
Tracking Software
Record /
Playback
High-speed
Camera
LabVEIW
Interface
PC
Micromotor
NI-6722 DAQ
High-Voltage
Amplifier
T
ri
g
g
er
Time (s)
0
1
2
3
4
5
6
7
D
is
p
la
c
e
m
e
n
t
(m
m
)
-0.8
-0.6
-0.4
-0.2
0.0
0.2
0.4
0.6
0.8
Time (s)
0
1
2
3
4
5
6
7
D
is
p
la
c
e
m
e
n
t
(m
m
)
-1.5
-1.0
-0.5
0.0
0.5
1.0
1.5
7.21-11.10
14.40
80
7.37±0.12
7.20
40
3.98±0.02
3.60
20
1.94±0.02
1.80
10
Measured
average
velocity
(mm/s)
Predicted
average
velocity
(mm/s)
Excitation
frequency
(Hz)
Block diagram of the micromotor test
station.
(b) Displacement Measurement at 30 fps
•
Position of the slider is measured versus time.
•
The average velocity is measured from the slope of the graphs.
•
The predicted average velocity of the slider is given by
where W is the width of the electrode and f
e
is the frequency of
the excitation voltage.
Displacement of the slider when excited by 120V, six-phase, square pulses
Comparison of predicted and
measured average velocity
•
The results show a good
agreement
between the
predicted
and
measured
values for the
average velocity for f
e
≤ 60Hz.
•
The slider fabrication process comprises a
DRIE step for fabricating poles and
trenches.
e
avg
Wf
V
2
=
f
e
=10 Hz
f
e
=20 Hz
0
:
=
+
+
kx
x
b
x
m
DE
&
&
&
Rotor
Stator trench
Microballs
Electrode
Test pad
BCB Island
( )
(
)
φ
ω +
=
−
t
Sin
C
e
t
x
Solution
d
t
m
b
2
:
Wyszukiwarka
Podobne podstrony:
Niemyjska et al 2011 id 319083 Nieznany
2009 Popovic et al JBid 26733 Nieznany (2)
Kolos Nano id 242184 Nieznany
Pomiar malych rezystancji za po Nieznany
003 Warunki techniczne jakim po Nieznany
Review Santer et al 2008
Arakawa et al 2011 Protein Science
Byrnes et al (eds) Educating for Advanced Foreign Language Capacities
instrukcja bhp przy obsludze po Nieznany (3)
b kunat rozwijanie tworczego po Nieznany
Huang et al 2009 Journal of Polymer Science Part A Polymer Chemistry
Mantak Chia et al The Multi Orgasmic Couple (37 pages)
1 Cele i zasady Wspolnotowej Po Nieznany (2)
5 Biliszczuk et al
notatek pl w, Hydrogeologia, Po Nieznany
więcej podobnych podstron