
1
PD/P8-20
Cyclic Stress-Strain Curve for Low Cycle Fatigue Design and
Development of Small Specimen Technology
A. Nishimura
1
, S. Nogami
2
, E. Wakai
3
1
National Institute for Fusion Science (NIFS), Toki, Japan
2
Tohoku University, Sendai, Japan
3
Japan Atomic Energy Agency (JAEA), Tokai, Japan
E-mail: nishi-a@nifs.ac.jp
Abstract. A blanket system in DEMO requires a low cycle fatigue design because higher inner pressure will act
on a structural wall. An importance of cyclic stress-strain curve is investigated and necessity reason for a precise
deformation measurement is discussed. Since a small specimen technique is necessary to investigate neutron
irradiation effect, it is desired to establish a test procedure to obtain the stress-strain curve with small specimens.
To do this, a new test procedure with nanometer scale resolution was developed and some data were obtained.
1. Introduction
A prototype fusion reactor, which is called DEMO, will perform Deuterium (D) - Tritium (T)
experiments and generate a lot of 14 MeV neutrons. It is expected that the total amount of
neutrons would be ten times or hundred times larger than ITER. To change the kinetic energy
of 14 MeV neutrons to the thermal energy, a blanket system will be installed. The nuclear
heat in the blanket will be taken out by a coolant which will be heat-exchanged by the
secondary loop. The blanket is a kind of a heat generator and a key component for the neutron
shielding at the same time. By using lithium or lithium oxide as the coolant, tritium breeding
will be performed. Also, by putting beryllium in the blanket, neutron will be multiplied. As
the heat generation in the blanket is huge, the very rapid coolant circulation must be
established. To realize the fast flowing, the pressurized coolant will be put in the blanket and
it would cause the blanket swollen. Some local stresses in the blanket will exceed the yield
stress and the high stress will be repeated during the reactor operation. Since the repeated
stress level would be high, the low cycle fatigue design would be required.
The low cycle fatigue design needs the fatigue life data which is a fatigue life diagram
between a strain range and a fatigue life. A round bar specimen with a certain length of a
parallel part is used for the low cycle fatigue test because the stress and strain conditions are
uniform in the parallel part. However, an hour glass specimen is also used for the fatigue test.
This specimen has a narrow cross section and stress concentration occurs at the minimum
cross section. Since the fracture occurs around at the minimum cross section area and a
buckling is avoided, the hour glass specimen is preferred in both low cycle and high cycle
fatigue tests. However, it is known that the fatigue data of the hour glass specimen does not
meet with the data of the round bar specimen. The consideration on this issue will be carried
out later.
2
PD/P8-20
To investigate the effect of neutron irradiation on the fatigue resistance, a small specimen
technique has been developed, for the small specimen reduces the activated waste. To realize
the same performance as the standard specimen in the small specimen technique, the high
resolution measurement with nanometer scale accuracy of the deformation must be achieved.
Therefore, a new test device for the small specimen has been designed and assembled using a
laser displacement gage system.
In this study, the low cycle fatigue behavior will be presented and the cyclic stress-strain
curve will be discussed. The importance of the precise deformation measurement will be
emphasized. Then a new test device with laser displacement gages will be introduced which
has been developed to investigate the fatigue life of the small specimen and some data
obtained with the new test system will be shown.
2. Low Cycle Fatigue Behavior and Cyclic Stress-Strain Curve
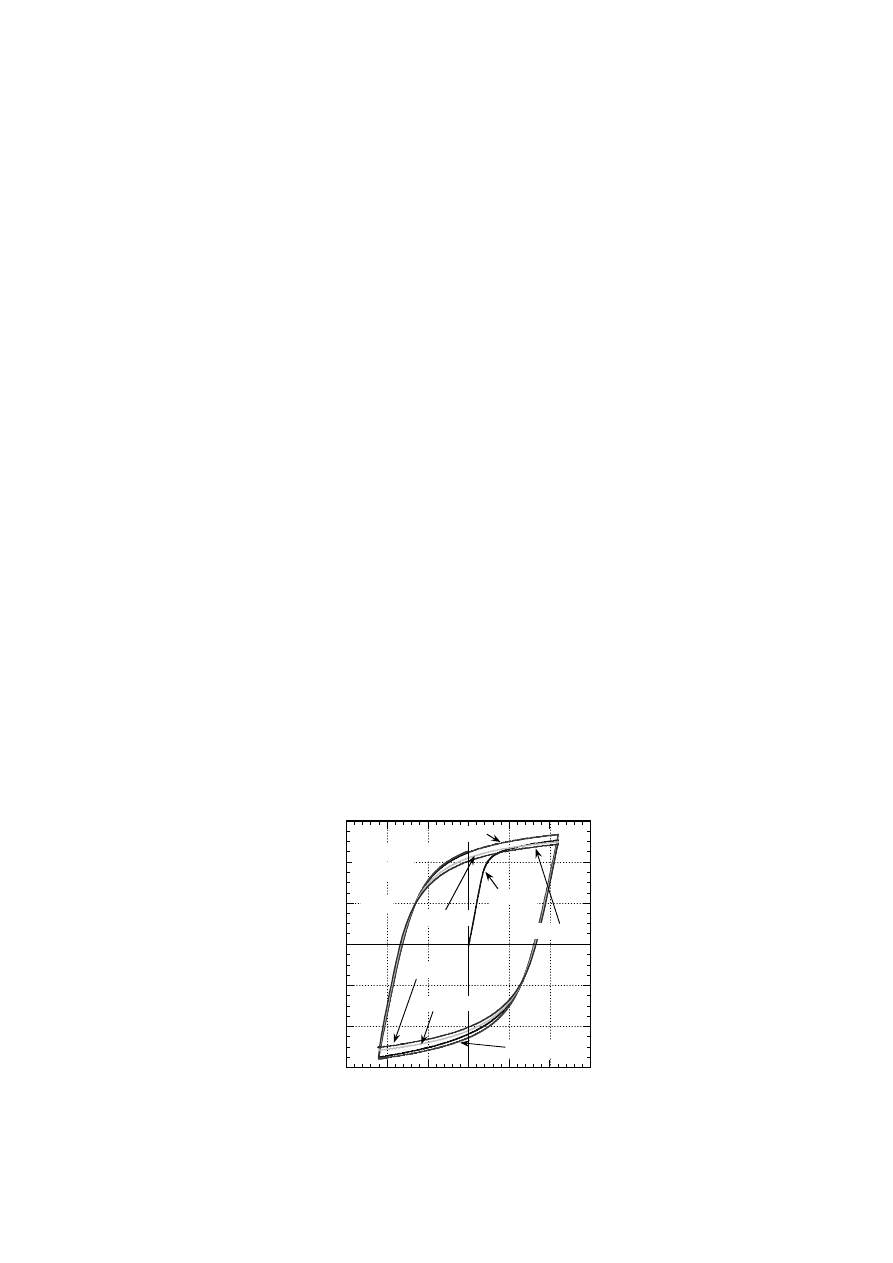
During the fatigue process in the low cycle fatigue, the stress-strain hysteresis curves change
gradually. Figure 1 shows typical stress-strain hysteresis curves of low activation
ferritic/martensitic steel, JLF-1 [1]. The fatigue test was carried out at room temperature and
non-irradiated standard size specimens with 8 mm diameter and 18 mm parallel part length
were used. The deformation of the gage length was measured by displacement gage with
strain gages attached. Since the maximum and the minimum strains were controlled, the peak
stresses at positive and negative loads were changeable. In the case of Fig. 1, the maximum
and the minimum strains of +/- 1.1% were controlled and total strain range (
t
) was kept to
be 2.2%. It is clear that the peak stress increased at the initial stage and decreased after that
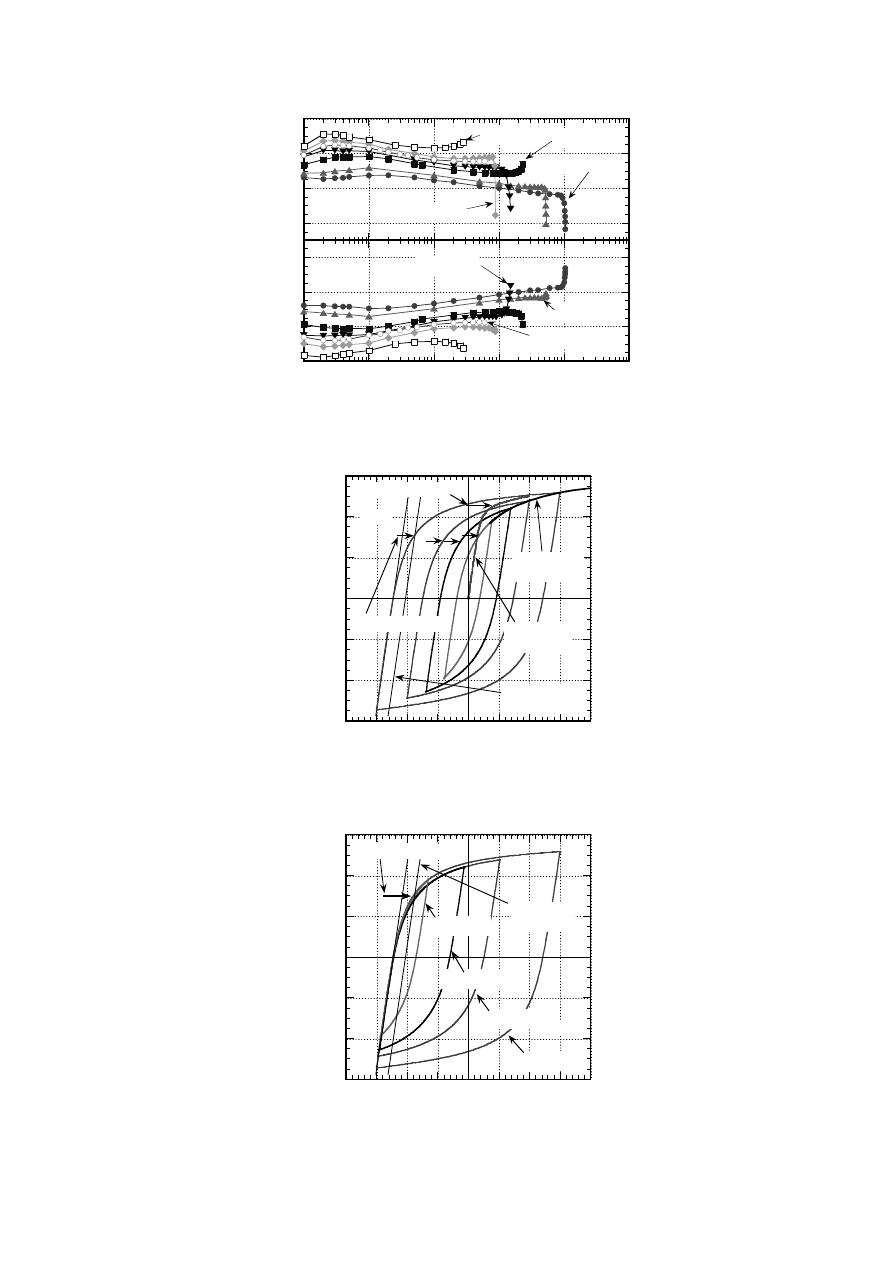
gradually. The changes in the peak stresses during the fatigue in the different specimens are
shown in Fig. 2. The cyclic hardening is observed in the region of less than 10 cycles and
cyclic softening occurs gradually. It is not easy to determine the representative stress-strain
hysteresis curve in each test condition but the hysteresis curve at about half of the fatigue life
is taken up as the representative in this study. As it is seen in Fig. 2, the peak stresses already
dropped at the half of fatigue life.
The representative stress-strain hysteresis curves are collected in Fig. 3 together with the
static stress-strain curve which was obtained under monotonic loading. By connecting the
peak stresses at each hysteresis curve, another stress-strain curve was obtained. This curve is
-600
-400
-200
0
200
400
600
-1.5
-1
-0.5
0
0.5
1
1.5
S
tre
ss
(M
P
a)
Strain (%)
1st cycle
50th cycle
N
f
: 882 cycles
2nd cycle
500th cycle
t
= 2.2 %
50th cycle
2nd cycle
500th cycle
JLF-1
FIG. 1. Stress-strain hysteresis curves of JLF-1 under axial strain controlled low cycle fatigue.
3
PD/P8-20
300
400
500
600
Peak s
tre
ss
(M
P
a)
t
= 0.8 %
t
= 1.4 %
t
= 2.2 %
t
= 3.0 %
-600
-500
-400
-300
10
0
10
1
10
2
10
3
10
4
10
5
Number of cycles (cycles)
t
= 2.0 %
t
= 1.0 %
t
= 1.6 %
FIG. 2. Change in peak stresses during fatigue process.
-600
-400
-200
0
200
400
600
-2
-1.5
-1
-0.5
0
0.5
1
1.5
2
Str
ess (M
P
a)
Strain (%)
Static stress-
strain curve
Cyclic stress-
strain curve
Cyclic yield stress
Static yield stress
0.2% strain
off-set line
JLF-1
FIG. 3. Collection of representative hysteresis curves and cyclic stress-strain curve.
-600
-400
-200
0
200
400
600
-2
-1.5
-1
-0.5
0
0.5
1
1.5
2
St
re
ss
(M
P
a)
Strain (%)
t
= 0.8 %
t
= 1.4 %
t
= 2.0 %
t
= 3.0 %
0.2% strain
off-set line
Cyclic yield stress
JLF-1
FIG. 4. Comparison of strain hardening process on representative hysteresis curves.
4
PD/P8-20
designated as the cyclic stress-strain curve which presents the cyclic stress-strain properties of
the material under a certain environment. The cyclic stress-strain relation will be applicable to
FEM analysis where the reversible yield stress must be determined. In between the elastic line
on the static stress-strain curve and the cyclic stress-strain curve, there is a space. This region
is for high cycle fatigue area and there is no clear idea how to connect. Therefore, one may
connect a point of a half of yield stress and the cyclic stress-strain curve with a smooth curve
to make one cyclic stress-strain curve.
The representative curves were shifted to the negative strain side and fit each elastic line to
the elastic line of hysteresis curve under
t
is 3.0% as shown in Fig. 4. It is noted that all
representative curves show almost same cyclic yield stress and hardening properties, and the
hysteresis curve of 3.0% of
t
will be adopted as a master hysteresis curve of the material
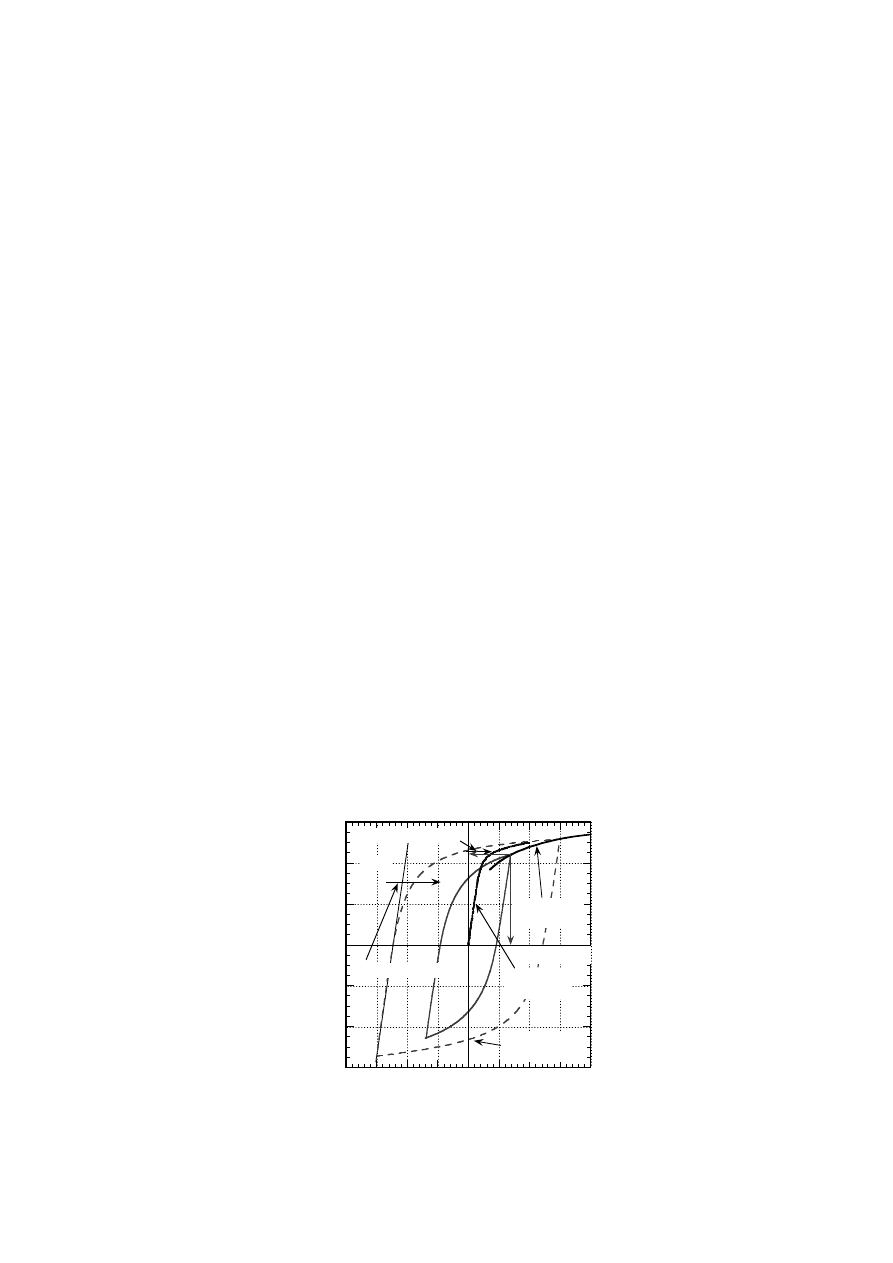
under this condition. From these results, the following design process will be recognized. As
shown in Fig. 5, when the cyclic stress-strain curve and the master hysteresis curve are given,
a certain stress-strain hysteresis curve will be able to be predicted based on a given design
strain. Since the hysteresis curve at a certain design point is predicted by this process, the low
cycle fatigue life will be calculated by Manson-Coffin’s law or Miner’s rule.
3. A New Fatigue Test Device for Small Specimen
A small specimen is preferable to investigate the low cycle fatigue properties of blanket
structural material, because the reduction of the activated material is able to be achieved.
When the same fatigue design process is supposed even in the case of the small specimens are
adopted, a precise deformation measurement must be established to ensure the adequate
accuracy for discussion on the low cycle fatigue behavior. Since a new laser displacement
gage system which has nanometer resolution came on the market recently, a new fatigue test
device with an axial strain control was fabricated for a small round bar specimen.
To measure the deformation of the gage length precisely, a clip-on type displacement gage
with strain gages is commonly used for the standard specimen that has the gage length of
about 10 mm. One micrometer must be resolved to perform the accuracy of 0.0001 strain in
case of 10 mm gage length. When the gage length is 1 mm for the small specimen, 100
nanometers must be resolved and 10 nanometers accuracy must be achieved to keep the
accuracy of 0.0001 strain.
-600
-400
-200
0
200
400
600
-2
-1.5
-1
-0.5
0
0.5
1
1.5
2
Str
ess (M
P
a)
Strain (%)
Static stress-
strain curve
Cyclic stress-
strain curve
Cyclic yield stress
Static yield stress
JLF-1
Master
hysteresis curve
FIG. 5. Prediction process of stress-strain hysteresis curve form design strain.
Design strain
5
PD/P8-20
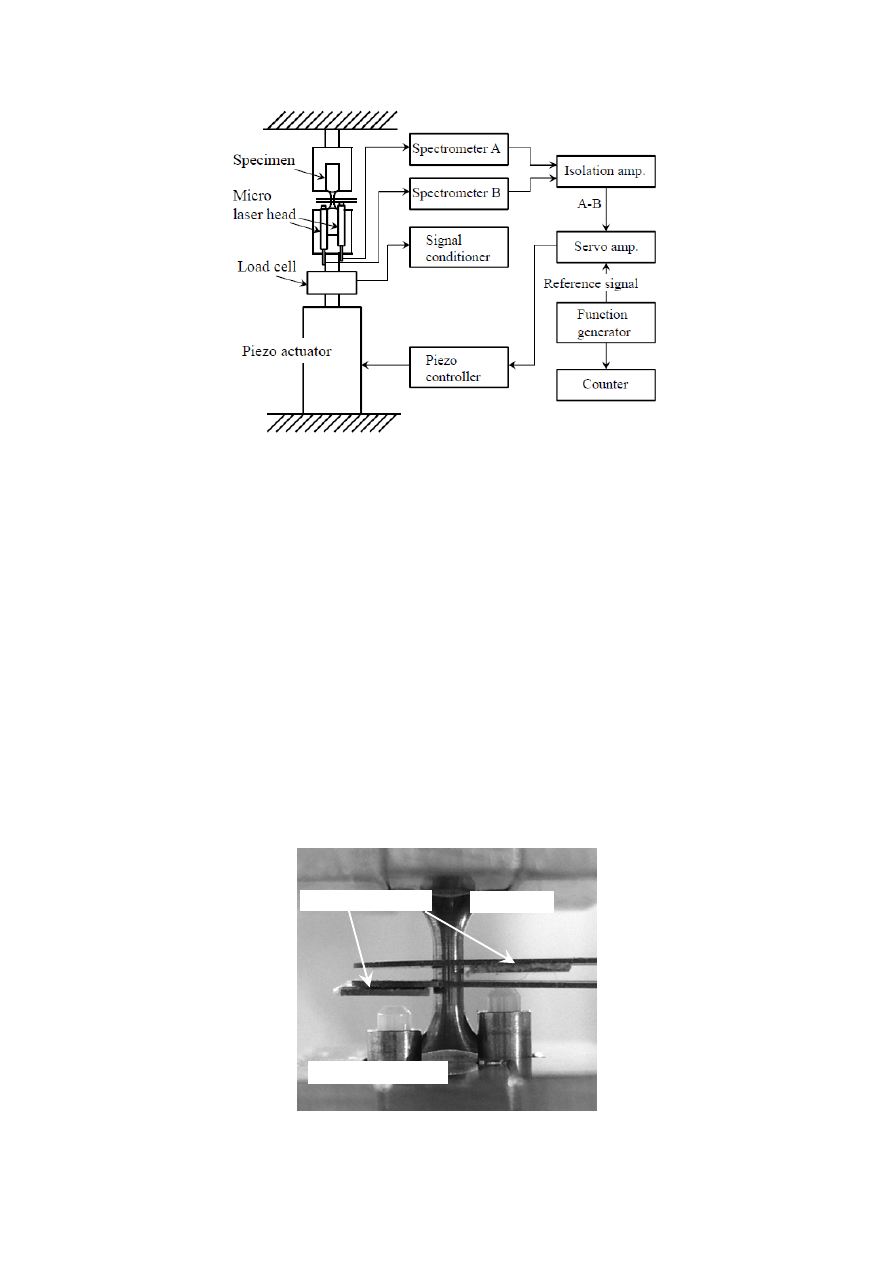
FIG. 6. Prediction process of stress-strain hysteresis curve form design strain.
To achieve such high accuracy on the small round bar specimen, a laser displacement gage
system with one nanometer resolution was installed in a new fatigue test device to measure
the axial deformation, and a Piezo actuator was adopted as a driving source to control the
deformation of the gage length. The block diagram of the new test system is shown in Fig. 6
[2]. Two sets of laser displacement gage were used to measure the distance from the fixed
point to reflecting plates (0.2 mm thick and polished) independently as shown in Fig. 7. The
two reflecting plates were fixed on the support beam (0.2 mm thick) which was pulled by a
spring to be attached on the small specimen. The distance between two reflecting plates was
adopted as a gage length. The deformation of the gage length was calculated (subtracting
distance B from distance A) and the signal was feed backed to the Piezo controller (0-150
m
in capacity) to control the deformation of the gage length. The specimen was fixed by pushing
the both ends of the specimen with rods, and the device was put on the stiff desk and covered
with an acryl case to avoid the fluctuation [2].
The control wave was sine wave, the frequency was 0.25 Hz (0.03 Hz was adopted when the
data was recorded.), strain ratio was -1, and the sampling rate for record was 10 Hz. The test
portion of the specimen is 1.1 mm diameter and the 2.0 mm long round bar which is almost
same size as S. Nogami et al reported [3]. The test material was JLF-1 [1].
FIG. 7.Set-up status of micro laser head and reflecting plats on specimen.
Micro laser head
Reflecting plate
Specimen
6
PD/P8-20
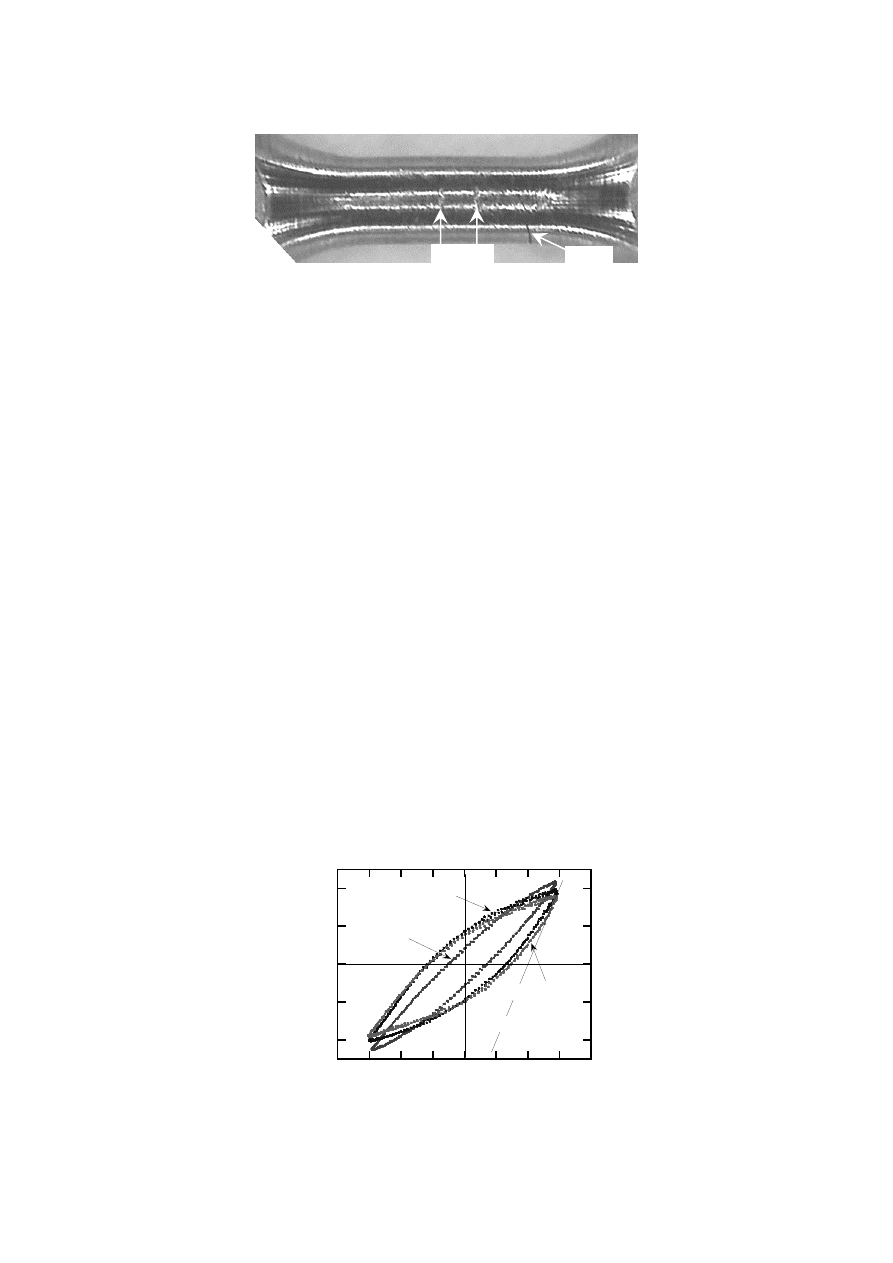
FIG. 8. Tested surface of specimen #12. N
f
; 2,808 cycles.
t
; 1.55%.
4. Test Results and Discussion
To determine the gage length, the specimen surface was investigated with microscope after
the test. As the support beam was pulled to vertical direction to the loading axis and was
attached on the small specimen as shown in Fig. 7, the traces of the edges of the support beam
were found on the specimen surface as shown in Fig. 8 (Specimen #12). The gage length was
determined by measuring the distance between the edge traces. In case of Fig. 8, the distance
(gage length) was 500
m and the crack was observed outside of the gage length (Type C).
The stress-strain hysteresis curves of Specimen #6 are shown in Fig. 9. At the initial stage of
the fatigue, the peak stresses are high and the plastic strain component is small. The changes
in peak stresses and strains at zero stress of specimen #6 during fatigue are shown in Fig. 10.
The peak stresses become smaller within around 100 cycles after the test started and the
strains at zero stress become larger. Such rapid changes were not observed in the tests with
the standard specimen [1]. Also, the hysteresis curve does not show the elastic line. Although
there is no clear evidence to explain these behaviors, it is considered that the small specimen
would be twisted and bended when the specimen was chucked to the test frame. If the
specimen would be twisted and bended, multi-axial stress condition was generated in the
parallel part resulting in increase of apparent yield stress. Under the alternative axial plastic
deformation, the torsion and bending component would be released and the axial plastic strain
component would be increased. The relaxation might occur within about 100 cycles after the
test started. The contact points of the support beam edges on the specimen might be movable
in the case that the initial twisted or bending deformation was large. This may influence the
hysteresis curves which did not show the clear elastic line. When the fatigue life is discussed,
the strain range at half of fatigue life will be useful as representative, because the period that
the rapid change in strains occurred is rather shorter than the stable period.
-400
-200
0
200
400
-0.8 -0.6 -0.4 -0.2
0
0.2 0.4 0.6 0.8
Str
ess
(M
P
a)
Strain (%)
10 th cycle
2600 th cycle
(200 GPa)
5000 th cycle
Elastic modulus
FIG. 9. Hysteresis curves of small specimen #6. N
f
; 5,065 cycles.
t
; 1.18%.
Crack
500
m
7
PD/P8-20
-400
-200
0
200
400
-0.8
-0.4
0
0.4
0.8
0
1000 2000 3000 4000 5000 6000
Stre
ss (M
P
a)
S
tra
in
(%
)
Number of cycles
Max. stress
Min. stress
Max. strain
Min. strain
Strain at 0 stress (large)
Strain at 0 stress (small)
FIG. 10. Change in peak stresses and strains of specimen #6. N
f
; 5,065 cycles.
t
; 1.18%.
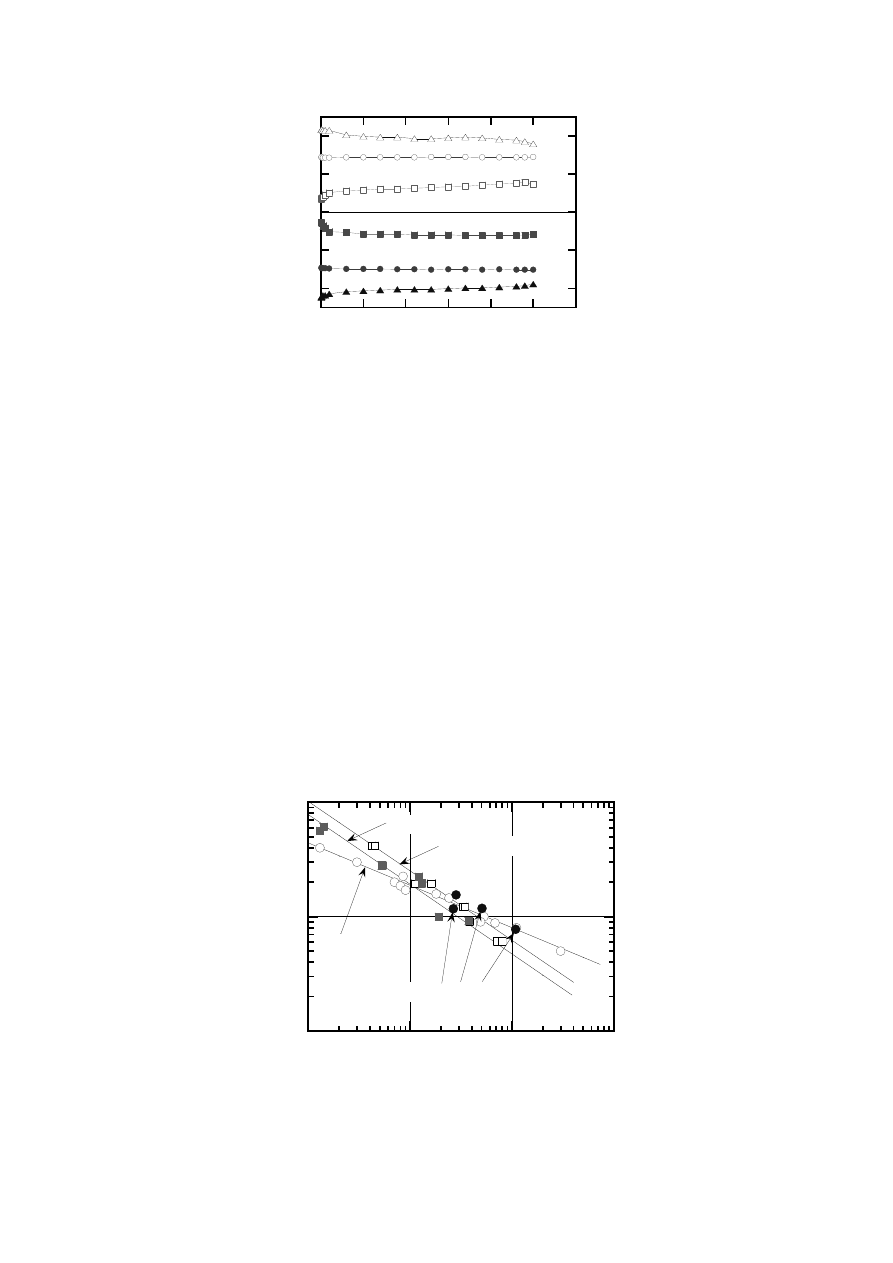
The fatigue life diagram between the total strain range and the fatigue life is shown in Fig. 11
[1,5]. In the figure, there are four set of the JLF-1 fatigue life data, i.e., the data sets of the
standard and small round bar specimens and the data sets of the standard and small hourglass
specimens. In case of the hourglass specimen, the axial strain (
z
) was converted from the
radial strain (
r
) using a conversion equation in ASTM E606 Appendix X2 [6] as follows:
z
(
z
/E) (1
e
)
2
r
(1)
where
z
, E, and
e
are the axial stress, Young’s modulus, and elastic Poisson’s ratio.
Equation (1) consists of two terms. The first is elastic component and the second is perfect
plastic component. When the elastic strain is negligible, i.e., when fully plastic deformation
occurs, the volume does not change. In this case, Poisson’s ratio is 0.5 and equation (1)
becomes
z
2
r
. Since the elastic strain component is not negligible, equation (1) will give
larger
z
than the real axial strain. When the strain is small, the first term becomes dominant,
but it is smaller than the real one because the stress concentration is not considered. Also, the
strain distribution on the minimum cross section is not taken into account. So, as mentioned
before, the hour glass specimen data does not meet with the round bar specimen data, and
small hour glass data does not meet with the standard hour glass data.
In case of the round bar specimens, the small specimen data is plotted on the result of the
0.1
1
10
10
2
10
3
10
4
10
5
t
(%
)
Number of cycles to failure (cycles)
Standard
round bar
Standard hourglass
Small hourglass
Small round bar
FIG. 11. Fatigue life diagram of JLF-1at room temperature.

8
PD/P8-20
standard specimen. Although the effects of grain size and homogeneity are considered, it must
be noted that the axial controlled low cycle fatigue data of the small round bar specimen
would give the same results of the standard round bar specimen. The same results have been
reported by S. Nogami et al. using other ferritic/martensitic steel, F82H [4].
From the results, the importance of the precise deformation measurement in the axial
direction is recognized and it is anticipated the deformation mode at the initial stage of the
fatigue must be analyzed clearly.
5. Summary
In this paper, the importance of the hysteresis curve and the cyclic stress-strain curve was
discussed showing the low cycle fatigue data of JLF-1 at room temperature. The cyclic stress-
strain curve is useful for the FEM analysis to characterize the cyclic yielding behavior of the
structural material.
To discuss the hysteresis curve and the cyclic stress-strain curve, the deformation
measurement with nanometer scale accuracy must be established and the trial assembly of the
new fatigue test device for the small round bar specimen was conducted using the laser
displacement gage with one nanometer resolution.
The very low noise and high accuracy test system was constructed and demonstrated. The
clear hysteresis curves were obtained. However, it is considered that some issues on the
chucking procedure will still remain and the further efforts must be done to improve the test
system more precisely.
The low cycle fatigue property is one of the important material properties and indispensable
to perform the fatigue design of the blanket. The clear database is anticipated.
Acknowledgement
Authors would like to express our thanks to Chiaki Hisaka at Kobe Material Testing
Laboratory Co. Ltd. for fruitful discussions.
References
[1]
NISHIMURA, A., et al., “Low cycle fatigue properties of a low activation ferritic steel
(JLF-1) at room temperature,” J. of Nucl. Mats, 283-287 (2000) 677-680.
[2] NISHIMURA, A., et al., “A new fatigue test device with micro laser displacement
gages for miniature specimens,” ICFRM-15, Charleston, USA (2011) 15-253. (to be
published in Journal of Nuclear Materials)
[3]
NOGAMI, S., et al., “Effect of specimen shape on the low cycle fatigue life of reduced
activation ferritic/martensitic steel,” J. of Nucl. Sci. & Tech., 47 (2010) 47-52.
[4]
NOGAMI, S., et al., “Study on fatigue life evaluation using small specimens for testing
neutron-irradiated materials,” J. of Nucl. Sci. & Tech., 48-1 (2011) 60-64.
[5]
HIROSE, T., et al., “Effect of specimen size on fatigue properties of reduced activation
ferritic/martensitic steels,” J. of Nucl. Mats, 283-287 (2000) 1018-1022.
[6] ASTM E606, Tentative Recommended Practice for Constant-Amplitude Low-Cycle
Fatigue Testing, Annual Book of ASTM (1977) 626-643.
Wyszukiwarka
Podobne podstrony:
am2 pd 8 id 58836 Nieznany (2)
am2 pd 5 id 58833 Nieznany (2)
Anatomia Kolokwium I p8 id 6275 Nieznany
am2 pd 7 id 58835 Nieznany (2)
PD ekonometria id 352458 Nieznany
240 PD (1) id 30720 Nieznany
EPLAN P8 TeSys K D GV id 162754 Nieznany
PD id 352177 Nieznany
am2 pd 4 id 58832 Nieznany (2)
am2 pd 12 id 58827 Nieznany (2)
CW PD 10 id 122466 Nieznany
am2 pd 8 id 58836 Nieznany (2)
Abolicja podatkowa id 50334 Nieznany (2)
4 LIDER MENEDZER id 37733 Nieznany (2)
katechezy MB id 233498 Nieznany
metro sciaga id 296943 Nieznany
perf id 354744 Nieznany
interbase id 92028 Nieznany
Mbaku id 289860 Nieznany
więcej podobnych podstron