
Phase Diagrams
h. P. r. Frederikse
A phase is a structurally homogeneous portion of matter.
Regardless of the number of chemical constituents of a gas, there is
only one vapor phase. This is true also for the liquid form of a pure
substance, although a mixture of several liquid substances may ex-
ist as one or several phases, depending on the interactions among
the substances. On the other hand a pure solid may exist in several
phases at different temperatures and pressures because of differ-
ences in crystal structure (Reference 1). At the phase transition
temperature, T
tr
, the chemical composition of the solid remains
the same, but a change in the physical properties often will take
place. Such changes are found in ferroelectric crystals (example
BaTiO
3
) which develop a spontaneous polarization below T
tr
, in
superconductors (example Pb) which lose all electrical resistance
below the transition point, and in many other classes of solids.
In quite a few cases it is difficult to bring about the phase tran-
sition, and the high- (or low-) temperature phase persists in its
metastable form. Many liquids remain in the liquid state for short-
er or longer periods of time when cooled below the melting point
(supercooling). However, often the slightest disturbance will cause
solidification. Persistence of the high temperature phase in solid–
solid transitions is usually of much longer duration. An example of
this behavior is found in white tin; although gray tin is the thermo-
dynamically stable form below T
tr
(286.4 K), the metal remains in
its undercooled, white tin state all the way to T = 0 K, and crystals
of gray tin are very difficult to produce.
A phase diagram is a map that indicates the areas of stability
of the various phases as a function of external conditions (tem-
perature and pressure). Pure materials, such as mercury, helium,
water, and methyl alcohol are considered one-component systems
and they have unary phase diagrams. The equilibrium phases in
two-component systems are presented in binary phase diagrams.
Because many important materials consist of three, four, and more
components, many attempts have been made to deduce their mul-
ticomponent phase diagrams. However, the vast majority of sys-
tems with three or more components are very complex, and no
overall maps of the phase relationships have been worked out.
It has been shown during the last 20 to 25 years that very use-
ful partial phase diagrams of complex systems can be obtained by
means of thermodynamic modeling (References 2, 3). Especially
for complicated, multicomponent alloy systems the CALPHAD
method has proved to be a successful approach for producing
valuable portions of very intricate phase diagrams (Reference 4).
With this method thermodynamic descriptions of the free energy
functions of various phases are obtained that are consistent with
existing (binary) phase diagram information and other thermody-
namic data. Extrapolation methods are then used to extend the
thermodynamic functions into a ternary system. Comparison of
the results of this procedure with available experimental data is
then used to fine-tune the phase diagram and add ternary interac-
tion functions if necessary. In principle this approximation strat-
egy can be extended to four, five, and more component systems.
The nearly two dozen phase diagrams shown below present
the reader with examples of some important types of single and
multicomponent systems, especially for ceramics and metal alloys.
This makes it possible to draw attention to certain features like
the kinetic aspects of phase transitions (see Figure 22, which pres-
ents a time-temperature-transformation, or TTT, diagram for the
precipitation of α-phase particles from the β-phase in a Ti-Mo al-
loy; Reference 1, pp. 358–360). The general references listed below
and the references to individual figures contain phase diagrams for
many additional systems.
general references
1. Ralls, K. M., Courtney, T. H., and Wulff, J., Introduction to Materials
Science and Engineering, Chapters 16 and 17, John Wiley & Sons, New
York, 1976.
2. Kaufman, L., and Bernstein, H., Computer Calculation of Phase
Diagrams, Academic Press, New York, 1970.
3. Kattner, U. R., Boettinger, W. J. B., and Coriell, S. R., Z. Metallkd., 87,
9, 1996.
4. Dinsdale, A. T., Ed., CALPHAD, Vol. 1–20, Pergamon Press, Oxford,
1977–1996 and continuing.
5. Baker, H., Ed., ASM Handbook, Volume 3: Alloy Phase Diagrams,
ASM International, Materials Park, OH, 1992.
6. Massalski, T. B., Ed., Binary Alloy Phase Diagrams, Second Edition,
ASM International, Materials Park, OH, 1990.
7. Roth. R. S., Ed., Phase Diagrams for Ceramists, Vol. I (1964) to Volume
XI (1995), American Ceramic Society, Waterville, OH.
references to individual Phase Diagrams
Figure 1. Carbon: Reference 7, Vol. X (1994), Figure 8930. Reprinted
with permission.
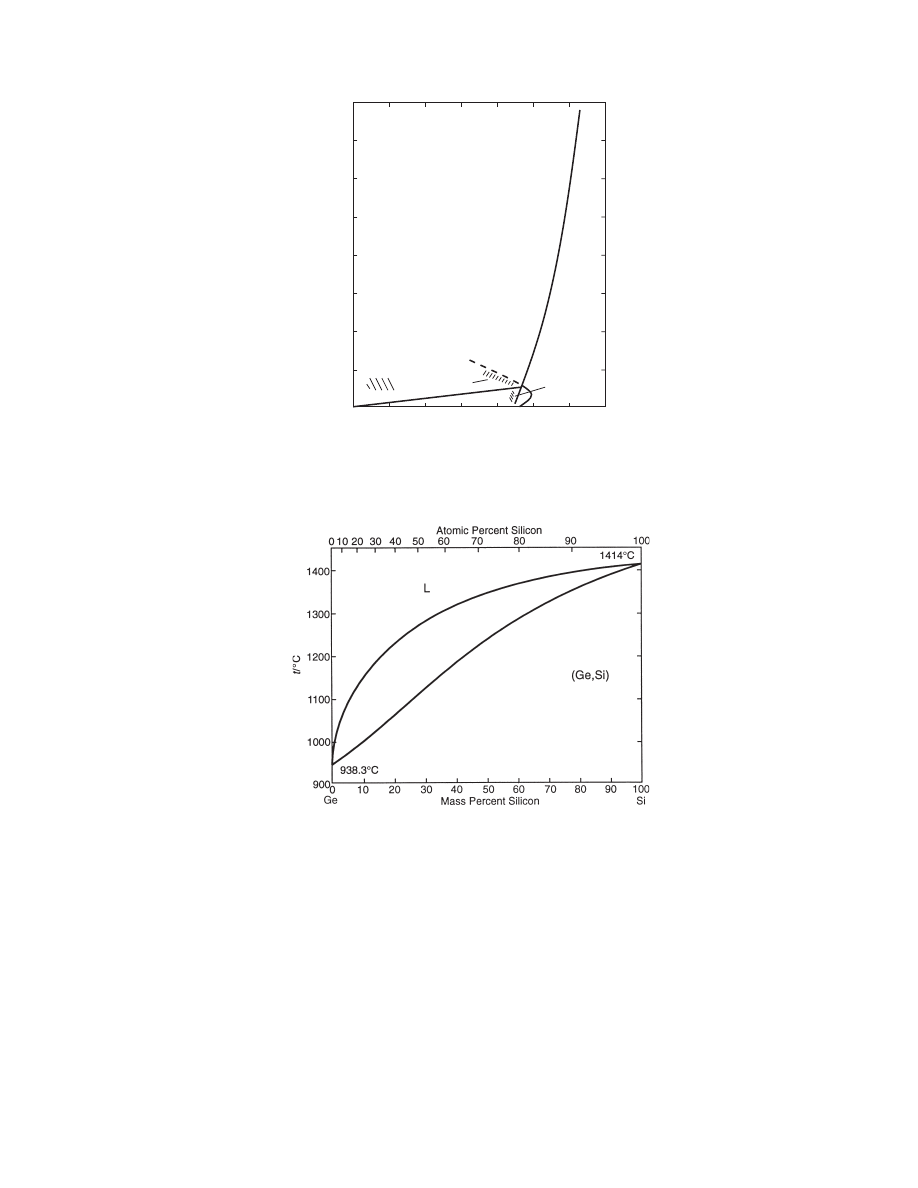
Figure 2. Si-Ge : Ref. 5, p. 2.231. Reprinted with permission.
Figure 3. H
2
O (ice): See figure.
Figure 4. SiO
2
: Reference 7, Vol. XI (1995), Figure 9174. Reprinted with
permission.
Figure 5. Fe-O: Darken, L.S., and Gurry, R.W., J. Am. Chem. Soc., 68, 798,
1946. Reprinted with permission.
Figure 6. Ti-O: Reference 5, p. 2.324. Reprinted with permission.
Figure 7. BaO-TiO
2
: Reference 7, Vol. III (1975), Figure 4302. Reprinted
with permission.
Figure 8. MgO-Al
2
O
3
: Reference 7, Vol. XI (1995), Figure 9239. Reprinted
with permission.
Figure 9. Y
2
O
3
-ZrO
2
: Reference 7, Vol. XI (1995), Figure 9348. Reprinted
with permission.
Figure 10. Si-N-Al-O (Sialon): Reference 7, Vol. X (1994), Figure 8759.
Reprinted with permission.
Figure 11. PbO-ZrO
2
-TiO
2
(PZT): Reference 7, Vol. III (1975), Figure
4587. Reprinted with permission.
Figure 12. Al-Si-Ca-O: Reference 7 (1964), Vol. I, Figure 630. Reprinted
with permission.
Figure 13. Y-Ba-Cu-O: Whitler, J.D., and Roth, R.S., Phase Diagrams for
High T
c
Superconductors, Figure S-082, American Ceramic
Society, Waterville, OH, 1990. Reprinted with permission.
Figure 14. Al-Cu: Reference 5, p. 2.44. Reprinted with permission.
Figure 15. Fe-C: Ralls, K.M., Courtney, T.H., and Wulff, J., Introduction to
Materials Science and Engineering, Figure 16.13, John Wiley &
Sons, New York, 1976. Reprinted with permission.
Figure 16. Fe-Cr: Reference 5, p. 2.152. Reprinted with permission.
Figure 17. Cu-Sn: Reference 5, p. 2.178. Reprinted with permission.
Figure 18. Cu-Ni: Reference 5, p. 2.173. Reprinted with permission.
Figure 19. Pb-Sn (solder): Reference 5, p. 2.335. Reprinted with permis-
sion.
Figure 20. Cu-Zn (brass): Subramanian, P.R., Chakrabarti, D.J., and
Laughlin, D.E., Eds., Phase Diagrams of Binary Copper Alloys,
p. 487, ASM International, Materials Park, OH, 1994. Reprinted
with permission.
Figure 21. Co-Sm: Reference 5, p. 2.148. Reprinted with permission.
Figure 22. Ti-Mo: Reference 5, p. 2.296; Reference 1, p. 359. Reprinted
with permission.
Figure 23. Fe-Cr-Ni: Reference 5, Figure 48. Reprinted with permission.
12-181
200
150
100
50
0
0
Diamond
2000
4000
6000
Liquid
A
B
C
Graphite
T/K
P
/GP
a
Figure 1.
Phase diagram of carbon. (A) Martensitic transition: hex graphite → hex diamond. (B) Fast graphite-to-diamond transition. (C)
Fast diamond-to-graphite transition.
Figure 2.
Si-Ge system.
Composition,
Pearson
Space
Phase
mass % Si
symbol
group
(Ge,Si)
0 to 100
cF8
Fd3–m
High-pressure phases
GeII
–
tI4
I4
1
/amd
SiII
–
tI4
I4
1
/amd
12-182
Phase Diagrams
200
150
100
50
0
-50
-100
-150
Liquid
t /
° C
VI
VII
VIII
V
III
II
I
P /MPa
0 500 1000 1500 2000 2500 3000 3500
Figure 3.
Diagram of the principal phases of ice. Solid lines are measured boundaries between stable phases; dotted lines are extrapolated.
Ice IV is a metastable phase that exists in the region of ice V. Ice IX exists in the region below –100°C and pressures in the range 200–400 MPa.
Ice X exists at pressures above 44 GPa. See Table 1 for the coordinates of the triple points, where liquid water is in equilibrium with two adjacent
solid phases.
Table 1. Crystal structure, Density, and Transition Temperatures for the Phases of ice
Crystal
Phase
system
Cell parameters
Z
n
ρ/g cm
-3
Triple points
Ih
Hexagonal
a = 4.513; c = 7352
4
4
0.93
I-III: –21.99°C, 209.9 MPa
Ic
Cubic
a = 6.35
8
4
0.94
II
Rhombohedral
a = 7.78; α = 113.1°
12
4
1.18
III
Tetragonal
a = 6.73; c = 6.83
12
4
1.15
III-V: –16.99°C, 350.1 MPa
IV
Rhombohedral
a = 7.60; α = 70.1°
16
4
1.27
V
Monoclinic
a = 9.22; b = 7.54,
28
4
1.24
V-VI: 0.16°C, 632.4 MPa
c = 10.35; β = 109.2°
VI
Tetragonal
a = 6.27; c = 5.79
10
4
1.31
VI-VII: 82°C, 2216 MPa
VII
Cubic
a = 3.41
2
8
1.56
VIII
Tetragonal
a = 4.80; c = 6.99
8
8
1.56
IX
Tetragonal
a = 6.73; c = 6.83
12
4
1.16
X
Cubic
a = 2.83
2
8
2.51
references
1. Wagner, W., Saul, A., and Pruss, A., J. Phys. Chem. Ref. Data, 23, 515,
1994.
2. Lerner, R.G. and Trigg, G.L., Eds., Encyclopedia of Physics, VCH
Publishers, New York, 1990.
3. Donnay, J.D.H. and Ondik, H.M, Crystal Data Determinative Tables,
Third Edition, Volume 2, Inorganic Compounds, Joint Committee on
Powder Diffraction Standards, Swarthmore, PA, 1973.
4. Hobbs, P.V., Ice Physics, Oxford University Press, Oxford, 1974.
5. Glasser, L., J. Chem. Edu., 81, 414, 2004.
Phase Diagrams
12-183
C
al
cu
la
te
d
2000
1500
1000
500
0 0
Coesite
20
40
60
80
100
120
P/kbar
t/°
C
Stishovite
Crist
Liq.
αQuartz
βQuartz
1300
°
34 kbars
M
Trid
1190
°
1.43 kbars
Figure 4.
SiO
2
system. Crist = cristobalite; Trid = tridymite.
0
1600
1400
1200
1000
800
600
400
Mass % Oxygen
°F
50
.2 .4 22
24
26
28
30
Q
L
3000
2600
2200
1800
1400
1000
52
54
56
58
60
Atom % Oxygen
Magnetite
+
hematite
Wustite
+
magnetite
Magnetite
+ oxygen
Liquid oxide
+ oxygen
Liquid oxide
+ magnetite
Liquid
oxide
Wustite
α-Iron +
magnetite
N J
I H
S
R
Y
Z
V
R´
G
C
A
B
Fe
3
O
3
Z´
Fe
3
O
4
FeO
α-Iron +
wustite
γ-Iron +
wustite
γ-Iron + liq. oxide
δ-Iron +
liq. oxide
Liq. iron +
Liq. oxide
Liq. iron
Liq. iron
Hematite + oxygen
Magnetit
e
t/°
C
..
..
..
..
Figure 5.
Fe-O system.
12-184
Phase Diagrams
Point
t/°C
% O
p
CO2
/p
CO
Point
t/°C
% O
p
CO2
/p
CO
p
O2
/atm
A
1539
Q
560
23.26
1.05
B
1528
0.16
0.209
R
1583
28.30
1
C
1528
22.60
0.209
R´
1583
28.07
1
G
1400
a
22.84
0.263
S
1424
27.64
16.2
H
1424
25.60
16.2
V
1597
27.64
0.0575
I
1424
25.31
16.2
Y
1457
28.36
1
J
1371
23.16
0.282
Z
1457
30.04
1
L
911
a
23.10
0.447
Z´
30.6
N
1371
22.91
0.282
a
Values for pure iron.
2200
2000
1800
1600
1400
1200
1000
800
600
400
70
Atomic Percent Oxygen
Ti
2
O
t/°
C
60
50
40
30
20
10
0
~1885
°C
Mass Percent Oxygen
Ti
40
30
20
10
0
L
(
αTi)
(
βTi)
βTiO
γTiO
1670
°C
1720
°C
1842
°C 1870°C
~1250
°C
940
°C
882
°C
Ti
3
O
Ti
3
O
2
α
Ti
O
βTi
1-x
O
αTi
1-x
O
βT
i
2
O
3
TiO
2
(rutile)
higher Magneli phases
Ti
n
O
2n-1
Figure 6.
Ti-O system.
Composition,
Pearson
Space
Phase
mass % O
symbol
group
(βTi)
0 to 3
cI2
Im
¯
3m
(αTi)
0 to 13.5
hP2
P63/mmc
Ti
3
O
~8 to ~13
hP~16
P
¯
3c
Ti
2
O
~10 to 14.4
hP3
P
¯
3m1
γTiO
15.2 to 29.4
cF8
Fm
¯
3m
Ti
3
O
2
~18
hP~5
P6/mmm
βTiO
~24 to ~29.4
c**
–
αTiO
~25.0
mC16
A2/m or B*/*
βTi
1–x
O
~29.5
oI12
I222
αTi
1–x
O
~29.5
tI18
I4/m
βTi
2
O
3
33.2 to 33.6
hR30
R
¯
3c
αTi
2
O
3
33.2 to 33.6
hR30
R
¯
3c
βTi
3
O
5
35.8
m**
–
αTi
3
O
5
35.8
mC32
C2/m
α´Ti
3
O
5
35.8
mC32
Cc
γTi
4
O
7
36.9
aP44
P
¯
1
βTi
4
O
7
36.9
aP44
P
¯
1
αTi4O
7
36.9
aP44
P
¯
1
γTi
5
O
9
37.6
aP28
P
¯
1
βTi
6
O
11
38.0
aC68
A
¯
1
Ti
7
O
13
38.3
aP40
P
¯
1
Ti
8
O
15
38.5
aC92
A
¯
1
Ti
9
O
17
38.7
aP52
P
¯
1
Rutile TiO
2
40.1
tP6
P4
2
/mnm
Metastable phases
Anatase
–
tI12
I4
1
/amd
Brookite
–
oP24
Pbca
High-pressure phases
TiO
2
-II
–
oP12
Pbcn
TiO
2
-III
–
hP~48
–
Phase Diagrams
12-185
1600
1500
1400
1300
1200
60
70
80
90
100
Mol %
BaO
TiO
2
t/
°C
Liquid
1428
°
~1300
°
~1320
°
~1330
°
~1357
°
TiO
2
+ Liq.
TiO
2
+ BaTi
4
O
9
TiO
2
+ Ba
2
Ti
9
O
20
Ba
2
Ti
9
O
20
Ba
Ti
4
O
9
Ba
4
Ti
13
O
30
Ba
6
Ti
17
O
40
BaTiO
3
+
Ba
6
Ti
17
O
40
BaTiO
3
+
Liq.
Figure 7.
BaO-TiO
2
system.
2800
2600
2400
2200
2000
1800
1600
1400
70
Spinel s s
+ Liquid
Mol %
Al
2
O
3
t/°
C
60
50
40
30
20
10
0
Periclase s s
+ Liquid
1995°
Periclase ss + Spinel ss
~1500°
Periclase + Spinel
2105°
Spinel
ss
Periclase
ss
MgO
Figure 8.
MgO-Al
2
O
3
system.
12-186
Phase Diagrams
t/°
C
2800
2400
2000
1600
1200
800
400
0
20
40
60
80
100
ZrO
2
0
Y
2
O
3
Mol %
6:1
ss
Y
ss
H
ss
Liquid
C
ss
Y
ss
+ H
ss
C
ss
+ Y
ss
Tet
ss
+ C
ss
Tet
ss
Mon
ss
Mon
ss
+ C
ss
4:3 + 1:6
ss
1700
°C
1375
°
C
ss
+ Liq.
1325
°± 25°
(28%)
1650
°± 50°
C
ss
+ 6:1
(55%)
C
ss
+ 4:3
(95.5%)
490
°
Zr
3
Y
4
O
12
Figure 9.
Y
2
O
3
-ZrO
2
system. C
ss
= cubic ZrO
2
ss (fluorite-type ss); Y
ss
= cubic Y
2
O
3
ss; Tet
ss
= tetragonal ZrO
2
ss; Mon
ss
= monoclinic ZrO
2
ss; H
ss
= hexagonal Y
2
O
3
ss; 3:4 = Zr
3
Y
4
O
12
; 1:6 = ZrY
6
O
11
ss.
Phase Diagrams
12-187
Mol %
60
40
20
0
Si
3
N
4
80
100
4(AIN)
100
80
60
40
20
0
Si
2
ON
2
O´
Mol
%
Liquid
X
1700
°C
ALON
ss
β´
8H
15
R
12
H
21
R
27
R
2H
δ
3(SiO
2
)
2(Al
2
O
3
)
Al
6
Si
4
O
13 ss
Figure 10.
3(SiO
2
)-Si
3
N
4
-4(AlN)-2(Al
2
O
3
) system. “Behavior” diagram at 1700°C. The labels 8H, 15R, 12H, 21R, 27R, 2H
δ
indicate defect
AlN polytypes. β´ = 3-sialon (Si
6–x
Al
x
O
x
N
8–x
); O´ = sialon of Si
2
ON
2
type; X = SiAlO
2
N (“nitrogen mullite”). ALON ss = aluminum oxynitride ss
extending from approximately Al
7
O
9
N to Al
3
O
3
N.
40
60
80
TiO
2
(86%)
(8%)
ZrO
2
TiZrO
4
Mol %
PbO
1100
°C
(PZ-PT)ss(orth)
PbZrO
3
PbTiO
3
(PT-PZ)ss(tet)
(PT-PZ)ss(rhom)
Liq. + (PT-PZ)ss
Zss + (PT-PZ)ss
Zss + ZT + (PT-PZ)ss
Tss + ZT + (PT-PZ)ss
ZT
+ (P
T-PZ)
ss
Ts
s + (PT
-PZ)ss
Figure 11.
PbO-ZrO
2
-TiO
2
(PZT) system, subsolidus at 1100°C. P = PbO; T = TiO
2
; Z = ZrO
2
.
12-188
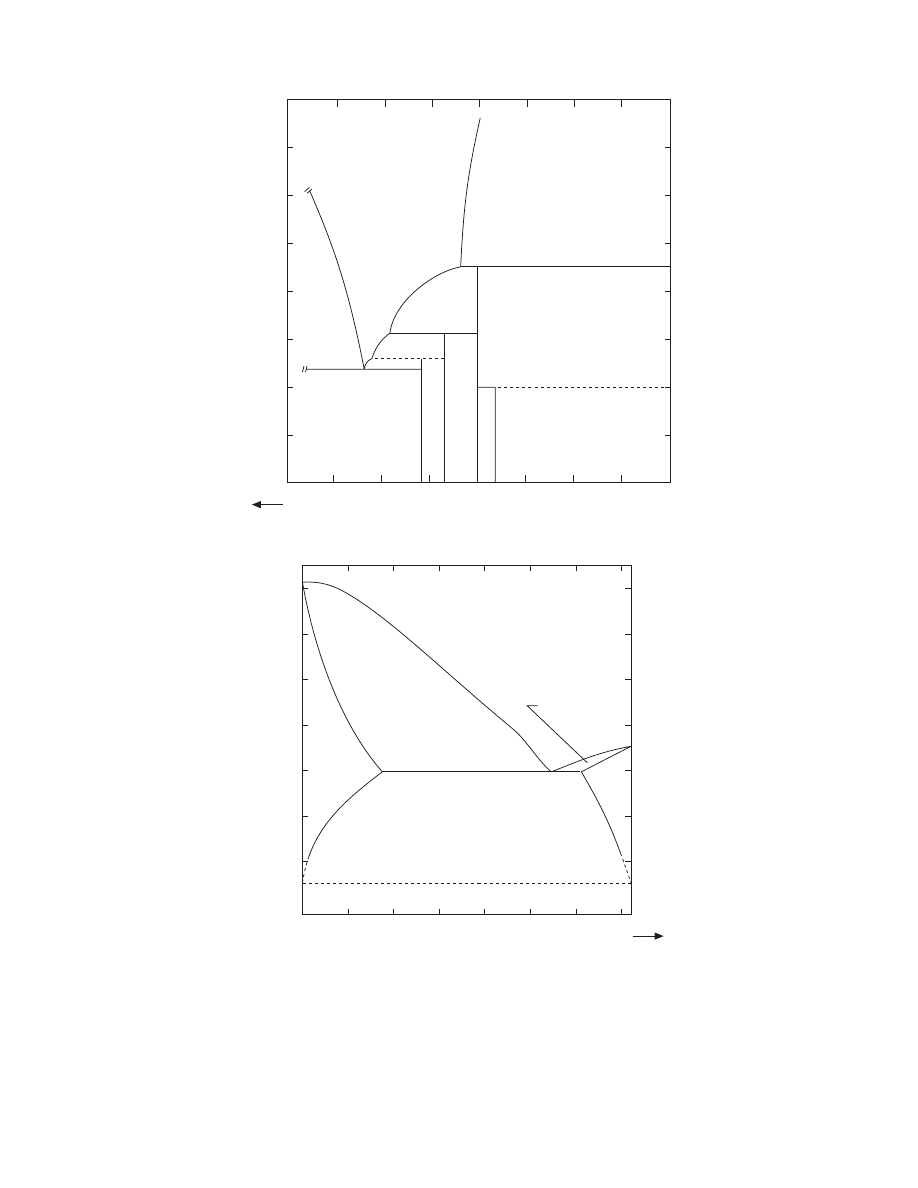
Phase Diagrams
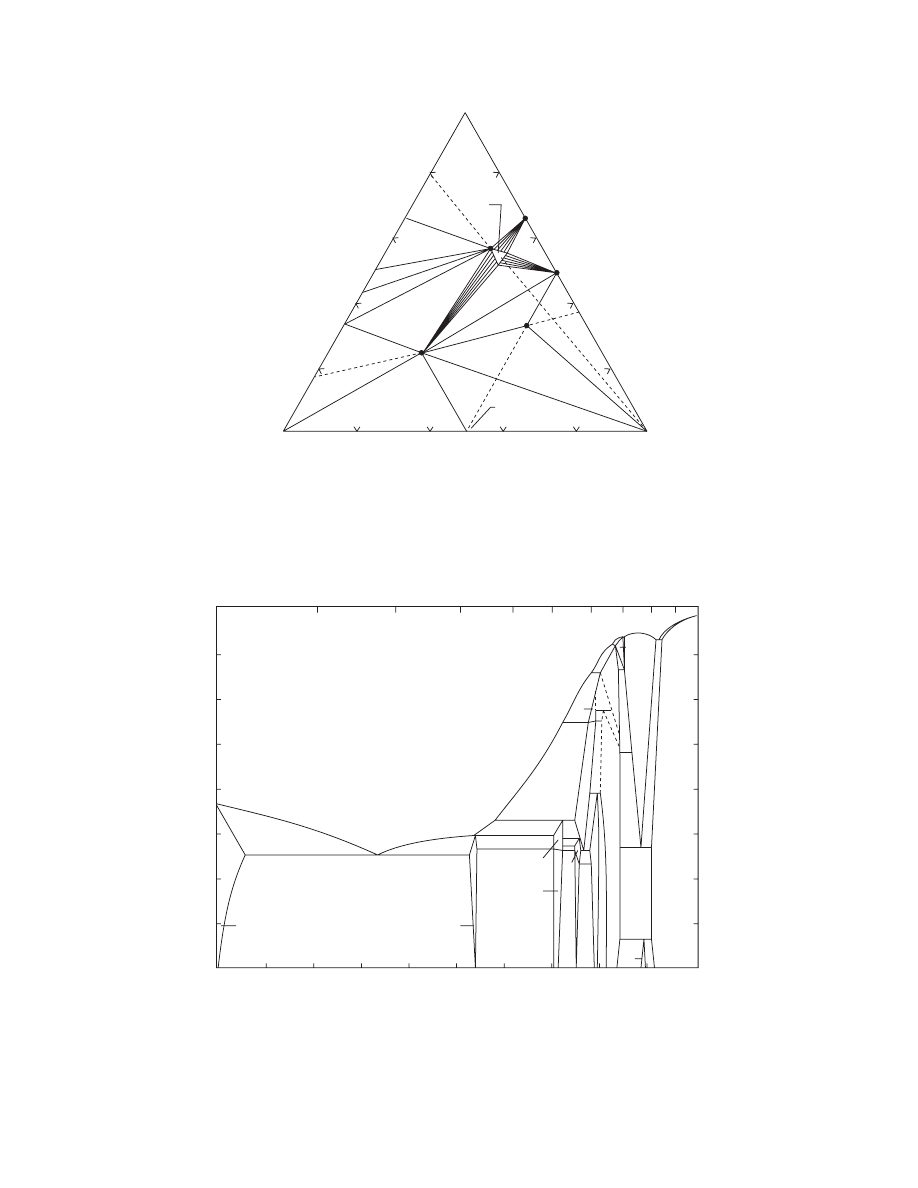
Figure 12.
CaO-Al
2
O
3
-SiO
2
system (temperatures in °C).
Crystalline Phases
Notation
Oxide formula
Cristobalite
Tridymite
}
SiO
2
Pseudowollastonite
CaO·SiO
2
Rankinite
3CaO·2SiO
2
Lime
CaO
Corundum
Al
2
O
3
Mullite
3Al
2
O
3
·2SiO
2
Anorthite
CaO·Al
2
O
3
·2SiO
2
Gehlenite
2CaO·Al
2
O
3
·SiO
2
Temperatures up to approximately 1550°C are on the
Geophysical Laboratory Scale; those above 1550°C are on
the 1948 International Scale.
Phase Diagrams
12-189
BaO(BaCO
3
)
1:2:1
2:1:3
~4:1:2
~5:1:3
20
40
60
80
100
CuO
0
1/2(Y
2
O
3
)
b
1
Mol %
Y
2
Cu
2
O
3
a
2
a
1
Ba
4
Y
2
O
7
c
1
Ba
2
Y
2
O
5
Ba
3
Y
4
O
9
BaY
2
O
4
BaCuO
2
Ba
2
CuO
3
b
2
P
ss
c
2
Figure 13.
BaO-Y
2
O
3
-CuO system. 2:1:3 = Ba
2
YCu
3
O
7–x
; 1:2:1 = BaY
2
CuO
5
; 4:1:2 = Ba
4
YCu
2
O
7.5+x
; and 5:1:3 = Ba
5
YCu
3
O
9.5 + x
. The supercon-
ducting 2:1:3 phase was prepared using barium peroxide.
t/°
C
1100
1000
900
800
700
600
500
400
300
100
0
10
20
30
40
50
60
70
80
90
Mass Percent Copper
Al
Cu
100
20
30
40
50
60
70 80 90
0
10
Atomic Percent Copper
(Cu)
L
660.452
°C
548.2
°C
567
°C
(Al)
θ
η
2
ζ
1
ζ
2
γ
1
ε
1
γ
0
β
0
β
ε
2
η
1
δ
α
2
1084.87
°
Figure 14.
Al-Cu system.
12-190
Phase Diagrams
Composition,
Pearson
Space
Phase
wt % Cu
symbol
group
(Al)
0 to 5.65
cF4
Fm
¯
3m
θ
52.5 to 53.7
tI12
I4/mcm
η
1
70.0 to 72.2
oP16 or oC16
Pban or Cmmm
η
2
70.0 to 72.1
mC20
C2/m
ζ
1
74.4 to 77.8
hP42
P6/mmm
ζ
2
74.4 to 75.2
(a)
–
ε
1
77.5 to 79.4
(b)
–
ε
2
72.2 to 78.7
hP4
P63/mmc
δ
77.4 to 78.3
(c)
R
¯
3m
γ
0
77.8 to 84
(d)
–
γ
1
79.7 to 84
cP52
P
¯
43m
β
0
83.1 to 84.7
(d)
–
β
85.0 to 91.5
cI2
Im
¯
3m
α
2
88.5 to 89
(e)
–
(Cu)
90.6 to 100
cF4
Fm
¯
3m
Metastable phases
θ´
–
tP6
–
β´
–
cF16
Fm
¯
3m
Al
3
Cu
2
61 to 70
hp5
P
¯
3m1
(a) Monoclinic? (b) Cubic? (c) Rhombohedral. (d) Unknown. (e) D0
22
-type long-period
superlattice.
2000
1500
1000
500
0 0
4.2
Atomic Percent Carbon
20
t/°
C
(
αFe), ferrite
2
4
6
8
10
12
10
0
30
L
L + C(graphite)
Mass Percent Carbon
(
γFe),
austenite
2.1
0.65
740
°C
1153
°C
(
δFe)
1394
°C
912
°C
Figure 15.
Fe-C system.
Composition,
Pearson
Space
Phase
mass % C
symbol
group
(δFe)
0 to 0.09
cI2
Im
¯
3m
(γFe)
0 to 2.1
cF4
Fm
¯
3m
(αFe)
0 to 0.021
cI2
Im
¯
3m
(C)
100
hP4
P6
3
/mmc
Metastable/high-pressure phases
(εFe)
0
hP2
P6
3
/mmc
Martensite
< 2.1
tI4
I4/mmm
Fe
4
C
5.1
cP5
P
¯
43m
Fe
3
C (θ)
6.7
oP16
Pnma
Fe
5
C
2
(χ)
7.9
mC28
C2/c
Fe
7
C
3
8.4
hP20
P6
3
mc
Fe
7
C
3
8.4
oP40
Pnma
Fe
2
C (η)
9.7
oP6
Pnnm
Fe
2
C (ε)
9.7
hP*
P6
3
22
Fe
2
C
9.7
hP*
P
¯
3m1
(C)
100
cF8
Fd
¯
3m
Phase Diagrams
12-191
1900
1700
1500
1300
1100
900
700
500
300
0
Atomic Percent Chromium
t/°
C
Mass Percent Chromium
10
20
30
40
50
60
70
80
90
100
0
10
20
30
40
50
60
70
80
90
100
L
(Cr)
F
r
13.4
1513
°C
19.8
830
°C
σ
47.2
T
C
1394
°C
1538
°C
912
°C
11.2
6.5
846
°C
(
αFe,δFe)
(
γFe)
45
1863
°C
770
°C
Figure 16.
Fe-Cr system.
Composition,
Pearson
Space
Phase
mass % Cr
symbol
group
(aFe, Cr)
0 to 100
cI2
Im
¯
3m
(γFe)
0 to 11.2
cF4
Fm
¯
3m
σ
42.7 to 48.2
tP30
P4
2
/mnm
t/°
C
1200
1100
1000
900
800
700
600
500
400
300
200
100
100
0
10
20
30
40
50
60
70
80
90
Mass Percent Tin
Cu
Sn
Atomic Percent Tin
100
0
10
20
30
40
50
60
70
80 90
L
58.6
640
°C
676
°C
755
°C
25.6
30.6
796
°C
13.5
(Cu)
582
°C
59
415
°C
189
°C 60.3
60.9
227
°C
186
°C
92.4
99.3
231.9681
°C
η
ε
γ
ζ
δ
β
22
586
°C
24.6
520
°C
15.8
27.0
~350
°C
32.55
11
1.3
η´
(Sn)
1084.87
°C
Figure 17.
Cu-Sn system.
12-192
Phase Diagrams
Phase
Composition, mass % Sn
Pearson symbol
Space group
α
0 to 15.8
cF4
Fm
¯
3m
β
22.0 to 27.0
cI2
Im
¯
3m
γ
25.5 to 41.5
cF16
Fm
¯
3m
δ
32 to 33
cF416
F
¯
43m
ζ
32.2 to 35.2
hP26
P6
3
ε
27.7 to 39.5
oC80
Cmcm
η
59.0 to 60.9
hP4
P6
3
/mmc
η´
44.8 to 60.9
(a)
–
(βSn)
~100
tI4
I4
1
/amd
(αSn)
100
cF8
Fd
¯
3m
(a) Hexagonal; superlattice based on NiAs-type structure.
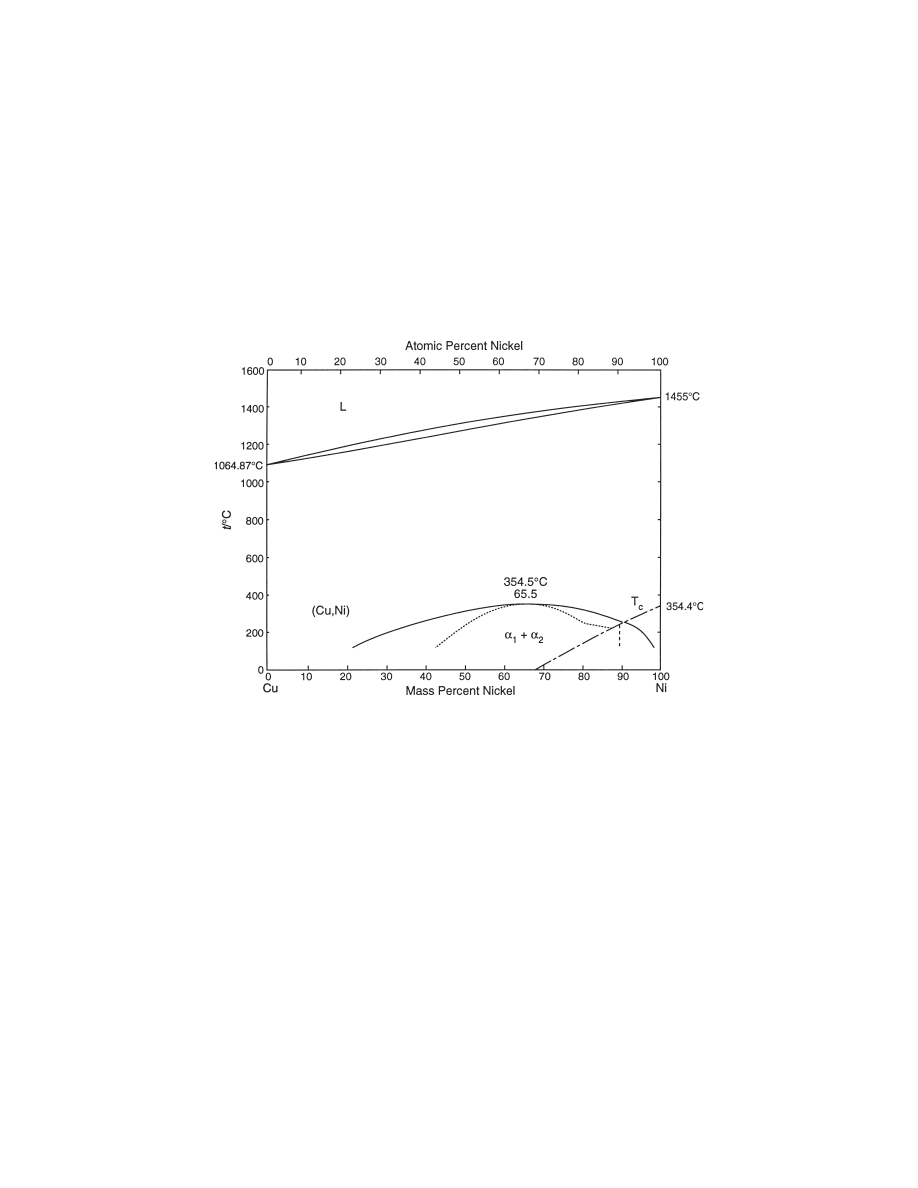
Figure 18.
Cu-Ni system.
Composition,
mass % Ni
Pearson
symbol
Space
group
Phase
(Cu, Ni) (above 354.5°C)
0 to 100
cF4
Fm3–m
Phase Diagrams
12-193
350
300
250
200
150
100
50
0
0
Atomic Percent Tin
t/°
C
Mass Percent Tin
10
20
30
40
50
60
70
80
90
100
L
61.9
97.8
183
°C
18.3
(Pb)
327.502
°C
0
10
20
30
40
50
60
70
80
90
100
231.9681
°C
(
βSn)
Pb
Sn
Figure 19.
Pb-Sn system.
Composition,
mass % Sn
Pearson
symbol
Space
group
Phase
(Pb)
0 to 18.3
cF4
Fm
¯
3m
(βSn)
97.8 to 100
tI4
I4
1
/amd
(αSn)
100
cF8
Fd
¯
3m
High-pressure phases
ε(a)
52 to 74
hP1
P6/mmm
ε´(b)
52
hP2
P6
3
/mmc
(a) From phase diagram calculated at 2500 MPa. (b) This phase was claimed for alloys at 350°C and 5500 MPa.
12-194
Phase Diagrams
t/°
C
1100
1000
900
800
700
600
500
400
300
200
100
100
0
10
20
30
40
50
60
70
80
90
Atomic Percent Zinc
Cu
Zn
100
20
30
40
50
60
70
80
90
0
10
Mass Percent Zinc
L
D
36.8
A
36.1
C
55.8
G
31.9
B
902
38.27
E
454
°C
44.8
F
X
468
48.2 Y
57
β
γ
ε
α or (Cu)
β´
H
834
°C
59.1
69.2
L
700
°C
N
79.8
Q
87.9
98.25
419.58
°C
425
°C
η or (Zn)
560
°C
70
R
73.5 T
88
U
97.17
V
W
598
°C
78
78
76 P
S
M 72.45
δ
O
1064.62
°C
Figure 20.
Cu-Zn system.
Composition,
mass % Zn
Pearson
symbol
Space
group
Phase
α or (Cu)
0 to 38.95
cF4
Fm
¯
3m
β
36.8 to 56.5
cI2
Im
¯
3m
β´
45.5 to 50.7
cP2
Pm
¯
3m
γ
57.7 to 70.6
cI52
I
¯
43m
δ
73.02 to 76.5
hP3
P
¯
6
ε
78.5 to 88.3
hP2
P6
3
/mmc
η or (Zn)
97.25 to 100
hP2
P6
3
/mmc
Phase Diagrams
12-195
t/°
C
1600
1400
1200
1000
800
600
400
200
0
0
10
20
30
40
50
60
70
80
90
Mass Percent Samarium
Co
100
Sm
Atomic Percent Samarium
100
0
10
20
30
40
50
60 70 80 90
L
1074
°C
922
°C
734
°C
595
°C
695
°C
605
~93
~82
575
°C
(
γSm)
(
βSm)
(
αSm)
Co
4
Sm
9
CoSm
3
Co
3
Sm
1074
°C
1200
°C
1240
°C
1260
°C
Co
3
Sm
1100
°C
1325
°C
(
αCo)
(
εCo)
Co
5-
x
Sm
α
Co
17
Sm
2
α
Co
7
Sm
2
βCo
17
Sm
2
βCo
7
Sm
2
α→β
Co
19
Sm
5
Co
5+
x
Sm
1495
°C
Figure 21.
Co-Sm system.
Composition,
mass % Sm
Pearson
symbol
Space
group
Phase
(αCo)
0 to ~3.7
cF4
Fm
¯
3m
(εCo)
~0
hP2
P6
3
/mmc
βCo
17
Sm
2
~23.0
hP38
P6
3
/mmc
αCo
17
Sm
2
~23.0
hR19
R
¯
3m
hP8
P6/mmm
Co
5 + x
Sm
~33 to 34
–
–
Co
5 - x
Sm
~34 to 35
–
–
Co
19
Sm
5
~40.1
hR24
R
¯
3m
hP48
P6
3
/mmc
αCo
7
Sm
2
~42.1
hR18
R
¯
3m
βCo
7
Sm
2
~42.1
hP36
P6
3
/mmc
Co
3
Sm
46
hR12
R
¯
3m
Co
2
Sm
56.0
hR4
R
¯
3m
cF24
Fd
¯
3m
Co
4
Sm
9
~85.1
o**
–
CoSm
3
88
oP16
Pnma
(γSm)
~100
cI2
Im
¯
3m
(βSm)
~100
hP2
P6
3
/mmc
(αSm)
~100
hR3
R
¯
3m
Other reported phases
Co
5
Sm
~33.8
hP6
P6/mmm
Co
2
Sm
5
~86.4
mC28
C2/c
12-196
Phase Diagrams
2600
2400
2200
2000
1800
1600
1400
1200
1000
800
600
400
0
Atomic Percent Molybdenum
t/°
C
Mass Percent Molybdenum
10
20
30
40
50
60
70
80
90 100
0
10
20
30
40
50
60
70
80
90
100
L
(
βTi,Mo)
Ti
Mo
~695
°C
~650
°C
882
°C
1670
°C
(
αTi)
~21
2623
°
Figure 22.
Ti-Mo system.
Composition,
mass % Mo
Pearson
symbol
Space
group
Phase
(βTi, Mo)
0 to 100
cI2
Im3–m
(αTi)
0 to 0.8
hP2
P6
3
/mmc
α´
(a)
hP2
P6
3
/mmc
α˝
(a)
oC4
Cmcm
ω
(a)
hP3
P6/mmm
(a) Metastable.
Sta
rt
Finis
h
800
700
600
500
400
0.1
t/°
C
1.0
10
100
1000
Time in Minutes
β + α´
M
S
β + α´
β
t
o
(
β + α)
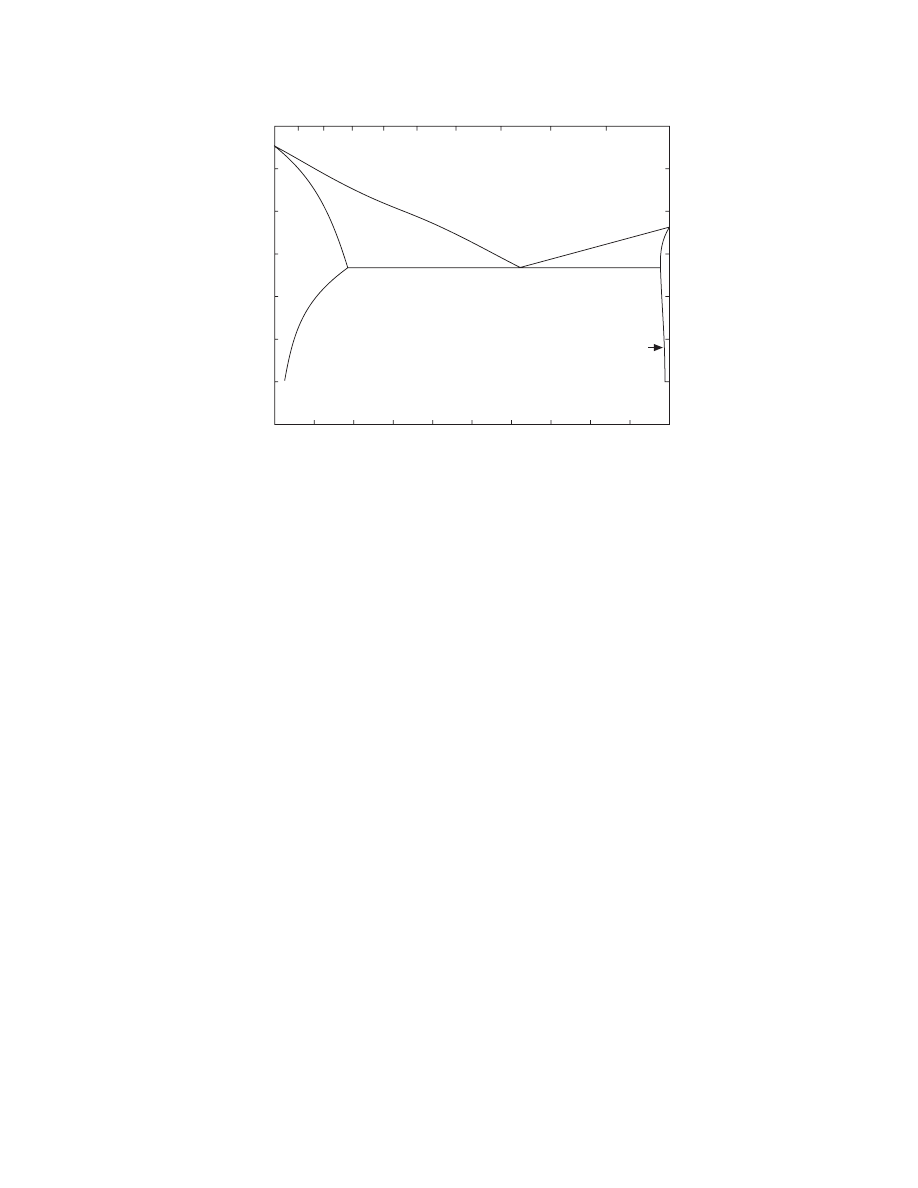
eqm
Experimental time–temperature–transformation (TTT) diagram for Ti-Mo. The start and finish times of the isothermal precipitation reaction vary
with temperature as a result of the temperature dependence of the nucleation and growth processes. Precipitation is complete, at any temperature,
when the equilibrium fraction of α is established in accordance with the lever rule. The solid horizontal line represents the athermal (or nonthermally
activated) martensitic transformation that occurs when the β phase is quenched.
Phase Diagrams
12-197
10
Mass Percent Nickel
20
30
40
50
60
70
80
90
90
80
70
60
50
40
30
20
10
90
80
70
60
50
40
30
20
10
Mass Percent Ch
romium
Mass
Percent Iron
(Cr) + (
γFe,Ni)
(
γFe,Ni)
σ + (γFe,Ni)
(Cr) +
(γFe,Ni)
(Cr)
σ
(Cr) +
σ
Fe
Ni
Cr
18-8 Stainless steel
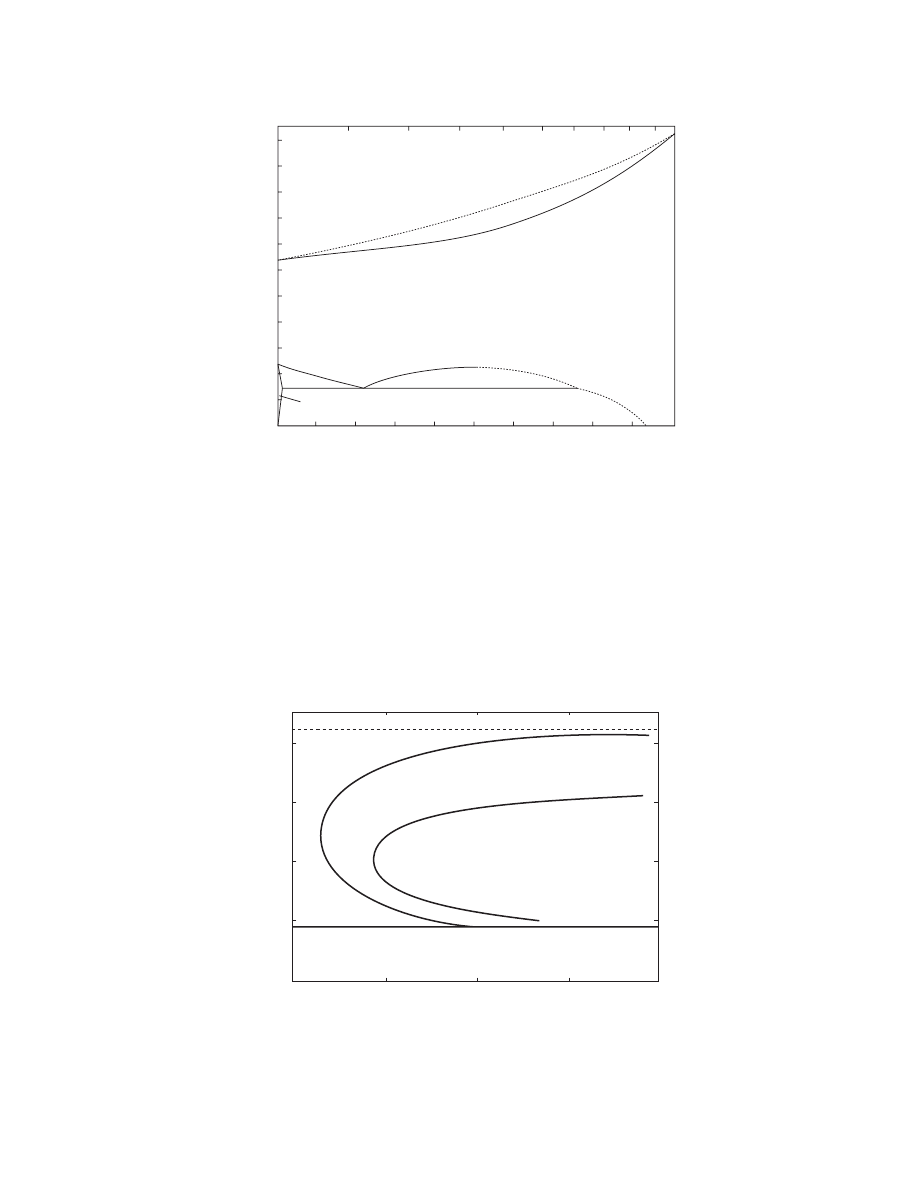
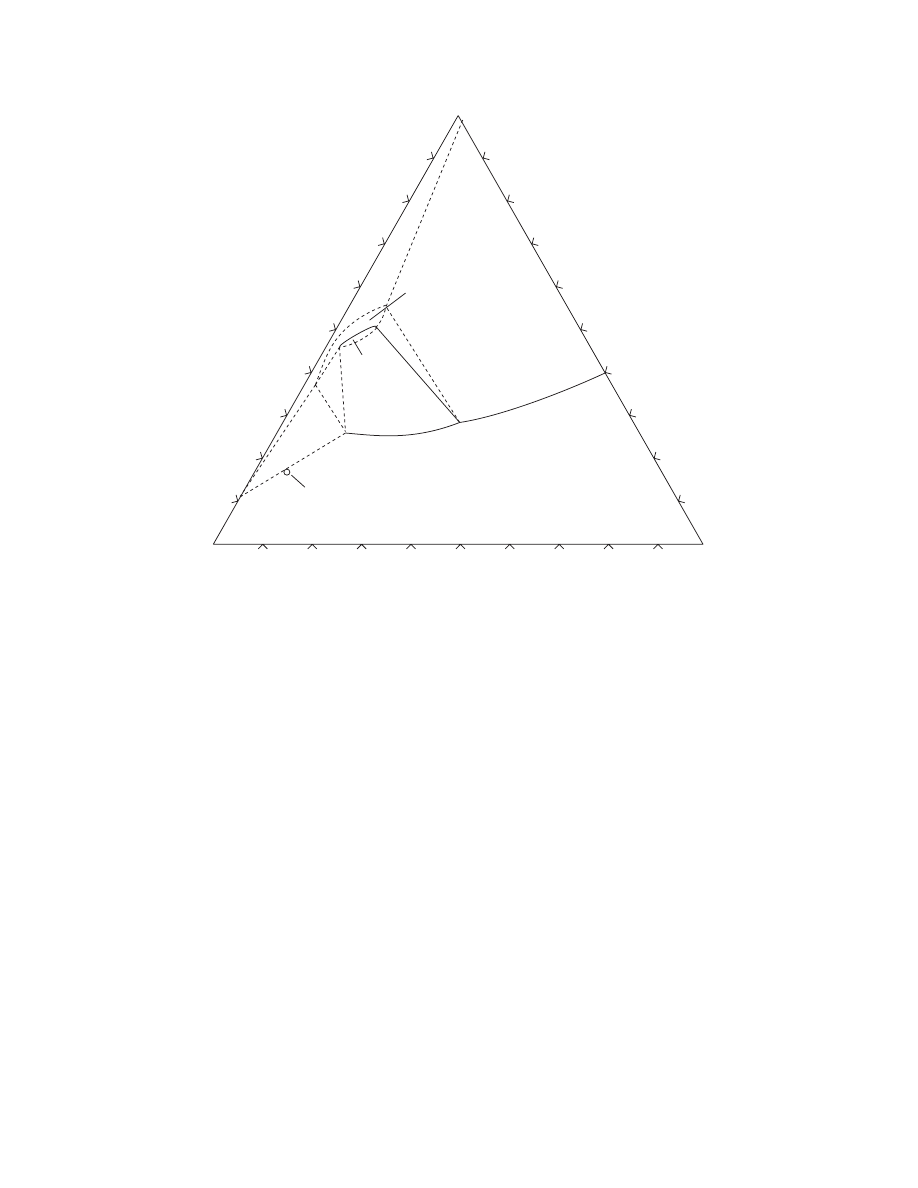
Figure 23.
The isothermal section at 900°C (1652°F) of the iron-chromium-nickel ternary phase diagram, showing the nominal composition
of 18-8 stainless steel.
12-198
Phase Diagrams
Wyszukiwarka
Podobne podstrony:
2002 12 26
TPL WYK 12 12 26 Ekstrakcja surowców roślinnych podsumowanie
12 18 88
12 24 88
2003 12 26
2001 12 26
7,11,12,26
TPL WYK 12 12 26 Napary, Odwary, Maceracje
12 1995 88
Podstawy finansow i bankowosci - wyklad 12 [26.10.2001], Finanse i bankowość, finanse cd student
12 26
12 23 88
Podstawy psychologii - wyklad 12 [26.10.2001], INNE KIERUNKI, psychologia
12 41 88
2002 12 26
12 (26) DOC
więcej podobnych podstron