
Canvas
Pocket Reference
David Flanagan
O'REILLY
8
Beijing • Cambridge • Farnham • Köln • Sebastopol • Tokyo

Contents
Preface vii
Chapter 1: Canvas Tutorial 1
Drawing Lines and Filling Polygons 5
Graphics Attributes 10
Canvas Dimensions and Coordinates 12
Coordinate System Transforms 14
Drawing and Filling Curves 20
Rectangles 23
Colors, Transparency, Gradients, and Patterns 23
Line-Drawing Attributes 28
Text 30
Clipping 32
Shadows 34
Images 36
Compositing 39
Pixel Manipulation 43
Hit Detection 45
Canvas Example: Sparklines 47
Chapter 2: Canvas Reference 51

Preface
This book documents the JavaScript API for drawing graphics
in an H T M L <canvas> tag. It assumes that you know the Java-
Script programming language and have at least basic familiarity
with the use of JavaScript in web pages. Chapter 1 is a tutorial
that explains all Canvas features and demonstrates them with
examples. Chapter 2 is a reference to each of the Canvas-related
classes, methods, and properties.
This book is an excerpt from the much longer book JavaScript:
The Definitive Guide;
my publisher and I felt that the
<canvas>
tag is such an exciting feature of H T M L 5 that it de-
serves a timely and concise book of its own. Because the Canvas
API is relatively small, this short book can document it
definitively.
Thanks to Raffaele Cecco for a careful review of the book and
its code examples. Thanks also to my editor, Mike Loukides,
for his enthusiasm for this project and to editor Simon St. Lau-
rent for his work converting the material from "Definitive
Guide" to "Pocket Reference" format.
The examples in this book can be downloaded from the book's
web page, which will also include errata if any errors are dis-
covered after publication:
http://oreilly.com/catalog/0636920016045/
vii

In general, you may use the examples in this book in your
programs and documentation. You do not need to contact
us for permission unless you're reproducing a significant por-
tion of the code. We appreciate, but do not require, an attri-
bution like this: "From Canvas Pocket Reference by David
Flanagan (O'Reilly). Copyright 2011 David Flanagan,
978-1-449-39680-0." If you feel your use of code examples falls
outside fair use or the permission given here, feel free to contact
us at permissions@oreilly.com.
To comment or ask technical questions about this book, send
email to:
bookquestions@oreilly.com
This book is also available from the Safari Books Online serv-
ice. For full digital access to this book and others on similar
topics from O'Reilly and other publishers, sign up at http://
my.safaribooksonline.com.
viii | Preface

CHAPTER 1
Canvas T u t o r i a l
This book explains how to draw graphics in web pages using
JavaScript and the H T M L <canvas> tag. The ability to dynam-
ically generate sophisticated graphics in the web browser
instead of downloading them from a server is revolutionary:
• The code used to produce graphics on the client side is
typically much smaller than the images themselves, cre-
ating a substantial bandwidth savings.
• Offloading drawing tasks from the server to the client
reduces the load on the server, potentially saving on hard-
ware costs.
• Generating graphics on the client is consistent with the
Ajax application architecture in which servers provide
data and clients manage the presentation of that data.
• The client can rapidly and dynamically redraw graphics,
enabling graphically intense applications (such as games
and simulations) that are simply not feasible when each
frame has to be downloaded from a server.
• Writing graphics programs is fun, and the <canvas> tag
gives web developers some relief from the drudgery of
the DOM!
The <canvas> tag has no appearance of its own but creates a
drawing surface within the document and exposes a powerful
drawing API to client-side JavaScript. The <canvas> tag is
1

standardized by H T M L 5 but has been around for longer than
that. It was introduced by Apple in Safari 1.3, and has been
supported by Firefox since version 1.5 and Opera since version
9. It is also supported in all versions of Chrome. The
<canvas>
tag is not supported by IE before IE 9, but can be
reasonably well emulated in IE 6, 7, and 8.
Using the Canvas in IE
To use the <canvas> tag in IE 6, 7, or 8, download the open-
source ExplorerCanvas project from http://c0de.g00gle.c0m/p/
explorercanvas/.
After unpacking the project, include the
"excanvas" script in the <head> of your web pages using an
Internet Explorer conditional comment like this:
<!--[if lte IE 8]>
<script src="excanvas.compiled.]s"x/script>
<![endif]-->
With those lines at the top of your web pages, <canvas> tags
and basic Canvas drawing commands will work in IE. Radial
gradients and clipping are not supported. Line width does not
scale correctly when the X and Y dimensions are scaled by dif-
ferent amounts, and you can expect to see other minor ren-
dering differences in IE as well.
Most of the Canvas drawing API is defined not on the
<canvas>
element itself but instead on a "drawing context"
object obtained with the getContextQ method of the canvas.
Call getContextQ with the argument "2d" to obtain a
CanvasRenderingContext2D object that you can use to draw
two-dimensional graphics into the canvas. It is important to
understand that the canvas element and its context object are
two very different objects. Because it has such a long class
name, I do not often refer to the CanvasRenderingContext2D
object by name and instead simply call it the "context object."
Similarly, when I write about the "Canvas API" I usually mean
"the methods of the CanvasRenderingContext2D object."
Also, since the long class name CanvasRenderingContext2D
2 | Chapter 1: Canvas Tutorial

does not fit well on these narrow pages, the reference section
that follows this tutorial chapter abbreviates it as CRC.
3D Graphics in a Canvas
At the time of this writing, browser vendors are starting to im-
plement a 3D graphics API for the <canvas> tag The API is
known as WebGL, and is a JavaScript binding to the OpenGL
standard API. To obtain a context object for 3D graphics, pass
the string "webgl" to the getContext() method of the canvas.
WebGL is a large, complicated, and low-level API that is not
documented in this book: web developers are more likely to
use utility libraries built on top of WebGL than to use the
WebGL API directly.
As a simple example of the Canvas API, the following code
draws a red square and blue circle into <canvas> tags to produce
output like that shown in Figure 1-1:
<body>
This is a red square:
<canvas id="square" width=10 height=10></canvas>.
This is a blue circle:
<canvas id="circle" width=10 height=10></canvas>.
<script>
// Get first canvas element and its context
var canvas = document.getElementById("square");
var context = canvas.getContext("2d");
// Draw something in the canvas
context.fillStyle = "#f00"; // Set color to red
context.fillRect(0,0,10,10); // Fill a small square
// Get second canvas and its context
canvas = document.getElementById("circle");
context = canvas.getContext("2d");
// Begin a path and add a circle to it
context.beginPath();
context.arc(5, 5, 5, 0, 2*Math.PI, true);
context.fillStyle = "#00f"; // Set blue fill
context.fill(); // Fill the path
</script>
</body>
Canvas Tutorial | 3
I H I R I R l l
r
Q
c i r c l e s q u a r e . h t m l O
_
£ 5
Q .
H i i s i s a r e d s q u a r e : • . T h i s i s a b l u e c i r c l e :
Figure 1-1. Simple canvas graphics
The Canvas API describes complex shapes as a "path" of lines
and curves that can be drawn or filled. A path is defined by a
series of method calls, such as the beginPathQ and arc() in-
vocations in the preceding code. Once a path is defined, other
methods, such as fillQ, operate on that path. Various prop-
erties of the context object, such as fillStyle, specify how
these operations are performed. The subsections that follow
explain:
• How to define paths, how to draw or "stroke" the outline
of a path, and how to fill the interior of a path
• How to set and query the graphics attributes of the canvas
context object, and how to save and restore the current
state of those attributes
• Canvas dimensions, the default canvas coordinate system,
and how to transform that coordinate system
• The various curve-drawing methods defined by the
Canvas API
• Some special-purpose utility methods for drawing
rectangles
• How to specify colors, work with transparency, and draw
with color gradients and repeating image patterns
• The attributes that control line width and the appearance
of line endpoints and vertices
• How to draw text in a <canvas>
4 | Chapter 1: Canvas Tutorial

• How to "clip" graphics so that no drawing is done outside
of a region you specify
• How to add drop shadows to your graphics
• How to draw (and optionally scale) images into a canvas,
and how to extract the contents of a canvas as an image
• How to control the compositing process by which newly
drawn (translucent) pixels are combined with the existing
pixels in the canvas
• How to query and set the raw red, green, blue, and alpha
(transparency) values of the pixels in the canvas
• How to determine whether a mouse event occurred above
something you've drawn in a canvas
This chapter ends with a practical example that uses
<canvas>
tags to render small inline charts known as spark-
lines.
This tutorial chapter is followed by a reference section
that documents the Canvas API in complete detail.
Much of the <canvas> example code that follows operates
on a variable called c. This variable holds the
CanvasRenderingContext2D object of the canvas, but the code
to initialize that variable it is not typically shown. In order to
make these examples run, you would need to add H T M L
markup to define a canvas with appropriate width and height
attributes, and then add code like this to initialize the
variable c:
var canvas = document.getElementById("my_canvas_id");
var c = canvas.getContext('2d');
The figures that follow were all generated by JavaScript code
drawing into a <canvas> tag—typically into a large offscreen
canvas to produce high-resolution print-quality graphics.
Drawing Lines and Filling Polygons
To draw lines on a canvas and to fill the areas enclosed by those
lines, you begin by defining a path. A path is a sequence of one
or more subpaths. A subpath is a sequence of two or more
Drawing Lines and Filling Polygons | 5
points connected by line segments (or, as we'll see later, by
curve segments). Begin a new path with the beginPath()
method. Begin a new subpath with the moveTo() method. Once
you have established the starting point of a subpath with
moveTo(),
you can connect that point to a new point with a
straight line by calling lineTo(). The following code defines a
path that includes two line segments:
c.beginPath(); // Start a new path
c.moveTo(20, 20); // Begin a subpath at (20,20)
c.lineTo(l20, 120); // Add a line to (120,120)
c.lineTo(20, 120); // Another from there to (20,120)
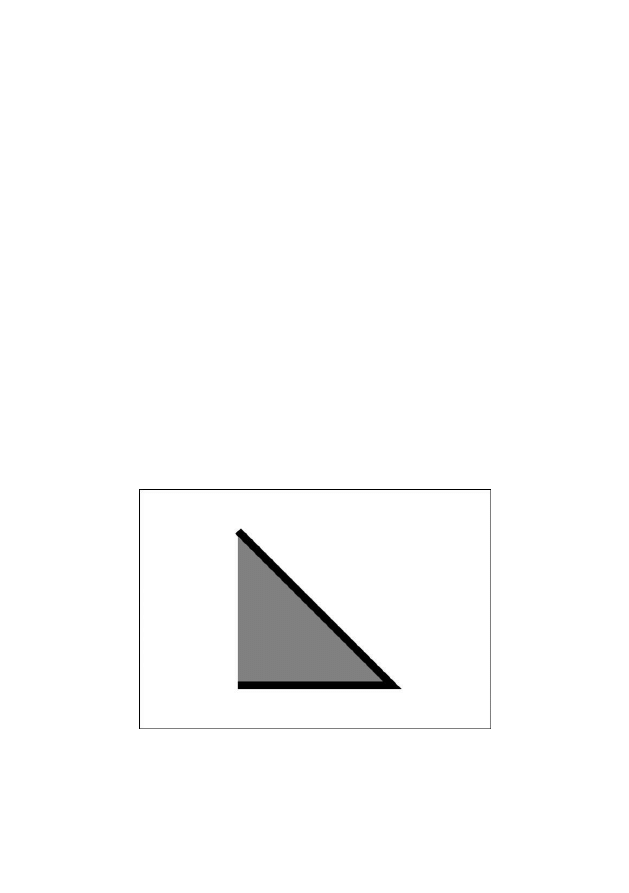
The preceding code simply defines a path; it does not draw
anything on the canvas. To draw (or "stroke") the two line
segments in the path, call the stroke () method, and to fill the
area defined by those line segments, call fill():
c.fill(); // Fill a triangular area
c.stroke(); // Stroke two sides of the triangle
The preceding code (along with some additional code to set
line widths and fill colors) produced the drawing shown in
Figure 1-2.
Figure 1-2. A simple path, filled and stroked
6 | Chapter 1: Canvas Tutorial

Notice that the subpath defined previously is "open." It con-
sists of just two line segments, and the endpoint is not
connected back to the starting point. This means that it does
not enclose a region. The fill() method fills open subpaths
by acting as if a straight line connected the last point in the
subpath to the first point in the subpath. That is why the pre-
ceding code fills a triangle, but strokes only two sides of the
triangle.
If you wanted to stroke all three sides of the triangle shown
previously, you would call the closePathQ method to connect
the endpoint of the subpath to the start point. (You could also
call lineTo(20,20), but then you end up with three line seg-
ments that share a start and endpoint but are not truly closed.
When drawing with wide lines, the visual results are better if
you use closePath().)
There are two other important points to notice about
strokeQ
and fillQ. First, both methods operate on all sub-
paths in the current path. Suppose we had added another
subpath in the code:
c.moveTo(300,100); // Begin a new subpath at (300,100)
c.lineTo(300,200); // Draw a vertical line to (300,200)
Then when we called strokeQ we would have drawn two con-
nected edges of a triangle and a disconnected vertical line.
The second point to note about strokeQ and fillQ is that
neither one alters the current path: you can call fillQ and the
path will still be there when you call strokeQ. When you are
done with a path and want to begin another you must remem-
ber to call beginPathQ. If you don't you'll end up adding new
subpaths to the existing path and you may end up drawing
those old subpaths over and over again.
Example 1-1 defines a function for drawing regular polygons
and demonstrates the use of moveToQ, lineToQ, and
closePathQ
for defining subpaths and of fillQ and
strokeQ
for drawing those paths. It produces the drawing
shown in Figure 1-3.
Drawing Lines and Filling Polygons | 7

Example 1-1. Regular polygons with moveToQ, UneToQ, and
closePathQ
// Define a regular polygon with n sides, centered at (x,y)
// with radius r. The vertices are equally spaced along the
// circumference of a circle. Put the first vertex straight
// up or at the specified angle. Rotate clockwise, unless
// the last argument is true.
function polygon(c,n,x,y,r,angle,counterclockwise) {
angle = angle || 0;
counterclockwise = counterclockwise || false;
// Compute vertex position and begin a subpath there
c.moveTo(x + r*Math.sin(angle),
y - r*Math.cos(angle));
var delta = 2*Math.PI/n; // Angle between vertices
for(var i = 1; i < n; i++) { // For remaining vertices
// Compute angle of this vertex
angle += counterclockwise?-delta:delta;
// Compute position of vertex and add a line to it
c.lineTo(x + r*Math.sin(angle),
y - r*Math.cos(angle));
}
c.closePath(); // Connect last vertex back to the first
}
// Start a new path and add polygon subpaths
c.beginPath();
polygon(c, 3, 50, 70, 50); // Triangle
polygon(c, 4, 150, 60, 50, Math.PI/4); // Square
polygon(c, 5, 255, 55, 50); // Pentagon
polygon(c, 6, 365, 53, 50, Math.PI/6); // Hexagon
// Add a small counterclockwise square inside the hexagon
polygon(c, 4, 365, 53, 20, Math.PI/4, true);
// Set properties that control how the graphics will look
c.fillStyle = "#ccc"; // Light-gray interiors
c.strokeStyle = "#008"; // outlined with dark-blue lines
c.lineWidth = 5; // five pixels wide.
// Now draw all the polygons (each in its own subpath)
c.fill(); // Fill the shapes
c.strokeQ; // And stroke their outlines
8 | Chapter 1: Canvas Tutorial

ADO®
Figure 1-3. Regular polygons
Notice that this example draws a hexagon with a square inside
it. The square and the hexagon are separate subpaths but they
overlap. When this happens (or when a single subpath inter-
sects itself) the canvas needs to be able to determine which
regions are inside the path and which are outside. The canvas
uses a test known as the "nonzero winding rule" to achieve
this. In this case, the interior of the square is not filled because
the square and the hexagon were drawn in opposite directions:
the vertices of the hexagon were connected with line segments
moving clockwise around the circle. The vertices of the square
were connected counterclockwise. Had the square been drawn
clockwise as well, the call to fill() would have filled the
interior of the square.
The Nonzero Winding Rule
To test whether a point P is inside a path, using the nonzero
winding rule, imagine a ray drawn from P, in any direction, off
to infinity (or, more practically, to some point outside of the
path's bounding box). Now initialize a counter to zero and
enumerate all places where the path crosses the ray. Each time
the path crosses the ray in a clockwise direction, add one to
the count. Each time the path crosses the ray counterclock-
wise, subtract one from the count. If, after all crossings have
been enumerated, the count is nonzero, then the point P is
inside the path. If, on the other hand, the count is zero, then
P is outside the path.
Drawing Lines and Filling Polygons | 9

Graphics Attributes
Example 1-1 set the properties fillStyle, strokeStyle, and
lineWidth
on the context object of the canvas. These properties
are graphics attributes that specify the color to be used by
fill(),
the color to be used by stroke(), and the width of the
lines to be drawn by strokeQ. Notice that these parameters are
not passed to the fillQ and strokeQ methods, but are instead
part of the general graphics state of the canvas. If you define a
method that draws a shape and do not set these properties
yourself, then the caller of your method can define the color of
the shape by setting the strokeStyle and fillStyle properties
before calling your method. This separation of graphics state
from drawing commands is fundamental to the Canvas API
and is akin to the separation of presentation from content ach-
ieved by applying cascading stylesheets (CSS) to H T M L
documents.
The Canvas API defines 15 graphics attribute properties on the
CanvasRenderingContext2D object. These properties are lis-
ted in Table 1-1 and explained in detail in the relevant sections
following.
Table 1-1. Graphics attributes of the Canvas API
Property Meaning
f i l l S t y l e The color, gradient, or pattern for fills
f o n t The CSSfontfortext-drawing commands
g l o b a l A l p h a Transparency to be added to all pixels
globalCompositeOperation
lineCap
lineJoin
lineWidth
miterLimit
textAlign
textBaseline
drawn
How to combine pixel colors
How the ends of lines are rendered
How vertices are rendered
The width of stroked lines
Maximum length of acute mitered vertices
Horizontal alignment of text
Vertical alignment of text
10 | Chapter 1: Canvas Tutorial

Property
shadowBlur
Meaning
How crisp or fuzzy shadows are
fhe color of drop shadows
f he horizontal offset of shadows
fhe vertical offset of shadows
fhe color, gradient, or pattern for lines
shadowColor
shadowOffsetX
shadowOffsetY
strokeStyle
Since the Canvas API defines graphics attributes on the context
object, you might be tempted to call getContextQ multiple
times to obtain multiple context objects. If you could do this,
then you could define different attributes on each context: each
context would then be like a different brush and would paint
with a different color, or draw lines of different widths. Un-
fortunately, you cannot use the canvas in this way. Each
<canvas>
tag has only a single context object, and every call to
getContextQ
returns the same CanvasRenderingContext2D
object.
Although the Canvas API only allows you to define a single set
of graphics attributes at a time, it does allow you to save the
current graphics state so that you can alter it and then easily
restore it later. The saveQ method pushes the current graphics
state onto a stack of saved states. The restoreQ method pops
the stack and restores the most recently saved state. All of the
properties listed in Table 1-1 are part of the saved state, as are
the current transformation and clipping region (both are ex-
plained later). Importantly, the currently defined path and the
current point are not part of the graphics state and cannot be
saved and restored.
If you need more flexibility than a simple stack of graphics
states allows, you may find it helpful to define utility methods
like the ones shown in Example 1-2.
Example 1-2. Graphics state management utilities
// Revert to the last saved graphics state,
// without popping the stack of saved states.
CanvasRenderingContext2D.prototype.revert = functionQ {
Graphics Attributes | 11

this.restore(); // Restore the old graphics state
this.save(); // Save it again so we can go back to it
return this; // Allow method chaining
// Set the graphics attributes specified by the properties
// of the object o. Or, if no argument is passed, return
// the current attributes as an object. Note that this does
// not handle the transformation or clipping region.
CanvasRenderingContext2D.prototype.attrs = function(o) {
if (o) {
for(var a in o) // For each property in o
this[a] = o[a]; // Set it as an attribute
return this; // Enable method chaining
}
else return {
fillStyle: this.fillStyle,
font: this.font,
globalAlpha: this.globalAlpha,
globalCompositeOperation:
this.globalCompositeOperation,
lineCap: this.lineCap,
lineDoin: this.lineDoin,
lineWidth: this.lineWidth,
miterLimit: this.miterLimit,
textAlign: this.textAlign,
textBaseline: this.textBaseline,
shadowBlur: this.shadowBlur,
shadowColor: this.shadowColor,
shadowOffsetX: this.shadowOffsetX,
shadowOffsetY: this.shadowOffsetY,
strokeStyle: this.strokeStyle
};
};
Canvas Dimensions and Coordinates
T h e width a n d height a t t r i b u t e s of t h e <canvas> tag and t h e
c o r r e s p o n d i n g width a n d height p r o p e r t i e s of t h e C a n v a s o b -
j e c t s p e c i f y t h e d i m e n s i o n s o f t h e c a n v a s . T h e default c a n v a s
c o o r d i n a t e s y s t e m p l a c e s t h e origin ( 0 , 0 ) a t t h e upper-left c o r -
n e r of t h e c a n v a s . X c o o r d i n a t e s i n c r e a s e to t h e right a n d Y
c o o r d i n a t e s i n c r e a s e a s y o u g o d o w n t h e s c r e e n . P o i n t s o n t h e
12 | Chapter 1: Canvas Tutorial

canvas can be specified using floating-point values, and these
are not automatically rounded to integers—the canvas uses
anti-aliasing techniques to simulate partially filled pixels.
The dimensions of a canvas are so fundamental that they can-
not be altered without completely resetting the canvas. Setting
either the width or height properties of a canvas (even setting
them to their current value) clears the canvas, erases the current
path, and resets all graphics attributes (including current trans-
formation and clipping region) to their original state.
Despite this fundamental importance, canvas dimensions do
not necessarily match either the onscreen size of the canvas or
the number of pixels that make up the canvas drawing surface.
Canvas dimensions (and also the default coordinate system)
are measured in CSS pixels. CSS pixels are usually the same
thing as regular pixels. On high-resolution displays, however,
implementations are allowed to map multiple device pixels to
single CSS pixels. This means that the rectangle of pixels that
the canvas draws into may be larger than the canvas's nominal
dimensions. You need to be aware of this when working with
the pixel-manipulation features (see "Pixel Manipula-
tion" on page 43) of the canvas, but the distinction between
virtual CSS pixels and actual hardware pixels does not other-
wise have any effect on the canvas code you write.
By default a <canvas> tag is displayed onscreen at the size (in
CSS pixels) specified by its H T M L width and height attributes.
Like any H T M L element, however, a <canvas> tag can have its
onscreen size specified by CSS width and height style attrib-
utes. If you specify an onscreen size that is different than the
actual dimensions of the canvas, then the pixels of the canvas
are automatically scaled as needed to fit the screen dimensions
specified by the CSS attributes. The onscreen size of the canvas
does not affect the number of CSS or hardware pixels reserved
in the canvas bitmap, and the scaling that is done is an image
scaling operation. If the onscreen dimensions are substantially
larger than the actual dimensions of the canvas, this results in
pixelated graphics. This is an issue for graphic designers and
does not affect canvas programming.
Canvas Dimensions and Coordinates | 13

Coordinate System Transforms
As noted above, the default coordinate system of a canvas
places the origin in the upper-left corner, has X coordinates
increasing to the right, and has Y coordinates increasing down-
ward. In this default system, the coordinates of a point map
directly to a CSS pixel (which then maps directly to one or more
device pixels). Certain canvas operations and attributes (such
as extracting raw pixel values and setting shadow offsets) al-
ways use this default coordinate system. In addition to the de-
fault coordinate system, however, every canvas has a "current
transformation matrix" as part of its graphics state. This matrix
defines the current coordinate system of the canvas. In most
canvas operations, when you specify the coordinates ofapoint,
it is taken to be a point in the current coordinate system, not
in the default coordinate system. The current transformation
matrix is used to convert the coordinates you specified to the
equivalent coordinates in the default coordinate system.
The setTransformQ method allows you to set a canvas's trans-
formation matrix directly, but coordinate system transforma-
tions are usually easier to specify as a sequence of translations,
rotations and scaling operations. Figure 1-4 illustrates these
operations and their effect on the canvas coordinate system.
The program that produced the figure drew the same set of
axes seven times in a row. The only thing that changed each
time was the current transform. Notice that the transforms
affect the text as well as the lines that are drawn.
The translateQ method simply moves the origin of the coor-
dinate system left, right, up, or down. The rotateQ method
rotates the axes clockwise by the specified angle. (The Canvas
API always specifies angles in radians. To convert degrees to
radians, divide by 180 and multiply by Math. PI.) The scaleQ
method stretches or contracts distances along the X or Y axes.
Passing a negative scale factor to the scaleQ method flips that
axis across the origin, as if it were reflected in a mirror. This is
what was done in the lower-left of Figure 1-4: translateQ was
14 | Chapter 1: Canvas Tutorial
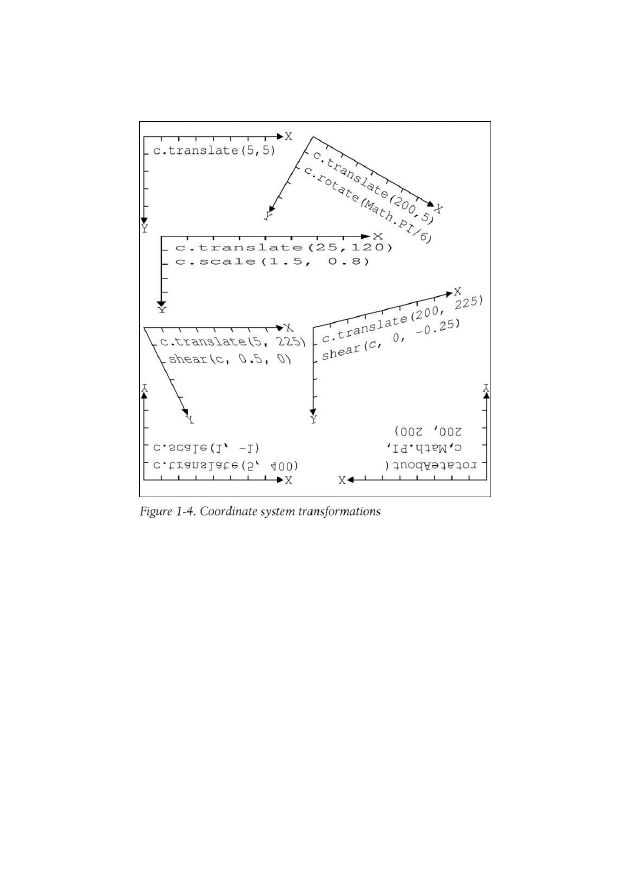
used to move the origin to the bottom-left corner of the canvas,
and then scale() was used to flip the Y axis around so that Y
coordinates increase as we go up the page. A flipped coordinate
system like this is familiar from algebra class and may be useful
for plotting data points on charts. Note, however, that it makes
text difficult to read!
Understanding Transformations Mathematically
1 find it easiest to understand transforms geometrically and to
think about translate(), rotate(), and scale() as transform-
ing the axes of the coordinate system as illustrated in
Figure 1-4. It is also possible to understand transforms alge-
braically as equations that map the coordinates of a point
Coordinate System Transforms | 15

(x,y)
in the transformed coordinate system back to the coor-
dinates of the same point (x' , y ' ) in the previous coordinate
system.
The method call c.translate(dx,dy) can be described with
these equations:
// (0,0) in the new system is (dx,dy) in the old
x' = x + dx;
y' = y + dy;
Scaling operations have similarly simple equations. A call
c. scale(sx,sy)
can be described like this:
x' = sx * x;
y' = sy * y;
Rotations are more complicated. The call c.rotate(a) is de-
scribed by these trigonometric equations:
x' = x * cos(a) - y * sin(a);
y' = y * cos(a) + x * sin(a);
Notice that the order of transformations matters. Suppose we
start with the default coordinate system of a canvas, and then
translate it and then scale it. In order to map the point (x,y)
in the current coordinate system back to the point (x' ' ,y' ')
in the default coordinate system, we must first apply the scaling
equations to map the point to an intermediate point ( x ' , y ' )
in the translated but unsealed coordinate system, and then use
the translation equations to map from this intermediate point
to (x' ' ,y' '). The result is this:
x'' = sx*x + dx;
y'' = sy*y + dy;
If, on the other hand, we'd called scaleQ before calling
translateQ,
the resulting equations would be different:
x'' = sx*(x + dx);
y'' =
s
Y*(y + dy);
The key thing to remember when thinking algebraically about
sequences of transformations is that you must work backward
from the last (most recent) transformation to the first. When
16 | Chapter 1: Canvas Tutorial

thinking geometrically about transformed axes, however, you
work forward from first transformation to last.
The transformations supported by the canvas are known as
affine transforms.
Affine transforms may modify the distances
between points and the angles between lines, but parallel lines
always remain parallel after an affine transformation—it is not
possible, for example, to specify a fish-eye lens distortion with
an affine transform. An arbitrary affine transform can be de-
scribed by the six parameters a through f in these equations:
x' = ax + cy + e
y' = bx + dy + f
You can apply an arbitrary transformation to the current
coordinate system by passing those six parameters to the
transformQ
method. Figure 1-4 illustrates two types of
transformations—shears and rotations about a specified
point—that you can implement with the transformQ method
like this:
// Shear transform:
// x' = x + kx*y;
// y' = y + ky*x;
function shear(c, kx, ky) {
c.transform(l, ky, kx, 1, 0, o);
}
// Rotate theta radians clockwise around (x,y).
// This can also be accomplished with a translate,
// rotate, translate back sequence of transformations,
function rotateAbout(c, theta, x, y) {
var ct = Math.cos(theta), st = Math.sin(theta);
c.transform(ct, -st, st, ct,
-x*ct-y*st+x, x*st-y*ct+y);
}
The setTransformQ method takes the same arguments as
transformQ,
but instead of transforming the current coordi-
nate system, it ignores the current system, transforms the de-
fault coordinate system, and makes the result the new current
coordinate system. setTransformQ is useful to temporarily
reset the canvas to its default coordinate system:
Coordinate System Transforms | 17

c.save(); // Save current coordinate system
// Revert to the default coordinate system
c.setTransform(l,0,0,1,0,0);
// Now draw using default CSS pixel coordinates
c.restoreQ; // Restore the saved coordinate system
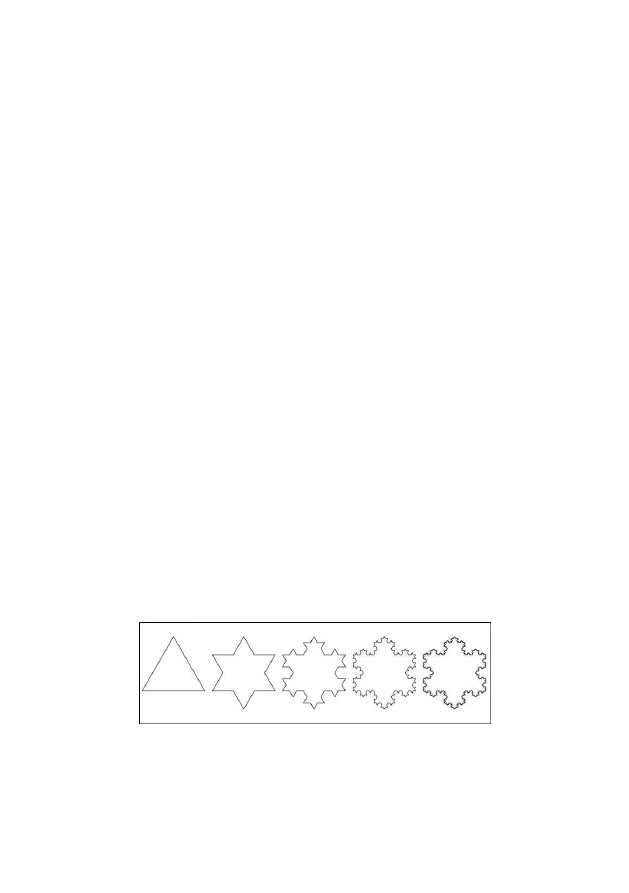
Transformation Example
Example 1-3 demonstrates the power of coordinate system
transformations by using the translateQ, rotateQ, and
scaleQ
methods recursively to draw a Koch snowflake fractal.
The output of this example appears in Figure 1-5, which shows
Koch snowflakes with 0, 1, 2, 3, and 4 levels of recursion.
The code that produces these figures is elegant but its use of
recursive coordinate system transformations makes it some-
what difficult to understand. Even if you don't follow all the
nuances, note that the code includes only a single invocation
of the linefoQ method. Every single line segment in
Figure 1-5 is drawn like this:
c.lineTo(len, o);
The value of the variable len does not change during the exe-
cution of the program, so the position, orientation, and length
of each of the line segments is determined by translations,
rotations, and scaling operations.
Example 1-3.
A Koch snowflake with transformations
var deg = Math.PI/180; // For converting degrees to radians
// Draw a level-n Koch Snowflake fractal in the context c,
// with lower-left corner at (x,y) and side length len.
function snowflake(c, n, x, y, len) {
c.save(); // Save current transformation
c.translate(x,y); // Translate to starting point
c.moveTo(0,0); // Begin a new subpath there
leg(n); // Draw the first leg of the fractal
c.rotate(-120*deg); // Rotate 120 degrees anticlockwise
leg(n); // Draw the second leg
c.rotate(-120*deg); // Rotate again.
leg(n); // Draw the final leg
c.closePathQ; // Close the subpath
18 | Chapter 1: Canvas Tutorial
c.restoreQ;
// Restore original transformation
// Draw a single leg of a level-n Koch snowflake.
// This function leaves the current point at the end of
// the leg it has drawn and translates the coordinate
// system so the current point is (0,0). This means you
// can easily call rotate() after drawing a leg.
function leg(n) {
c.save();
if (n == 0) {
c.lineTo(len, 0);
}
else { // Recursive case:
// draw 4 sub-legs like:
// Save current transform
// Non-recursive case:
// Dust a horizontal line
V
// Sub-legs are l/3rd size
// Draw the first sub-leg
// Turn 60 degrees clockwise
// Draw the second sub-leg
c.scale(l/3,l/3);
leg(n-l);
c.rotate(60*deg);
leg(n-l);
c.rotate(-I20*deg); // Rotate 120 degrees back
leg(n-l);
c.rotate(60*deg);
leg(n-l);
}
c.restore();
c.translate(len, 0);
// Third sub-leg
// Back to original heading
// Final sub-leg
// Restore the transform
// Translate to end of leg
// Draw snowflake fractals
snowflake(c,0,5,H5,l25);
snowflake(c,1,145,115,125)
snowflake(c,2,285,H5,l25)
snowflake(c,3,425,115,125)
snowflake(c,4,565,H5,l25)
c.strokeQ;
:
level 0 through 4
// Equilateral triangle
// A 6-sided star
// Kind of a snowflake
// More snowflake-like
// This looks really fractal!
// Stroke this complicated path
Figure 1 -5. Koch snow flakes
Coordinate System Transforms | 19

Drawing and Filling Curves
A path is a sequence of subpaths, and a subpath is a sequence
of connected points. In the paths we defined in Examples 1-1
and 1-3, those points were connected with straight line seg-
ments, but that need not always be the case. The CanvasRen-
deringContext2D object defines a number of methods that add
a new point to the subpath and connect the current point to
that new point with a curve:
arc()
This method adds an arc to the current subpath. It con-
nects the current point to the beginning of the arc with a
straight line, and then connects the beginning of the arc
to the end of the arc with a portion of a circle, leaving the
end of the arc as the new current point. The arc to be
drawn is specified with six parameters: the X and Y
coordinates of the center of a circle, the radius of the circle,
the start and end angles of the arc, and the direction
(clockwise or counterclockwise) of the arc between those
two angles.
arcTo()
This method draws a straight line and a circular arc just
like the arc() method does, but specifies the arc to be
drawn using different parameters. The arguments to
arcToQ
specify points PI and P2 and a radius. The arc that
is added to the path has the specified radius and is tangent
to the line between the current point and P I , and also the
line between PI and P2. This unusual-seeming method of
specifying arcs is actually quite useful for drawing shapes
with rounded corners. If you specify a radius of 0, then
this method just draws a straight line from the current
point to PI. With a nonzero radius, however, it draws a
straight line from the current point in the direction of P I ,
then curves that line around in a circle until it is heading
in the direction of P2.
20 | Chapter 1: Canvas Tutorial
bezierCurveTo()
This method adds a new point P to the subpath and con-
nects it to the current point with a cubic Bezier curve. The
shape of the curve is specified by two "control points" CI
and C2. At the start of the curve (at the current point), the
curve heads in the direction of C I . At the end of the curve
(at point P) the curve arrives from the direction of C2. In
between these points the direction of the curve varies
smoothly. The point P becomes the new current point for
the subpath.
quadraticCurveTo()
This method is like bezierCurveTo(), but it uses a quad-
ratic Bezier curve instead of a cubic Bezier curve and has
only a single control point.
You can use these methods to draw paths like those in
Figure 1-6.
O
*GD
Figure 1 -6. Curved paths in a canvas
Example 1-4 shows the code used to create Figure 1-6. The
methods demonstrated in this code are some of the most com-
plicated in the Canvas API; see the reference section for com-
plete details on the methods and their arguments.
Drawing and Filling Curves | 21

Example 1-4. Adding curves to a path
// A utility function to convert from degrees to radians
function rads(x) { return Math.PI*x/180; }
// Draw a circle. Scale and rotate if you want an ellipse
// instead. There is no current point, so this draws just
// the circle with no straight line from the current point
// to the start of the circle.
c.beginPath();
c.arc(75,100,50, // Center at (75,100), radius 50
0,rads(360),false); // Co clockwise from 0 to 360°
// Draw a wedge. Angles are measured clockwise from the
// positive x axis. Note that arc() adds a line from the
// current point to the arc start.
c.moveTo(200, 100); // Start at center of the circle
c.arc(200, 100, 50, // Circle center and radius
rads(-60), rads(o), // start at -60° and go to 0°
false); // false means clockwise
c.closePath(); // Co back to the circle center
// Same wedge, opposite direction
c.moveTo(325, 100);
c.arc(325, 100, 50, rads(-60), rads(o), true);
c.closePath();
// Use arcTo() for rounded corners. Here we draw a square
// with upper-left at (400,50) and various corner radii.
c.moveTo(450, 50); // Begin in middle of the top
c.arcTo(500,50,500,150,30); // Top and upper-right corner
c.arcTo(500,150,400,150,20); // Right and lower-right corner
c.arcTo(400,150,400,50,10); // Bottom and lower-left corner
c.arcTo(400,50,500,50,0); // Left and upper-left corner
c.closePath(); // The rest of the top edge
// Quadratic Bezier curve: one control point
c.moveTo(75, 250); // Begin at (75,250)
c.quadraticCurveTo(lOO,200, 175, 250); // Curve to (175,250)
c.fillRect(l00-3,200-3,6,6); // Mark the control point
// Cubic Bezier curve: two control points
c.moveTo(200, 250); // Start point
c.bezierCurveTo(220,220,280,280,300,250); // To (300,250)
c.fillRect(220-3,220-3,6,6); // Mark control points
c.fillRect(280-3,280-3,6,6);
22 | Chapter 1: Canvas Tutorial

// Define some graphics attributes and draw the curves
c.fillStyle = "#aaa"; // Cray fills
c.lineWidth = 5; // 5-pixel black (by default) lines
c.fill(); // Fill the curves
c.strokeQ; // Stroke their outlines
Rectangles
CanvasRenderingContext2D defines four methods for draw-
ing rectangles. Example 1-4 used one of them, fillRectQ, to
mark the control points of the Bezier curves. All four of these
rectangle methods expect two arguments that specify one cor-
ner of the rectangle followed by the rectangle width and height.
Normally, you specify the upper-left corner and then pass a
positive width and positive height, but you may also specify
other corners and pass negative dimensions.
fillRectQ
fills the specified rectangle with the current
fillStyle. strokeRectQ
strokes the outline of the specified
rectangle using the current strokeStyle and other line attrib-
utes. clearRect( is like fillRectQ, but it ignores the current
fill style and fills the rectangle with transparent black pixels
(the default color of all blank canvases). The important thing
about these three methods is that they do not affect the current
path or the current point within that path.
The final rectangle method is named rectQ, and it does affect
the current path: it adds the specified rectangle, in a subpath
of its own, to the path. Like other path-definition methods, it
does not fill or stroke anything itself.
Colors, Transparency, Gradients,
and Patterns
The strokeStyle and fillStyle attributes specify how lines are
stroked and regions are filled. Most often, these attributes are
used to specify opaque or translucent colors, but you can also
Colors, Transparency, Gradients, and Patterns | 23

set them to CanvasPattern or CanvasGradient objects to stroke
or fill with a repeated background image or with a linear or
radial color gradient. In addition, you can set the globalAlpha
property to make everything you draw translucent.
To specify a solid color, use one of the color names defined by
the HTML4 standard," or use a CSS color string:
context.strokeStyle = "blue"; // Stroke lines in blue
context.fillStyle = "#aaa"; // Fill with light gray
The default value for both strokeStyle and fillStyle is
" # 0 0 0 0 0 0 " : opaque black.
Current browsers support CSS3 colors and allow the use of the
RGB, RGBA, HSL, and HSLA color spaces in addition to basic
hexadecimal RGB colors. Here are some example color strings:
"#f44" // Hexadecimal RGB value: red
"#44ff44" // RRGCBB value: green
"rgb(60, 60, 255)" // RGB as integers: blue
"rgb(l00%, 25%, 100%)" // RGB as percentages: purple
"rgba(100%,25%,100%,0.5)" // Plus alpha 0-1: translucent
"rgba(0,0,0,0)" // Transparent black
"transparent" // Synonym for the above
"hsl(60, 100%, 50%)" // Fully saturated yellow
"hsl(60, 75%, 50%)" // Less saturated yellow
"hsl(60, 100%, 75%)" // Fully saturated, lighter
"hsl(60, 100%, 25%)" // Fully saturated, darker
"hsla(60,100%,50%,0.5)" // 50% opaque
The HSL color space specifies a color with three numbers that
specify its hue, saturation, and lightness. Hue is an angle in
degrees around a color wheel. A hue of 0 is red, 60 is yellow,
120 is green, 180 is cyan, 240 is blue, 300 is magenta, and 360
is back to red again. Saturation describes the intensity of the
color, specified as a percentage. Colors with 0% saturation are
shades of gray. Lightness describes how light or dark a color is
and is also specified as a percentage. Any HSL color with 1 0 0 %
lightness is pure white and any color with 0% lightness is pure
* Aqua, black, blue, fuchsia, gray, green, lime, maroon, navy, olive, purple,
red, silver, teal, white, and yellow
24 | Chapter 1: Canvas Tutorial

black. The HSLA color space is just like HSL, but adds an alpha
value that ranges from 0.0 (transparent) to 1.0 (opaque).
If you want to work with translucent colors, but do not want
to explicitly specify an alpha channel for each color, or if you
want to add translucency to opaque images or patterns (for
example) you can set the globalAlpha property. Every pixel you
draw will have its alpha value multiplied by globalAlpha. The
default is 1, which adds no transparency. If you set
globalAlpha
to 0, then everything you draw will be fully trans-
parent and nothing will appear in the canvas. If you set this
property to 0.5, then pixels that would otherwise have been
opaque will be 5 0 % opaque. And pixels that would have been
5 0 % opaque will be 2 5 % opaque instead. If you set
globalAlpha
to a value less than 1, then all your pixels will be
translucent and you may have to consider how those pixels are
combined (or "composited") with the pixels they are drawn
over—see "Compositing" on page 39 for details about Can-
vas compositing modes.
Instead of drawing with solid (but possibly translucent) colors,
you can also use color gradients and repeating images when
filling and stroking paths. Figure 1-7 shows a rectangle stroked
with wide lines and a patterned stroke style on top of a linear
gradient fill and underneath a translucent radial gradient fill.
The code fragments below show how the pattern and gradients
were created.
To fill or stroke using a background image pattern instead of
a color, set fillStyle or strokeStyle to the CanvasPattern ob-
ject returned by the createPatternQ method of the context
object:
var image = document.getElementById("myimage");
c.fillStyle = c.createPattern(image, "repeat");
The first argument to createPatternQ specifies the image to
use as the pattern. It must be an <img>, <canvas>, or <video>
element from the document (or an image object created with
the ImageQ constructor). The second argument is typically
"repeat" for a repeating image fill that is independent of the
Colors, Transparency, Gradients, and Patterns | 25
• •••••••••••••••••:::• nnna ::::)•••••••••••••••
nncjuaaaaaan -n•••••••••••••••
• ••••••••••••• T
1
• n•••••••• a• ••••••• c n•••••• a•••••• •
• ••••••••• r:' ¡ • • • ^ • • • • • • • • • • l j l j l ; j : ) • • • • • • • • •
••••••••••: ' •••••••••••••••••••••••now naaaaaaaDa
• •••••••r?r:j••••••••••••••••••••••••[_;jautic :••••••••
•••••••n .;•:;••••••••••••••••••••••••• l: ;!•••[• •••••••
• ••••i: ' j •••••••••••••••••••••!:::: )• ]•••••
• ••••
j ;:::••••••••••••••••••••••••••• u: ]•••••
• ••• •
• • • l: : J • •
• •tr .:•••
•••
••: •••••
• • .;•••••
• r .:•••••
•: •••••
• : :;••••••
• :jaaaaaa
• .:]••••••
C :•••••••
C :•••••••
; :•••••••
:•••••••
L :•••••••
u :•••••••
D :•••••••
• •••••••
• . ::••••••
• i :;••••••
• • :••••••
•• •••••
••L :•••••
••• :;}••••
• • •. ::••••
• ••u ::•••
• • • • l. : • • •
•••••; :•••
• •• •••
• ••••l:; :••
• •••••:: •
• ••••a:: ;•
• ••••••;:
• •••••• l;
• • • • • • •
• •••••• :
•••••••j;
• ••••••::
•••••••a:
• ••••••• LJ
•••••••:
j
• ••••a;: ••
• • • • • • : • • •
• ••••;: ;•••
• ••::: ;•••
• •••:: jaaaa
••••jaaaaa
• ••••; ••: j ••••••••••••••••••••••••••••••c:: )•••••
• •••••L-aa:: •••••••••••••••••••••••••••••::::' .••••••
••••••••••••••••••••••••••••••••••••••'IOC .••••••••
• ••••••••L>. J • • • ••••••••••••••••••••••• •••••••••••
• ••••••••••••••••••••••••••••••••Dnaaac •••••••••••
• •••••••••••••••••••••••••••••••••••c. •••••••••••••
••••••••••••••^••••••••••nnaaaaaaaD^••••••••••••••
•••••••••••••••••••••••••••••••••••••••••••••••••a
•••••••••••••••••••••••••••••••••••••••••••••••••a
Figure 1-7. Pattern and gradient fills
size of the image, but you can also use "repeat-x", "repeat-y",
or "no-repeat".
Note that you can use a <canvas> tag (even one that has never
been added to the document and is not visible) as the pattern
source for another <canvas>:
// Create an offscreen canvas and set its size
var offscreen = document.createElement("canvas");
offscreen.width = offscreen.height = 10;
// Get its context and draw into it
offscreen.getContext("2d").strokeRect(0,0,6,6);
// Use it as a pattern
var pattern = c.createPattern(offscreen,"repeat");
26 | Chapter 1: Canvas Tutorial

To fill (or stroke) with a color gradient, set fillStyle (or
strokeStyle)
to a CanvasGradient object returned by the
createLinearGradient()
or createRadialGradient() methods
of the context. Creating gradients is a multistep process, and
using them is trickier than using patterns.
The first step is to create the CanvasGradient object. The ar-
guments to createLinearGradientQ are the coordinates of two
points that define a line (it does not need to be horizontal or
vertical) along which the colors will vary. The arguments to
createRadialGradientQ
specify the centers and radii of two
circles. (They need not be concentric, but the first circle typi-
cally lies entirely inside the second.) Areas inside the smaller
circle or outside the larger will be filled with solid colors: areas
between the two will be filled with a color gradient.
After creating the CanvasGradient object and defining the
regions of the canvas that will be filled, define the gradient col-
ors by calling the addColorStopQ method of the CanvasGradi-
ent. The first argument to this method is a number between
0.0 and 1.0. The second is a CSS color specification. You must
call this method at least twice to define a simple color gradient,
but you may call it more than that. The color at 0.0 will appear
at the start of the gradient, and the color at 1.0 will appear at
the end. If you specify additional colors, they will appear at the
specified fractional position. Elsewhere, colors will be
smoothly interpolated. Here are some examples:
// A linear gradient, diagonally across the canvas
// (assuming no transforms)
var bgfade = c.createLinearGradient(0,0,canvas.width,
canvas.height);
// Start with light blue in upper-left and fade to
// white in lower-right
bgfade.addColorStop(0.0, "#88f");
bgfade.addColorStop(l.0, "#fff");
// A gradient between two concentric circles.
// Transparent in the middle, fading to translucent
// gray and then back to transparent,
var peekhole = c.createRadialGradient(300,300,100,
300,300,300);
Colors, Transparency, Gradients, and Patterns | 27

peekhole.addColorStop(o.0, "transparent");
peekhole.addColorStop(o.7, "rgba(100,100,100,.9)");
peekhole.addColorStop(l.0, "rgba(o,0,0,o)");
An important point to understand about gradients is that they
are not position-independent. When you create a gradient, you
specify bounds for the gradient. If you then attempt to fill an
area outside of those bounds you'll get the solid color defined
at one end or the other of the gradient. If you define a gradient
along the line between (0,0) and (100,100), for example, you
should only use that gradient to fill objects located within the
rectangle (0,0,100,100).
The graphic shown in Figure 1-7 was created with the code
below (using the pattern pattern and the bgfade and peek
hole
gradients defined above):
c.fillStyle = bgfade; // Use the linear gradient
c.fillRect(o,0,600,600); // to fill the entire canvas,
c.strokeStyle = pattern; // Use the pattern
c.lineWidth = 100; // and really wide lines
c.strokeRect(l00,100, // to draw a big square.
400,400);
c.fillStyle = peekhole; // Use the translucent radial
c.fillRect(0,0,600,600); // gradient to fill canvas.
Line-Drawing Attributes
You've already seen the lineWidth property, which specifies the
width of the lines drawn by stroke() and strokeRect(). In ad-
dition to lineWidth (and strokeStyle, of course) there are three
other graphics attributes that affect line drawing.
The default value of the lineWidth property is 1, and you can
set it to any positive number, even fractional values less than
1. (Lines that are less than one pixel wide are drawn with
translucent colors, so they look less dark than 1-pixel-wide
lines). To fully understand the lineWidth property, it is impor-
tant to visualize paths as infinitely thin one-dimensional lines.
The lines and curves drawn by the strokeQ method are cen-
tered over the path, with half of the lineWidth on either side.
If you're stroking a closed path and only want the line to appear
28 | Chapter 1: Canvas Tutorial
outside the path, stroke the path first and then fill with an
opaque color to hide the portion of the stroke that appears
inside the path. Or if you only want the line to appear inside a
closed path, call the save() and clip() methods (see "Clip-
ping" on page 32) first and then call stroke () and
restore().
Line widths are affected by the current transformation, as you
may be able to make out in the scaled axes at the upper-right
of Figure 1-4. If you call scale(2,l) to scale the X dimension
and leave Y unaffected, then vertical lines will be twice as wide
as horizontal lines drawn with the same lineWidth setting. It is
important to understand that line width is determined by the
lineWidth
and the current transform at the time stroke() is
called, not at the time that lineTo() or another path-building
method is called.
The other three line-drawing attributes affect the appearance
of the unconnected ends of paths and the vertices where two
path segments meet. The have very little visual impact for nar-
row lines, but make a big difference when you are drawing with
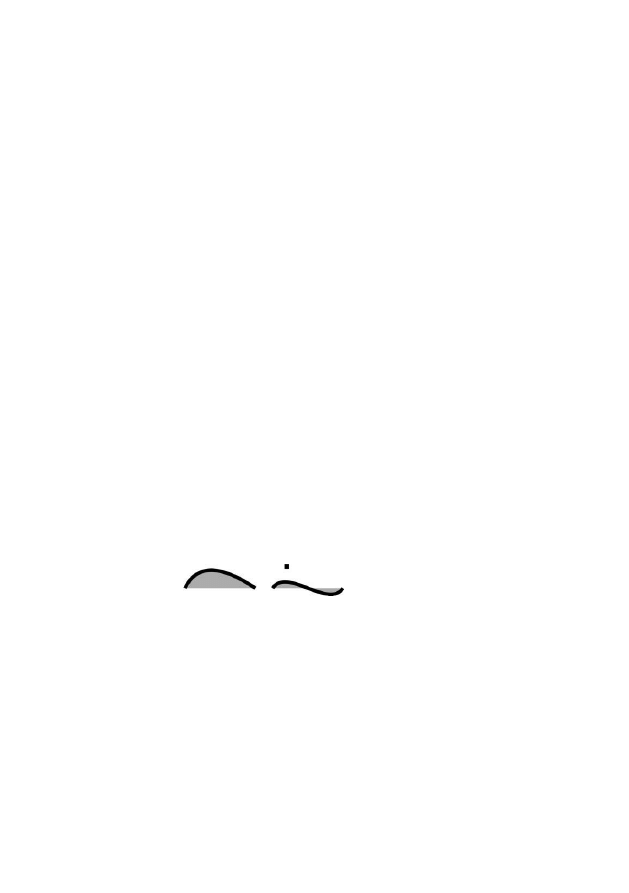
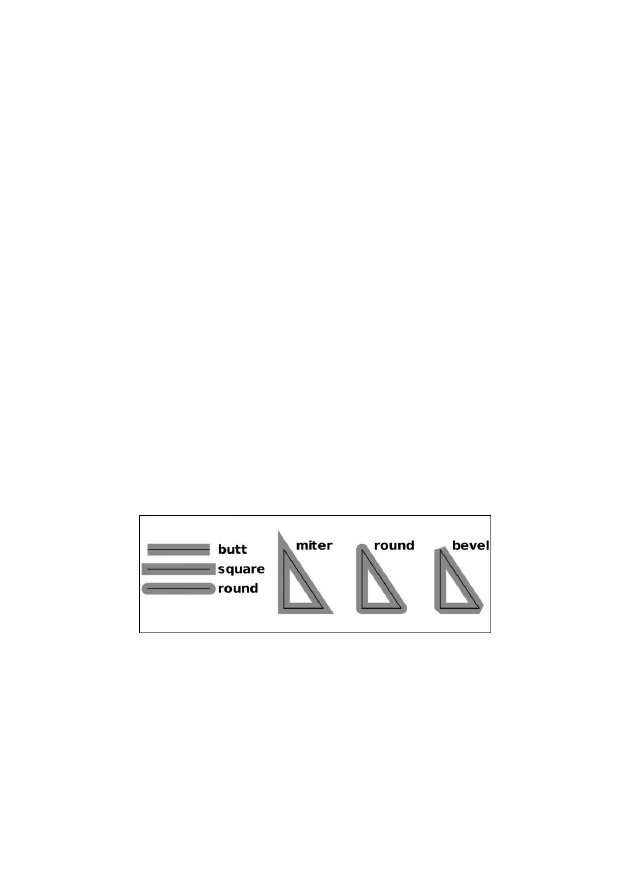
wide lines. Two of these properties are illustrated in
Figure 1-8. The figure shows the path as a thin black line and
the stroke as the gray area that surrounds it.
Figure 1-8. The lineCap and linejoin attributes
The lineCap property specifies how the ends of an open sub-
path are "capped." The value "butt" (the default) means that
the line terminates abruptly at the endpoint. The value
"square" means that the line extends, by half of the line width,
beyond the endpoint. And the value "round" means that the
Line-Drawing Attributes | 29

line is extended with a half circle (of radius one-half the line
width) beyond the endpoint.
The lineJoin property specifies how the vertices between sub-
path segments are connected. The default value is "miter",
which means that the outside edges of the two path segments
are extended until they meet at a point. The value "round"
means that the vertex is rounded off, and the value "bevel"
means that the vertex is cut off with a straight line.
The final line-drawing property is miterLimit, which only ap-
plies when lineJoin is "miter". When two lines meet at a sharp
angle, the miter between them can become quite long, and
these long, jagged miters are visually distracting. The
miterLimit
property places an upper bound on miter length. If
the miter at a given vertex would be longer than half of the line
width times miterLimit, then that vertex will be drawn with a
beveled join instead of a mitered join.
Text
To draw text in a canvas, you normally use the fillTextQ
method, which draws text using the color (or gradient or pat-
tern) specified by the fillStyle property. For special effects at
large text sizes, you can use strokeTextQ to draw the outline
of the individual text glyphs (an example of outlined text ap-
pears in Figure 1-10). Both methods take the text to be drawn
as their first argument and take the X and Y coordinates of the
text as the second and third arguments. Neither method affects
the current path or the current point. As you can see in Fig-
ure 1-4, text is affected by the current transformation.
The font property specifies the font to be used for text drawing.
The value should be a string in the same syntax as the CSS
font
attribute. Some examples:
"48pt sans-serif"
"bold 18px Times Roman"
"italic 12pt monospaced"
// bolder and smaller than the <canvas> font
"bolder smaller serif"
30 | Chapter 1: Canvas Tutorial
The textAlign property specifies how the text should be hori-
zontally aligned with respect to the X coordinate passed to
fillText()
or strokeText(). The textBaseline property speci-
fies how the text should be vertically aligned with respect to
the Y coordinate. Figure 1-9 illustrates the allowed values for
these properties. The thin line near each string of text is the
baseline, and the small square marks the point (x,y) that was
passed to fillText().
start left center right end
top Abcefg Abcefg Abcefg Abcefg Abcefg
hanging
Abcefg Abcefg Abcefg Abcefg Abcefg
middle
Abcefg Abcefg Abeefg Abcefg Abcefg
alphabetic
Abcefg Abcefg Abqefg Abcefg
n
Abcefg
D
ideographic
Abcefg Abcefg Abcefg Abcefg^ Abcefg
bottom
Abcefg Abcefg Abcefg Abcefg Abcefg
Figure 1-9. The textAlign and textBaseline properties
The default textAlign is "start". Note that for left-to-right text,
an alignment of "start" is the same as "left" and an alignment
of "end" is the same as "right". If you set the dir attribute of
the <canvas> tag to "rtl" (right-to-left), however, then "start"
alignment is the same as "right" alignment and "end" is the
same as "left".
The default textBaseline is "alphabetic", and it is appropriate
for Latin and similar scripts. The value "ideographic" is used
with ideographic scripts such as Chinese and Japanese. The
value "hanging" is intended for use with Devangari and similar
scripts (which are used for many of the languages of India). The
"top", "middle", and "bottom" baselines are purely geometric
baselines, based on the "em square" of the font.
fillText()
and strokeText() take an optional fourth argu-
ment. If specified, this argument specifies the maximum width
Text | 31

of the text to be displayed. If the text would be wider than the
specified value when drawn using the font property, then the
canvas will make it fit by scaling it or by using a narrower or
smaller font.
If you need to measure text yourself before drawing it, pass it
to the measureTextQ method. This method returns a
TextMetrics object that specifies the measurements of the text
when drawn with the current font. At the time of this writing,
the only "metric" contained in the TextMetrics object is the
width. Query the onscreen width of a string like this:
var width = c.measureText(text).width;
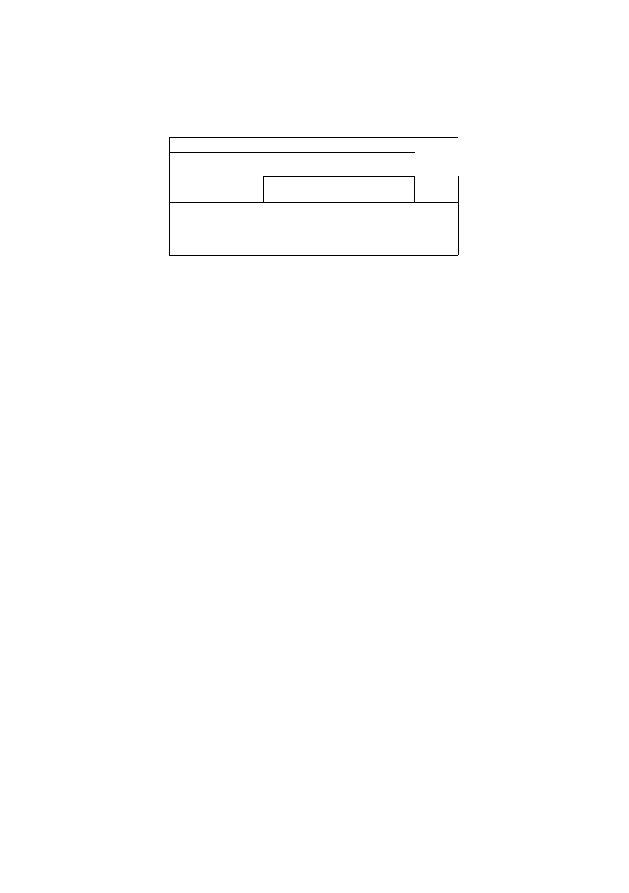
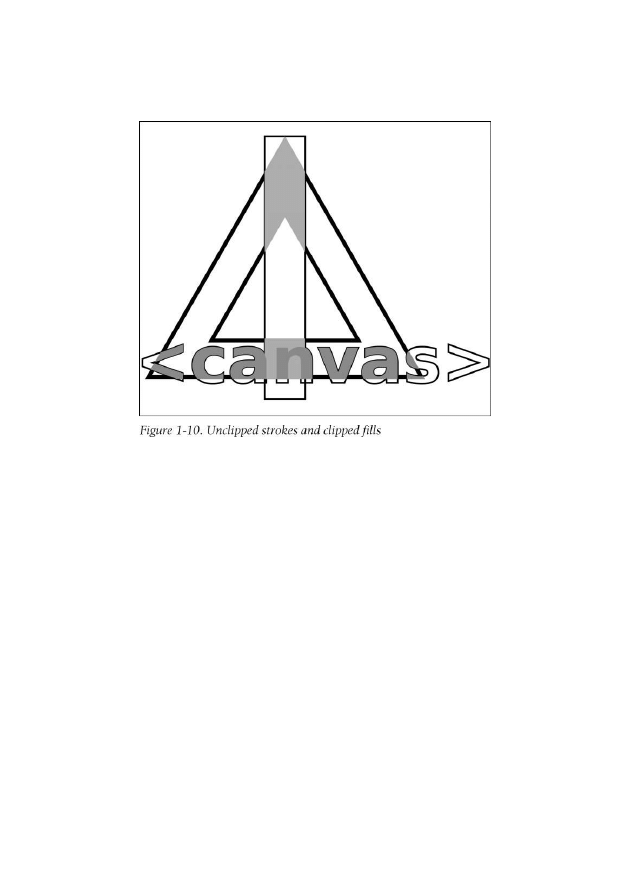
Clipping
After defining a path, you usually call strokeQ or fill() (or
both). You can also call the clipQ method to define a clipping
region. Once a clipping region is defined, nothing will be drawn
outside of it. Figure 1-10 shows a complex drawing produced
using clipping regions. The vertical stripe running down the
middle and the text along the bottom of the figure were stroked
with no clipping region and then filled after the triangular clip-
ping region was defined.
Figure 1-10 was generated using the polygon () method of
Example 1-1 and the code of Example 1-5.
Example 1-5. Defining a clipping region
// Define some drawing attributes
c.font = "bold 60pt sans-serif"; // Big font
c.lineWidth = 2; // Narrow lines
c.strokeStyle = "#000"; // Black lines
// Outline a rectangle and some text
c.strokeRect(l75, 25, 50, 325); // Vertical stripe
c.strokeText("<canvas>", 15, 330); // Text outline
32 | Chapter 1: Canvas Tutorial
// Define a complex path with an interior that is outside,
polygon(c,3,200,225,200); // Large triangle
polygon(c,3,200,225,100,0,true); // Small reverse triangle
// Make that path the clipping region.
c.clip();
// Stroke the path with a 5 pixel line,
// entirely inside the clipping region.
c.lineWidth = 10; // Half of this line will be clipped away
c.stroke();
// Fill the parts of the rectangle and text
// that are inside the clipping region
c.fillStyle = "#aaa" // Light gray
c.fillRect(l75, 25, 50, 325); // Fill vertical stripe
c.fillStyle = "#888" // Darker gray
c.fillText("<canvas>", 15, 330); // Fill text
It is important to note that when you call clip(), the current
path is itself clipped to the current clipping region, and then
that clipped path becomes the new clipping region. This means
Clipping | 33
that the clip() method can shrink the clipping region but can
never enlarge it. There is no method to reset the clipping region,
so before calling clip() you should typically call save() so that
you can later restore() the undipped region.
Shadows
Four graphics attribute properties of the CanvasRendering-
Context2D object control the drawing of drop shadows. If you
set these properties appropriately, any line, area, text, or image
you draw will be given a drop shadow, which will make it ap-
pear as if it is floating above the canvas surface. Figure 1-11
shows shadows beneath a filled rectangle, a stroked rectangle,
and filled text.
Hello World
Figure 1-11. Automatically generated shadows
The shadowColor property specifies the color of the shadow.
The default is fully transparent black, and shadows will never
34 | Chapter 1: Canvas Tutorial

appear unless you set this property to a translucent or opaque
color. This property can only be set to a color string: patterns
and gradients are not allowed for shadows. Using a translucent
shadow color produces the most realistic shadow effects be-
cause it allows the background to show through.
The shadowOffsetX and shadowOffsetY properties specify the X
and Y offsets of the shadow. The default for both properties is
0, which places the shadow directly beneath your drawing,
where it is not visible. If you set both properties to a positive
value, then shadows will appear below and to the right of what
you draw, as if there were a light source above and to the left
shining onto the canvas from outside the computer screen.
Larger offsets produce larger shadows and make drawn objects
appear as if they are floating "higher" above the canvas.
The shadowBlur property specifies how blurred the edges of the
shadow are. The default value is 0, which produces crisp, un-
blurred shadows. Larger values produce more blur, up to an
implementation-defined upper bound. This property is a
parameter to a Gaussian blur function and is not a size or
length in pixels.
Example 1-6 shows the code used to produce Figure 1-11 and
demonstrates each of these four shadow properties.
Example l-b. Setting shadow attributes
// Define a subtle shadow
c.shadowColor = "rgba(l00,100,100,.4)"; // Transparent gray
c.shadowOffsetX = c.shadowOffsetY = 3; II Slight offset
c.shadowBlur = 5; // Soften edges
// Draw some text and a blue box using that shadow
c.lineWidth = 10;
c.strokeStyle = "blue";
c.strokeRect(lOO, 100, 300, 200); // Draw a box
c.font = "Bold 36pt Helvetica";
c.fillText("Hello World", 115, 225); // Draw some text
// Define a less subtle shadow. Larger offset makes items
// "float" higher. Note how the shadow overlaps the box.
c.shadowOffsetX = c.shadowOffsetY = 20; // Large offsets
Shadows | 35

c.shadowBlur = 10; // Softer edges
c.fillStyle = "red"; // Draw a solid red rectangle
c.fillRect(50,25,200,65); // that floats above the blue box
The shadowOffsetX and shadowOffsetY properties are always
measured in the default coordinate space, and are not affected
by the rotateQ or scaleQ methods. Suppose, for example,
that you rotate the coordinate system by 90 degrees to draw
some vertical text and then restore the old coordinate system
to draw horizontal text. Both the vertical and horizontal text
will have shadows oriented in the same direction, which is what
you probably want. Similarly, shapes drawn with different
scaling transforms will still have shadows of the same
"height, "t
Images
In addition to vector graphics (paths, lines, etc.) the Canvas
API also supports bitmap images. The drawImageQ method
copies the pixels of a source image (or of a rectangle within the
source image) onto the canvas, scaling and rotating the pixels
of the image as necessary.
drawImageQ
can be invoked with three, five, or nine arguments.
In all cases, the first argument is the source image from which
pixels are to be copied. This image argument is often an
<img>
element, or an offscreen image created with the
ImageQ
constructor, but it can also be another <canvas> ele-
ment or even a <video> element. If you specify an <img> or
<video>
tag that is still loading its data, the drawlmage() call will
do nothing.
In the three-argument version of drawImageQ, the second and
third arguments specify the X and Y coordinates at which the
upper-left corner of the image is to be drawn. In this version of
t At the time of this writing, Google's Chrome browser gets this wrong, and
transforms the shadow offsets
36 | Chapter 1: Canvas Tutorial

the method, the entire source image is copied to the canvas.
The X and Y coordinates are interpreted in the current coor-
dinate system and the image is scaled and rotated if necessary.
The five-argument version of drawImageQ adds width and
height
arguments to the x and y arguments described above.
These four arguments define a destination rectangle within the
canvas. The upper-left corner of the source image goes at
(x,y)
and the lower-right corner goes at (x+width, y+height).
Again, the entire source image is copied. The destination rec-
tangle is measured in the current coordinate system. With this
version of the method, the source image will be scaled to fit the
destination rectangle even if no scaling transform has ever been
specified.
The nine-argument version of drawImageQ specifies both a
source rectangle and a destination rectangle and copies only
the pixels within the source rectangle. Arguments two through
five specify the source rectangle. They are measured in CSS
pixels. If the source image is another canvas the source rectan-
gle uses the default coordinate system for that canvas, and ig-
nores any transformations that have been specified. Arguments
six through nine specify the destination rectangle into which
the image is drawn and are in the current coordinate system of
the canvas, not in the default coordinate system.
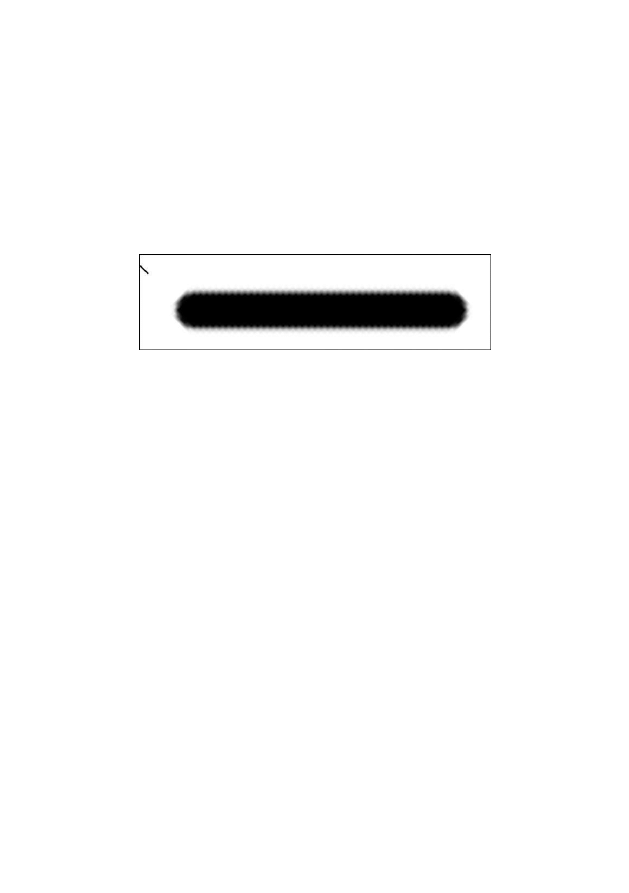
Example 1-7 is a simple demonstration of drawImageQ. It uses
the nine-argument version to copy pixels from a portion of a
canvas and draw them, enlarged and rotated back onto the
same canvas. As you can see in Figure 1-12, the image is en-
larged enough to be pixelated, and you can see the translucent
pixels used to smooth the edges of the line.
Example 1-7. Using drawImageQ
// Draw a line in the upper left
c.moveTo(5,5);
c.lineTo(45,45);
c.lineWidth = 8;
c.lineCap = "round";
c.strokeQ;
Images | 37
// Define a transformation
c.translate(50,100);
c.rotate(-45*Math.PI/180); // Straighten out the line
c.scale(lO,lO); // Scale so we can see the pixels
// Use drawlmage() to copy the line
c.drawlmage(c.canvas, // Copy from canvas to itself
0, 0, 50, 50, // untransformed source rectangle
0, 0, 50, 50); // transformed destination
Figure 1-12. Pixels enlarged with àrawlmageÇ)
In addition to drawing images into a canvas, we can also extract
the content of a canvas as an image using the toDataURL()
method. Unlike all the other methods described here,
toDataURL()
is a method of the Canvas element itself, not of the
CanvasRenderingContext2D object. You normally invoke
toDataURL()
with no arguments, and it returns the content of
the canvas as a PNG image, encoded as a string using a data:
URL. The returned URL is suitable for use with an <img> tag,
and you can make a static snapshot of a canvas with code like
this:
// Create an <img> tag
var img = document.createElement("img");
// Set its src attribute
img.src = canvas.toDataURL();
// Append it to the document
document.body.appendChild(img);
All browsers are required to support the PNG image format.
Some implementations may support other formats as well, and
you can specify the desired MIME type with the optional first
argument to toDataURL(). See the reference page for details.
There is one important security restriction you must be aware
of when using toDataURLQ. To prevent cross-origin
38 | Chapter 1: Canvas Tutorial

information leaks, toDataURLQ does not work on <canvas> tags
that are not "origin-clean." A canvas is not origin-clean if it has
ever had an image drawn in it (directly by drawImageQ or in-
directly through a CanvasPattern) that has a different origin
than the document that contains the canvas.
Compositing
When you stroke lines, fill regions, draw text, or copy images,
you expect the new pixels to be drawn on top of the pixels that
are already in the canvas. If you are drawing opaque pixels,
then they simply replace the pixels that are already there. If you
are drawing with translucent pixels, then the new ("source")
pixel is combined with the old ("destination") pixel so that the
old pixel shows through the new pixel based on how trans-
parent that pixel is.
This process of combining new translucent source pixels with
existing destination pixels is called compositing, and the com-
positing process described above is the default way that the
Canvas API combines pixels. You don't always want compo-
siting to happen, however. Suppose you've drawn into a canvas
using translucent pixels and now want to make a temporary
alteration to the canvas and then restore it to its original state.
An easy way to do this is to copy your drawing to an offscreen
canvas using drawImageQ. Then, when it is time to restore the
canvas, you can copy your pixels from the offscreen canvas in
which you saved them back to the onscreen canvas. Remem-
ber, though, that the pixels you saved were translucent. If
compositing is on they won't fully obscure and erase the tem-
porary drawing you've done. In this scenario, you need a way
to turn compositing off: to draw the source pixels and ignore
the destination pixels regardless of the transparency of the
source.
To specify the kind of compositing to be done, set the global
CompositeOperation
property. The default value is "source-
over" which means that source pixels are drawn "over" the
Compositing | 39

destination pixels and are combined with them if the source is
translucent. If you set this property to "copy", then composit-
ing is turned off: source pixels are copied to the canvas
unchanged and destination pixels are ignored (but see the dis-
cussion below about implementation differences in the defini-
tion of source pixels). Another globalCompositeOperation
value that is sometimes useful is "destination-over". This kind
of compositing combines pixels as if the new source pixels were
drawn beneath the existing destination pixels. If the destina-
tion is translucent or transparent then some or all of the source
pixel color is visible in the resulting color.
"source-over", "destination-over", and "copy" are three of the
most commonly used types of compositing, but the Canvas API
supports 11 values for the globalCompositeOperation attribute.
The names of these compositing operations are suggestive of
what they do, and you can go a long way toward understanding
compositing by combining the operation names with visual
examples of how they work. Figure 1-13 illustrates all 11 op-
erations using "hard" transparency: all the pixels involved are
fully opaque or fully transparent. In each of the 11 boxes, the
square is drawn first and serves as the destination. Next
globalCompositeOperation
is set, and the circle is drawn as the
source.
Figure 1-14 is a similar example that uses "soft" transparency.
In this version the square and circle are drawn using radial gra-
dients so that they have an opaque perimeter and a translucent
center.
You may find that it is not so easy to understand the compo-
siting operations when used with translucent pixels like these.
If you are interested in a deeper understanding, the reference
page for globalCompositeOperation includes the equations that
specify how individual pixel values are computed from source
and destination pixels for each of the 11 compositing
operations.
At the time of this writing, browser vendors disagree on the
implementation of 5 of the 11 compositing modes: "copy",
40 | Chapter 1: Canvas Tutorial
s urce-over source-atop source-in source-out
ina
m J
• E
) destination-in
m
destination-out
r
Figure 1-13. Compositing operations with hard transparency
"source-in", "source-out", "destination-atop", and "destina-
tion-in" behave differently in different browsers and cannot be
used portably. A detailed explanation follows, but you can skip
to the next section if you don't plan on using any of these com-
positing operations.
The five compositing modes listed above either ignore the des-
tination pixel values in the computation of result pixels or
make the result transparent anywhere the source is transpar-
ent. The difference in implementation has to do with the def-
inition of the source pixels. Safari and Chrome perform com-
positing "locally": only the pixels actually drawn by the f ill (),
stroke(),
or other drawing operation count as part of the
source. IE 9 is likely to follow suit. Firefox and Opera perform
compositing "globally": every pixel within the current clipping
region is composited for every drawing operation. If the source
does not set that pixel, then it is treated as transparent black.
In Firefox and Opera this means that the five compositing
modes listed above actually erase destination pixels outside of
Compositing | 41
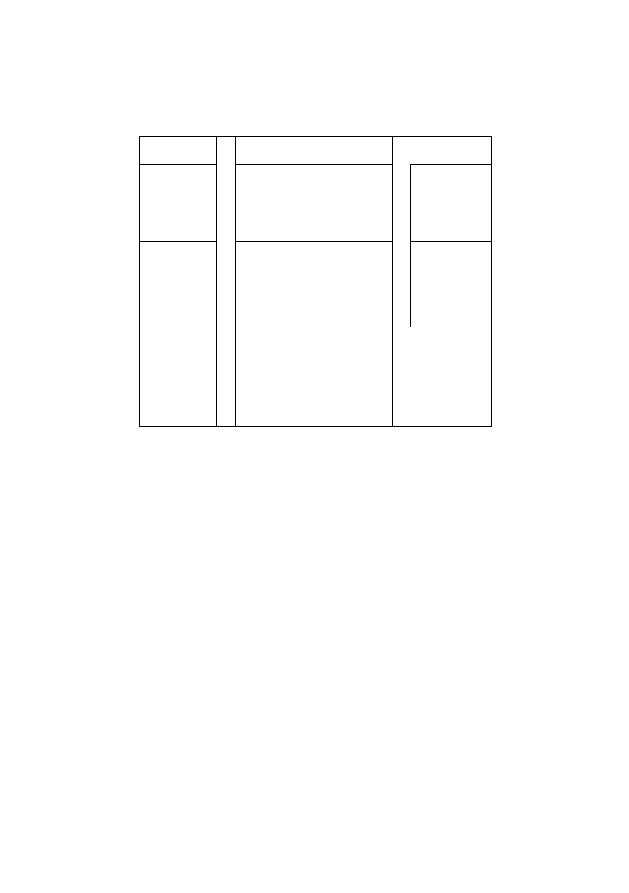
source-over
source-atop
source-in
source-out
n
n
Hoc-Hna-HnnJn
o
iocHnaHnn ni it"
m
fl
UfcrbLII Id UUI1 II 1
a
JfcrbUI la LIUI1 (JUL
n
copy
o
lighter
©
r
15»
Figure 1-14. Compositing operations with soft transparency
the source and inside the clipping region. Figures 1-13 and
1-14 were generated in Firefox, and this is why the boxes
around "copy", "source-in", "source-out", "destination-
atop", and "destination-in" are thinner than the other boxes:
the rectangle around each sample is the clipping region and
these four compositing operations erase the portion of the
stroke (half of the lineWidth) that falls inside the path. For
comparison, Figure 1-15 shows the same images as Fig-
ure 1-14, but was generated in Chrome.
The H T M L 5 draft current at the time of this writing specifies
the global compositing approach implemented by Firefox and
Opera. Browser vendors are aware of the incompatibility and
are not satisfied with the current state of the specification.
There is a distinct possibility that the specification will be
altered to require local compositing instead of global
compositing.
42 | Chapter 1: Canvas Tutorial
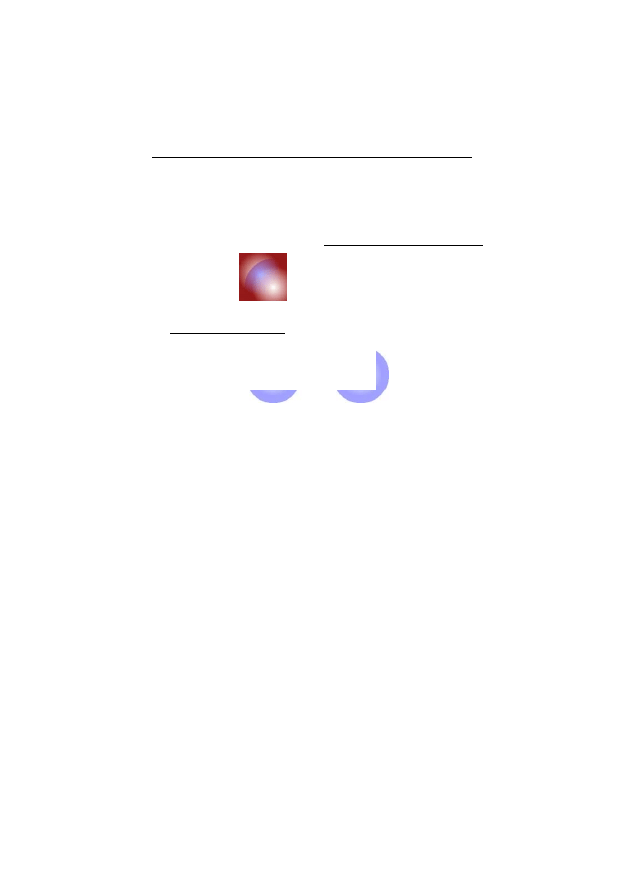
so
urce t
s
e-in
urce
T2T2TO
destination-over destination-atop destination-in destination-out
•
n r
copy li hter
r ri) n
Figure 1-15. Compositing locally rather than globally
Finally, note that it is possible to perform global compositing
in browsers like Safari and Chrome that implement local com-
positing. First, create a blank offscreen canvas of the same
dimensions as the onscreen canvas. Then draw your source
pixels into the offscreen canvas and use drawlmage() to copy
the offscreen pixels to the onscreen canvas and composite them
globally within the clipping region. There is not a general tech-
nique for performing local compositing in browsers like Firefox
that implement global compositing, but you can often come
close by defining an appropriate clipping region before per-
forming the drawing operation that is to be locally composited.
Pixel Manipulation
The getImageData() method returns an ImageData object that
represents the raw (nonpremultiplied) pixels (as R, G, B, and
A components) from a rectangular region of your canvas.
Pixel Manipulation | 43

You can create empty blank ImageData objects with
createlmageDataQ.
The pixels in an ImageData object are writ-
able, so you can set them any way you want, and then copy
those pixels back onto the canvas with putlmageDataQ.
These pixel manipulation methods provide very low-level ac-
cess to the canvas. The rectangle you pass to getlmageDataQ is
in the default coordinate system: its dimensions are measured
in CSS pixels, and it is not affected by the current transforma-
tion. When you call putlmageDataQ, the position you specify
is also measured in the default coordinate system. Further-
more, putlmageDataQ ignores all graphics attributes. It does
not perform any compositing, it does not multiply pixels by
globalAlpha,
and it does not draw shadows.
Pixel manipulation methods are useful for implementing image
processing. Example 1-8 shows how to create a simple motion
blur or "smear" effect on the graphics in a canvas. The example
demonstrates getlmageDataQ and putlmageDataQ and shows
how to iterate through and modify the pixel values in an
ImageData object, but it does not explain these things in any
detail. See the CanvasRenderingContext2D reference pages for
complete details on getlmageDataQ and putlmageDataQ and
see the ImageData reference page for details on that object.
Example 1-8. Motion blur with ImageData
// Smear the pixels of the rectangle to the right, producing
// a sort of motion blur as if objects are moving from right
// to left, n must be 2 or larger. Larger values produce
// bigger smears. The rectangle is specified in the default
// coordinate system,
function smear(c, n, x, y, w, h) {
// Get the ImageData object that represents the
// rectangle of pixels to smear
var pixels = c.getImageData(x,y,w,h);
// This smear is done in-place and requires only the
// source ImageData. Some image processing algorithms
// require an additional ImageData to store transformed
// pixel values. If we needed an output buffer, we could
// create a new ImageData with the same dimensions like
// this: var output_pixels = c.createlmageData(pixels);
44 | Chapter 1: Canvas Tutorial

// These dimensions may be different than the w and h
// arguments: there may be more than one device pixel
// per CSS pixel.
var width = pixels.width, height = pixels.height;
// This is the byte array that holds the raw pixel data,
// left-to-right and top-to-bottom. Each pixel occupies
// 4 consecutive bytes in R,G,B,A order,
var data = pixels.data;
// Each pixel after the first in each row is smeared by
// replacing it with l/nth of its own value plus m/nths
// of the previous pixel's value
var m = n-1;
for(var row = 0; row < height; row++) { // For each row
// Compute offset of the second pixel of the row
var i = row*width*4 + 4;
// For each pixel in the row, starting at the second
for(var col = 1; col < width; col++, i += 4) {
data[i] = (data[i]+data[i-4]*m)/n; // Red
data[i+l] = (data[i+l]+data[i-3]*m)/n; // Green
data[i+2] = (data[i+2]+data[i-2]*m)/n; // Blue
data[i+3] = (data[i+3]+data[i-l]*m)/n; // Alpha
}
}
// Now copy the smeared image data back to the canvas
c.putImageData(pixels, x, y);
}
N o t e t h a t getlmageDataQ i s s u b j e c t t o t h e s a m e c r o s s - o r i g i n
s e c u r i t y r e s t r i c t i o n t h a t t h e t o D a t a U R L Q is: i t d o e s n o t w o r k o n
a n y c a n v a s t h a t h a s ever h a d a n i m a g e d r a w n i n i t (directly b y
d r a w I m a g e Q
or i n d i r e c t l y t h r o u g h a C a n v a s P a t t e r n ) t h a t h a s a
different origin t h a n t h e d o c u m e n t t h a t c o n t a i n s t h e c a n v a s .
Hit Detection
T h e m e t h o d isPointlnPathQ d e t e r m i n e s w h e t h e r a specified
p o i n t falls w i t h i n (or o n t h e b o u n d a r y of) t h e c u r r e n t p a t h , a n d
r e t u r n s true i f s o o r false o t h e r w i s e . T h e p o i n t y o u p a s s t o t h e
Hit Detection | 45

method is in the default coordinate system and is not
transformed. This makes this method useful for hit detection:
determining whether a mouse click occurred over a particular
shape.
You can't pass the clientX and clientY fields of a MouseEvent
object directly to isPointlnPathQ, however. First, the mouse
event coordinates must be translated to be relative to the can-
vas element rather than the Window object. Second, if the
onscreen size of the canvas is different than its actual dimen-
sions, the mouse event coordinates must be scaled appropri-
ately. Example 1-9 shows a utility function you can use to
determine whether a given MouseEvent was over the current
path.
Example 1-9. Testing whether a mouse event is over the current path
// Returns true if the mouse event is over the current path
// in the specified CanvasRenderingContext2D object,
function hitpath(context, event) {
var canvas, bb, x, y;
II Get <canvas> element from the context object
canvas = context.canvas;
// Get canvas size and position
bb = canvas.getBoundingClientRect();
// Convert mouse event coordinates to canvas coordinates
x = (event.clientX-bb.left) * (canvas.width/bb.width);
y = (event.clientY-bb.top) * (canvas.height/bb.height);
// Call isPointlnPath with these transformed coordinates
return context.isPointlnPath(x,y);
}
You might use this hitpathQ function in an event handler like
this:
canvas.onclick = function(event) {
if (hitpath(this.getContext("2d"), event) {
alert("Hit!"); // Click over current path
}
};
46 | Chapter 1: Canvas Tutorial

Instead of doing path-based hit detection, you can use
getlmageDataQ
to test whether the pixel under the mouse point
has been painted. If the returned pixel (or pixels) are fully
transparent then nothing has been drawn into that pixel and
the mouse event is a miss. Example 1-10 shows how you can
do this kind of hit detection.
Example 1-10. Testing whether a mouse event is over a painted pixel
// Returns true if the specified mouse event is over a
// nontransparent pixel.
function hitpaint(context, event) {
// Convert mouse event coordinates to canvas coordinates
var canvas = context.canvas;
var bb = canvas.getBoundingClientRect();
var x=(event.clientX-bb.left)*(canvas.width/bb.width);
var y=(event.clientY-bb.top)*(canvas.height/bb.height);
// Get the pixel (or pixels if multiple device pixels
// map to 1 CSS pixel) at those coordinates
var pixels = c-getlmageData^y,!,!);
// If any pixels have a nonzero alpha, return true
for(var i = 3; i < pixels.data.length; i+=4) {
if (pixels.data[i] !== o) return true;
}
// Otherwise it was a miss,
return false;
Canvas Example: Sparklines
We'll end this chapter with a practical example for drawing
sparklines. A sparkline is a small data-display graphic intended
to be included within the flow of text, like this one:
S o r v o r l o a d : 8 .
T h e term sparkline was
coined by author Edward Tufte, who describes them as "small,
high-resolution graphics embedded in a context of words,
numbers, images. Sparklines are data-intense, design-simple,
word-sized graphics." Learn more about sparklines in Tufte's
book Beautiful Evidence (Graphics Press).
Canvas Example: Sparklines | 47

Example 1-11 is a relatively simple module of unobtrusive
JavaScript code for enabling sparklines in your web pages. The
comments explain how it works.
Example 1-11. Sparklines with the <canvas> tag
/*
* Find all elements of CSS class "sparkline", parse their
* content as a series of numbers, and replace it with a
* graphical representation.
*
* Define sparklines with markup like this:
* <span class="sparkline">3 5 7 6 6 9 11 15</span>
*
* Style sparklines with CSS like this:
* .sparkline { background-color: #ddd; color: red; }
*
* - Sparkline color is from the computed style of the CSS
* color property.
* - Sparklines are transparent, so the normal background
* color shows through.
* - Sparkline height is from the data-height attribute if
* defined or from the computed style for the font-size
* otherwise.
* - Sparkline width is from the data-width attribute if it
* is defined or the number of data points times data-dx
* if that is defined or the number of data points times
* the height divided by 6
* - The minimum and maximum values of the y axis are taken
* from the data-ymin and data-ymax attributes if they
* are defined, and otherwise come from the minimum and
* maximum values of the data.
*/
// Run this code when the document first loads
window.addEventListener("load", function() {
// Find all elements of class "sparkline"
var elts = document.getElementsByClassName("sparkline");
// Loop through those elements
main: for(var e = 0; e < elts.length; e++) {
var elt = elts[e];
// Get content of the element and convert to an
// array of numbers. If the conversion fails, skip
// this element.
var content = elt.textContent || elt.innerText;
// Trim leading and trailing whitespace
48 | Chapter 1: Canvas Tutorial

var content = content.replace(/
A
\s+|\s+$/g, "");
// Remove comments
var text = content.replace(/#.*$/gm, "");
// Convert newlines, etc., to spaces
text = text.replace(/[\n\r\t\v\f]/g, " ");
// Split numbers on commas or spaces
var data = text.split(/\s+|\s*,\s*/);
// For each split piece of the string
for(var i = 0; i < data.length; i++) {
data[i] = Number(data[i]); // Convert to number
if (isNaN(data[i])) // On failure
continue main; // skip this elt.
}
// Now compute the color, width, height, and y axis
// bounds of the sparkline from the data, from data-
// attributes of the element, and from the computed
// style of the element
var style = getComputedStyle(elt, null);
var color = style.color;
var height =
parseInt(elt.getAttribute("data-height")) ||
parselnt(style.fontSize) || 20;
var datadx = parseInt(elt.getAttribute("data-dx"));
var width =
parseInt(elt.getAttribute("data-width")) | |
data.length*(datadx || height/6);
var ymin =
parseInt(elt.getAttribute("data-ymin")) ||
Math.min.apply(Math, data);
var ymax =
parseInt(elt.getAttribute("data-ymax")) ||
Math.max.apply(Math, data);
if (ymin >= ymax) ymax = ymin + 1;
// Create the canvas element
var canvas = document.createElement("canvas");
canvas.width = width; // Set canvas dimensions
canvas.height = height;
// Use the element content as a tooltip
canvas.title = content;
elt.innerHTML = ""; // Erase existing content
elt.appendChild(canvas); // Insert canvas into elt
// Now plot the points in the canvas
var context = canvas.getContext('2d');
for(var i = 0; i < data.length; i++) {
Canvas Example: Sparklines | 49

// Transform (i,data[i]) to canvas coordinates
var x = width*i/data.length;
var y = (ymax-data[i])*height/(ymax-ymin);
// Draw a line to (x,y). Note that the first
// call to lineTo() does a moveTo() instead,
context.lineTo(x,y);
}
context.strokeStyle = color; // Specify color
context.stroke(); // and draw it
}
}, false); // last argument to addEventl_istener()
50 | Chapter 1: Canvas Tutorial

CHAPTER 2
Canvas R e f e r e n c e
This part of the book is a reference section that covers the
<canvas>
tag and its related classes. The reference is arranged
alphabetically and methods are alphabetized by their full
names, which include the names of the classes that define
them. If you want to read about the getContextQ method, for
example, you'd look up Canvas. getContextQ. And if you want
to read about the arcQ method, you'd look up
CanvasRenderingContext2D.arcQ.
Because the name of that
class is so long, however, it is abbreviated as CRC in this
reference.
Most of this chapter documents methods of Canvas
RenderingContext2D (using the name CRC), but Canvas,
CanvasGradient, CanvasPattern, ImageData, and TextMetrics
are also covered.
C a n v a s an HTML element for scripted drawing
Properties
String width, height
These properties mirror the width and height attributes of the
<canvas>
tag and specify the dimensions of the canvas coordi-
nate space. The defaults are 300 for width and 150 for height.
51

Canvas
If the size of the canvas element is not otherwise specified in a
stylesheet or with the inline style attribute, then these width
and height properties also specify the onscreen dimensions of
the canvas element.
Setting either of these properties (even setting one to its current
value) clears the canvas to transparent black and resets all of
its graphics attributes to their default values.
Methods
getContextQ
Returns a context object with which you can draw on the can-
vas. Pass the string "2d" to obtain a CanvasRenderingCon-
textlD that allows two-dimensional drawing.
Pass the string "webgl" to obtain a WebGLRenderingContext
object for 3D rendering in browsers that support it. WebGL-
RenderingContext is not yet standardized and is not docu-
mented in this book.
toDataURLQ
Returns a data: URL representing the image on the canvas.
Description
The Canvas object represents an HTML canvas element. It has no
behavior of its own but defines an API that supports scripted client-
side drawing operations. You may specify the width and height di-
rectly on this object, and can extract an image from the canvas with
toDataURLQ,
but the actual drawing API is implemented by a sep-
arate "context" object returned by the getContextQ method.
See
CRC.
The <canvas> tag was introduced in Safari 1.3 and is being stand-
ardized in HTML5. It is well supported in all recent versions of
Firefox, Safari, Chrome, and Opera. Canvas will be supported in
Internet Explorer 9, and can be emulated in earlier versions of IE
using the open source ExplorerCanvas library at http://code.google
.com/p/explorercanvas/.
See Also
CRC
52 | Chapter 2: Canvas Reference

Canvas.toDataURLQ
C a n v a S . g e t C o n t e X t ( ) returns a context for drawing on the canvas
Synopsis
Object getContext(String
contextID)
Arguments
contextID
This argument specifies the type of drawing you want to
do with the canvas. Pass the string "2d" to
obtain a CanvasRenderingContextlD object with which you
can do two-dimensional drawing.
Returns
An object with which you can draw into the Canvas element. When
you pass the string "2d", this will be a CanvasRenderingContext2D
object for 2D drawing.
Description
There is only one CanvasRenderingContext2D object per canvas
element, so repeated calls to getContext("2d") return the same
object.
HTML5 standardizes the "2d" argument to this method and defines
no other valid arguments. A separate standard, WebGL, is under
development for 3D graphics. In browsers that support it, you can
pass the string "webgl" to this method to obtain an object that al-
lows 3D rendering. Note, however, that the CanvasRender-
ingContext2D object is the only drawing context documented in
this book.
See Also
CRC
C a n v a S . t o D a t a l ) R L ( ) returns canvas image as a data: URL
Synopsis
String toDataURL()
String toDatalIRL(String
type, parameters...)
Chapter 2: Canvas Reference | 53

Canvas.toDataURLQ
Arguments
type
A string specifying the MIME type of the image format to use.
If this argument is omitted, the default value is "image/png",
and the PNG image format is the only one that implementa-
tions are required to support.
parameters...
For image types other than PNG, additional arguments may
be specified that provide encoding details. If type is "image/
jpeg", for example, then the second argument should be a
number between 0 and 1 specifying the image quality level. No
other parameter arguments are standardized at the time of this
writing.
Returns
A string, containing a PNG representation of the canvas bitmap,
encoded as a data: URL
Description
toDatallRLQ
returns the contents of the canvas bitmap in a URL
form that can easily be used with an <img> tag or transmitted across
the network.
To prevent cross-origin information leaks, toDatallRLQ does not
work on <canvas> tags that are not "origin-clean." A canvas is not
origin-clean if it has ever had an image drawn in it (directly by
drawImageQ
or indirectly through a CanvasPattern) that has a dif-
ferent origin than the document that contains the canvas.
Example
// Copy the content of a canvas to an image element
// and append that image to the document
var canvas = document.getElementById("my_canvas");
var image = document.createElement("img");
image, src = canvas. toDatallRL();
document.body.appendChild(image);
See Also
CRC.getImageData()
Chapter 2: Canvas Reference | 54

CanvasGradient.addColorStopQ
CanvasGradient
a color gradient for use in a canvas
Methods
addColorStop()
Specifies a color and position for the gradient
Description
A CanvasGradient object represents a color gradient that may be
assigned to both the strokeStyle and fillStyle properties of a
CanvasRenderingContextlD object The createLinearGradientQ
and createRadialGradientQ methods of CanvasRenderingCon-
textlD both return CanvasGradient objects
Once you have created a CanvasGradient object, use addColor
StopQ
to specify what colors should appear at what positions
within the gradient Between the positions you specify, colors are
interpolated to create a smooth gradient or fade If you specify no
color stops, the gradient will be uniform transparent black
See Also
CRC.createLinearGradient(), CRC.createRadialGradient()
CanvasGradient.addColorStopQ
specifies a color in the gradient
Synopsis
void addColorStop(float
o f f s e t , String color)
Arguments
o f f s e t
A floating-point value in the range 0 0 to 1 0 that represents a
fraction between the start and endpoints of the gradient An
offset of 0 corresponds to the start point, and an offset of 1
corresponds to the endpoint
color
Specifies the color to be displayed at the specified offset, as a
CSS color string Colors at other points along the gradient are
interpolated based on this and any other color stops
Chapter 2: Canvas Reference | 55

CanvasPattern
Description
addColorStopQ
specifies fixed colors within a gradient If you spec-
ify two or more color stops, the gradient will smoothly interpolate
colors between the stops Before the first stop, the gradient will dis-
play the color of the first stop After the last stop, the gradient will
display the color of the last stop If you specify only a single stop,
the gradient will be one solid color If you specify no color stops,
the gradient will be uniform transparent black
CanvasPattern
an image-based pattern for use in a canvas
Description
A CanvasPattern object is returned by the createPatternQ method
of a CanvasRenderingContextlD object A CanvasPattern object
may be used as the value of the strokeStyle and f illStyle proper-
ties of a CanvasRenderingContextlD object
A CanvasPattern object has no properties or methods of its own
See CRC.createPatternQ for details on how to create one
See Also
CRC.createPattern()
CanvasPixelArray
see ImageData
CRC the rendering context for drawing on a canvas
Properties
readonly Canvas canvas
The Canvas element upon which this context will draw
Object fillStyle
The current color, pattern, or gradient used for filling paths
This property may be set to a CSS color string or to a
CanvasGradient or CanvasPattern object The default fill style
is solid black See also CRC.createLinearGradientQ,
CRC.createRadialGradientQ,
and CRC.createPatternQ.
Chapter 2: Canvas Reference | 56

CRC
String font
The font to be used by text-drawing methods, specified as a
string, using the same syntax as the CSS font attribute. The
default is "lOpx sans-serif". If the font string uses font size
units like "em" or "ex" or uses relative keywords like "larger",
"smaller", "bolder", or "lighter", then these are interpreted
relative to the computed style of the CSS font of the <canvas>
element.
float globalAlpha
Specifies additional transparency to be added to everything
drawn on the canvas. The alpha value of all pixels drawn on
the canvas is multiplied by the value of this property. The value
must be a number between 0.0 (makes everything completely
transparent) and 1.0 (the default: adds no additional
transparency).
String globalCompositeOperation
Specifies how colors being drawn are combined (or "compos-
ited") with colors already on the canvas. See the individual
reference entry for this property for possible values. The de-
fault value is "source-over".
String lineCap
Specifies how the ends of lines are rendered. Legal values are
"butt", "round", and "square". The default is "butt". See the
individual reference page for this property for further details.
String lineJoin
Specifies how two lines are joined. Legal values are "round",
"bevel", and "miter". The default is "miter". See the individual
reference page for this property for further details.
float lineWidth
Specifies the line width for stroking (line-drawing) operations.
The default is 1. Lines are centered over the path, with half of
the line width on each side.
float miterLimit
When the lineJoin property is "miter", this property specifies
the maximum ratio of miter length to half the line width. The
default is 10. Seethe individual reference page for this property
for further details.
Chapter 2: Canvas Reference | 57

CRC
String textAlign
Specifies the horizontal alignment of text and the meaning of
theXcoordinate passed to fillTextQ and strokeTextQ. Legal
values are left , center , right , start , and end The
meaning of start and end depend on the dir (text direc-
tion) attribute of the <canvas> tag The default is start
String textBaseline
Specifies the vertical alignment of text and the meaning of the
Y coordinate passed to fillTextQ and strokeTextQ. Legal
values are top , middle , bottom , alphabetic , hang-
ing , and ideographic The default is alphabetic
float shadowBlur
Specifies how much blur shadows should have The default is
0, which produces crisp-edged shadows Larger values pro-
duce larger blurs, but note that the units are not measured in
pixels and are not affected by the current transform
String shadowColor
Specifies the color of shadows as a CSS color string The de-
fault is transparent black
float shadowOffsetX, shadowOffsetY
Specifies the horizontal and vertical offset of the shadows
Larger values make the shadowed object appear to float higher
above the background The default is 0 These values are in
coordinate space units and they are independent of the current
transform
Object strokeStyle
Specifies the color, pattern, or gradient used for stroking
(drawing) paths This property may be a CSS color string, or
a CanvasGradient or a CanvasPattern object See also
CRC.createLinearGradient (), CRC.createRadialGradient (),
and CRC.createPatternQ.
Methods
arcQ
Adds a line and a portion of a circle to the current subpath,
using a center point and radius
Chapter 2: Canvas Reference | 58

CRC
arcToQ
Adds a line and a portion of a circle to the current subpath,
using a radius and two lines tangent to the circle Typically
used for drawing rounded corners
beginPathQ
Starts a new path (or a collection of subpaths) in a canvas
bezierCurveToQ
Adds a cubic Bezier curve to the current subpath
clearRectQ
Erases the pixels in a rectangular area of a canvas
clip()
Uses the current path as the clipping region for subsequent
drawing operations
closePathQ
Closes the current subpath, connecting the current point to
the initial point of the subpath
createlmageData()
Returns a new ImageData object, representing a rectangular
array of RGBA pixels, all initialized to transparent black
createLinearGradientQ
Returns a CanvasGradient object that represents a linear color
gradient
createPatternQ
Returns a CanvasPattern object that represents a tiled image
createRadialGradient()
Returns a CanvasGradient object that represents a radial color
gradient
drawImageQ
Copies an image onto the canvas
filio
Fills the interior of the current path with the color, gradient,
or pattern specified by the fillStyle property
fillRect()
Fills the specified rectangle
Chapter 2: Canvas Reference | 59

CRC
fillTextQ
Draws the specified text at the specified position using the
current fillStyle.
getlmageDataQ
Returns an ImageData object that holds the pixel values for a
rectangular region of the canvas
isPointlnPathQ
Tests whether a specified point falls within the currently de-
fined path
lineToQ
Adds a straight line segment to the current subpath
measureTextQ
Returns a TextMetrics object that describes the size of the
specified text Currently, TextMetrics contains only the width
of the text
moveToQ
Sets the current position and begins a new subpath
putlmageDataQ
Copies some or all of the pixels in an ImageData object into a
rectangular region of the canvas
quadraticCurveToQ
Adds a quadratic Bezier curve to the current subpath
rect()
Adds a rectangle subpath to the current path
restoreQ
Resets the canvas to the graphics state most recently saved
rotateQ
Adds a rotation to the current transformation matrix
saveQ
Saves the properties, clipping region, and transformation ma-
t ix of the CRC object
scaleQ
Adds a scaling operation to the current transformation matrix
Chapter 2: Canvas Reference | 60

CRC
setTransformQ
Sets the current transformation matrix
strokeQ
Draws, or strokes, a line following the current path The line
is drawn according to the lineWidth, lineJoin, lineCap, miter
Limit
and strokeStyle properties
strokeRectQ
Draws (but does not fill) a rectangle
strokeTextQ
Strokes the outline of the specified text at the specified posi-
tion, using the current strokeStyle. For ordinary solid text,
use fillTextQ instead
transformQ
Multiplies the current transformation matrix by the specified
matrix
translateQ
Adds a translation to the current transformation matrix
Description
The CRC object provides properties and methods for drawing two-
dimensional graphics CRC is an abbreviation used in this reference
section the full name of this class is CanvasRenderingContext2D
The following sections provide an overview of the drawing API that
the CRC defines
Creating and rendering paths
A powerful feature of the canvas is its ability to build shapes up from
basic drawing operations, then either draw their outlines (stroke
them) or paint their contents (fill them) The operations accumu-
lated are collectively referred to as the current path. A canvas main-
tains a single current path
In order to build a connected shape out of multiple segments, a
joining point is needed between drawing operations For this pur-
pose, the canvas maintains a current position. The canvas drawing
operations implicitly use this as their start point and update it to
what is typically their endpoint You can think of this like drawing
with a pen on paper when finishing a particular line or curve, the
Chapter 2: Canvas Reference | 61

CRC
current position is where the pen rested after completing the
operation
You can create a sequence of disconnected shapes in the current
path that will be rendered together with the same drawing param-
eters To separate shapes, use the moveToQ method; this moves the
current position to a new location without adding a connecting line
When you do this, you create a new subpath, which is the canvas
term used for a collection of operations that are connected
The available path operations are lineToQ for drawing straight
lines, rectQ for drawing rectangles, arc() and arcToQ for drawing
partial circles, and bezierCurveToQ and quadraticCurveToQ for
drawing curves See Drawing Lines and Filling Poly-
gons on page 5 and Drawing and Filling Curves on page 20 for
more on these methods
Once the path is complete, you can draw its outline with
strokeQ,
paint its contents with fillQ, or do both
In addition to stroking and filling, you can also use the current path
to specify the clipping region the canvas uses when rendering Pixels
inside this region are displayed; those outside are not The clipping
region is cumulative; calling clipQ intersects the current path with
the current clipping region to yield a new region See Clip-
ping on page 32 for more
If the segments in any of the subpaths do not form a closed shape,
fillQ
and clipQ operations implicitly close them for you by add-
ing a virtual (not visible with a stroke) line segment from the start
to the end of the subpath Optionally, you can call closePathQ to
explicitly add this line segment
To test whether a point is inside (or on the boundary of) the current
path, use isPointlnPathQ. (See also Hit Detection on page 45 )
When a path intersects itself or consists of multiple overlapping
subpaths, the definition of inside is based on the nonzero winding
rule If you draw a circle inside another circle, and both circles are
drawn in the same direction, then everything inside the larger circle
is considered inside the path If, on the other hand, one circle is
drawn clockwise and the other counterclockwise, then you have
defined a donut shape, and the interior of the smaller circle is out-
side of the path This same definition of insideness is used by the
fillQ
and clipQ methods
Chapter 2: Canvas Reference | 62

CRC
Colors, gradients, and patterns
When filling or stroking paths, you can specify how the lines or
filled area are rendered using the fillStyle and strokeStyle prop-
erties. Both accept CSS-style color strings, as well as CanvasGradi-
ent and CanvasPattern objects that describe gradients and patterns.
To create a gradient, use the createLinearGradientQ or
createRadialGradientQ
methods. To create a pattern, use
createPatternQ.
To specify an opaque color using CSS notation, use a string of the
form "#RRGGBB", where RR, GG, and BB are hexadecimal digits
that specify the red, green, and blue components of the color as
values between 00 and FF. For example, bright red is "#FF0000".
To specify a partially transparent color, use a string of the form
"rgba(R,G,B,A)". In this form, R, G, and B specify the red, green,
and blue components of the color as decimal integers between 0
and 155, and A specifies the alpha (opacity) component as a
floating-point value between 0.0 (fully transparent) and 1.0 (fully
opaque). For example, half-transparent bright red is
"rgba(255,0,0,0.5)".
See "Colors, Transparency, Gradients, and Patterns" on page 23 for
more on these topics.
Line width, line caps, and line joins
Canvas defines several properties that specify how lines are stroked.
You can specify the width of the line with the lineWidth property,
how the endpoints of lines are drawn with the lineCap property,
and how lines are joined using the lineJoin property. See "Line-
Drawing Attributes" on page 28 for examples of these graphics
attributes.
Drawing rectangles
You can outline and fill rectangles with strokeRectQ and fill
RectQ.
In addition, you can clear the area defined by a rectangle
with clearRectQ. See "Rectangles" on page 23.
Drawing images
In the Canvas API, images are specified using Image objects that
represent HTML <img> elements or offscreen images created with
the ImageQ constructor. A <canvas> element or <video> element can
also be used as an image source.
Chapter 2: Canvas Reference | 63

CRC
You can draw an image into a canvas with the drawImageQ method,
which, in its most general form, allows an arbitrary rectangular re-
gion of the source image to be scaled and rendered into the canvas.
See "Images" on page 36.
Drawing text
The fillTextQ method draws text and the strokeTextQ method
draws outlined text. The font property specifies the font to use; the
value of this property should be a CSS font specification string. The
textAlign
property specifies whether text is left-justified, centered,
or right-justified on the X coordinate you pass, and the textBase
line
property specifies where the text is drawn in relation to the Y
coordinate you pass. See "Text" on page 30 for examples.
Coordinate space and transformations
By default, the coordinate space for a canvas has its origin at
(0,0)
in the upper-left corner of the canvas, with x values increasing
to the right and y values increasing down. The width and height
attributes of the <canvas> tag specify the maximum X and Y coor-
dinates, and a single unit in this coordinate space normally trans-
lates to a single onscreen pixel.
You can define your own coordinate space, and the coordinates you
pass to the canvas drawing methods will automatically be trans-
formed. This is done with the translateQ, scaleQ, and rotateQ
methods, which affect the transformation matrix of the canvas. Be-
cause the coordinate space can be transformed like this, the coor-
dinates you pass to methods such as lineToQ may not be measured
in pixels and the Canvas API uses floating-point numbers instead
of integers. Canvas coordinate space and transformations are
explained in more detail in "Canvas Dimensions and Coordi-
nates" on page 12 and "Coordinate System Transforms"
on page 14.
Shadows
The CRC can automatically add a drop shadow to anything you
draw. The color of the shadow is specified with shadowColor, and
its offset is changed using shadowOffsetX and shadowOffsetY. In ad-
dition, the amount of feathering applied to the shadow's edge may
be set with shadowBlur. See "Shadows" on page 34 for examples.
Chapter 2: Canvas Reference | 64

CRC arcQ
Compositing
Usually, when you draw on a canvas, the newly drawn graphics
appear on top of the previous content of the canvas, partially or
fully obscuring the old content, depending on the opacity of the
new graphics The process of combining new pixels with old pixels
is called compositing, and you can alter the way the canvas com-
posites pixels by specifying different values for the
globalCompositeOperation
property For example, you can set this
property so that newly drawn graphics appear underneath the ex-
isting content See CRC.globalCompositeOperation for a table of the
possible options, and see Compositing on page 39 for figures that
demonstrate the compositing operations
Saving graphics state
The saveQ and restoreQ methods allow you to save and restore
the state of a CRC object saveQ pushes the current state onto a
stack, and restoreQ pops the most recently saved state off the top
of the stack and sets the current drawing state based on those stored
values
All properties of the CRC object (except for the canvas property,
which is a constant) are part of the saved state The transformation
matrix and clipping region are also part of the state, but the current
path and current point are not Graphics Attributes on page 10
has more on saving and restoring the graphics state
Manipulating pixels
The getlmageDataQ method allows you to query the raw pixels of
a canvas, and putlmageDataQ allows you to set individual pixels
These can be useful if you want to implement image processing
operations in JavaScript See Pixel Manipulation on page 43 for
an example
CRC.arc()
adds an arc, using a center point and radius
Synopsis
void arc(float
x, float y, float radius,
float
startAngle, endAngle,
boolean
counterclockwise)
Chapter 2: Canvas Reference | 65

CRC.arcToO
Arguments
x, y
The coordinates of the center of the circle describing the arc.
radius
The radius of the circle describing the arc.
startAngle, endAngle
The angles that specify the start and endpoints of the arc along
the circle. These angles are measured in radians. The three
o'clock position along the positive X axis is an angle of 0, and
angles increase in the clockwise direction.
court tercl ockwise
Whether the arc is traversed counterclockwise (true) or clock-
wise (false) along the circle's circumference.
Description
The first five arguments to this method specify a start point and an
endpoint on the circumference of a circle. Invoking this method
adds a straight line between the current point and the start point to
the current subpath. Next it adds the arc along the circumference
of the circle between the start and endpoints to the subpath. The
final argument specifies the direction in which the circle should be
traversed to connect the start and endpoints. This method leaves
the current point set to the endpoint of the arc.
See Also
CRC.arcTo(), CRC.beginPathQ, CRC.closePathQ
CRC.arcToO
adds an arc, using two tangent lines and a radius
Synopsis
void arcTo(float xl, float yl,
float X2, float y2,
float
radius)
Arguments
xl, yl
The coordinates of point PI
Chapter 2: Canvas Reference | 66

CRC.beginPathO
x2, y2
The coordinates of point P2
radius
The radius of the circle that defines the arc
Description
This method adds a straight line and an arc to the current subpath
and describes that arc in a way that makes it particularly useful for
adding rounded corners to polygons The arc that is added to the
path is a portion of a circle with the specified radius. The arc has
one point that is tangent to the line from the current position to PI
and one point that is tangent to the line from PI to P2 The arc
begins and ends at these two tangent points and is drawn in the
direction that connects those two points with the shortest arc Be-
fore adding the arc to the path, this method adds a straight line from
the current point to the start point of the arc After calling this
method, the current point is at the endpoint of the arc, which lies
on the line between PI and P2
Example
Given a context object c, you can draw a 100 x 100 square with
rounded corners (of varying radii) with code like this
c.beginPath();
c.moveTo(l50, 100);
c.arcTo(200,100,200,200,40);
c. arcTo(200,200,100,200,30);
c. arcTo(l00,200,100,100,20);
c. arcTo(l00,100,200,100,10);
c.closePath();
c.stroke();
See Also
// Start at the top middle
// Top edge and upper right
// Right edge and lower right
// Bottom and lower left
// Left and upper left
// Back to the starting point
// Draw the path
CRC.arcQ
CRC.beginPathO
Starts a new path in a canvas
Synopsis
void beginPath()
Chapter 2: Canvas Reference | 67

CRC bezierCurveToO
Description
beginPathQ
discards any currently defined path and begins a new
one There is no current point after a call to beginPathQ.
When the context for a canvas is first created, beginPathQ is im-
plicitly called
See Also
CRC.closePathQ, CRC.fillQ, CRC.strokeQ
CRC.bezierCurveToO
adds a cubic Bezier curve to the current subpath
Synopsis
void bezierCurveTo(float
cpXl, float cpYl,
float
cpX2, float cpY2,
float x, float y)
Arguments
cpXl, cpYl
The coordinates of the control point associated with the
curve's start point (the current position)
cpX2, cpY2
The coordinates of the control point associated with the
curve's endpoint
x, y
The coordinates of the curve's endpoint
Description
bezierCurveToQ
adds a cubic Bezier curve to the current subpath
of a canvas The start point of the curve is the current point of the
canvas, and the endpoint is (x,y). The two Bezier control points
(cpXl, cpYl)
and (cpX2, cpY2) define the shape of the curve When
this method returns, the current position is (x,y).
See Also
CRC.quadraticCurveTo()
Chapter 2: Canvas Reference | 68

CRC.dipQ
CRCdearRectO
erases a rectangular area of a canvas
Synopsis
void clearRect(float
x, float y,
float
width, float height)
Arguments
x, y
The coordinates of the upper-left corner of the rectangle
width, height
The dimensions of the rectangle
Description
clearRectQ
fills the specified rectangle with transparent black Un-
like rectQ, it does not affect the current point or the current path
CRCdipO
sets the dipping region of a canvas
Synopsis
void clip()
Description
This method computes the intersection of the inside of the current
path with the current clipping region and uses that (smaller) region
as the new clipping region Note that there is no way to enlarge the
clipping region If you want a temporary clipping region, you should
first call saveQ so that you can later restoreQ the original clipping
region The default clipping region for a canvas is the canvas rec-
tangle itself
Like the fillQ method, clipQ treats all subpaths as closed and
uses the nonzero winding rule for distinguishing the inside of the
path from the outside of the path
Chapter 2: Canvas Reference | 69

CRC.closePathQ
C R C . d 0 S e P a t h ( ) doses an open subpath
Synopsis
void closePath()
Description
If the current subpath of the canvas is open, closePathQ closes it
by adding a line connecting the current point to the first point of
the subpath It then begins a new subpath (as if by calling
moveToQ)
at that same point
fillQ
and clipQ treat all subpaths as if they had been closed, so
you only need to call closePathQ explicitly if you want to
strokeQ
a closed path
See Also
CRC.beginPathQ, CRC.fillQ, CRC.moveToQ, CRC.strokeQ
CRCcreatelmageDataO
creates a new ImageData object
Synopsis
ImageData createImageData(iv,
h)
ImageData createImageData(ImageData
data)
Arguments
w, h
The desired ImageData width and height, in CSS pixels
data
An existing ImageData object that specifies the size of the
ImageData to be created
Returns
A newly created ImageData object that has the specified width and
height or has the same size as data.
Description
Returns a new ImageData object with the specified width and height
or the same dimensions as data. All pixels within this new
Chapter 2: Canvas Reference | 70

CRC.createLinearGradientQ
ImageData object are initialized to transparent black (all color com-
ponents and alpha are 0)
The w and h arguments specify image dimensions in CSS pixels
Implementations are allowed to map single CSS pixels to more than
one underlying device pixel The width and height properties of the
returned ImageData object specify the image dimensions in device
pixels, and these values may not match the wand h arguments
See Also
CRC.getImageData(), CRC.putImageData()
CRCcreateLinearGradientO
create a linearcolor gradient
Synopsis
CanvasCradient createLinearCradient(float
xStart,
float
yStart,
float
xEnd,
float
yEnd)
Arguments
xStart, yStart
The coordinates of the gradient's start point
xEnd, yEnd
The coordinates of the gradient's endpoint
Returns
A CanvasCradient object representing a linear color gradient
Description
This method creates and returns a new CanvasCradient object that
linearly interpolates colors between the specified start point and
endpoint Note that this method does not specify any colors for the
gradient Use the addColorStopQ method of the returned object to
do that To stroke lines or fill areas using a gradient, assign a
CanvasCradient object to the strokeStyle or fillStyle properties
See Also
CanvasGradient.addColorStop(), CRC.createRadialGradient()
Chapter 2: Canvas Reference | 71

CRC.createPatternQ
CRCcreatePatternO
creates a pattern of tiled images
Synopsis
CanvasPattern createPattern(imoge,
S t r i n g repetitionStyle)
Arguments
image
The image to be tiled, specified as an <img>, <canvas>, or
<video> tag, or as an offscreen image created with the
ImageQ constructor
repetitionStyle
Specifies how the image is tiled. The possible values are in the
following table:
Value Meaning
" repeat" Tile the image in both directions. This is the default,
"repeat-x" Tile the image in theX dimension only,
"repeat-y" Tile the image in the Y dimension only.
" no- repeat" Do not tile the image; use it only a single time.
Returns
A CanvasPattern object representing the pattern.
Description
This method creates and returns a CanvasPattern object that rep-
resents the pattern defined by a tiled image. To use a pattern for
stroking lines or filling areas, use a CanvasPattern object as the value
of the s t r o k e S t y l e or f i l l S t y l e properties.
See Also
CanvasPattern
Chapter 2: Canvas Reference | 72

CRC.createRadialGradientQ
CRCcreateRadialGradientQ
creates a radial color gradient
Synopsis
CanvasCradient createRadialCradient(float
xStart,
float
yStart,
float
radiusStart,
float
xEnd,
float
yEnd,
float
radiusEnd)
Arguments
xStart, yStart
The coordinates of the center of the starting circle
radiusStart
The radius of the starting circle
xEnd, yEnd
The coordinates of the center of the ending circle
radiusEnd
The radius of the ending circle
Returns
A CanvasCradient object representing a radial color gradient.
Description
This method creates and returns a new CanvasCradient object that
radially interpolates colors between the circumferences of the two
specified circles. Note that this method does not specify any colors
for the gradient. Use the addColorStopQ method of the returned
object to do that. To stroke lines or fill areas using a gradient, assign
a CanvasCradient object to the strokeStyle or fillStyle
properties.
Radial gradients are rendered by using the color at offset 0 for the
circumference of the first circle, the color at offset 1 for the second
circle, and interpolated color values at circles between the two.
See Also
CanvasGradient.addColorStop(), CRC.createLinearGradient()
Chapter 2: Canvas Reference | 73

CRC.drawlmageQ
C R C . d r a w l m a g e Q draws an image
Synopsis
void drawlmag
e{image, float dx, float dy)
void drawlmag
e{image, float dx, float dy,
float
dw, float dh)
void drawlmag
e{image, float sx, float sy,
float siv, float s
h,
float
dx, float dy,
float
dw, float dh)
Arguments
image
The image to be drawn. This should be a document element
representing an <img>, <canvas>, or <video> tag. Y o u can also
use offscreen images created with the Image () constructor.
dx, dy
The point on the destination canvas at which the upper-left
corner of the image is drawn.
dw, dh
The width and height at which the image should be drawn
onto the destination canvas. If these arguments are omitted,
the image will be copied at its natural size.
sx,
sy
The upper-left corner of the region of the source image that is
to be drawn. These arguments are measured in image pixels.
Specify these arguments if you want to copy only a portion of
the source image.
sw, sh
The width and height, in image pixels, of the region of the
source image that is to be drawn onto the canvas.
Description
There are three variants of this method. The first copies the entire
image to the canvas, placing its upper-left corner at the specified
point and mapping each image pixel to one unit in the canvas co-
ordinate system. The second variant also copies the entire image to
the canvas but allows you to specify the desired width and height
of the image in canvas units. The third variant is fully general: it
Chapter 2: Canvas Reference | 74

CRC.fillQ
allows you to specify any rectangular region of the image and copy
it, with arbitrary scaling to any position within the canvas Note
that dx, dy, dw, and dh are transformed by the current transformation
matrix, but that sx, sy, sw, and sh are not transformed
drawImageQ
expects its image data to be ready for immediate use,
which is why it does not allow you to specify the URL of an image
to display If you specify an <img> or <video> tag that is still loading
its associated image or video, the call to drawImageQ will return
immediately without drawing anything
CRC.fill()
fills the path
Synopsis
void fill()
Description
fillQ
fills the current path with the color, gradient, or pattern
specified by the fillStyle property Any subpaths that are not
closed are filled as if the closePathQ method had been called on
them (Note, however, that this does not actually cause those sub-
paths to become closed )
Filling a path does not clear the path You may call strokeQ after
calling fillQ without redefining the path
When the path intersects itself or when subpaths overlap, fillQ
uses the nonzero winding rule to determine which points are in-
side the path and which are outside This means, for example, that
if your path defines a square inside of a circle and the square's sub-
path winds in the opposite direction of the circle's path, then the
interior of the square will be outside of the path and will not be
filled
See Also
CRC.fillRectQ
Chapter 2: Canvas Reference | 75

CRC.fillRectO
CRC.fillReCtQ
fills a rectangle
Synopsis
void fillRect(float x, float
y,
float
width, float height)
Arguments
x, y
The coordinates of the upper-left corner of the rectangle
width, height
The dimensions of the rectangle
Description
fillRectQ
fills the specified rectangle with the color, gradient, or
pattern specified by the fillStyle property
Unlike the rectQ method, fillRect() has no effect on the current
point or the current path
See Also
CRC.fillQ, CRC.rect(), CRC.strokeRectQ
CRCfillTextO
draws text
Synopsis
void fillText(String
text, float x, float y,float max)
Arguments
text
The text to draw in the canvas
x, y
The anchor point of the text in the canvas The interpreta-
tion of this point depends on the values of the textAlign and
textBaseline
properties
max
This optional argument specifies a maximum width for the
text If the text would be wider than max when drawn using
the font property and the current transformation, then the text
Chapter 2: Canvas Reference | 76

CRC.getlmageDataQ
will be drawn using a smaller or more condensed version of
the font instead.
Description
fillTextQ
draws text using the current font and fillStyle prop-
erties. The x and y arguments specify where on the canvas the text
should be drawn, but the interpretation of these arguments depends
on the textAlign and textBaseline properties, respectively.
If textAlign is "left" or is "start" (the default) for a canvas that uses
left-to-right text (also the default) or "end" for a canvas that uses
right-to-left text, then the text is drawn to the right of the specified
X coordinate. If textAlign is "center", then the text is horizontally
centered around the specified X coordinate. Otherwise (if textA
lign
is "right", is "end" for left-to-right text, or is "start" for right-
to-left text) the text is drawn to the left of the specified X coordinate.
If textBaseline is "alphabetic" (the default), "bottom", or "ideo-
graphic", most of the glyphs will appear above the specified Y co-
ordinate. If textBaseline is "center", the text will be approximately
vertically centered on the specified Y coordinate. And if textBase
line
is "top" or "hanging", most of the glyphs will appear below
the specified Y coordinate.
See Also
CRC.strokeTextQ
CRC.getlmageDataO
gets individual pixels from a canvas
Synopsis
ImageData getImageData(x,
y, w, h)
Arguments
x,y
The coordinates of one corner (usually the upper-left) of the
rectangular region of pixels to be returned. These arguments
are not transformed by the current transformation matrix.
w, h
The width and height of the rectangle of pixels to be returned.
These arguments are not transformed by the current
Chapter 2: Canvas Reference | 77

CRC.globalCompositeOperation
transformation matrix. These arguments are usually positive,
but negative values are allowed.
Returns
A newly-created ImageData object that contains the pixel values for
all pixels within the rectangle.
Description
The arguments to this method are untransformed coordinates that
specify a rectangular region of the canvas. The method copies the
pixel data from that region of the canvas into a new ImageData
object and returns that object. See ImageData for an explanation of
how to access the red, green, blue, and alpha components of the
individual pixels.
The RGB color components of the returned pixels are not premul-
tiplied by the alpha value. If any portions of the requested rectangle
lie outside the bounds of the canvas, the associated pixels in the
ImageData are set to transparent black (all zeros). If the implemen-
tation uses more than one device pixel per CSS pixel then the
width
and height properties of the returned ImageData object will
be different than the w and h arguments.
Like Canvas.toDatallRLQ, this method is subject to a security check
to prevent cross-origin information leakage. getlmageDataQ only
returns an ImageData object if the underlying canvas is "origin-
clean" ; otherwise, it raises an exception. A canvas is not origin-clean
if it has ever had an image drawn in it (directly by drawImageQ or
indirectly through a CanvasPattern) that has a different origin than
the document that contains the canvas.
See Also
CRC.putlmageDataQ, ImageData
CRC.globalCompositeOperation
how colors are combined on the canvas
Synopsis
String globalCompositeOperation
78 | Chapter 2: Canvas Reference

CRC.globalCompositeOperation
Description
This property specifies how source pixels being rendered onto the
canvas are combined (or composited ) with the destination pixels
that already exist in the canvas This property is typically useful only
when you are working with partially transparent colors or have set
the globalAlpha property The default is value is source-over
Other commonly used values are destination-over and copy
The following table lists the allowed property values and their
meanings In the third column, the word source refers to the pixels
being drawn onto the canvas, the word destination refers to the ex-
isting pixels on the canvas, and the word result refers to the pixels
that result from the combination of the source and destination The
second column shows the formula for computing a result pixel from
a source pixel S and a destination pixel D along with the alpha chan-
nel (the opacity) of the source pixel a
s
and the alpha channel of the
destination cy
Value Formula Meaning
copy
destination-
atop
destination-
in
destination-
out
destination-
over
lighter
(l-«
d
)S +
c<
s
D
a.D
(l-c<
s
)D
(l-«
d
)S + D
S + D
Drawthe source pixel, ignoringthedestination
pixel.
Draw the source pixel underneath the desti-
nation. If the source is transparent, the result
is also transparent.
Multiply the destination pixel by the opacity of
the source pixel, but ignore the color of the
source.
The destination pixel is made transparent
when the source is opaque and is left un-
changed when the source is transparent. The
color of the source pixel is ignored.
The source pixel appears behind the destina-
tion pixel, showing through based on the
transparency of the destination.
The color components of the two pixels are
simply added together and clipped if the sum
exceeds the maximum value.
79 | Chapter 2: Canvas Reference
CRC isPointlnPathQ
Value
Formula
Meaning
s o u r c e - - a t o p
c
<d
S +
( l - c <
s
) D
Drawthe source pixel on top of the destination
butmultiply it bytheopacityofthedestination.
Don't draw anything over a transparent
destination.
s o u r c e - - i n
c<
d
S
Draw the source pixel, but multiply it by the
opacity of the destination. The color of the
destination is ignored. If the destination is
transparent, the result is transparent, too.
s o u r c e - - o u t
( l - «
d
) S
The result is the source pixel where the desti-
nation is transparent, and transparent pixels
where the destination is opaque. The color of
the destination is ignored.
s o u r c e - - o v e r
S + ( l - c <
s
) D
The source pixel is drawn on top of the desti-
nation pixel. If the source is translucent, then
the destination pixel contributes to the result.
This is the default value of the g l o b a l
C o m p o s i t e O p e r a t i o n property.
x o r
( l - c < d ) S +
( l - c < s ) D
If the source is transparent, the result is the
destination. If the destination is transparent,
the result is the source. If source and destina-
tionarebothtransparentorboth opaque,then
the result is transparent.
CRC.isPointlnPathO
tests whether a path encloses a point
Synopsis
boolean isPointInPath(float
x, float y)
Arguments
x,y
T h e point to be tested Note that these are in raw canvas
coordinates, and are not transformed by the current transfor-
mation matrix
80 | Chapter 2: Canvas Reference

CRC.isPointlnPathQ
Returns
true
if the specified point falls within or on the edge of the current
path, and false otherwise.
Description
isPointlnPathQ
tests whether the specified point is inside (or on
the boundary of) the current path. The specified point is not trans-
formed by the current transformation matrix, x should be a value
between 0 and canvas. width and y should be a value between 0 and
canvas.height.
Example
The reason that isPointlnPathQ tests untransformed points is that
it is designed for "hit testing": determining whether a user's mouse
click (for example) is on top of the portion of the canvas described
by the path. In order to do hit testing, mouse coordinates must first
be translated so that they are relative to the canvas rather than the
window. If the canvas's size on the screen is different than the size
declared by its width and height attributes (if style.width and
style.height
have been set, for example) then the mouse coordi-
nates also have to be scaled to match the canvas coordinates. The
following function is designed for use as an onclick handler of a
<canvas>
and performs the necessary transformation to convert
mouse coordinates to canvas coordinates:
// An onclick handler for a canvas tag.
// Assumes a path is currently defined,
function hittest(ev) {
// Get context, assuming this is the canvas
var c = this.getContext("2d");
// Get the canvas size and position
var bb = this.getBoundingClientRect();
// Convert mouse event coordinates to canvas coords
var x = (ev.clientX-bb.left)*(this.width/bb.width);
var y = (ev.clientY-bb.top)*(this.height/bb.height);
// Fill the path if the user clicked on it
if (c.isPointInPath(x,y)) c.fill();
}
81 | Chapter 2: Canvas Reference

CRC.IineCap
CRC.IineCap
specifies how the ends of lines are rendered
Synopsis
String lineCap
Description
The lineCap property specifies how lines should be terminated. It
matters only when drawing wide lines. Legal values for this property
are listed in the following table. The default value is "butt":
Value Meaning
" b u t t " This default value specifies that the line should have no cap. The end of
the line is straight and is perpendicular to the direction of the line. The
line is not extended beyond its endpoint.
" r o u n d " This value specifies that lines should be capped with a semicircle whose
diameter is equal to the width of the line and that extends beyond the
end of the line by one half the width of the line.
" s q u a r e " Thisvaluespecifiesthat linesshould becapped witharectangle.Thisvalue
is like "butt", but the line is extended by half of its width.
See Also
CRC.lineJoin
C R C . I i n e J o i n specifies how vertices are rendered
Synopsis
String lineDoin
Description
When a path includes vertices where line segments and/or curves
meet, the lineJoin property specifies how those vertices are drawn.
The effect of this property is apparent only when drawing with wide
lines.
The default value of the property is "miter", which specifies that
the outside edges of the two line segments are extended until they
intersect. When two lines meet at an acute angle, mitered joins can
become quite long. The miterLimit property places an upper bound
Chapter 2: Canvas Reference | 82

CRC.measureTextO
on the length of a miter. If a miter would exceed this limit, it is
converted to a bevel.
The value "round" specifies that the outside edges of the vertex
should be joined with a filled arc whose diameter is equal to the
width of the line.
The value "bevel" specifies that the outside edges of the vertex
should be joined with a filled triangle.
See Also
CRC.lineCap, CRC.miterLimit
CRC.IineToQ
adds a straight line to the current subpath
Synopsis
void lineTo(float
x, float y)
Arguments
x, y
The coordinates of the endpoint of the line
Description
lineToQ
adds a straight line to the current subpath. The line begins
at the current point and ends at (x,y). When this method returns,
the current position is (x,y).
See Also
CRC.beginPathQ, CRC.moveToQ
CRC.measureTextO
computes the width of the specified text
Synopsis
TextMetrics measureText(String
text)
Arguments
text
The string of text to be measured
Chapter 2: Canvas Reference | 83

CRC.miterLimit
Returns
A TextMetrics object whose width property specifies the width that
text
would occupy if it were drawn with the current font.
Description
measureTextQ
measures the specified text and returns a
TextMetrics
object containing the results of the measurement. At
the time of this writing, the returned object has only a single
width
property, and the text height and bounding box are not
measured.
See Also
TextMetrics
CRC.miterLimit
maximum miter length to line width ratio
Synopsis
float miterLimit
Description
When lines are drawn with the lineJoin property set to "miter" and
two lines meet at an acute angle, the resulting miter can be quite
long. When miters are too long, they become visually jarring. This
miterLimit
property places an upper bound on the length of the
miter. This property expresses a ratio of the miter length to half the
line width. The default value is 10, which means that a miter should
never be longer than five times the line width. If a miter formed by
two lines would be longer than the maximum allowed by
miterLimit
then those two lines will be joined with a bevel instead
of a miter.
See Also
CRC.lineJoin
Chapter 2: Canvas Reference | 84

CRC.putlmageDataQ
C R C . m 0 V e T 0 ( ) sets the current position and begins a new subpath
Synopsis
void moveTo(float x, float y)
Arguments
x, y
The coordinates of the new current point
Description
moveToQ
sets the current position to (x,y) and begins a new subpath
with this as its first point If there was a previous subpath and it
consisted of just one point, that empty subpath is removed from the
path
See Also
CRC.beginPathQ
CRC.putlmageDataQ
copies pixels from an ImageData into the canvas
Synopsis
void putImageData(ImageData
data, float dx, float dy,
float sx, float sy, float siv, float sh)
Arguments
data
An ImageData object
dx, dy
The coordinates of a destination point in the canvas Pixels
from data will be copied to the canvas starting at this point
These arguments are not transformed by the current transfor-
mation matrix
sx, sy, sw, sh
These optional arguments specify a source rectangle within the
ImageData If specified, only the pixels within that rectangle
will be copied to the canvas If omitted, all pixels in the Im-
ageData will be copied If these arguments specify a rectangle
that exceeds the bounds of the ImageData, the rectangle will
Chapter 2: Canvas Reference | 85

CRC.quadraticCurveToO
be clipped to those bounds Negative values for sx and sy are
allowed
Description
putlmageDataQ
copies a rectangular block of pixels from an Image-
Data object onto the canvas This is a low-level pixel copy opera-
tion the globalCompositeOperation and globalAlpha attributes are
ignored as are the clipping region, transformation matrix, and
shadow-drawing attributes
One use for ImageData objects is as a backing store for a canvas—
saving a copy of the canvas pixels in an ImageData object (using
getlmageDataQ)
allows you to draw temporarily on the canvas and
then restore it to its original state with putlmageDataQ.
See Also
CRC.createlmageDataQ, CRC.getlmageDataQ, ImageData
CRC.quadraticCurveTo()
adds a quadratic Bezier curve to the path
Synopsis
void quadraticCurveTo(float
cpX, float cpY,
float x, float y)
Arguments
cpX, cpY
The coordinates of the control point
x, y
The coordinates of the endpoint of the curve
Description
This method adds a quadratic Bezier curve segment to the current
subpath The curve starts at the current point and ends at (x,y).
The control point (cpX, cpY) specifies the shape of the curve be-
tween these two points (The mathematics of Bezier curves is be-
yond the scope of this book, however ) When this method returns,
the current position is (x,y).
Chapter 2: Canvas Reference | 86

CRC.restoreO
See Also
CRC.bezierCu rveTo ()
CRC.rect()
adds a rectangle subpath to the path
Synopsis
void rect(float
x, float y,
float
width, float height)
Arguments
x, y
The coordinates of the upper-left corner of the rectangle
width, height
The dimensions of the rectangle
Description
This method adds a rectangle to the path. This rectangle is in a
subpath of its own and is not connected to any other subpaths in
the path. When this method returns, the current position is (x,y).
A call to this method is equivalent to the following sequence of calls:
c.moveTo(x,y);
c.lineTo(x+w, y);
c.lineTo(x+w, y+h);
c.lineTo(x, y+h);
c.closePath();
See Also
CRC.fillRect(), CRC.strokeRect()
C R C . r e s t o r e O resetsdrawing state to saved values
Synopsis
void restore()
Chapter 2: Canvas Reference | 87

CRC rotateQ
Description
This method pops the stack of saved graphics states and restores
the values of the CRC properties, the clipping path, and the trans-
formation matrix See the save() method for further information
See Also
CRC.saveQ
CRC.rotateQ
adds a rotation to current transform
Synopsis
void rotate(float
angle)
Arguments
angle
The rotation, in radians Positive values result in clockwise
rotation, and negative values result in counterclockwise
rotation
Description
This method alters the current transformation matrix so that any
subsequent drawing appears rotated within the canvas by the speci-
fied angle It does not rotate the <canvas> element itself Note that
the angle is specified in radians To convert degrees to radians,
multiply by Math.PI and divide by 180
See Also
CRC.scaleQ, CRC.translateQ
CRC.saveQ
saves a copy of the current graphics state
Synopsis
void save()
Description
saveQ
pushes a copy of the current graphics state onto a stack of
saved graphics states This allows you to temporarily change the
Chapter 2: Canvas Reference | 88

CRC scaleQ
graphics state, and then restore the previous values with a call to
restoreQ.
The graphics state of a canvas includes all the properties of the CRC
object (except for the read-only canvas property) It also includes
the transformation matrix that is the result of calls to rotateQ,
scaleQ,
and translateQ. Additionally, it includes the clipping
path, which is specified with the clipQ method Note, however,
that the current path and current position are not part of the graph-
ics state and are not saved by this method
See Also
CRC.restoreQ
CRC.scaleQ
adds a scaling operation to the current transform
Synopsis
void scale(float sx, float sy)
Arguments
sx, sy
The horizontal and vertical scaling factors
Description
scaleQ
adds a scale transformation to the current transformation
matrix of the canvas Scaling is done with independent horizontal
and vertical scaling factors For example, passing the values 2 0 and
0 5 causes subsequently drawn paths to be twice as wide and half
as high as they would otherwise have been Specifying a negative
value for sx causes X coordinates to be flipped across the Y axis,
and a negative value of sy causes Y coordinates to be flipped across
the X axis
See Also
CRC.rotateQ, CRC.translateQ
Chapter 2: Canvas Reference | 89

CRC setTransformQ
C R C s e t T r a n s f o r m O sets the transformation matrix
Synopsis
void setTransform(float
a, float b,
float
c, float d,
float
e, float f)
Arguments
a, b, c, d, e, f
Six elements of a 3 x 3 affine transformation matrix
Description
This method allows you to set the current transformation matrix
directly rather than through a series of calls to translateQ,
scaleQ,
and rotateQ. After calling this method, the new transfor-
mation is
x' a c e x = ax + cy + e
y ' = b d f x y = b x + d y + f
1 0 0 1 1
Example
You can temporarily reset the transformation of a context c to the
identity transform, so that you can work with raw canvas coordi-
nates, using code like this
c.save(); // Save current transform
c.setTransformiljOjOjIjOjO); // Set identity transform
/* Now use raw canvas coordinates here */
c.restore(); // Revert to old transform
See Also
CRC.rotateQ, CRC.scaleQ, CRC.transformQ, CRC.translateQ
CRC.StrokeQ draws the current path
Synopsis
void strokeQ
Chapter 2: Canvas Reference | 90

CRC strokeRectQ
Description
The stroke() method draws the outline of the current path The
path defines the geometry of the line that is produced, but the visual
appearance of that line depends on the strokeStyle, lineWidth,
lineCap, lineJoin,
and miterLimit properties
The term stroke refers to a pen or brush stroke It means draw the
outline of Contrast this strokeQ method with fillQ, which fills
the interior of a path rather than stroking the outline of the path
See Also
CRC.fillQ, CRC.lineCap, CRC.lineJoin, CRC.strokeRectQ
CRC.StrokeRect()
draws a rectangle
Synopsis
void strokeRect(float
x, float y,
float
width, float height)
Arguments
x, y
The coordinates of the upper-left corner of the rectangle
width, height
The dimensions of the rectangle
Description
This method draws the outline (but does not fill the interior) of a
rectangle with the specified position and size Line color and line
width are specified by the strokeStyle and lineWidth properties
The appearance of the rectangle corners are specified by the line
Join
property
Unlike the rectQ method, strokeRectQ has no effect on the current
path or the current point
See Also
CRC.fillRectQ, CRC.lineJoin, CRC.rectQ, CRC.strokeQ
Chapter 2: Canvas Reference | 91

CRC strokeTextO
CRC.StrokeText()
draws outlined text
Synopsis
void strokeText(String
text, float x, float y,float max)
Arguments
text
The text to draw in the canvas
x, y
The anchor point of the text in the canvas
max
An optional maximum width for the text
Description
strokeTextQ
works just like fillTextQ except that instead of filling
the individual character glyphs with f illStyle, it strokes the outline
of each glyph using strokeStyle. strokeTextQ produces interesting
graphical effects when used at large font sizes, but fillTextQ is
more commonly used for actually drawing text
See Also
CRC. fillTextQ
CRC.transform()
performs an arbitrary transform
Synopsis
void transform(float
a, float b,
float
c, float d,
float
e, float f)
Arguments
a, b, c, d, e, f
Six elements of a 3 x 3 affine transformation matrix
Description
The arguments to this method specify the six nontrivial elements of
a 3 x 3 affine transformation matrix T:
Chapter 2: Canvas Reference | 92

CRC.translateQ
a c e
b d f
0 0 1
transform()
sets the current transformation matrix to the product
of the transformation matrix and the T:
CTM' = CTM x T
Translations, scales, and rotations can be implemented in terms of
this general-purpose transformQ method. For a translation, call
transform(l,0,0,l,dx,dy).
For a scale, call transform(sx,0,0,sy,
0,0).
For a clockwise rotation around the origin by an angle x, use:
transform(cos(x),sin(x),-sin(x), cos(x), 0, o)
For a shear by a factor of k parallel to the X axis, call
transform(l,0,k,1,0,0).
For a shear parallel to the Y axis, call
transform(l,k,0,l,0,0).
Example
// Perform a shear transform
function shear(c,kx, ky) { c.transform(l,ky,kx,l, 0,0); }
// Rotate clockwise by theta radians about the point (x,y)
function rotateAbout(c, theta, x, y) {
var ct = Math.cos(theta);
var st = Math.sin(theta);
c.transform(ct, -st, st, ct,
-x*ct - y*st + x,
x*st - y*ct +
y);
}
See Also
CRC.rotateQ, CRC.scaleQ, CRC.set TransformQ, CRC.translateQ
CRC.translate()
adds a translation to the current transform
Synopsis
void translate(float
dx, float dy)
Arguments
dx, dy
T h e amounts to translate in the X and Y dimensions
Chapter 2: Canvas Reference | 93

ImageData
Description
translateQ
adds horizontal and vertical offsets to the transforma-
tion matrix of the canvas. The arguments dx and dy are added to all
points in any subsequently defined paths.
See Also
CRC.rotateQ, CRC.scaleQ
ImageData
an array of pixel data for an image
Properties
data
A read-only reference to an array-like object that contains the
image data
height
The number of rows of image data
width
The number of pixels per row of data
Description
An ImageData object holds the red, green, blue, and alpha compo-
nents of a rectangular region of pixels. Obtain an ImageData object
with the createlmageDataQ or get ImageData Q methods of the
CanvasRenderingContextlD object of a <canvas> tag.
The width and height properties specify the dimensions of the rec-
tangle of pixels. The data property is an array that holds the pixel
data. Pixels appear in the data[] array in left-to-right and top-to-
bottom order. Each pixel consists of four byte values that represent
the R, G, B, and A components, in that order. Thus, the color com-
ponents for a pixel at (x,y) within an ImageData object image can
be accessed like this:
var offset = (x + y*image.width) * 4;
var red = image.data[offset];
var green = image.data[offset+l];
var blue = image.data[offset+2];
var alpha = image.data[offset+3];
Chapter 2: Canvas Reference | 94

TextMetrics
The data[] array is not a true JavaScript array, but an array-like
object known as a CanvasPixelArray object (CanvasPixelArray is
documented here, and does not have its own entry in this reference
section ) A CanvasPixelArray is an optimized array of bytes The
elements of this array must be integers between 0 and 255 The
elements are read/write, but the length of the array is fixed For any
ImageData object i, i.data.length will always equal i.width *
i.height * 4.
See Also
CRC, CRC.getImageData()
TextMetrics
measurements of a string of text
Properties
width
The width of the specified text
Description
A TextMetrics object is returned by the measureTextQ method of
CanvasRenderingContextlD Its width property holds the width of
the measured text, in CSS pixels
See Also
CRC.measureText()
Chapter 2: Canvas Reference | 95

I n d e x
Symbols
3D graphics, 3
<canvas> tag, 1, 52
Internet Explorer, using in, 2
addColorStop( ), 27, 55
affine transforms, 17
arc( ), 4, 2 0 , 65
arcTo( ), 20, 66
B
beginPath( ), 4, 6, 7, 67
bezierCurveTo( ), 21, 68
c variable, 5
canvas dimensions, 13
Canvas object, 51
Canvas Gradient object, 55
CanvasPattern object, 56
CanvasRenderingContext2D
object, 2, 5 3 , 56—65
methods, 58—61
properties, 56
clearRect( ), 2 3 , 69
clip( ), 32, 69
clipping, 32
closePath( ), 7, 70
color names, H T M L 4 standard,
2 4
color spaces supported by CSS3,
2 4
colors, gradients, and patterns,
63
compositing, 39—43, 65
incompabilities, 40
local versus global
compositing, 42
context object, 2
coordinate space and
transformations, 64
coordinate system, 12
transformations (see
transformations)
copy compositing, 40
CRC (see
CanvasRenderingContext
2D object)
createImageData( ), 44, 70
createLinearGradient( ), 27, 71
createPattern( ), 25, 72
We'd like to hear your suggestions for improving our indexes Send email to
index@oreilly.com.
97

createRadialGradient( ), 27, 73
CSS color strings, 24
CSS pixels, 13
curves, drawing and filling, 20—
23
D
destination-over compositing, 40
drawlmage( ), 36, 74
canvas, copying with, 39
drawing context, 2
ExplorerCanvas project, 2
fill( ), 4, Ó, 7, 75
fillRect( ), 23, 76
fillStyle property, 23
fillText( ), 30, 76
G
getContext( ), 2, 11, 52, 53
getImageData( ), 43, 77
security restrictions, 45
globalAlpha property, 25
globalCompositeOperation
property, 39, 78
gradient fills, 25
graphics attributes, 10—12
graphics state management
utilities, 11
graphics state, saving, 65
H
hit detection, 45
HSL color space, 24
ImageData object, 94
images, 36
drawing, 63
isPointInPath( ), 45, 80
JavaScript, vii
Koch snowflake, 18
line width, line caps, and line
joins, 63
line Cap property, 29, 82
line Join property, 30, 82
lineTo( ), 6, 83 '
line Width property, 28
M
measureText( ), 83
miterLimit property, 30, 84
MouseEvent conversion, 46
moveTo( ), 6, 85
N
nonzero winding rule, 9
path, 4, 5, 20
creation and rendering, 61
open and closed subpaths, 7
pattern and gradient fills, 25
pixel manipulation methods, 43,
65
pixels (see CSS pixels)
point adding and connecting
methods, 20
polygons, 7
putImageData( ), 44, 85
Q
quadraticCurveTo( ), 21, 86
98 I Index

R
rect( ), 23, 87
rectangles, drawing, 23, 63
restore( ), 11, 87
rotate( ), 14, 16, 88
compositing operations and,
40
with global alpha, 25
Tufte, Edward, 47
S
w
W e b G L API, 3
webgl string, 3
save( ), 11, 88
scale( ), 14, 16, 89
setTransform( ), 14, 17, 90
shadowBlur property, 35
shadowColor property, 34
shadowOffsetX and
shadowOffsetY
properties, 35
shadows, 34, 64
soft transparency compositing
operations, 40
source-over compositing, 39
sparklines, 47—50
String width and String height
properties, 51
stroke( ), 6, 7, 28, 90
strokeRect( ), 23, 91
strokeStyle property, 23
strokeText( ), 30, 92
subpath, 5
open and closed subpaths, 7
text, 30, 64
textAlign and textBaseline
properties, 31
TextMetrics object, 95
toDataURL( ), 38, 52, 53
transform( ), 17, 92
transformations, 14—18
coordinate space and, 64
example, 18
mathematical explanation,
1 5 - 1 7
order of transformations, 16
trans late ( ), 14, 16, 93
transparency, 23
Index I 99
Document Outline
- TEAM REBOOK
Wyszukiwarka
Podobne podstrony:
C# Language Pocket Reference
oracle plsql language pocket reference fourth edition
oracle dba checklists pocket reference
O Reilly Oracle Language Pocket Reference
Debra Cameron GNU Emacs Pocket Reference
grep Pocket Reference
windows 2000 commands pocket reference
O Reilly Oracle PL SQL Built ins Pocket Reference
perltk pocket reference
Windows PowerShell Pocket Reference
gnu emacs pocket reference
C Pocket Reference C Syntax And Fundamentals (2002)(1st)(Peter Prinz, Ulla Kirch Prinz)
OReilly XML Pocket Reference 2nd
20060919095901218 12 Reference Information
Elfquest Reference Sheets
LM Pracuj spec Referent
więcej podobnych podstron