
407
20.1 Introduction
The latest, fourth IPCC
report states that mean temperature on Earth
increased by approximately 0.74°C between 1906 and 2005. In the northern hemi-
sphere, the second half of the twentieth century was the warmest period since
almost 1,000 years ago (IPCC
. Increases in temperature were also observed
in a large part of Europe during the twentieth century (Yan et al.
; Moberg and
Jones
; Alexander et al.
; Moberg et al.
. The pace of these changes
was fastest within the last quarter of the century (Frich et al.
; Klein Tank and
.
The observable increase in mean annual air temperature is not synchronic in all
parts of the globe, neither spatially nor seasonally (Frich et al.
; Klein Tank
and Können
; Beniston and Stephenson
; Moberg and Jones
;
Alexander et al.
; Brohan et al.
. It is common knowledge that air tem-
perature changes are subject to zonal and regional variability. Some regions of the
world are heated more than others, while temperatures in other parts of the globe
may even drop (Frich et al.
; Klein Tank et al.
; Alexander et al.
;
Moberg et al.
; IPCC
. Studies of seasonal variability of air temperature
indicate that in wintertime, temperatures increased most in Central and Eastern
Europe – up to 3.5°C/10 years (Brázdil et al.
; Jones et al.
; Wibig and
Głowicki
. In northern Europe, winter temperatures slightly decreased.
Summer temperature trends did not exhibit a single direction of change either;
however, temperatures predominantly tended to decrease rather than increase. As
far as autumn is concerned, an almost unchanging growing trend of air temperature
has been recorded in Europe over the last 100 years (Schönwiese et al.
K. Piotrowicz ()
Department of Climatology, Institute of Geography and Spatial Management, Jagiellonian
University, Gronostajowa 7, 30-387, Cracow, Poland
e-mail: k.piotrowicz@geo.uj.edu.pl
Chapter 20
Seasonal Differentiation of Maximum and
Minimum Air Temperature in Cracow and
Prague in the Period 1836–2007
Katarzyna Piotrowicz
R. Przybylak et al. (eds.), The Polish Climate in the European Context:
An Historical Overview
, DOI 10.1007/978-90-481-3167-9_20,
© Springer Science + Business Media B.V. 2010

408
K. Piotrowicz
According to Alexander et al.
warming can be observed in all the seasons;
generally speaking, March to May exhibit the largest and September to November
the smallest change. Thus, it seems that the issue of the direction of change of the
multi-annual course of air temperature on a regional, or even on a local scale,
remains unsolved.
Ko
żuchowski and Marciniak
state that climate changes are more visible
at higher latitudes than in the equatorial belt, and in winter rather than in summer
months. This statement is also partly confirmed by the latest research (Frich et al.
; Jones et al.
; IPCC
. Moreover, deviations from mean multi-
annual air temperature values are greater in the interior of the continents located
in the temperate and polar zones. In consequence, research on climate change
conducted in temperate regions, at high latitudes and in the interior of continents,
is especially important. According to Bryson
, climatic conditions of such
frontier areas are a particularly sensitive indicator of climatic oscillations. Central
Europe, which covers Poland and the Czech Republic, among other countries, is
located precisely at a temperate latitude, in an area where oceanic and continental
air masses collide.
One of the elements used to describe the thermal conditions of a certain town or
region is an analysis of extreme (minimum and maximum) values of air tempera-
ture. According to Kłysik and Fortuniak
, the changeability of extreme
temperatures is the simplest indicator of climate change. In recent years, interest in
the extreme values of various meteorological elements has grown considerably.
Said elements are perceived as a more sensitive indicator of climate change than
mean temperature values (IPCC
. Average trends, for 75 stations mostly
representing west Europe, show a warming for maximum and minimum tempera-
ture (Moberg et al.
. According to Alexander et al.
changes in minimum temperature extremes are higher than of maximum tempera-
ture extremes. Winter has, on average, warmed more (1.0°C/100 years) than summer
(0.8°C/100 years), both for daily maximum (Tmax) and minimum (Tmin) tempera-
tures (Moberg et al.
. The magnitude of the trends is also generally greater for
minimum temperature (Alexander et al.
. This has also been confirmed by
results of research conducted by other authors (Yan et al.
.
According to scientists drafting IPCC
reports, as a consequence of the
increase in temperature, the number of cold and frosty days is set to decrease, while
the frequency of occurrence of hot and very hot days is likely to grow. Over 70%
of the global land area sampled showed a significant decrease in the annual occur-
rence of cold nights and a significant increase in the annual occurrence of warm
nights (Alexander et al.
. Frich et al.
obtained similar results.
Analysing particularly long and homogenous measurement series is a basis for
a reliable evaluation of the variability and climate change trends (Moberg et al.
. Such series are not very frequent in Europe (Jones et al.
which is why the results of research involving an analysis of the multi-annual
course of individual meteorological elements are so important, especially when
compared with other stations. It is thanks to them that it is possible to estimate a
regional variability of the changes or the overall variability of climate.

409
20 Seasonal Differentiation of Maximum and Minimum Air Temperature in Cracow
Numerous studies on climate change in Europe have been published in recent
years, focusing on the regional scale. The investigations are mostly based on mean
annual or seasonal air temperature values (Brunetti et al.
; Yan et al.
;
Degirmendži
ć et al.
. According
to the author, studies on the seasonal differentiation of climate are especially valu-
able, as a great variability of air temperature of individual seasons has been
observed since the 1990s (Ko
żuchowski et al.
; Ko
żuchowski and Żmudzka
; Wibig and Głowicki
The study presents an analysis of the annual differentiation and change tenden-
cies of minimum and maximum air temperature at meteorological stations which
are representative of the climatic conditions prevalent in urban areas of Central
Europe, located below 300 m a.s.l. Besides natural factors such as relief, hydrologic
relations or vegetation, also the economic activity of man (build-up, industry, trans-
port, etc.) exerts considerable influence on the climate of such cities. However, it is
not possible to state clearly whether the contemporary warming is caused by
climate fluctuations or rather by anthropogenic factors. Nevertheless, if we compare
the change tendencies of minimum and maximum air temperatures in Cracow and
Prague, it is possible to assess the regional differentiation of the climate of this part
of Europe, especially since the Cracow series of daily Tmax and Tmin has not been
included in any of more large-scale analyses that have been undertaken (Brázdil
et al.
; Wibig and Głowicki
; Moberg et al.
. Prague series has been
used, but only rarely.
20.2 Data and Methods
The paper draws on the daily values of maximum (Tmax) and minimum (Tmin) air
temperature measured at the Historic Station in Cracow (50°04
¢N, 19°58¢E, 220 m
a.s.l.) and in Prague-Klementinum (50°05
¢N, 14°25¢E, 197 m a.s.l.) between 1836
and 2007. Available are only the data for the last 172 years, although both stations
were established much earlier. Today they both possess series of air temperature
measurements – the Prague series starts in 1775 whereas Cracow’s series dates
back to 1792.
The data, especially concerning mean monthly temperatures, have repeatedly
been compared with other stations and with one another, and deemed homogeneous
(Trepi
ńska
; Brázdil and Budíková
; Kyselý
. Thus far, the daily
values of extreme temperatures from the two stations have not been compared.
In Cracow, extreme thermometers (maximum and minimum ones) have only
been in use since the 1st of July 1837. Earlier values, obtained between the 1 January
1836 and the 30 June 1837 have been reconstructed, applying measurements taken
at 7, 12, 15 and 21 Cracow local time of observation. Maximum temperature
values for this period may be slightly lower than they really were, and the values
of minimum temperature may by higher, which will be taken into consideration
in the conclusions.

410
K. Piotrowicz
Both stations posses quite detailed documentation of the instrumental position
and observation routines (Trepi
ńska
; Brázdil
; Ko
żuchowski et al.
;
Brázdil and Budíková
. In Cracow, they were not altered throughout the entire
analysed period (Trepi
ńska
, while in Prague before 30 May 1889, the loca-
tion of the thermometers was changed several times (Brázdil and Budíková
;
. According to Hlavá
č (1937, see Brázdil
; Brázdil and Budíková
, the aforementioned changes have not affected the homogeneity of the
measurements.
The present study describes the variability of extreme air temperatures in
individual months and seasons. The trends of their changes in the multi-annual
period have been investigated, alongside the change tendency of the so-called
characteristic days, i.e. days with severe frost (Tmax < −10°C), frosty (Tmax <
0°C), hot (Tmax > 25°C) and very hot (Tmax > 30°C) ones. Apart from analyzing
the values for individual months or quarters representing the seasons, the dates of
the beginning and end of thermal seasons have also been determined individually
for each year.
20.3 The Tendencies of Change of Maximum and Minimum
Air Temperature
Between 1836 and 2007, the mean annual maximum temperature of the air in
Cracow equalled 12.8°C and 13.1°C in Prague. It was by 0.3°C higher in Prague.
In the case of minimum air temperature, the difference was greater. It amounted to
1.4°C (Table
). The mean multi-annual value of Tmin in Cracow equalled
4.6°C, and 6.0°C in Prague. Other mean values for individual months have been
listed in Table
.
Analysing the mean monthly values of air temperature between 1826 and 1975,
Trepi
ńska
stated that all seasons are warmer in Prague than in Cracow. A
comparison of the Tmax values for the last 172 years showed that in summer and
autumn, as well as from April to October, Tmax was higher (up to 0.4°C in May)
in Cracow than in Prague, or they were equal (Table
). Mean values of Tmin
were always higher in Prague.
The values of standard deviation presented in Table
greater variability of air temperature in Cracow. The mean maximum temperatures
of July, August, summer and year were characterized by a slightly higher variability
in Prague. Trepi
ńska
also pointed put that the situation is similar in the case
of mean temperature.
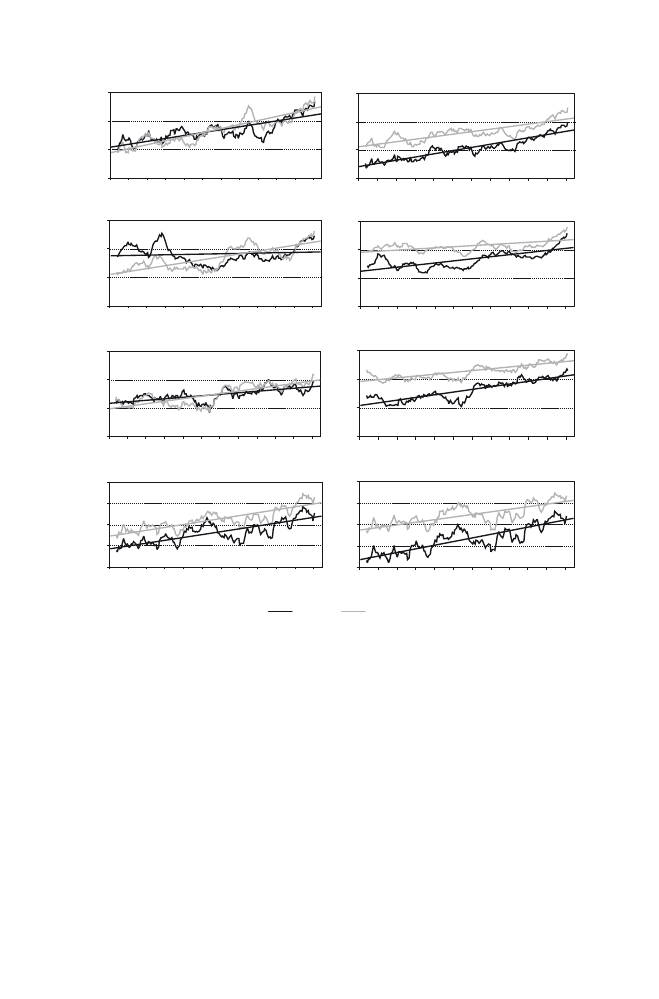
In the multi-annual course of maximum and minimum air temperature in
individual seasons (Fig.
), it is possible to observe a gradual increase from
the beginning of the analysed period onwards. The following were the warmest
seasons in terms of Tmax and Tmin in Cracow and Prague: spring of 2007, sum-
mer of 1992, 2003, 2007, autumn of 2000 and 2006 and winter of 1989/90 and
2006/07. These values are enough to be able to state that particularly warm seasons

411
20 Seasonal Differentiation of Maximum and Minimum Air Temperature in Cracow
Table 20.1
Mean monthly and seasonally maximum (Tmax) and minimum (Tmin) air tempera-
tures (
o
C) and their standard deviations (
s) in Cracow and Prague in the period 1836–2007
Months
seasons
Cracow
Prague
Tmax
s
Tmin
s
Tmax
s
Tmin
s
Jan
0.1
3.2
−5.4
3.7
1.5
2.9
−3.0
3.2
Feb
2.0
3.4
−4.3
3.8
3.2
3.1
−2.1
3.4
Mar
7.0
3.0
−0.7
2.5
7.7
2.7
0.9
2.1
Apr
13.6
2.3
4.1
1.6
13.5
2.2
5.1
1.5
May
19.4
2.2
9.0
1.6
19.0
2.2
9.8
1.5
Jun
22.8
1.8
12.4
1.2
22.5
1.8
13.3
1.2
Jul
24.5
1.7
14.1
1.2
24.2
1.9
15.0
1.1
Aug
23.7
1.6
13.5
1.2
23.5
1.8
14.5
1.1
Sep
19.3
1.9
9.8
1.3
19.3
1.9
11.0
1.2
Oct
13.4
2.2
5.4
1.7
13.2
1.8
6.5
1.5
Nov
6.2
2.3
0.6
2.1
6.5
2.0
2.1
1.8
Dec
1.6
2.8
−3.4
3.1
2.7
2.6
−1.3
2.7
Year
12.8
1.0
4.6
1.1
13.1
1.1
6.0
0.9
Spring
13.3
1.7
4.1
1.4
13.4
1.6
5.2
1.2
Summer
23.6
1.2
13.3
0.9
23.4
1.3
14.3
0.8
Autumn
13.0
1.4
5.3
1.2
13.0
1.3
6.6
1.0
Winter
1.2
2.3
−4.4
2.5
2.5
2.1
−2.1
2.2
were registered at the end of the twentieth century and at the beginning of the
twenty-first century; their temperature can be counted among the highest values
recorded since the beginning of instrumental measurements. Such a concentration
of warm years and seasons occurred simultaneously at both of the analysed sta-
tions (Fig.
The change tendencies of Tmax and Tmin were calculated on the basis of linear
regression for the entire period in question (Table
). The greatest increase was
observed for Tmin in Cracow. In December, said temperature increased by
2.32°C/100 years and in January and winter by 2.25°C/100 years. In Prague, Tmax
increased more than Tmin. The growing trend of Tmax resulted to be especially
significant in March (2.17°C/100 years).
In Cracow, in summer as well as in the three individual months of said season,
the maximum temperature of air did not exhibit and tendency of change. The gra-
dients assume the values from −0.24 in June to 0.47 in August, but they are not
statistically significant. In Prague, however, Tmax significantly rose in individual
months and seasons within the last 172 years (Table
In spring Tmin and Tmax rose at a comparable rate in Cracow (1.38 and
1.48°C/100 years, respectively). In turn, in Prague, the increase in Tmax was faster
(1.89°C/100 years) than the one in Tmin (1.17°C/100 years).
The rate of changes in temperature is lowest in autumn, although it is still char-
acterised by higher and higher values. In Cracow Tmin increased somewhat faster
(1.26°C/100 years) than in Prague (0.84°C/100 years), whereas Tmax increased
faster in Prague (1.17°C/100 years) than in Cracow (0.70°C/100 years).
412
K. Piotrowicz
Summing up, it can be stated that the rate of changes in Tmax and Tmin is
not the same in all the seasons in both cities, although they are located at a
similar latitude (50°N) and altitude (ca. 200 a.s.l.) and in the centre of large
cities. The direction of change in air temperature, however, is almost the same.
Summer temperature is an exception. That is why, in order to conduct a
detailed analysis of the variability of the maximum air temperature, its tenden-
cies and the dynamics of change at both stations, it was also necessary to
investigate the seasonal distribution of hot, very hot and frosty days as well as
days with severe frost.
Fig. 20.1
Courses of maximum (Tmax) and minimum (Tmin) air temperatures smoothed by
11-year moving average and their linear trends in Cracow and Prague in the period 1836–2007
10
12
14
16
1836
1851
1866
1881
1896
1911
1926
1941
1956
1971
1986
2001
Tmax-Spring
20
22
24
26
1836
1851
1866
1881
1896
1911
1926
1941
1956
1971
1986
2001
Tmax-Summer
10
12
14
16
1836
1851
1866
1881
1896
1911
1926
1941
1956
1971
1986
2001
Tmax-Autumn
−2
0
2
4
6
1836
1851
1866
1881
1896
1911
1926
1941
1956
1971
1986
2001
Tmax-Winter
2
4
6
8
1836
1851
1866
1881
1896
1911
1926
1941
1956
1971
1986
2001
Tmin-Spring
10
12
14
16
1836
1851
1866
1881
1896
1911
1926
1941
1956
1971
1986
2001
1836
1851
1866
1881
1896
1911
1926
1941
1956
1971
1986
2001
Tmin-Summer
2
4
6
8
Tmin-Autumn
−7
−5
−3
−1
1
1836
1851
1866
1881
1896
1911
1926
1941
1956
1971
1986
2001
Tmin-Winter
Cracow
Prague
air temperature (
8C)
air temperature (
8C)
air temperature (
8C)
air temperature (
8C)

413
20 Seasonal Differentiation of Maximum and Minimum Air Temperature in Cracow
20.4 The Tendencies of Change of the Number of Hot Days
(Tmax > 25°C) and Very Hot Days (Tmax > 30°C)
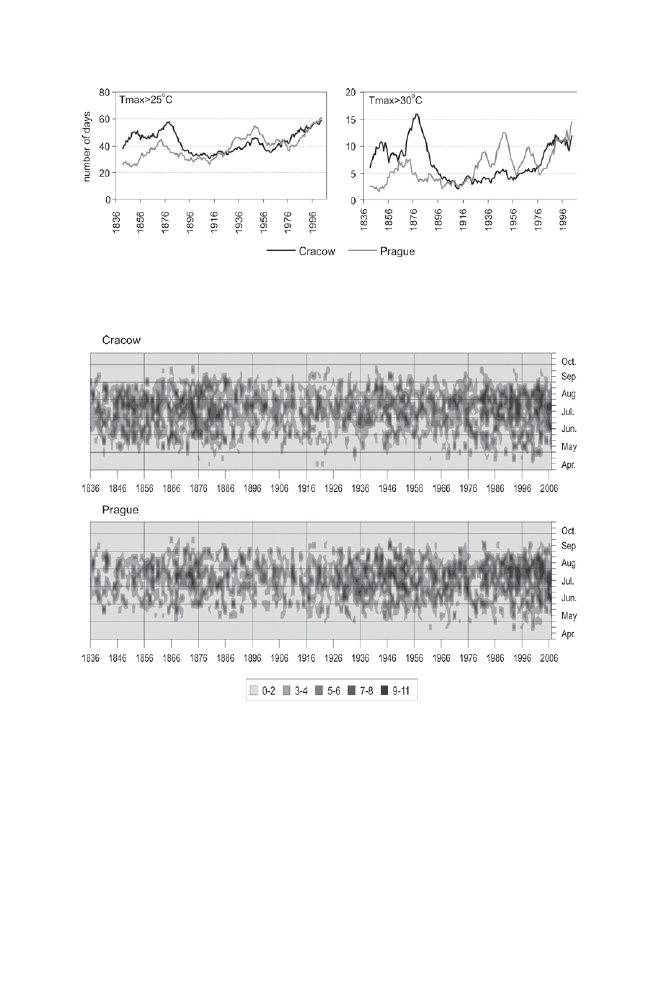
The mean number of hot and very hot days between 1836 and 2007 in Cracow
equalled 43.2 and 7.2, respectively. In Prague these values amounted to 39.2 and
5.8 days. These values show that said days occur with a slightly greater frequency
in Cracow. However, in the multi-annual course, there were periods when there
were more days with Tmax > 25°C and Tmax > 30°C in Prague (Fig.
Nevertheless, there is a strong correlation between the occurrence of these days in
Cracow and Prague. The correlation coefficients equalled 0.610 (Tmax > 25°C) and
0.427 (Tmax > 30°C). Lower values of the coefficient for very hot days indicate
greater influence of local conditions on the frequency of their occurrence. A more
detailed analysis of the occurrence of hot and very hot days in Cracow can be found
in the author’s earlier works (Piotrowicz
; Piotrowicz and Wypych
Said works describe the occurrence of series of such days.
Since the 1950s, it has been possible to observe a gradual increase in the fre-
quency of occurrence of hot and very hot days in Cracow and Prague (Figs.
and
). The calculated values of the trend for the number of days with Tmax >
25°C equalled 4.5 in Cracow and 3.6 days/10 years in Prague, and for days with
Tmax > 30°C they equalled 1.8 and 1.5 days/10 years. The rate of change of said
Table 20.2
Coefficients of the linear trend equation (°C per 100 years) of the mean monthly and
seasonally maximum (Tmax) and minimum (Tmin) air temperatures in Cracow and Prague in the
period 1836–2007
Months seasons
Cracow
Prague
Tmax
Tmin
Tmax
Tmin
Jan
1.88
2.25
1.87
1.79
Feb
1.45
2.09
1.70
1.42
Mar
1.78
1.88
2.17
1.59
Apr
1.28
1.37
1.66
1.01
May
1.07
1.20
1.85
0.91
Jun
−0.24
a
0.72
1.27
0.38
a
Jul
0.27
a
1.03
1.49
0.61
Aug
0.47
a
1.13
1.36
0.54
Sep
0.10
1.05
0.81
0.62
Oct
0.53
0.87
1.00
0.55
Nov
1.46
1.88
1.69
1.36
Dec
1.97
2.32
1.79
1.60
Year
1.00
1.48
1.56
1.03
Spring
1.38
1.48
1.89
1.17
Summer
0.17
a
0.96
1.37
0.51
Autumn
0.70
1.26
1.17
0.84
Winter
1.79
2.25
1.80
1.61
a
Not significant coefficients at the 0.05 level.
414
K. Piotrowicz
days is somewhat greater in Cracow. Comparing the results obtained in the previous
chapter, it is possible to draw a conclusion that despite the lack of the tendencies of
change of maximum temperature in the summer season in Cracow, the frequency
of occurrence of hot and very hot days increases. Unfortunately such a conclusion
might result to be wrong if the seasonal differentiation of the occurrence of the
analysed days is not checked previously.
Fig. 20.2
Courses of number of hot (Tmax > 25°C) and very hot days (Tmax > 30°C) smoothed
by 11-year moving average in Cracow and Prague in the period 1836–2007
Fig. 20.3
Number of hot days (Tmax > 25°C) in particular 10-days period in Cracow and Prague
in the period 1836–2007

415
20 Seasonal Differentiation of Maximum and Minimum Air Temperature in Cracow
In Cracow and Prague, days with Tmax > 25°C occur from April to October. The
potential period of the occurrence of very hot days is slightly shorter. In Prague, it
lasts from May to September and in Cracow from April to September.
Since the 1960s, it has been possible to notice an increase in the frequency of
the occurrence of hot days in the third decade of April and in May (Fig.
).
It is statistically significant at the level of 0.05. The increase in maximum tem-
perature in spring and in May is related to, among other things, the increased
number of days with Tmax > 25°C. An analysis of the multi-annual course of days
with Tmax > 30°C did not show any significant changes in the seasonal differen-
tiation of these days.
20.5 Tendencies of Change of Frosty Days (Tmax < 0°C) and
Days with Severe Frost (Tmax < −10°C)
The climate of Central Europe is characterised by the occurrence of frosty days and
days with severe frost in wintertime. Due to the increase of air temperature in win-
ter, a decrease in the number of days with Tmax < 0°C and Tmax < −10°C can be
expected.
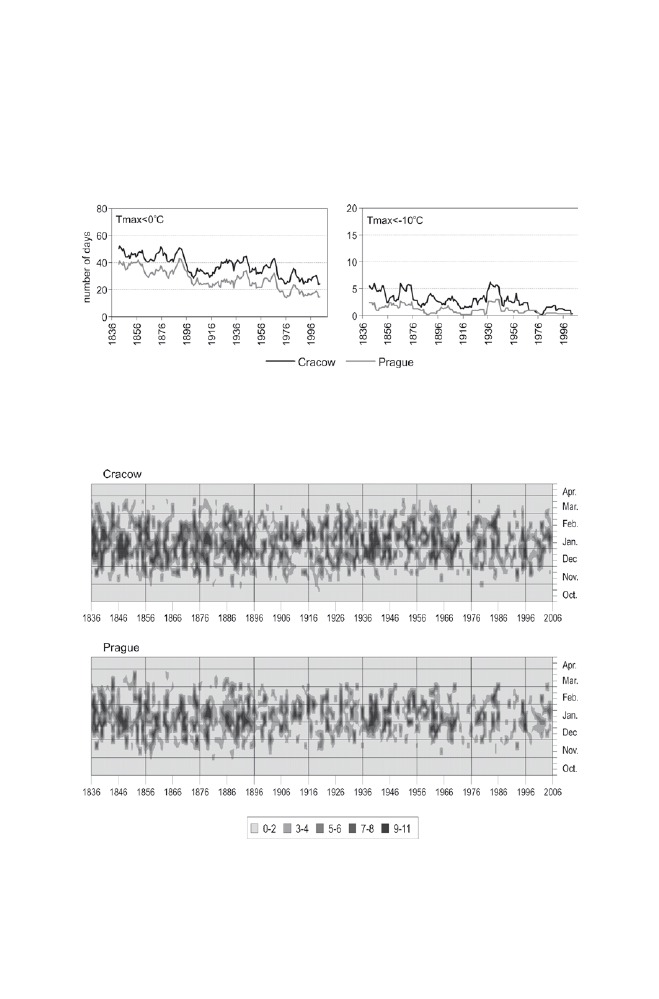
In the entire analysed multi-annual period, the decrease in the number of
frosty days equalled 27.7 in Prague and 23.7 days in Cracow, and in the number
of days with severe frost, it equalled 1.8 and 3.9 days. The slower rate of these
changes is related to the fact that they do not occur every year. Even during very
mild winters they can be registered both in Cracow and in Prague. The reason for
their occurrence is the advection of cold air masses, which most of the time
encompass a large part of the continent. It is possible to assume that in the case
of air temperature in wintertime, its course is synchronic in large areas of Central
Europe. This can be confirmed e.g. by the multi-annual course of frosty days and
days with severe frost in Cracow and Prague (Fig.
) and the calculated cor-
relation coefficient. It equalled 0.915 in the case of Tmax < 0°C and 0.589 for
Tmax < −10°C.
Most often, days with severe frost occur in January and other winter months.
However, they can also be registered in October and November and in March and
April (Piotrowicz
. Since 1836, the potential period of occurrence of frosty
days has been growing significantly shorter (Fig.
). The first day with Tmax <
0°C occurred about 20 days later than at the beginning of the analysed period. The
last day, in turn, was recorded 20 days earlier, both in Cracow and Prague. Thus,
the potential occurrence period is a month shorter than it used to be in the nine-
teenth century.
At the analysed stations, days with severe frost first occurred in November,
but they were more frequent in Prague (1.1% of all days) than in Cracow (0.8%).
In Cracow, days with Tmax < −10°C also occurred in March, and in Prague they
were last recorded in February. In the multi-annual period, the time span of their
416
K. Piotrowicz
Fig. 20.4
Courses of number of frosty days (Tmax < 0°C) and days with severe frost (Tmax <
−10°C) smoothed by 11-year moving average in Cracow and Prague in the period 1836–2007
Fig. 20.5
Number of frosty days (Tmax < 0°C) in particular 10-days period in Cracow and
Prague in the period 1836–2007
occurrence did not change as significantly as in the case of days with Tmax <
0°C. These days occur most frequently in the three winter months, from
December to February.

417
20 Seasonal Differentiation of Maximum and Minimum Air Temperature in Cracow
20.6 Discussion and Conclusions
The analysis of maximum and minimum air temperature variability in Cracow and
Prague presented in the paper refers to the tendencies of change in the thermal
conditions in Central Europe (Klein Tank et al.
; Yan et al.
; Klein Tank
and Können
; Alexander et al.
; Moberg et al.
. The increase in
temperature in Cracow and Prague was in most cases synchronic. The correlation
coefficients between the course of Tmax and Tmin and the number of characteristic
days (hot, very hot, frosty and days with severe frost) indicate the uniformity of
thermal anomalies in a large part of Central Europe. In winter, these correlations
are very high (the coefficient equals 0.8, 0.9), whereas in summer and in the course
of days with Tmax > 25°C and Tmax > 30°C they are smaller (0.4–0.6), although
statistically significant at the level of 0.05. This may result from clear differences
in the course of summer temperature at both stations before 1890 (Fig.
Probably, the homogeneity of the series was disrupted, especially in the case of
Tmax. For the January 1836 – June 1837 period, in Cracow, Tmax and Tmin were
obtained from main-observation-time values. As mentioned in the “Data and meth-
ods” section, the reconstructed Tmax values for Cracow are certainly lower than it
would seem from the reading of a maximum thermometer, while in Prague, the
thermometers were relocated several times before 1890. According to Kyselý
, although the observations have been continuous since 1775, the years
1901–97 are mainly examined, as the period with the most credible data.
An analysis of monthly, seasonal and annual mean values of Tmax and Tmin in
Cracow and Prague within the last 172 years showed that maximum temperature
from April to October, as well as that in summer and autumn, was usually higher
in Cracow than in Prague. In the case of Tmin, the station in Prague recorded higher
temperatures. Generally, also the variability of the analysed temperatures is greater
in Cracow, both from year to year and in individual seasons. Only the mean values
of Tmax for July, August, summer and the entire year were characterized be a
slightly greater variability in Prague.
In the multi-annual course, it is possible to notice a gradual increase in air tem-
perature in Cracow and Prague. Years and seasons at the turn of the twenty-first
century were very warm. In many cases they could be counted among extreme
values. These were the highest air temperatures since the beginning of instrumental
observations. These results are consistent with analyses conducted for other sta-
tions in Europe and in the world (Frich et al.
; Wibig and Głowicki
;
Degirmendži
ć et al.
; Alexander et al.
; Moberg et al.
In Cracow, since 1836, the greatest increase in temperature has occurred in the
case of Tmin, especially in December, January and winter. In Prague, maximum
temperature, especially in March, was characterized by the greatest growing
trend.
In Cracow in summer, maximum air temperature did not show a clear tendency
of change (neither was it statistically significant), whereas in Prague it increased
significantly. However, this regional differentiation, identified on the basis of a

418
K. Piotrowicz
172-year-long measurement series, is in line with the results of research carried out
by other authors (Yan et al.
; Moberg and Jones
; Alexander et al.
;
Moberg et al.
The rate of changes of Tmax and Tmin in intermediate seasons in Cracow and
Prague was comparable. It was slightly greater in spring than in autumn.
In order to conduct an in-depth analysis of the variability of maximum air tem-
perature, its trends and the dynamics of change at both of the analysed stations, it
was necessary to investigate the seasonal distribution of the number of characteris-
tic days: hot, very hot, frosty and days with severe frost. An important decrease in
the number of frosty days and days with severe frost was observed at both stations.
The potential period of their occurrence became a month shorter. However, in spite
of the occurrence of very mild winters in recent years, days with Tmax < 0°C or
even Tmax < −10°C can occur, although with low frequency, from November to
March (Tmax > 0°C) or from December to February (Tmax < −10°C) and in
Cracow even to March.
The number of hot and very hot days, especially since the 1950s, has increased
at both stations. More and more often, they are recorded earlier, at the end of April
and in May. It results that, in spite of a very clear tendency of change in summer
temperature, days with Tmax > 25°C and Tmax > 30°C have started occurring
more and more often.
Many studies analysing both mean and extreme temperature change tendencies
have been published recently. They draw on multi-annual measurement series from
stations representing various climatic regions of Europe, as well as on data obtained
by means of re-analyses (Klein Tank et al.
; Moberg and Jones
; Moberg
et al.
.
According to some researchers, the temperature rise in recent decades is basi-
cally associated with an increase in warm extremes, rather than with a reduction in
cold extremes (Klein Tank and Können
; Yan et al.
. However, other
authors have reached the opposite conclusion. Alexander et al.
generally a much larger percentage of land area in Europe shows significant change
in minimum temperature extremes than in maximum temperature extremes imply-
ing that in many places, our world has become less cold rather than hotter. It is
especially obvious in the case of a clear decrease in the annual occurrence of cold
nights. The results included in this study are in line with this suggestion.
Thus, an analysis of temperature change tendencies for various periods may lead
contradictory results. Klein Tank and Können
investigated the trends in indi-
ces of climate extremes on the basis of daily series of temperature observations from
more than 100 meteorological stations in Europe between 1946 and 1999. They
noticed that if the period is split into two sub-periods (1946–75 and 1976–99), the
tendencies of change are not “symmetrical” – warming of the cold and warm tails of
the distributions of daily minimum and maximum temperature in Europe. This is
further confirmed by the results of research carried out by Moberg et al.
.
The causes of the analysed variability of thermal conditions in Central Europe are
still unclear. It seems that natural factors, such as atmospheric circulation, play an
important role. They are intensified by anthropopressure, e.g. the urban heat island.

419
20 Seasonal Differentiation of Maximum and Minimum Air Temperature in Cracow
The observed increase in temperature considerably exceeds the natural
changeability of the climate (IPCC
. Philipp et al.
, for the period
1850–2003, explored long-term changes of the atmospheric circulation and its
impact on long-term temperature variability in the central European region. The
preliminary results of their research indicate that tentative estimations of central
European temperature changes based solely on seasonal cluster frequencies can
explain between about 34% (summer) and 59% (winter) of temperature variance
on the seasonal time scale. Also Yan et al.
believe that changes in atmo-
spheric circulation lead to changes in temperature.
According to Scaife and Folland
North Atlantic Oscillation may influ-
ence air temperature changes in the winter season in Europe. However, it is
unknown whether the observed rate of changes in atmospheric circulation and the
NAO will persist in the coming decades.
As the IPCC
report states, climate changes can be attributed to human
activity with a 90% probability. Alongside other researchers, also Stott et al.
attribute temperature increases to anthropogenic factors.
Anthropogenic factors, including the urban heat island (UHI), influenced the
increase in maximum and minimum temperature in the entire analysed period in
Cracow and Prague alike. Brázdil and Budíková
analysed the impact of the
UHI on seasonal and annual temperature values in Prague Klementinum, using
measurement data from stations located outside the city for the years 1922–1995.
Urban warming was most conspicuous in winter and in spring (0.063°C/10 years),
and the smallest and least significant in summer (0.01°C/10 years). These values are
somewhat higher than previously estimated (Brázdil
. Since the 1960s, a stag-
nation in the development of the UHI has appeared (Brázdil, Budíková 1999). The
degree of urban warming prior to 1922 is difficult to assess because of a lack of a
suitable set of homogeneous reference stations. When analyzing the values of air
temperature in Cracow and two selected nearby cities, Ko
żuchowski et al.
noticed an increasing trend of air temperature in neighbouring stations, but it was
two twice as small (0.11ºC in 10 years) as the one in Cracow (0.24ºC in 10 years).
According to Trepi
ńska and Kowanetz
, however, it seems impossible to con-
sider the contemporary warming process a result only of the development of the city.
The influence of growing urbanization cannot dominate natural processes, which
take place in the atmosphere above Cracow (Trepi
ńska and Kowanetz
It is also worth considering, like Ko
żuchowski and Żmudzka
did, whether
the increase in maximum and minimum temperature is permanent, or if it is only a
short-term oscillation.
The measurement series from Cracow and Prague have been considered as
referential ones and are used to complete the missing data from other stations. In
consequence, learning more about the change tendencies of extreme temperatures
at those stations and comparing them can be helpful in further climatologic analy-
ses. In this kind of analyses, Central Europe is represented by a scant number of
stations (Jones et al.
; Klein Tank and Können
; Moberg and Jones
;
Moberg et al.
. The oldest measurement series ought to be investigated with
special caution, as they can turn out not to be homogeneous. Moberg and Jones

420
K. Piotrowicz
were right in claiming that a larger number of stations possessing long-term
homogeneous measurement series is indispensable to be able to explore the regional
differentiation of temperature change tendencies, including temperature extremes.
The station is Cracow can become one of them.
Acknowledgments
This study was supported by a grant from the Ministry of Science and
Higher Education (No N306 049 32/3237).
References
Alexander LV, Zhang X, Peterson TC, Caesar J, Gleason B, Klein Tank AMG, Haylock M, Collins
D, Trewin B, Rahimzadeh F, Tagipour A, Rupa Kumar K, Revadekar J, Griffiths G, Vincent L,
Stephenson DB, Burn J, Aguilar E, Brunet M, Taylor M, New M, Zhai P, Rusticucci M,
Vazquez-Aguirre JL (2006) Global observed changes in daily climate extremes of temperature
and precipitation. J Geophys Res 111:D05109. doi:
Beniston M, Stephenson DB (2004) Extreme climatic events and their evolution under changing
climatic conditions. Glob Planet Change 44:1–9
Brázdil R (1993) The homogeneity of air temperature measurements Prague-Klementinum with
respect to the intensification of the urban heat island. Zesz Nauk UJ, Prace Geogr 95:67–74
Brázdil R, Budíková M (1999) An urban bias in air temperature fluctuations at the Klementinum,
Prague, The Czech Republic. Atmos Environ 33:4211–4217
Brázdil R, Budíková M, Auer I, Böhm R, Cegnar T, Faško P, Lapin M, Gaji
ć-Čapka M, Zaninović
K, Koleva E, Nied
źwiedź T, Ustrnul Z, Szalai S, Weber RO (1996) Trends of maximum and
minimum daily temperatures in Central and Southeastern Europe. Int J Climatol 16:765–782
Brohan P, Kennedy JJ, Harris I, Tett SFB, Jones PD (2006) Uncertainty estimates in regional and
global observed temperature changes: A new data set from 1850. J Geophys Res 111:D12106
Brunetti M, Buffoni L, Maugeri M, Nanni T (2000) Trends of minimum and maximum daily
temperatures in Italy from 1865 to 1996. Theor Appl Climatol 66:49–60
Bryson RA (1974) A perspective on climate change. Science 184:4138
Degirmendži
ć J, Kożuchowski K, Żmudzka E (2004) Changes of air temperature and precipitation
in Poland in the period 1951–2000 and their relationship to atmospheric circulation. Int J
Climatol 24:291–310
Frich P, Alexander LV, Della-Marta P, Gleason B, Haylock M, Klein Tank AMG, Peterson T
(2002) Observed coherent changes in climatic extremes during the second half of the twentieth
century. Clim Res 19:193–212
IPCC (2007) Climate change 2007: the physical science basis. Cambridge University Press,
Cambridge
Jones PD, Briffa KR, Osborn TJ, Moberg A, Bergström H (2002) Relations between circulation
strength and the variability of growing-season and cold-season climate in northern and central
Europe. Holocene 12:643–656
Klein Tank AMG, Wijngaard JB, Können GP, Böhm R, Demarée G, Gocheva A, Mileta M,
Pashiardis S, Hejkrlik L, Kern-Hansen C, Heino R, Bessemoulin P, Müller-Westermeier G,
Tzanakou M, Szalai S, Pálsdóttir T, Fitzgerald D, Rubin S, Capaldo M, Maugeri M, Leitass A,
Bukantis A, Aberfeld R, Van Engelen AFV, Forland E, Mietus M, Coelho F, Mares C,
Razuvaev V, Nieplova E, Cegnar T, Antonio López J, Dahlström B, Moberg A, Kirchhofer W,
Ceylan A, Pachaliuk O, Alexander LV, 35 Petrovic P (2002) Daily dataset of 20th-century
surface air temperature and precipitation series for the European climate assessment. Int J
Climatol 22:1441–1453
Klein Tank AMG, Können GP (2003) Trends in indices of daily temperature and precipitation
extremes in Europe, 1946–1999. J Climate 16(22):3665–3680

421
20 Seasonal Differentiation of Maximum and Minimum Air Temperature in Cracow
Kłysik K, Fortuniak K (1995) Skrajne warto
ści temperatury powietrza w Łodzi w okresie 1951–
1990. In: Kłysik K (ed) Klimat i bioklimat miast, Uniwersytet Łódzki:117–127
Ko
żuchowski K, Degirmendžić J, Fortuniak K, Wibig J (2000) Trends to change in seasonal
aspects of the climate in Poland. Geogr Pol 73:7–24
Ko
żuchowski K, Marciniak K (1986) Fluktuacje i tendencje zmian temperatury powietrza w
Europie w latach 1881–1970. Act Univ Nic Copernici, Geogr XIX, Nauki Mat-Przyr 60:69–88
Ko
żuchowski K, Trepińska J, Wibig J (1994) The air temperature in Cracow from 1826 to 1990:
persistence, fluctuations and the urban effect. Int J Climatol 14:1035–1049
Ko
żuchowski K, Żmudzka E (2001) Ocieplenie w Polsce: skala i rozkład sezonowy zmian tem-
peratury powietrza w drugiej połowie XX wieku. Przegl Geofiz 46(1–2):81–90
Kyselý J (2002) Temporal fluctuations in heat waves at Prague-Klementinum, The Czech Republic,
from 1901–97, and their relationships to atmospheric circulation. Int J Climatol 22:33–50
Lorenc H (2007) Zmienno
ść i tendencje maksymalnej i minimalnej temperatury powietrza w
Warszawie w okresie 1897–2002. Wiad IMGW 1(51)4:3–32
Moberg A, Jones PD (2004) Regional climate model simulations of daily maximum and minimum
near-surface temperatures across Europe compared with observed station data 1961–1990.
Clim Dynam 23:695–715
Moberg A, Jones PD (2005) Trends in indices for extremes in daily temperature and precipitation
in Central and Western Europe analyzed 1901–1999. Int J Climatol 25:1149–1171
Moberg A, Jones PD, Lister D, Walther A, Brunet M, Jacobeit J, Alexander LV, Della-Marta PM,
Luterbacher J, Yiou P, Chen D,. Klein Tank AMG, Saladiée O, Sigró J, Aguilar E, Alexandersson
H, Almarza C, Auer I, Barriendos M, Begert M, Bergström H, Böhm R, Butler CJ, Caesar J,
Drebs A, Founda D, Gerstengarbe F-W, Micela G, Maugeri M, Österle H, Pandzic K, Petrakis
M, Srnec L, Tolasz R, Tuomenvirta H, Werner PC, Linderholm H, Philipp A, Wanner H,
Xoplaki E (2006) Indices for daily temperature and precipitation extremes in Europe analyzed
for the period 1901–2000. J Geophys Res 111:D22106, doi:10.1029/2006JD007103
Philipp A, Della-Marta PM, Jacobeit J, Fereday DR, Jones PD, Moberg A, Wanner H (2007)
Long-term variability of daily North Atlantic-European pressure patterns since 1850 classified
by simulated annealing clustering. J Climate 20:4065–4095
Piotrowicz K (2003a) Variability of the Central European winter thermal structure. Acta Univ
Wratislav 2542. Studia Geogr 75:108–115
Piotrowicz K (2003b) Variation des conditions biotermiques defavorables a Cracovie. Dok Geogr
29:285–288
Piotrowicz K, Wypych A (2006) Long-term variations in the number of hot, very hot and sultry
days in Kraków. Global Change 13:43–58
Scaife AA, Folland CK (2008) European climate extremes and North Atlantic Oscillation. J
Climate 21:72–83
Schönwiese CD, Rapp J, Fuchs T, Denhard M (1994) Observed climate trends in Europe 1891–
1990. Meteorol Zeit 3:22–28
Stott P, Stone D, Allen M (2004) Human contribution to the European heat wave of 2003. Nature
432:610–614
Trepi
ńska J (1982) Characterization of the measurement series at the Jagiellonian University
climatological station. Zesz Nauk UJ, Prace Geogr 55:9–29
Trepi
ńska J (1984) Zmienność w przebiegu ciśnienia i temperatury powietrza w Krakowie i w
Pradze (1826–1975). Zesz Nauk UJ, Prace Geogr 58:65–80
Trepi
ńska J, Kowanetz L (1997) Wieloletni przebieg miesięcznych wartości temperatury powie-
trza w Krakowie (1792–1995). In: Trepi
ńska J (ed) Wahania klimatu w Krakowie (1792–1995).
IG UJ, Kraków
Wibig J, Głowicki B (2002) Trends of minimum and maximum temperature in Poland. Clim Res
20:123–133
Yan Z, Jones PD, Davies TD, Moberg A, Bergström H, Camuffo D, Cocheo C, Maugeri M,
Demarée GR, Verhoeve T, Thoen E, Barriendos M, Rodríguez R, Martín-Vide J, Yang C
(2002) Trends of extreme temperatures in Europe and China based on daily observations. Clim
Change 53:355–392
Document Outline
- Chapter 20
- Seasonal Differentiation of Maximum and Minimum Air Temperature in Cracow and Prague in the Period 1836–2007
- 20.1 Introduction
- 20.2 Data and Methods
- 20.3 The Tendencies of Change of Maximum and Minimum Air Temperature
- 20.4 The Tendencies of Change of the Number of Hot Days (Tmax > 25°C) and Very Hot Days (Tmax > 30°C)
- 20.5 Tendencies of Change of Frosty Days (Tmax < 0°C) and Days with Severe Frost (Tmax < −10°C)
- 20.6 Discussion and Conclusions
- References
- Seasonal Differentiation of Maximum and Minimum Air Temperature in Cracow and Prague in the Period 1836–2007
Wyszukiwarka
Podobne podstrony:
Pearson Archeology of death and Burial Eating the body
Keyes, J Gregory Kingdoms of Thorn and Bone 02 The Charnel Prince
Center of Earth and Sky 2 Painting the Desert
Heroes of Might and Magic III The Shadow of Death instrukcja
Cambridge History Of English And American Literature The Victorian Age Part 1
Волощук Medieval Slovakia and Croatia as the second homeland of nobility and peoples from the Rus’ i
Pearson Archeology of death and Burial Eating the body
Manual of Savate and English Boxing the Leboucher Method
An Assessment of the Efficacy and Safety of CROSS Technique with 100% TCA in the Management of Ice P
Nadelhoffer; On The Importance of Saying Only What You Believe in the Socratic Dialogues
2000 Influence of Fiber Fermentability on Nutrient Digestion in the Dog
Fake crop of Baptistic malicious spirits dummy baptism in the Spirit as taught by pastor John Torell
Żurawski vel Grajewski, Przemysław Poland in the Period of Partitions 1795–1914 (2015)
Sources of Moral Obligation to Non Muslims in the Fiqh Al Aqalliyyat
Risk of Cancer by ATM Missense Mutations in the General Population
Gender and Racial Ethnic Differences in the Affirmative Action Attitudes of U S College(1)
więcej podobnych podstron