
1
“Learn how to trade EUR/USD, USD/CAD, GBP/USD or
any other major currency pair by mastering a system
that combines top level mathematics with the
fundamental principles of human behavior - simplified
in such a way that even a high school dropout can
quickly start profiting from it...”
by Quantum Globe Inc.
A “crack team” consisting of a top level PhD
mathematician, a computer wizard and a behavioral
psychologist is put together by a street smart trading
professional to produce...
“A lethal “knee to the groin, thumb to the eye”
Forex
Trading Strategy
that transforms any average person into
a ruthless money making predator that makes even the
most hardened trading sharks spin their heads in
disbelief... ”
Copyright © 2005 All rights reserved
First Edition 2005. ISBN 0-0997773-04

2
Table Of Contents
Chapter 1 Introduction ________________________________ 3
1.1. Why should you trade forex market?........................................................ 4
1.2. Which strategy should you use?................................................................ 5
1.3. The ICWR phenomenon............................................................................ 6
1.4. Simplified trading example ....................................................................... 8
Chapter 2 Scientific Research _________________________ 19
2.1. Market signals based on the ICWR phenomenon .................................. 21
2.2. The proper long-term filter...................................................................... 26
2.3. Consistency checks.................................................................................. 29
2.4. Why is our entry strategy so profitable? ................................................. 34
2.5. Why is our exit strategy so profitable? ................................................... 35
Chapter 3 The Intraday ICWR Trading Rules ___________ 41
3.1. Market signals generated by ICWR........................................................ 42
3.2. When to enter a trade............................................................................... 55
3.3. When to exit a trade................................................................................. 56
Chapter 4 Intraday EUR/USD Trading Example _________ 58
Chapter 5 Intraday CAD /USD Trading Example _________ 75
Chapter 6 The Long-Term ICWR Trading Rules _________ 89
6.1. When to enter a trade............................................................................... 90
6.2. When to exit a trade................................................................................. 90
Chapter 7 Long-Term EUR/USD Trading Example _______ 91
Chapter 8 Long-Term GBP/USD Trading Example ______ 113

3
Chapter 1
Introduction
Two completely opposite “schools of thought” dominate today’s public opinion when it
comes to financial markets. One school of thought is advocated by academic types,
mostly economics, finance and mathematics professors. They will tell you that “markets
are efficient” and that there is a zero chance for an individual to outperform any liquid
financial market in the long run. Well, of course the guys with cushy university jobs,
without any real world or business experience, will tell you that you don’t stand a chance
to succeed. You should continue to work your little day job so that they have someone to
make their sandwich or to change oil in their cars. People who subscribe to this theory
usually choose to stay out of financial markets and keep their cash stashed in their
mattresses.
Another school of thought is advocated by financial TV and radio stations, investment
firms, brokerages etc… “Surprisingly” they are all trying to portray financial markets as
an idyllic place where happy Moms, Dads and Grandpas use sophisticated software to
place winning trades from their laptops while vacationing on sandy Caribbean beaches…
Countless “talking heads” are enjoying their daily parade on TV channels such as CNBC
or CNN supplying mostly worthless advice to general public. Their “analysts” change
their opinion every day in a fashion that even George Orwell would find hard to
comprehend. And everything they say always seems to “make sense” at the moment when
they are saying it. Next day, when it turns out that they were totally wrong, they are
telling you an entirely different story as if yesterday never happened. And if you noticed,
the hosts never, ever bring that up. Why? Well, “the show must go on”. They have to
show you that every day you are missing on countless trading opportunities; you just need
to watch their shows, subscribe to fancy software that they sell you and you are on your
way to early retirement.

4
A question that I hear the most from aspiring traders is “Which market should I trade? -
Stocks, Futures, Commodities...?” Well, with the right attitude and dedication there is
money to be made in every market. However, there is one market that is still largely
neglected by smaller traders even though it offers great profit potential and numerous
trading opportunities. It is Forex or Foreign Exchange market.
1.1. Why should you trade forex market?
Simply said, no other trading instrument comes even closely to forex market when it
comes to liquidity, 24hr market environment and last but not the least, profit potential.
Forex (currency) market is the largest (most liquid) financial market in the world, with an
average daily volume of more than US$ 1.5 trillion, which is more than all of the global
equity markets combined.
Forex trading day starts in Wellington, New Zealand followed by Sydney, Australia,
Hong Kong and Singapore. Three hours later trading day begins in Dubai (UAE) and
other Middle Eastern countries. In couple of hours they are followed by Frankfurt, Zurich,
Paris, Rome… London is the last one to open in Europe and five hours later it is followed
by New York, Chicago and finally the West Coast. The busiest hours are early European
mornings because at that time major Asian exchanges are still open and European
afternoons because at that time major US markets are open at the same time as Europe.
Therefore, wherever you live and whatever your work hours are you can always find
I do agree with the statement that financial markets are efficient. They are very
efficient in one thing - transferring money from bad and naive traders/investors to
the pockets of those that know what are they doing. You are now probably asking
yourself “What am I doing in this field? Do I have any chance to succeed?” The
answer is “Yes, you do.”. The system that we are about to reveal to you is a fail
proof entry and exit strategy that will put you on equal level with big investment
firms and with experienced professional traders.

5
some time to participate in forex trading as opposed to stock market where you are
usually limited to the regular business hours.
Another property of forex market that makes it an excellent trading instrument is use of
leverage. Many beginning traders don’t fully understand the concept of leverage.
Basically, if you have a start up capital of $5,000 and if you trade on a 1:50 margin you
can effectively control a capital of $250,000. However, a two percent move against you
and your capital is completely wiped out. If you are a beginning trader you should not use
more than 1:20 margin until you get comfortable and profitable and then and only then
you can attempt to use higher margins. What does 1:20 margin mean? It means that with
your $5,000 you will control a capital of $100,000. Let’s say you are trading EUR/USD
and by using our entry strategy you have decided to enter the trade on a long side. That
means that you are betting that USD will depreciate against Euro. Let’s say current
EUR/USD rate is 1.305. Again, if your trading capital is $5,000 and you are using 1:20
leverage you will effectively be exchanging $100,000 to Euros. If the current rate is 1.305
you will receive 100,000/1.305 = 76,628 Euros. If the trade goes in your direction the
margin will work in your favour and 1% decline in USD will mean 20% increase in your
start up capital. So if EUR/USD rate moves from 1.305 to 1.318 you will be able to
exchange your 76,628 Euros back to $101,000 for a profit of $1,000. Since your start up
capital was $5,000 it is effectively a 20% increase in your account. However, if the trade
went against you and USD appreciated 1% vs. Euro your account would be reduced to
$4,000. That would not have happened as our strategy has built in hard stops to prevent
such outcome.
And the third and equally important property of forex market is the fact that trends in
forex market last longer and are more clearly defined than in any other trading instrument.
1.2. Which strategy should you use?
Another question that is often asked by aspiring traders is “What kind of trading approach
should I use – day trading, swing trading, position trading? How many indicators should I
use? Should I follow the TV news channels?...”
6
If you are facing similar dilemmas let me try to make an analogy. If you were attacked in
a dark alley and you felt that your life was in real danger what kind of defence technique
would you attempt to use. Would you attempt to kick your assailant with some fancy
kung fu move that you saw in a movie? Or would you use some basic but brutally
effective “knee to the groin”, “thumb to the eye” technique that is easy to implement and
that you are 100% certain will have an effect? When you have your hard earned money
riding on your trades maybe your life is not at stake but your and your family’s livelihood
is. The goal of all the other traders in the market is to take your money. And if you are
going to play around with some fancy tools and indicators that you don’t even understand
you can be assured that your hard earned money will be paying someone’s BMW lease
payments.
1.3. The ICWR phenomenon
Regardless of how strong a long-term market trend is, the market never moves only in the
direction of the long-term trend – there are always minor movements against the long-
term market trend. These deviations usually don’t last very long and after them the market
moves again in the direction of the long-term trend.
The major market movements in the direction of the long-term market trend are called
impulsive waves and the minor market movements against the long-term market trend
are called corrective waves.
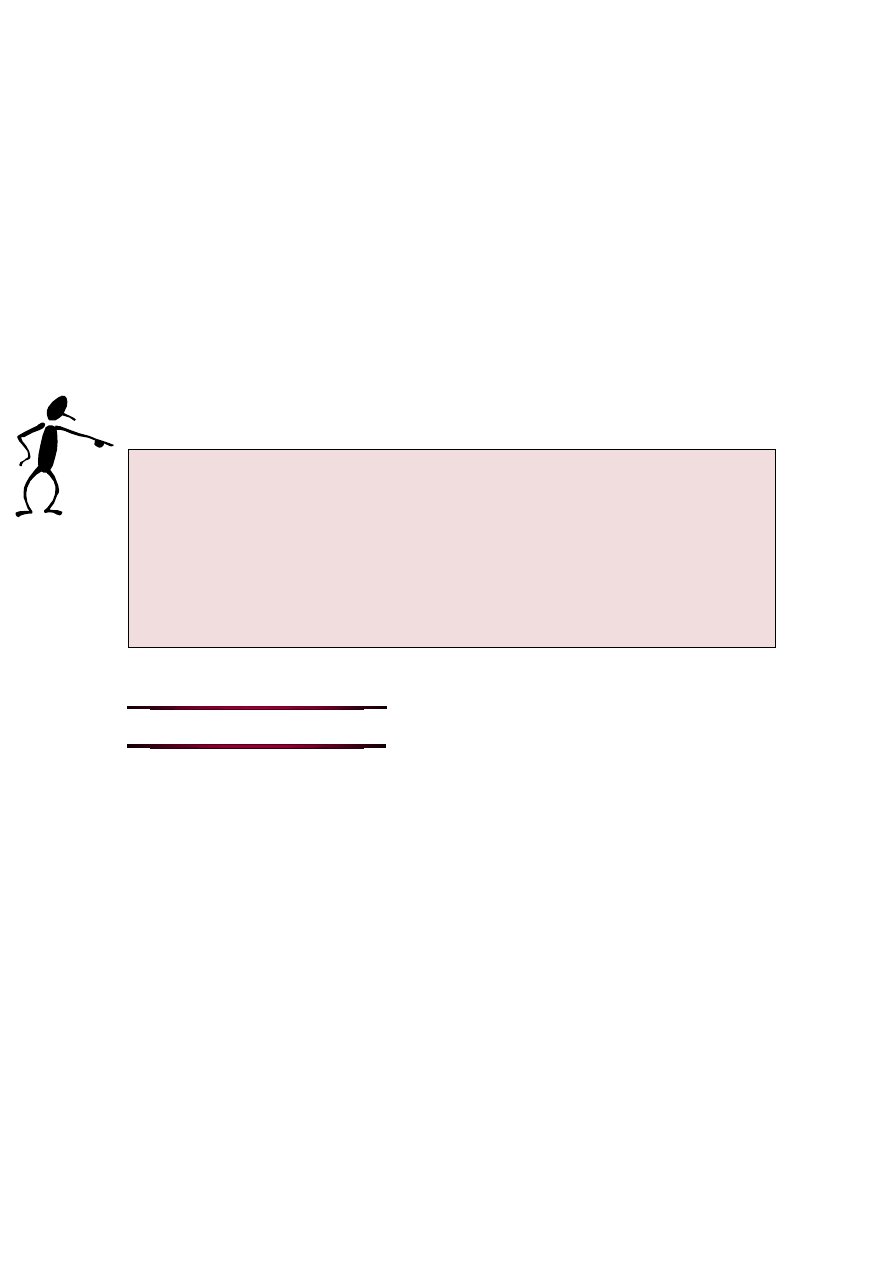
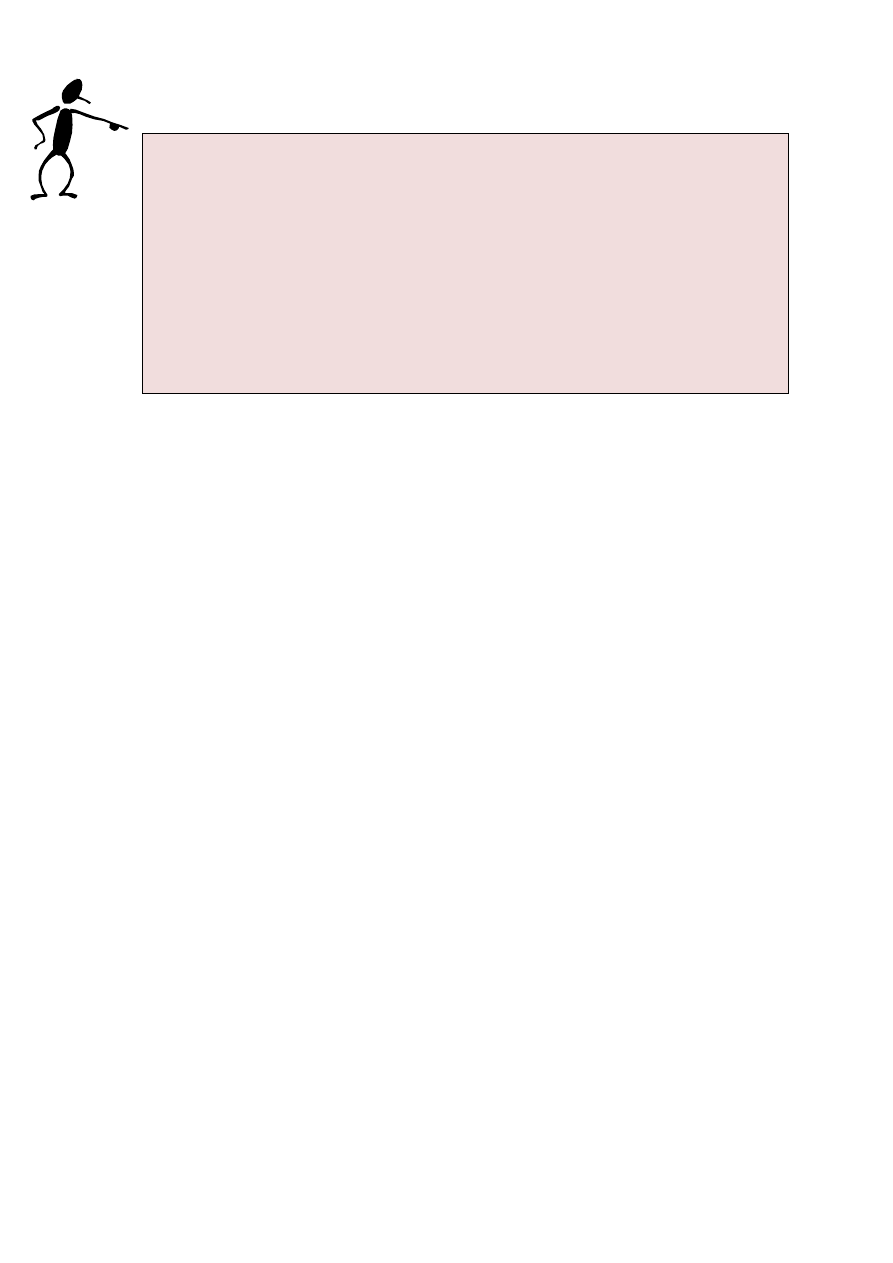
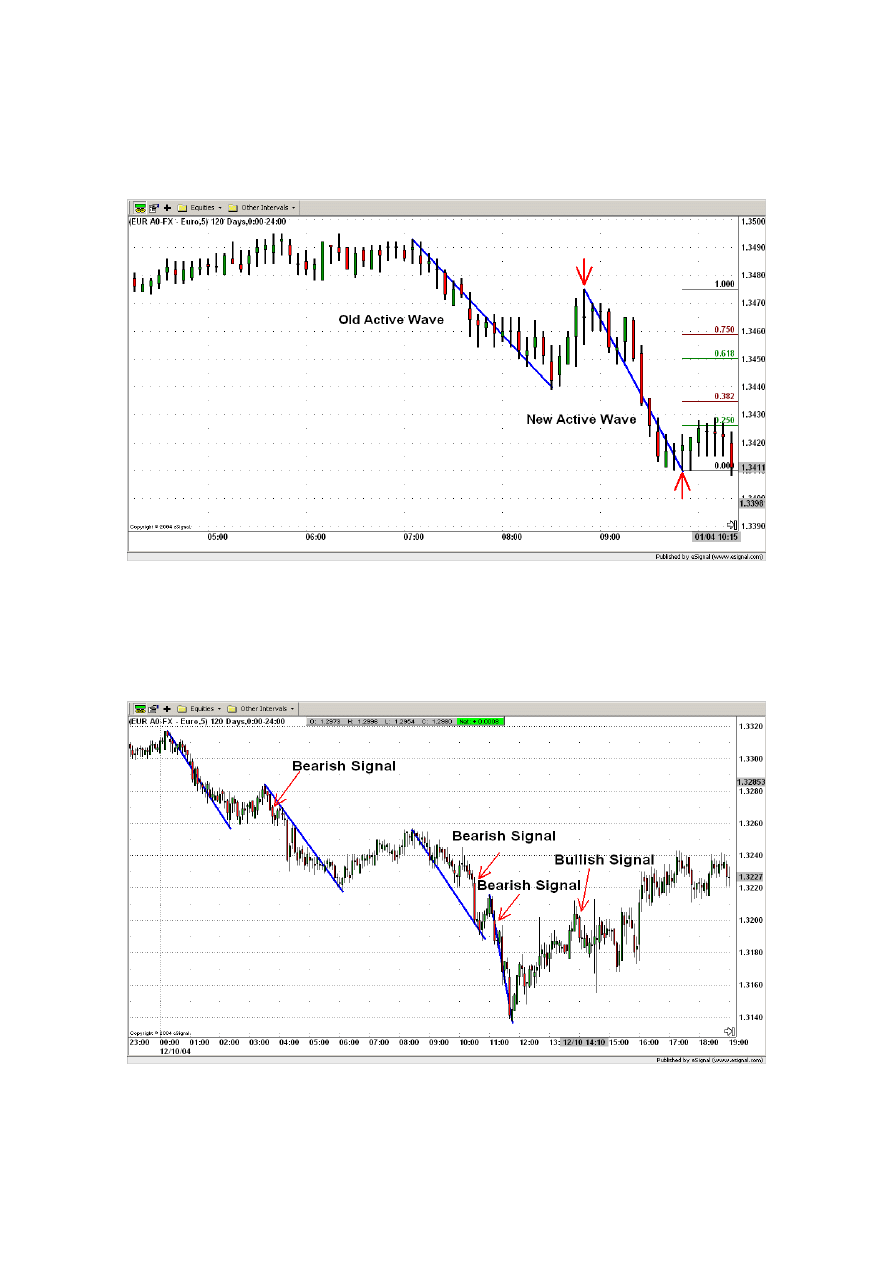
The picture below (Figure 1.1) shows a snapshot of a EUR/USD candlestick chart.
Although the market shows both upward and downward market movements it can be
easily recognized that the long-term market trend is clearly bearish as between 07:00 AM
If you want to get to the top of the forex market “food chain” you have come to
the right place. The strategy that we are about to reveal to you is a completely
new, efficient and reliable trading strategy that comes as the result of years of
forex market research using sophisticated mathematical methods and is based on
a fundamental property of financial markets.
7
and 11:00 AM the price failed around 140 pips (from 1.3500 at 07:00 AM to 1.3360 at
11:00 AM, that is 1.3500 - 1.3360 = 0.0140 = 140 pips). The waves (1), (3) and (5) are
the impulsive waves; the waves (2) and (4) are the corrective ones.
Figure 1.1.
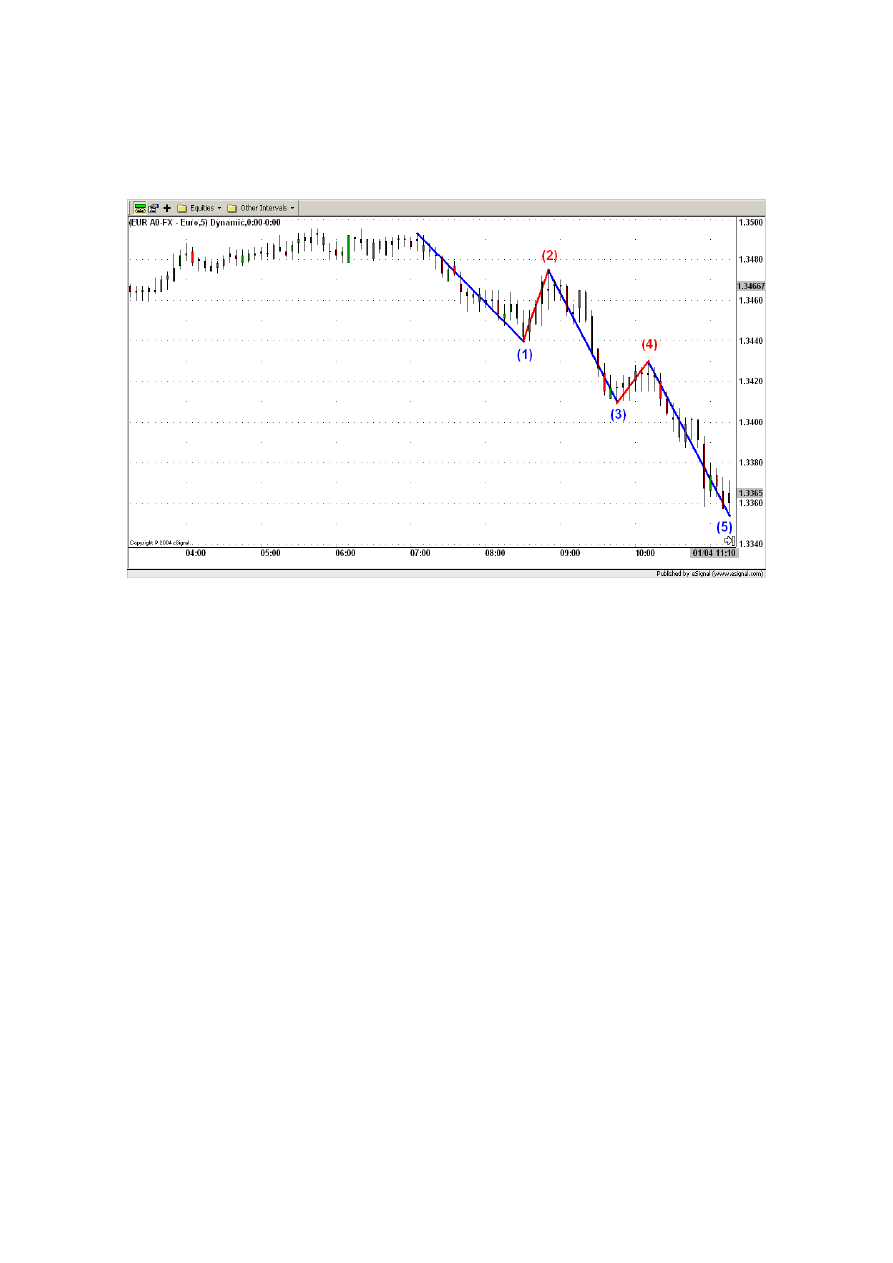
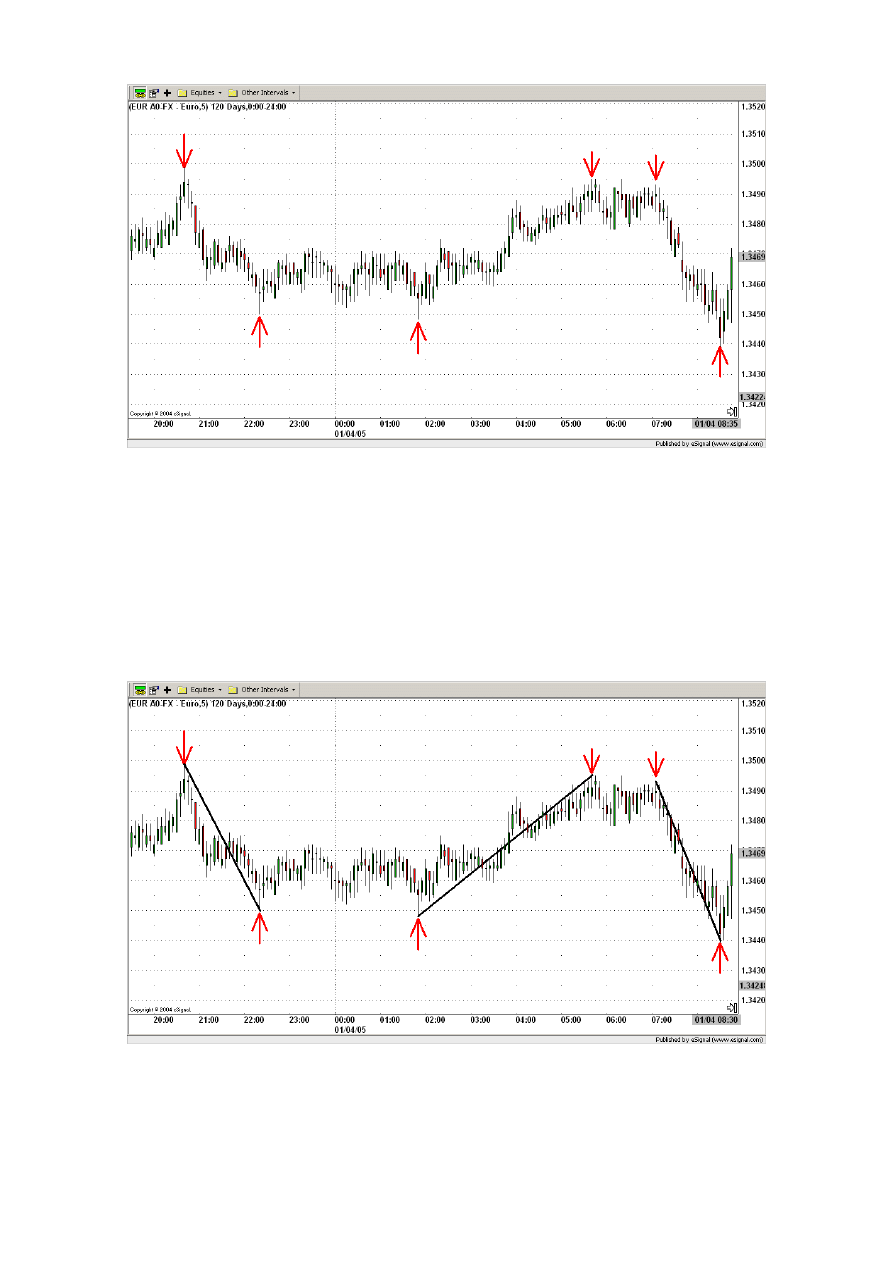
Our main observation, until now disregarded by all traders in their trading strategies,
is that when putting into relationship the height of a corrective wave and the height of
the prior impulsive wave, the corrective wave tends to retrace the prior impulsive
wave in Fibonacci ratios. Frequent relationships are 25%, 38%, 50%, 61% and 75%. Up
to now we will refer to this effect as the Impulsive/Corrective Wave Retracement
(ICWR) phenomenon. For example in the picture below (Figure 1.2) the corrective wave
(2) retraces the impulsive wave (1) in the Fibonacci ratio of 0.382.
8
Figure 1.2.
The ICWR phenomenon is a typical self-similarity effect of a complex system. For all
kind of complex systems in nature as social, chemical or physical systems such self-
similarity effects can be found. Self-similarity is a fundamental property of self-organized
complex systems and is a matter of recent intense investigation by physicists and
mathematicians.
1.4. Simplified trading example
Before going into the details of our strategy we will introduce it to you by showing you a
simplified, shortened version and in the later chapters you will be shown how to put it to
use and immediately start taking advantage of it. Our strategy gives the best possible entry
as well as exit moment. In the example below we will show you only the part that is
usually neglected by most of the trading strategies currently in use – how to find out the
We have used the phenomenon described above as a starting point to develop a
completely original and until now unpublished trading strategy that combines
basic principles of Elliot Wave theory together with well-known properties of
Fibonacci ratios. The result is amazing, as you will soon find out. We have named
the strategy “Impulsive/Corrective Wave Retracement (ICWR) Trading Rules”.
9
best moment to exit the trade. For the purpose of making the example easier to follow
we will assume that we have already found the best moment to enter the trade.
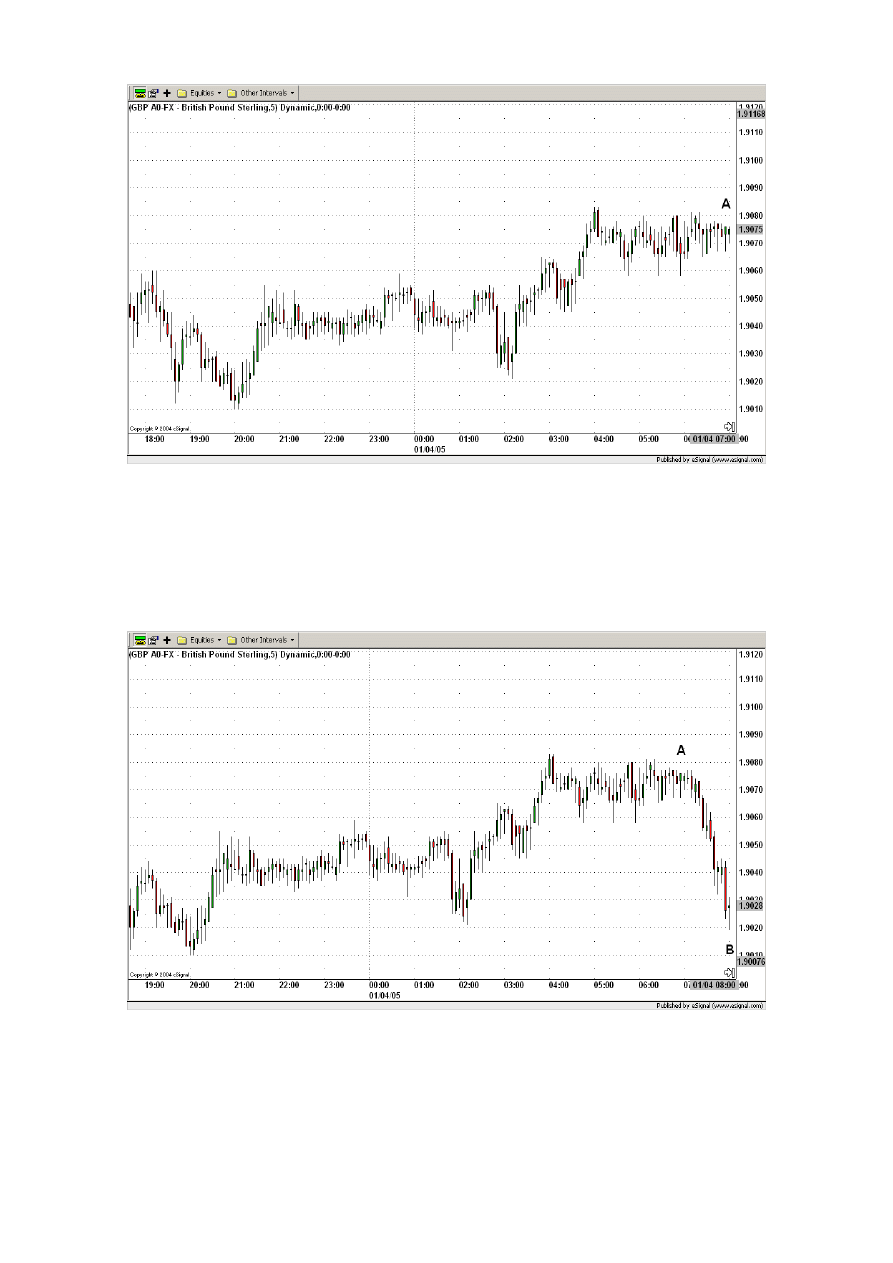
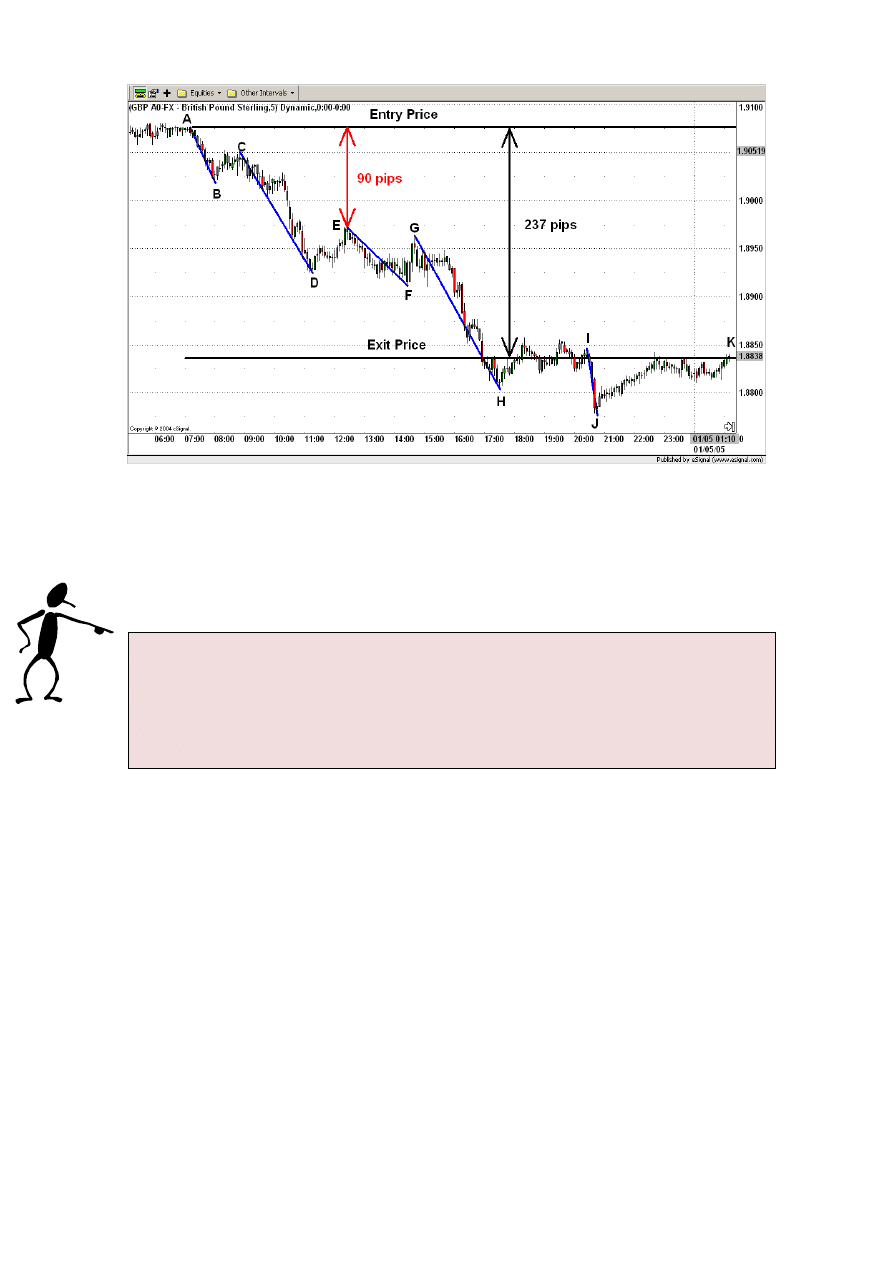
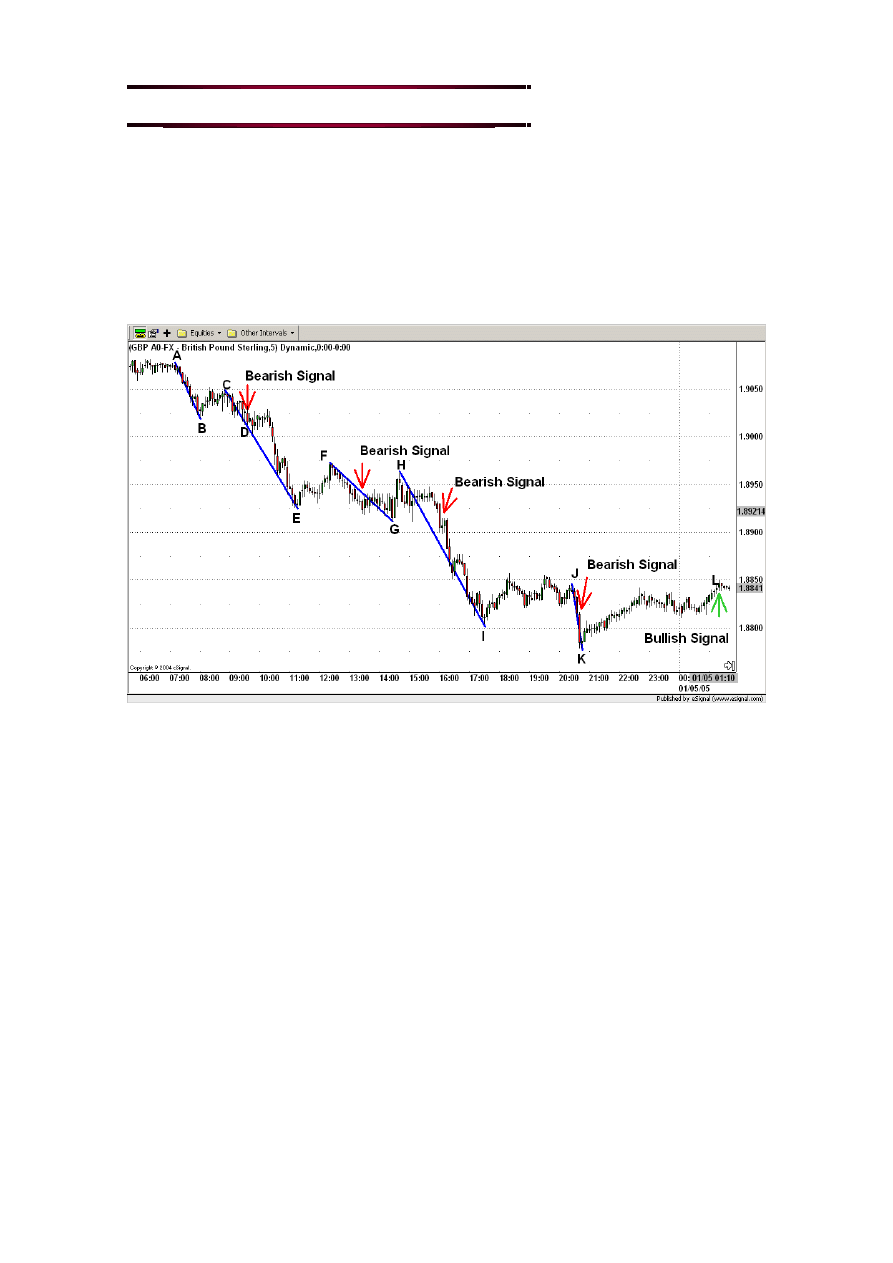
Here is an example of a GBP/USD trade exit by using our strategy.
Note: All of the elements of the strategy are clearly explained in the later chapters. The
purpose of the example below is to give you a glimpse into the exit part of the strategy.
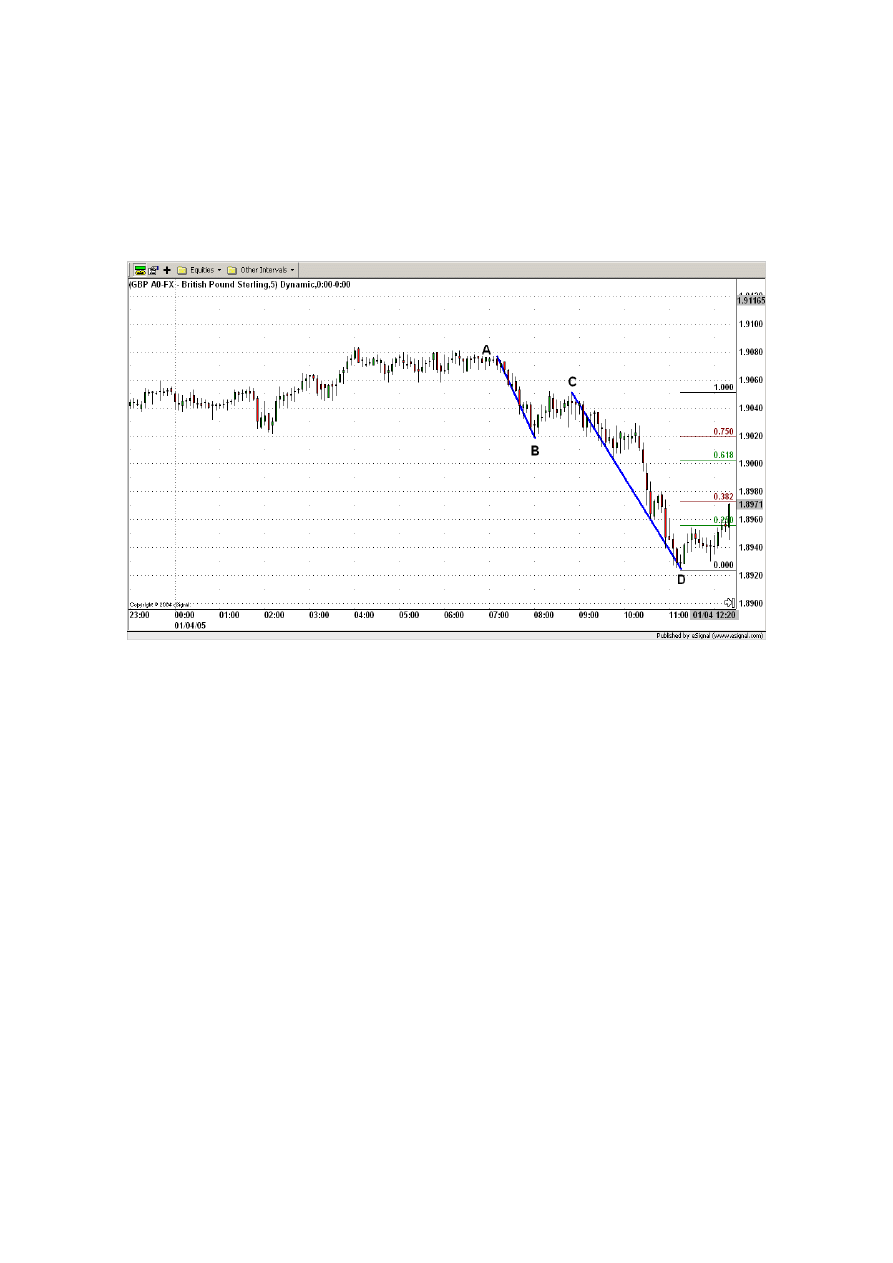
Suppose we entered the market short at point A (07:00 AM, 01/04/05) buying 10,000
USD at the entry price of 1.9075 (see Figure 1.3).
While going through the trading example below you will realize that the part of
our strategy related with the exit signal follows the fundamental trading rule “cut
the losses short and let the profits run” - in a way that was never accomplished
before.
And, why is this fundamental trading rule so important?
Because not letting the profits run will make your trading unprofitable in the long
run: two losses of 50 pips followed by a win of 80 pips results in a net loss of 20
pips. In contrast two losses of 50 pips followed by a win of 250 pips, reachable with
our strategy, results in a net win of 150 pips! I’m sure you get the point.
10
Figure 1.3.
For the first moment (see Figure 1.4) the market moved into our direction and reached the
point B. At that point the market reached a value of 1.9028. That means 48 pips in our
direction. So far, so good.
Figure 1.4.
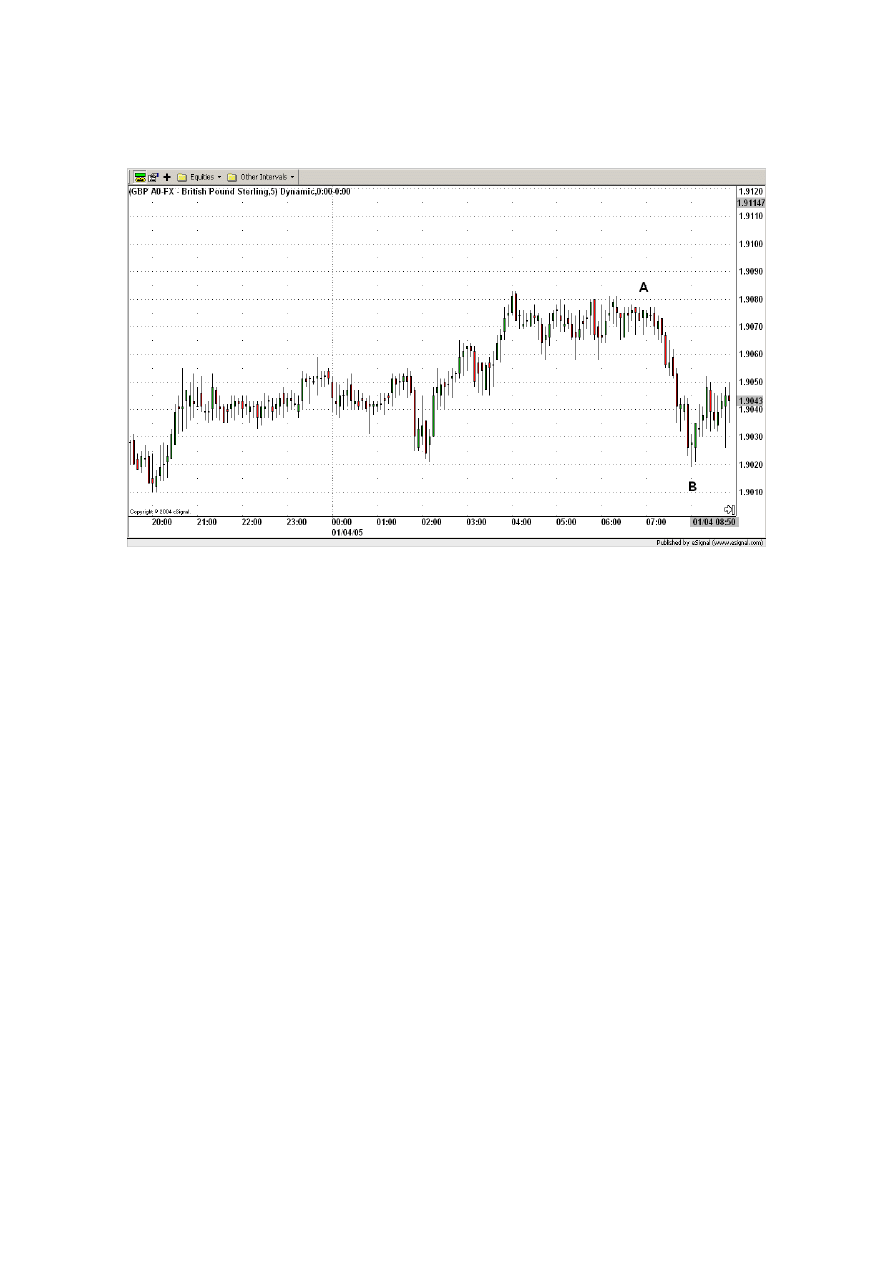
However, after the point B (see Figure 1.5) the market starts an upward movement. What
to do now? Inexperienced trader would close the position as a scared rabbit, happy to take
11
even small profit from the trade. But this would be the wrong decision. Why? Remember,
we have to “let the profits run”, if we want to make trading profitable in the long run.
Figure 1.5.
So what do we do?
The essential question is:
When do we decide that our trade has run out of steam and should be exited?
This is where our strategy comes into play. By using the “Impulsive/Corrective Wave
Retracement Trading Rules” we will find the best possible time to exit the trade and
extract maximum profit from each trade.
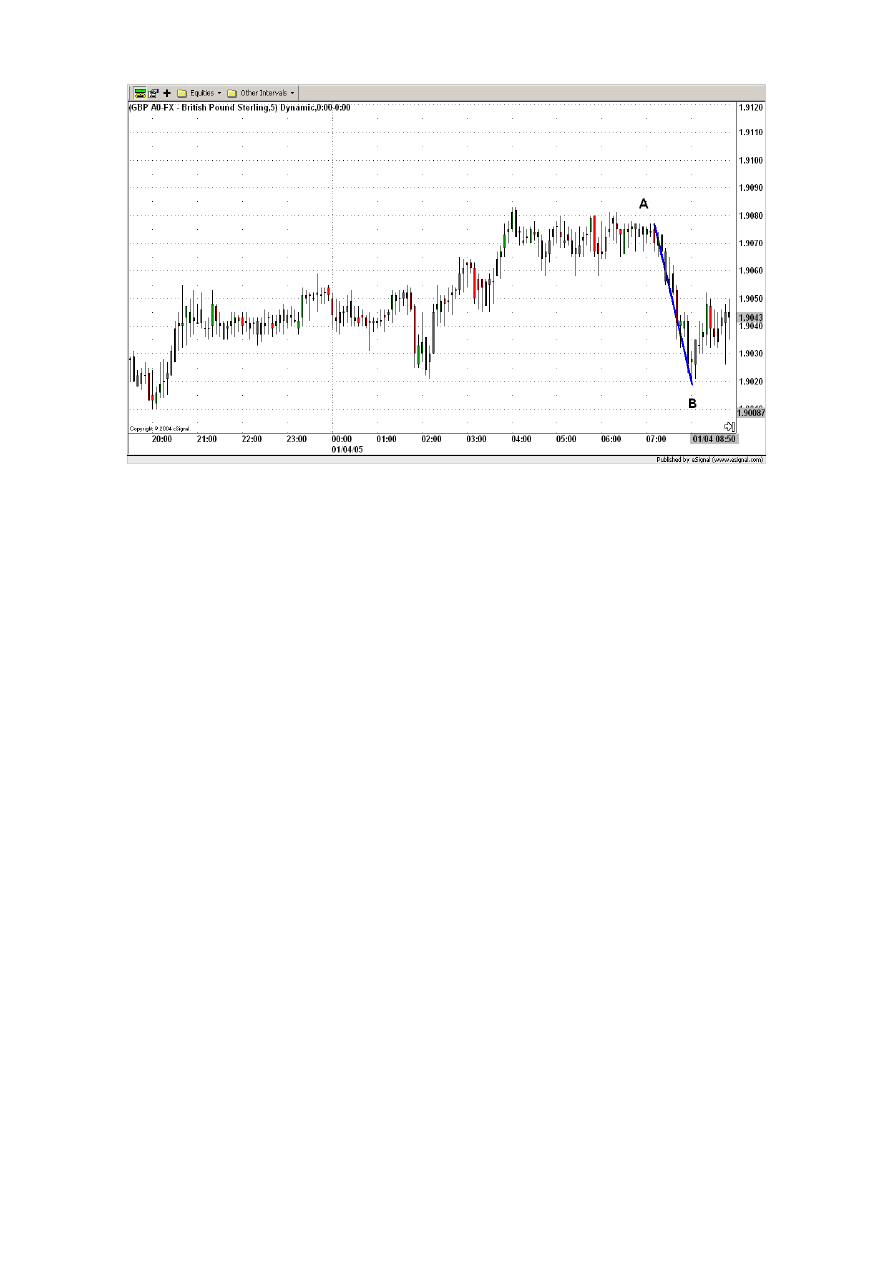
In order to apply our trading strategy the following trading setup has to be done.
First of all the highest and the lowest value of the downward movement are determined.
For this purpose we draw a line connecting both extreme values. In our case the extreme
values of the downward movement are point A (around 07:00) and point B (around
08:00). We will connect them with the thick blue line (see Figure 1.6).
12
Figure 1.6.
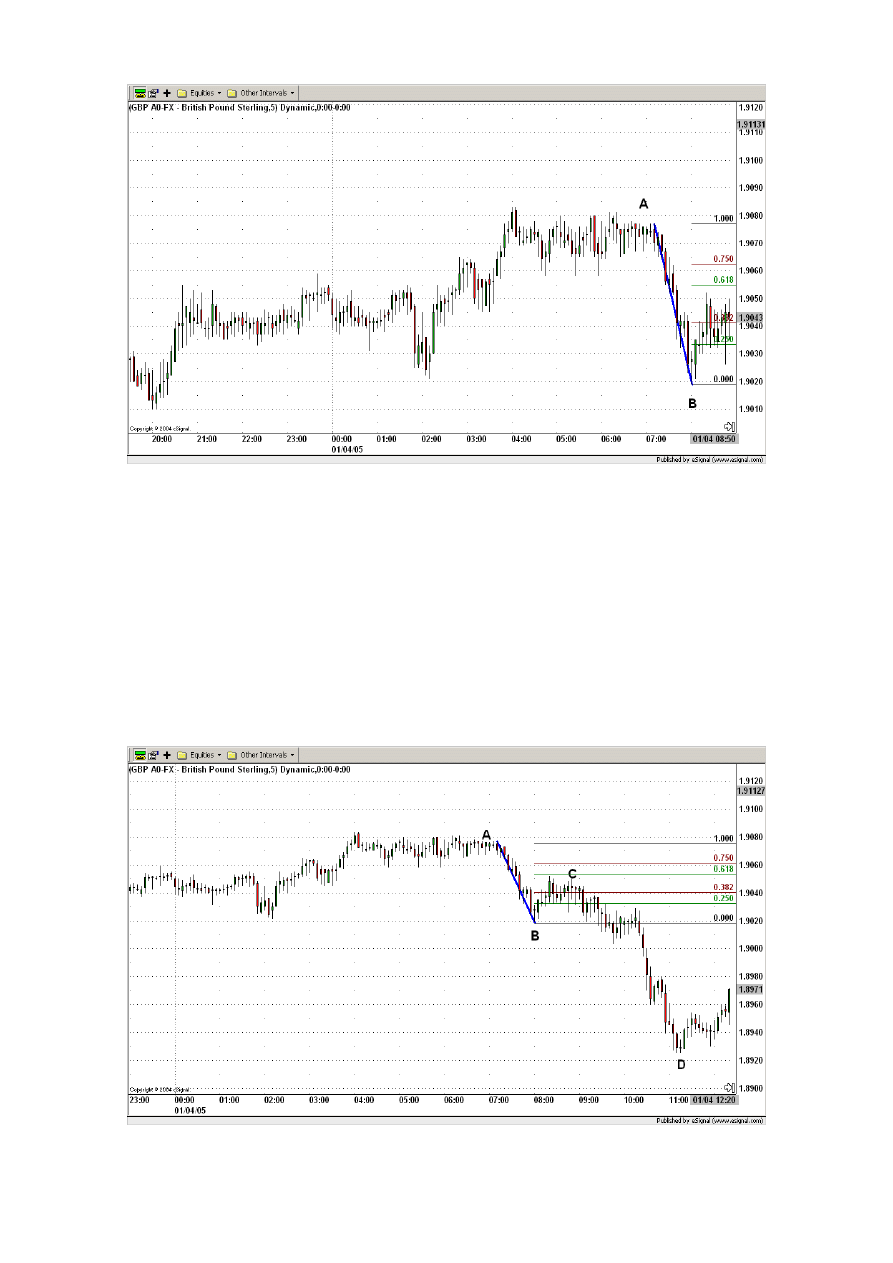
Further on we draw the Fibonacci levels using the lowest value of the downward
movement (point B) as the starting point (level 0.000) and the highest value of the
downward movement (point A) as the ending point (level 1.000). As we are only
interested in the 0.000, 0.250, 0.382, 0.618, 0.750 and 1.000 levels, only these levels will
be drawn (see Figure 1.7).
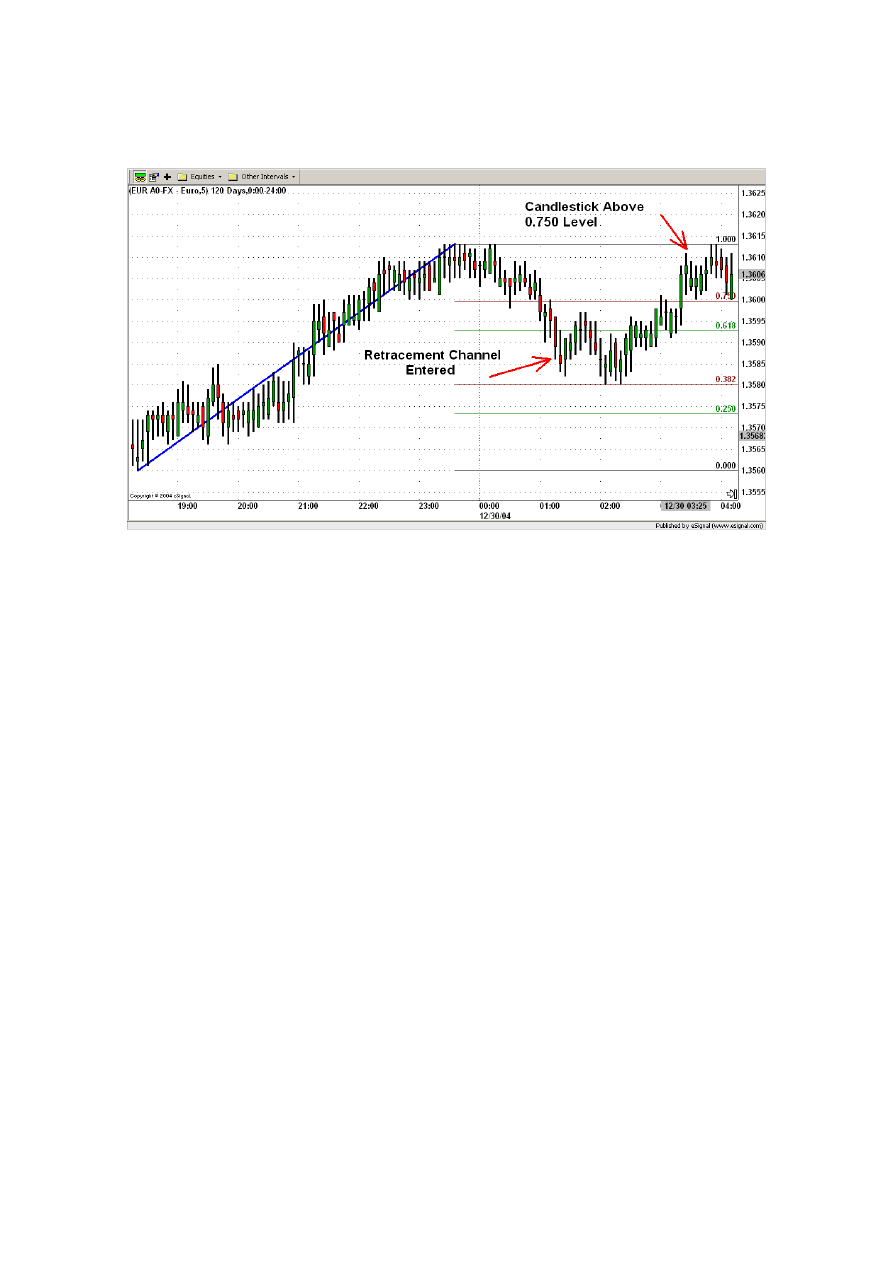
We are going to exit the position only in the case that the price goes beyond the 0.750
level, i.e. if it happens that a whole candlestick is above the 0.750 Fibonacci level.
13
Figure 1.7.
The upward movement retraced at the 0.618 Fibonacci level approximately at the point C
at 08:50 AM. As the price didn’t move beyond the 0.750 Fibonacci level we remain in the
trade. Ok, let’s look what happens next. After point C the market moves again downwards
in our direction until it reaches a low point around 11:10 at the point D. After that the
price starts to rise again (see Figure 1.8). Nevertheless letting the profit run did pay off, as
the distance to our entry point is already around 100 pips (at point B the distance was only
around 50 pips).
Figure 1.8.
14
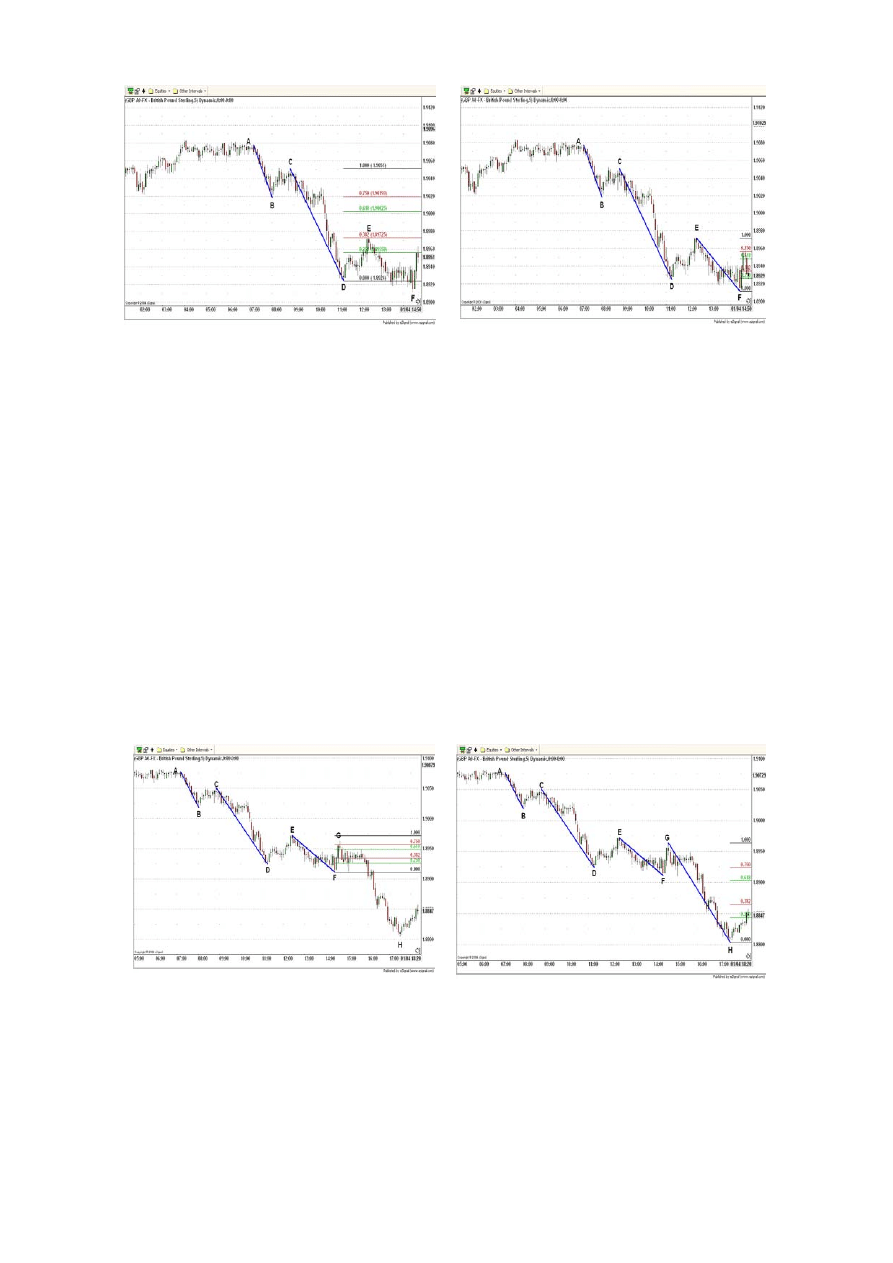
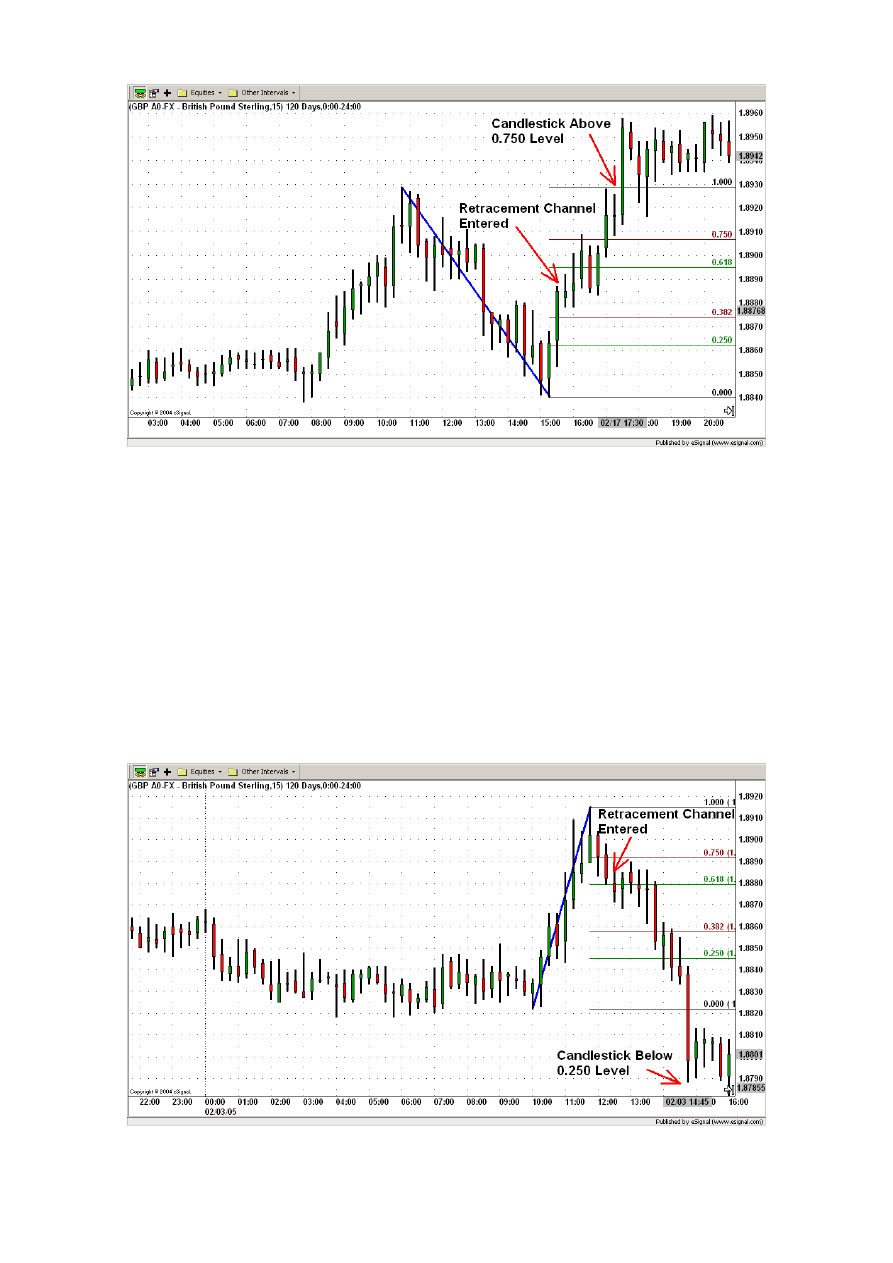
Again it is the “Impulsive/Corrective Wave Retracement Trading Rules”, which are
helping us decide whether to remain in the trade or not. Again the trading setup is done: a
line is drawn connecting the extreme values (C-D) of the downward movement and based
on this line the Fibonacci levels are drawn (see Figure 1.9). And again: we are only going
to exit the position if the price goes beyond the 0.750 Fibonacci level.
Figure 1.9.
The upward movement retraced at the 0.618 Fibonacci level approximately at point E at
12:25 AM. As the price didn’t move beyond the 0.750 Fibonacci level we remain in the
market. Let’s look what happens next. After point E the market moves again downwards
in our direction until it reaches a low point around 14:25 at the point F. After that, again
the price starts to rise (see Figure 1.10). The distance to our entry point is now around 120
pips.
Again we set our trading setup: a line is drawn connecting the extreme values (E-F) of the
downward movement and based on this line the Fibonacci levels are drawn. Remember,
we are only going to exit the position if the price goes beyond the 0.750 Fibonacci level.
15
Figure 1.10.
The upward movement retraced at the 0.750 Fibonacci level approximately at point G at
14:40. As the price didn’t move beyond the 0.750 Fibonacci level we remain in the
market. Let’s look what happens next. After point G the market moves again downwards
in our direction until it reaches a minimum around 17:30 at the point H. After that, again
the price starts to rise (see Figure 1.11). The distance to our entry point is now around 200
pips.
Again we set our trading setup: a line is drawn connecting the extreme values (G-H) of
the downward movement and based on this line the Fibonacci levels are drawn.
Remember, we are only going to exit the position if the price goes beyond the 0.750
Fibonacci level.
Figure 1.11.
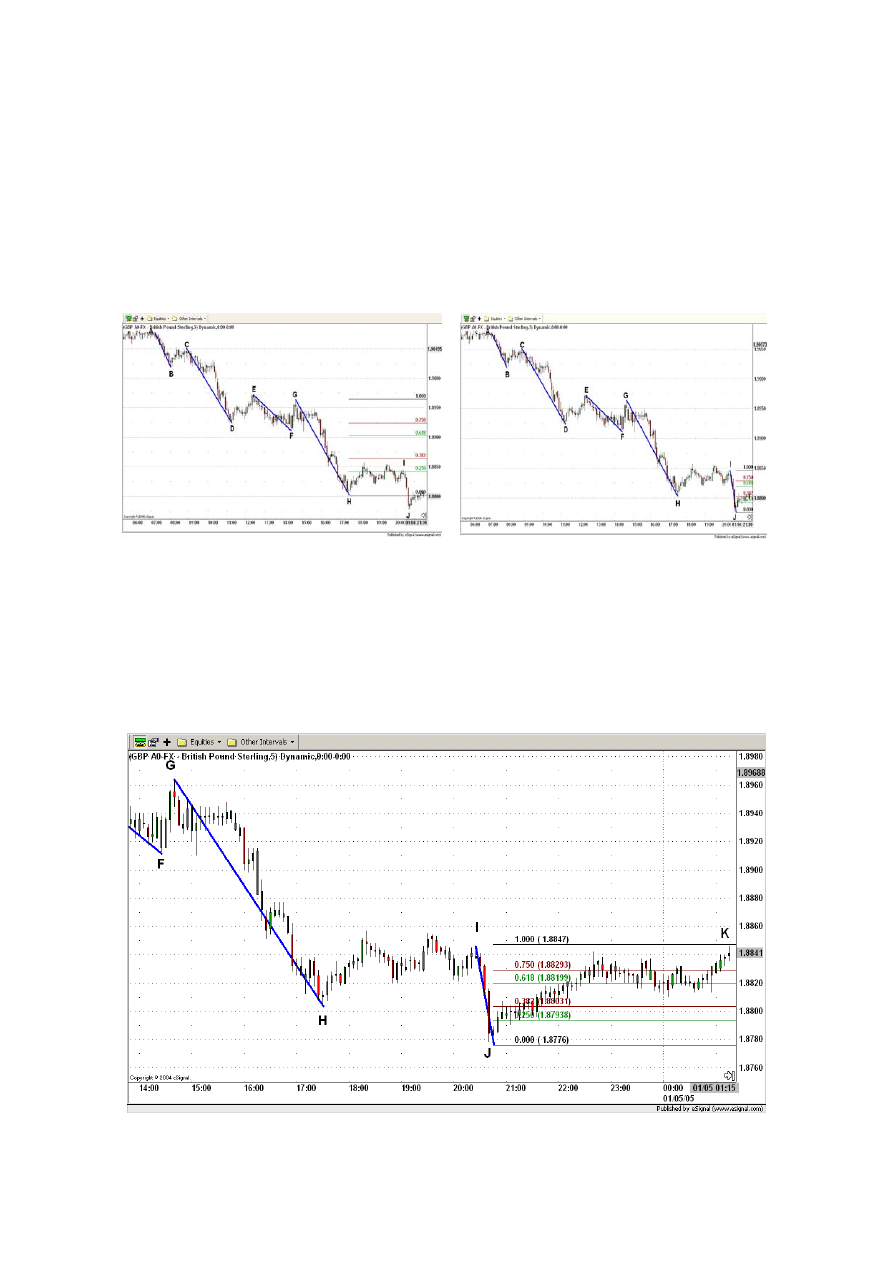
The upward movement retraced at the 0.250 Fibonacci level approximately at point I at
20:25. As the price didn’t move beyond the 0.750 Fibonacci level we stayed in the
market. Ok, let’s look what happens next. After point I the market moves again
16
downwards in our direction till it reaches a minimum around 20:40 at the point J. After
that, again the price starts to rise (see Figure 1.12). The distance to our entry point is now
around 270 pips.
Again we set our trading setup: a line is drawn connecting the extreme values (I-J) of the
downward movement and based on this line the Fibonacci levels are drawn. Exit signal
occurs if the price breaks the 0.750 level.
Figure 1.12.
After 21:00 the market trend starts to turn bullish. As of 01:15 the price has gone beyond
the 0.750 level (the whole candlestick is above the 0.750 level at point K) we exit the
trade selling 10,000 USD at the price of 1.8838 (see Figure 1.13).
Figure 1.13.
17
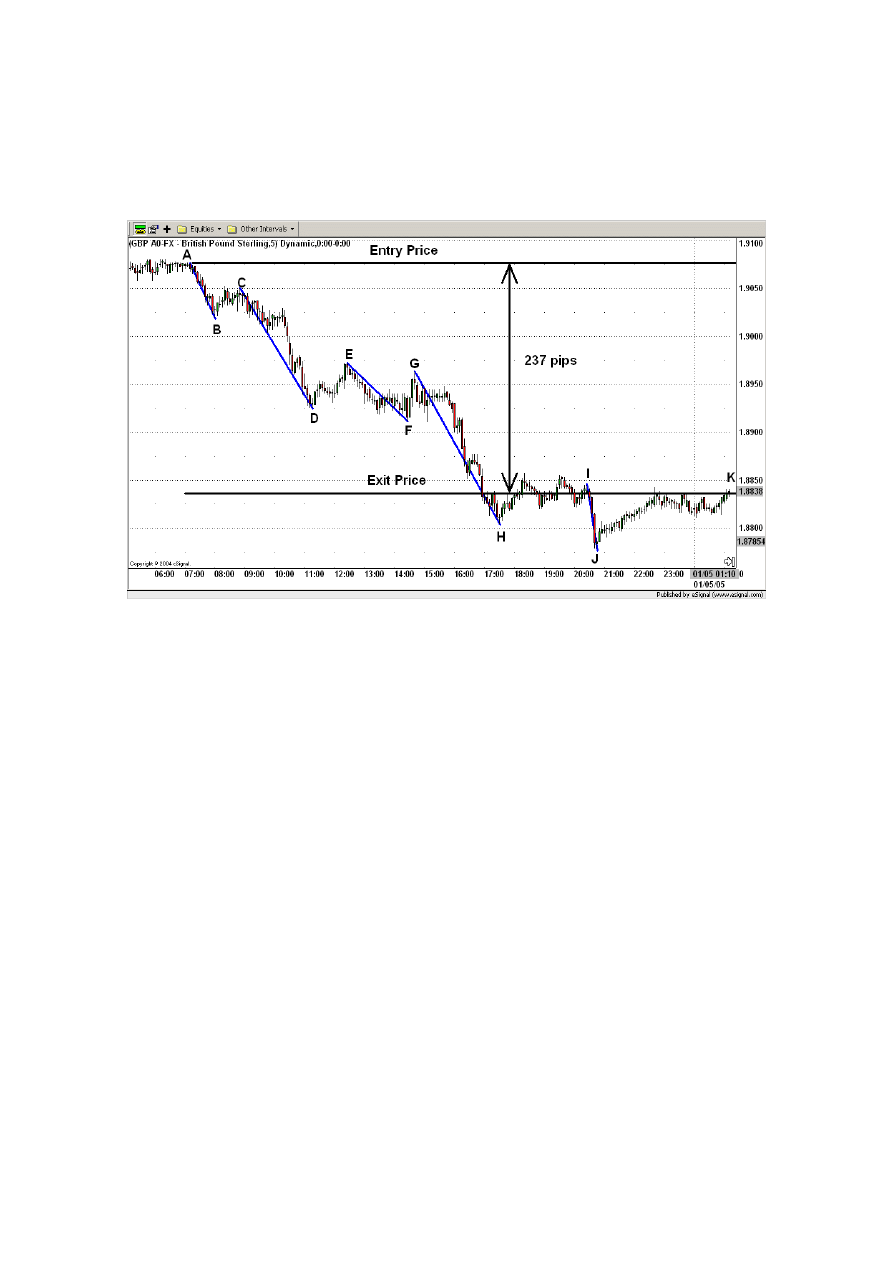
For this trade a profit of 1.9075 - 1.8838 = 0.0237= 237 pips was realized. Using a
leverage of 1:20 it means a profit of 10,000 x 0.0237 x 20 = 4,740 USD.
That means a profit of 4,740 USD after one trading day!
Figure 1.14.
As you can see from the Figure 1.14 above our exit strategy was able to determine the
best possible time to exit the trade and extract maximum profit from it.
In order to show you how efficient our strategy actually is, we will compare the result we
achieved with the result we would have achieved if we had used a trailing stop instead.
18
Figure 1.15.
As you can observe from the Figure 1.15 above after entering the position the market was
clearly going in our direction (at the point D a profit spread of almost 150 pips was
already reached). However, the trailing stop doesn’t give the trade enough space to run.
If we would have used a trailing stop to exit the trade we would have achieved a
profit of only 90 pips and our trade would have finished too early. Instead, using
our strategy a profit of 237 pips – almost three times more – is achieved!

19
Chapter 2
Scientific Research
Note: We have included this chapter in our manual in order to give our reader a glimpse
into the making of a profitable trading system. Some of the technical language that is
included may be new to some of our readers. However the understanding of this chapter
is not necessary for the successful implementation of our strategy (which is fully
explained in the latter chapters).
In our quest to find the most profitable and at the same time for a “small” trader feasible
trading system we have tested and analysed many different trading strategies. The
strategies that we have tested were ranging from simple combinations of TA indicators to
more complex trading systems that were utilizing support/resistance levels, pivot points,
chart patterns etc… However in order to reduce the number of systems that were later
scrutinized more closely, we have developed our own system selection criteria. Basically
the system that we were after had to have following properties: Simplicity, Efficiency and
Consistency.
Simplicity
As we all know forex trading strategies are becoming more and more complex and
sophisticated. What does it mean for our average independent trader? It means that our
simplicity factor when developing a trading strategy gains in importance. What usage
could an average person make from a strategy that requires or presumes a profound
knowledge in mathematics at a PhD level and a computing power beyond that of the
newest personal home computer? A type of highly complex strategies commonly used by

20
investment companies are neural networks
1
. A neural network is, in short, a model of
interconnected neurons (also known as nodes) that is inspired by the logical neurons in
human nerve system. Like the human brain a neural network can acquire, store and utilize
experiential knowledge in order to improve its performance day by day. Regrettably, to
consistently use a strategy based on neural networks one requires the complex knowledge
of how to feed a neural network with history data as well as excessively high computing
power not affordable to our average forex trader. Therefore we have set ourselves with a
goal of finding a trading strategy that is comparable in it’s profit potential to the most
complex professional trading system and at the same time is feasible and understandable
to our average trader.
Efficiency
Efficiency of a trading strategy is basically a measure of profit that is realized using the
strategy during specified period of time. When comparing different trading strategies,
those strategies that show more profit during specified period of time are said to be more
efficient.
Consistency
Once we have found a system that is efficient and simple to use our next most important
selection criteria becomes consistency. What does it mean for a strategy to be consistent?
It means that when the financial market behaviour changes slightly or even drastically, as
often happens in times of political and financial crisis, the strategy is still able to make
profit.
It means that a strategy with high efficiency and high consistency is a much better and
safer strategy than a strategy with high efficiency but lower consistency. It is the
consistency of a strategy that permits traders to plan for capital draw downs and potential
profit build up.
A consistent strategy shows the following properties:
1 V.V.Kondratenko and Yu. A Kuperin, “Using Recurrent Neural Networks To Forecasting of Forex”,
Condensed Matter, (2003)

21
• The strategy is profitable even in turbulent times, as for example directly after
September 11.
• The strategy retains positive efficiency if the financial market behaviour changes
slightly. This can be simulated changing slightly the parameters of the strategy. For
example if a strategy has worked well in the past with a hard stop order of 50 pips it
should also perform well if the stop order is changed to for example 55 pips, or 45
pips…
• The probability of losing all the trading capital during specified period of time needs
to be extremely small, that is almost non existent. I don’t think that the importance of
this property needs to be explained any further. ☺
We came to the result that our new developed strategy based on the ICWR phenomenon
was the most powerful trading strategy, as it was the most efficient and most consistent
strategy from all the tested strategies and at the same time feasible and understandable for
our average trader. We had to put a lot of effort and time into forex market research to
come to this conclusion. In the following we want to give you only a short look into our
long way to our strategy.
First of all we will show you some of the milestones of the strategy development. That is
how to define reliable and consistent market signals based on the ICWR phenomenon (see
chapter 2.1.) and how to find the proper long-term filter for enhancing the performance of
our strategy (see chapter 2.2.).
Finally we will give you some remarks regarding the high consistency (see chapter 2.3.)
and high efficiency (see chapters 2.4. and 2.5.) of our strategy.
2.1. Market signals based on the ICWR phenomenon
Well, as told in the introduction (see chapter 1.3.), our strategy bases on the observation
that when putting into relationship the height of a corrective wave to the height of the
prior impulsive wave, the corrective wave tends to retrace the prior impulsive wave in
Fibonacci ratios. Frequent relationships are 25%, 38%, 50%, 68% and 75%.

22
Our task was to define consistent and efficient rules for generating bearish and bullish
signals based on the ICWR effect.
The open points were the following:
1. To find out the proper Fibonacci levels to be used.
2. To find out the proper triggers for identifying an impulsive or a corrective retracement.
As you can imagine there exist really a lot of possibilities of defining rules for generating
signals based on the ICWR phenomenon. The problem of making the rules too simple is
that they don’t cover all of the possibilities that may arise when markets behave
unusually.
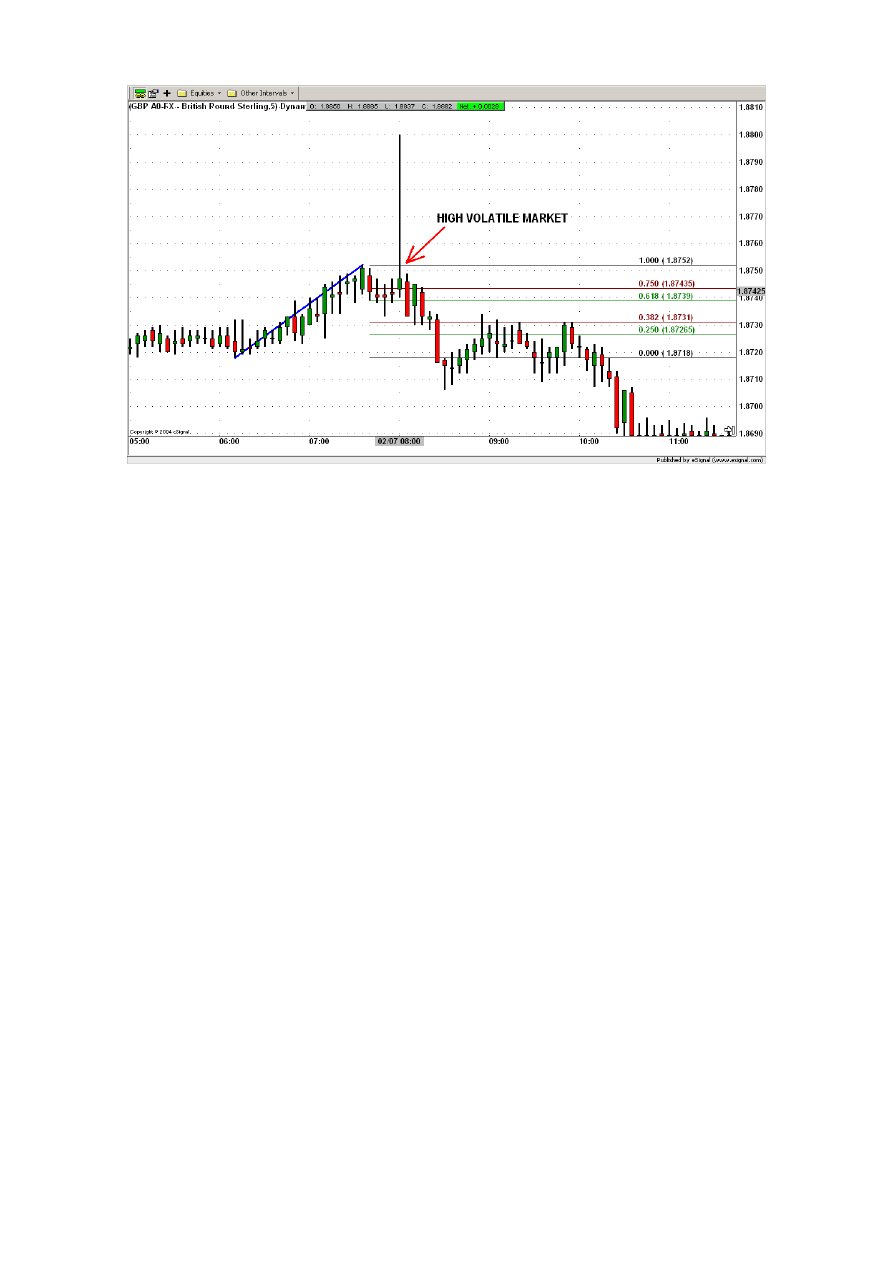
Such an unusual behaviour is for example a candlestick being greater 3 times or more
than its immediate neighbours. That means that there is a huge difference between the
highest and the lowest value of that period. Such a candlestick represents a highly volatile
time period. For example in the Figure 2.1. below, such a volatile time period at 08:00 on
the 02/07/05 is recognized with the candlestick having a height around 60 pips, while
around it, the other candlesticks have a height of 10-15 pips.
Ok, suppose that the rule for recognizing a bullish signal in the case of an upward
movement is the recognition of the price bouncing off any Fibonacci level (0.750, 0.618,
0.500, 0.318 or 0.250). After the upward movement starting at 06:10 and ending at 07:35
we could (following the former simple rule) make around 08:00 following market
reading: around 08:00 we see the price clearly above the Fibonacci levels after having
bounced off at the 0.382 Fibonacci level (around 07:50) and in consequence this would
represent a bullish signal (see Figure 2.1).
But such a bullish signal makes no sense, as such an isolated and highly volatile
candlestick has nothing to do with the impact of the ICWR phenomenon into the market.
23
Figure 2.1.
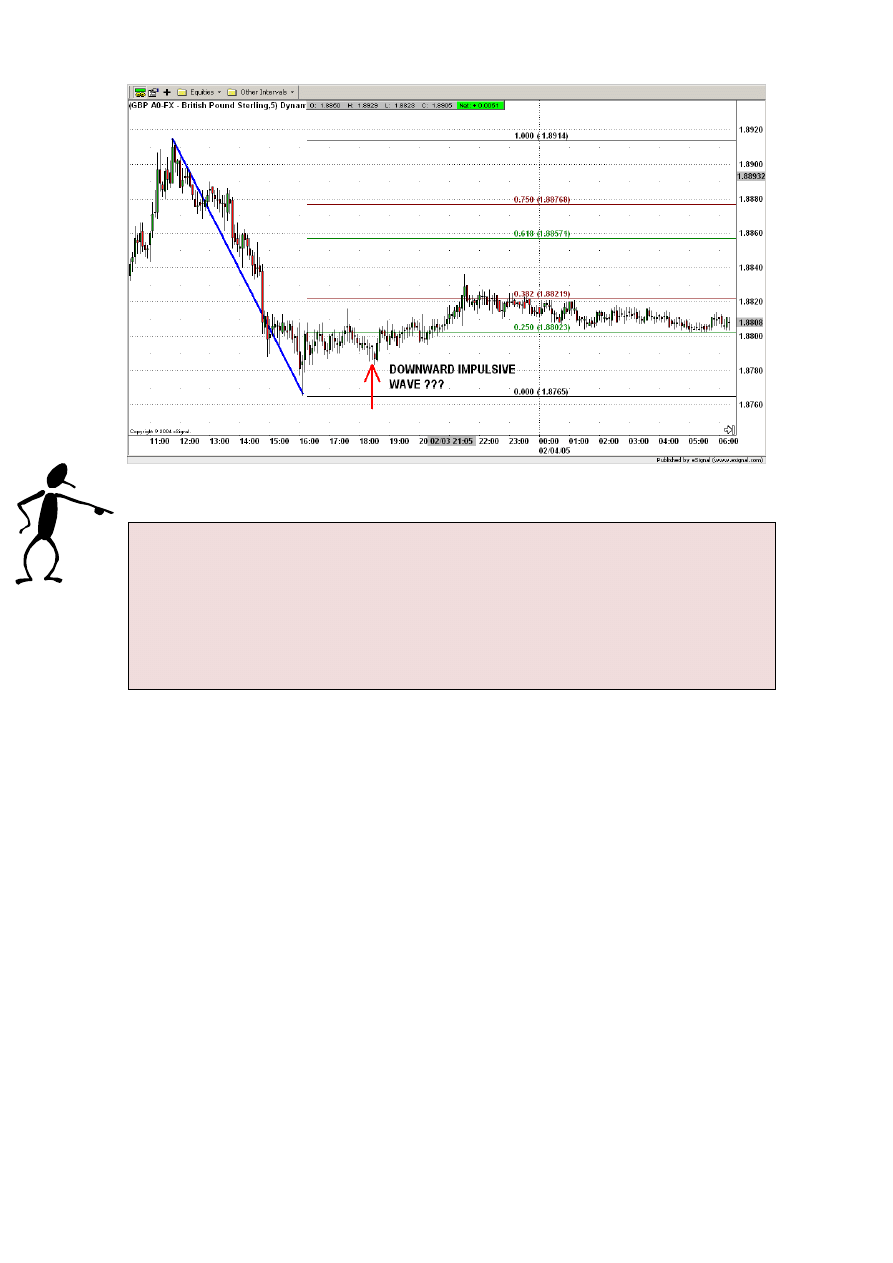
Another factor that we had to take into account is a sideways market, which can very
easily generate false signals. For example in the Figure 2.2. below, after 17:00 the market
doesn’t show any clear trend.
Ok, suppose the used rule for recognizing a bearish signal in the case of an downward
movement is again the recognition of the price bouncing off any Fibonacci level (0.750,
0.618, 0.500, 0.318 or 0.250). After the downward movement starting at 11:00 and ending
at 16:00 we could (following the supposed simple rule) make around 18:00 the following
market reading: the price is below the 0.250 Fibonacci level after having bounced off it
around 17:00 and in consequence this would represent a bearish signal.
However it would make no sense, as such a sideways market has again nothing to do
with the impact of the ICWR phenomenon into the market..
24
Figure 2.2.
For the sake of completeness let us just remark that in the shown examples (Figures 2.1
and 2.2) we get the right market signals when using our ICWR Trading Rules.
Because of that, the main effort had to be put into finding efficient and at the same
time reliable rules (that is immune to the other effects of the market) for
generating market signals based on the ICWR phenomenon. You will find these
rules to be defined in detail in the chapter 3. “Intraday ICWR Trading Rules”.
25
Figure 2.3.
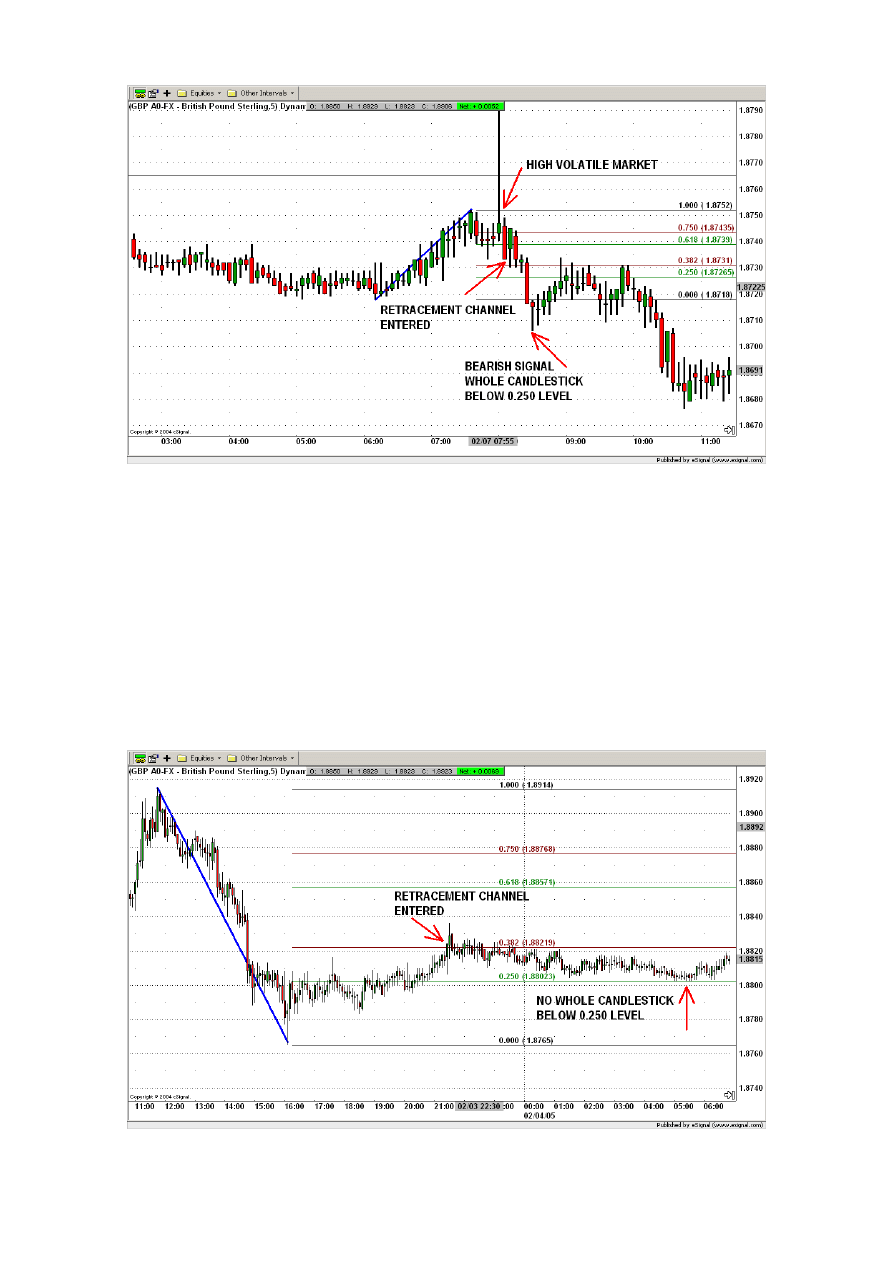
In the example with the high volatile candlestick at 08:00 in Figure 2.3 no signal is
generated when using our ICWR Trading Rules for two reasons. First, because the whole
candlestick is not above the upper confirmation level (0.750). And second, no retracement
channel is entered; even if the whole candlestick at 08:00 was above the 0.750 level no
bullish signal would have been generated. Not only a false bullish signal is avoided, but
also later the ICWR Trading Rules generate a correct bearish signal corresponding to the
real market trend.
Figure 2.4.
26
In the example of a sideways market in Figure 2.4 no signal is generated, as no whole
candlestick is below the lower confirmation level (0.250).
2.2. The proper long-term filter
When developing a trading strategy, it makes sense to search for a proper long-term
indicator in order to filter out the entry signals from the short-term scale. The reason is
that such long-term filters make the strategy considerably more powerful (meaning more
efficient and more consistent). In our case the short-term time period for intraday trading
is five minutes candlestick and for long-term trading time period is four hours candlestick.
2.2.1. Enhancing the Intraday Strategy
In order to enhance the intraday strategy based on the ICWR phenomenon the following
TA indicators and rules were tested:
MA(x): The 20-period simple moving average from the x-period candlestick chart is used.
The long-term signal is bullish if the actual value of the moving average is above the
actual price. The long-term signal is bearish if the actual value of the moving average is
below the actual price. X represents 30 minutes, 1 hour, 4 hours and 1 day. For example
MA(1h) stays for the 20-period simple moving average from a one hour candlestick chart.
RSI(x; 50/50): The x-period Relative Strength Index (RSI) is used (calculated using the
last 14 values). The long-term signal is bullish if the actual value of the RSI is above 50.
The long-term signal is bearish if the actual value of the RSI is below 50. X represents 30
Why do long-term filters make a strategy more efficient? The reason is quite
simple. Suppose we are doing intraday trading. As we want to let our profits run,
we are going to stay in the market typically for a couple of hours and sometimes
even for a couple of days. Basically long-term filters are filtering out those entry
signals that are not in the concordance with the long-term market behaviour.

27
minutes, 1 hour, 4 hours and 1 day. For example RSI(4h; 50/50) represents the 14-period
Relative Strength Index from a four hours candlestick chart.
RSI(x; 60/40): The x-period Relative Strength Index (RSI) is used (calculated using the
last 14 values). The long-term signal is bullish if the actual value of the RSI is above 60.
The long-term signal is bearish if the actual value of the RSI is below 40. X represents 30
minutes, 1 hour, 4 hours and 1 day.
CCI(x; 0/0): The x-period Commodity Channel Index (CCI) is used (calculated using the
last 20 values). The long-term signal is bullish if the actual value of the CCI is above 0.
The long-term signal is bearish if the actual value of the CCI is below 0. X represents 30
minutes, 1 hour, 4 hours and 1 day.
CCI(x; 50/-50): The x-period Commodity Channel Index (CCI) is used (calculated using
the last 20 values). The long-term signal is bullish if the actual value of the CCI is above
50. The long-term signal is bearish if the actual value of the CCI is below -50. X
represents 30 minutes, 1 hour, 4 hours and 1 day.
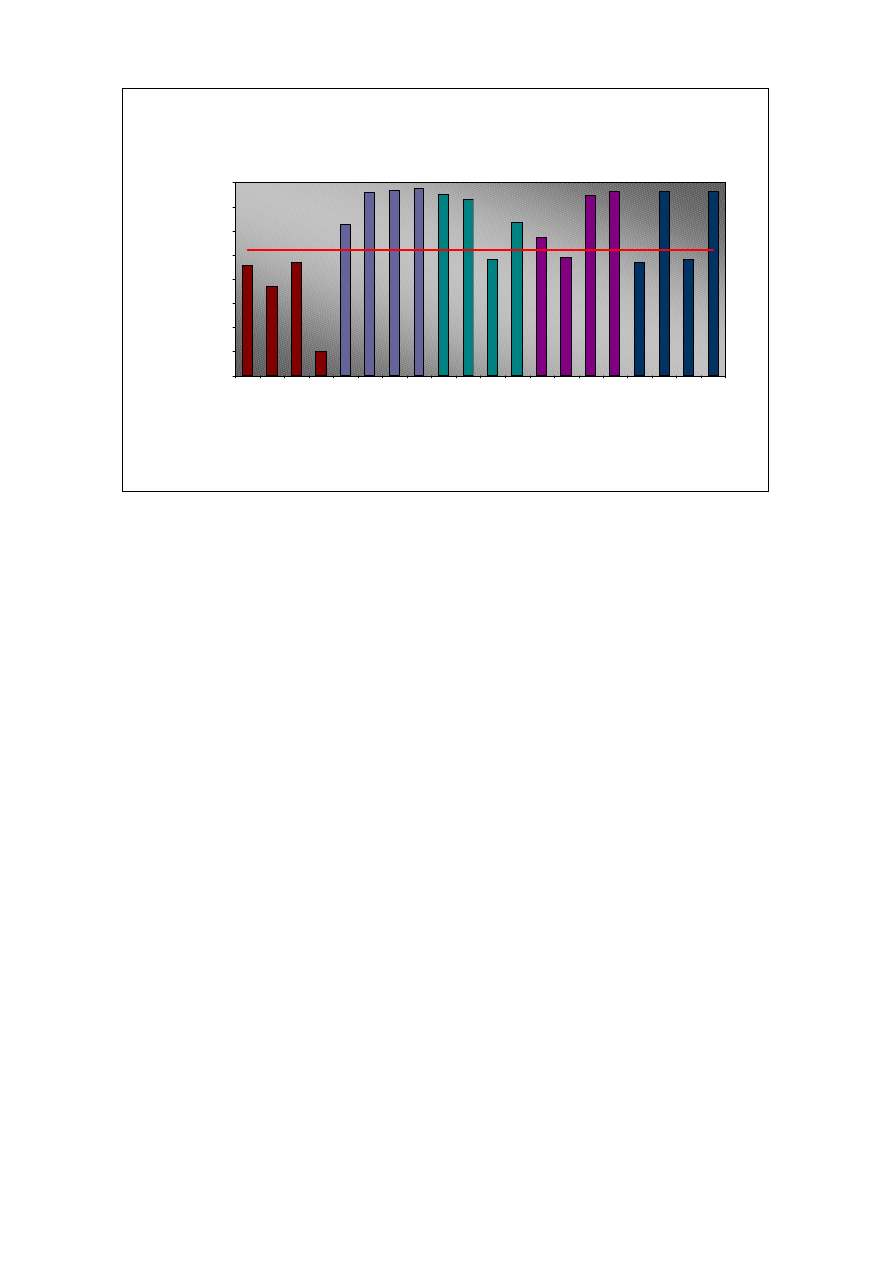
In the Figure 2.5 shown below you can see the result
2
of using the different long-term
filters. The red thick line represents the result of the trading without a long-term filter
(around 2700 pips of net profit).
2
The net result shown in the pictures is the average net profit, when trading five months in parallel the
currencies EUR/USD, GBP/USD and CAD/USD using the ICWR Trading Rules. The average is calculated
based on two years historical back-testing.
28
Analysis of different TA indicators for filtering 5 min ICWR signals
0
500
1000
1500
2000
2500
3000
3500
4000
M
A
(3
0
m
)
M
A
(1
h
)
M
A
(4
h
)
M
A
(1
d
)
RS
I (
30
m
; 5
0/
50
)
RS
I (
1
h;
5
0/
50
)
RS
I (
4
h;
5
0/
50
)
RS
I (
1
d;
5
0/
50
)
RS
I (
30
m
; 6
0/
40
)
RS
I (
1
h;
6
0/
40
)
RS
I (
4
h;
6
0/
40
)
RS
I (
1
d;
6
0/
40
)
CC
I (
30
m
; 0
/0
)
CC
I (
1
h;
0
/0
)
CC
I (
4
h;
0
/0
)
CC
I (
1
d;
0
/0
)
CC
I (
30
m
; 5
0/
-5
0)
CC
I (
1
h;
5
0/
-5
0)
CC
I (
4
h;
5
0/
-5
0)
CC
I (
1
d;
5
0/
-5
0)
Used Long-Term Filter
Net
Resu
lt
[
p
ip
s]
Figure 2.5.
As you can observe from the red line shown on the Figure 2.5 above our strategy is
already highly profitable even without long-term filter, however when combined with
some of the long term filters it becomes even more profitable. For example, when using
the RSI(1 day; 50/50) long-term filter a profit of around 3900 pips is achieved which is
56% more profit than without this filter!
The proper long-term filter was found to be the RSI(1 d; 50/50) as it was the one with the
highest efficiency.
2.2.2. Enhancing the Long-Term Strategy
In order to enhance the long-term strategy based on ICWR phenomenon the long-term
filters MA(1d), RSI(1d; 50/50), RSI(1d; 60/40), CCI(1d; 0/0) and CCI(1d; 50/-50) were
tested.
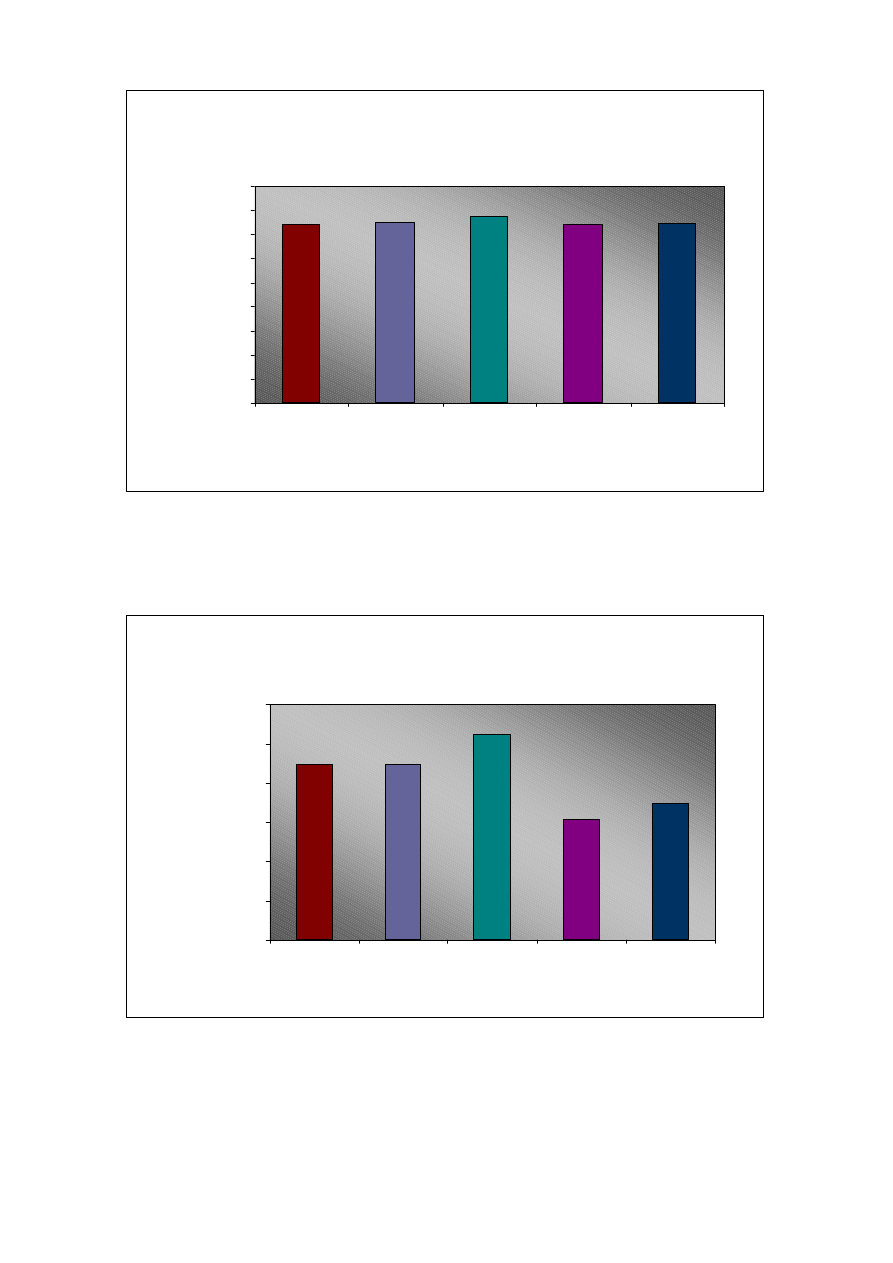
In the Figure 2.6 shown below you can see the results of using the different long-term
filters.

29
Analysis of different TA indicators for filtering 4h ICWR signals
1500
1700
1900
2100
2300
2500
2700
MA (1 d)
RSI (1 d; 50/50)
RSI (1 d; 60/40)
CCI (1 d; 0/0)
CCI (1 d; 50/-50)
Used Long-Term Filter
Net
Resu
lt
[
p
ip
s]
Figure 2.6.
The red thick line represents the result of our strategy without a long-term filter (around
2450 pips of net profit). Again, as in the intraday trading the ICWR strategy is already
highly profitable however when combined with long term filters it becomes even more
profitable. For example when using the RSI(1 day; 50/50) long-term filter a profit of
around 2625 pips is achieved (before only around 2450).
For our trading rules the RSI(1 day; 50/50) was chosen as the long-term filter, as it was
the one with the highest efficiency.
2.3. Consistency checks
Earlier in this chapter we have mentioned how important it is for a strategy to be
consistent. In the long run it is the consistency of a strategy more than its efficiency that
will make you successful in the trading business.
30
The parameters of our strategy are:
• The minimum height of a movement to be considered as an active wave (used is 40
pips for intraday, 150 pips for long-term trading)
• The distance between the entry price and the hard stop order (used is 40 pips for
intraday, 100 pips for long-term trading)
• The minimum RSI value for the market considered bullish (used is 50 both for
intraday and long-term trading)
• The maximum RSI value for the market considered bearish (used is 50 both for
intraday and long-term trading)
These parameters are part of our trading rules, which are defined latter in detail in the
chapter 3. “Intraday ICWR Trading Rules”.
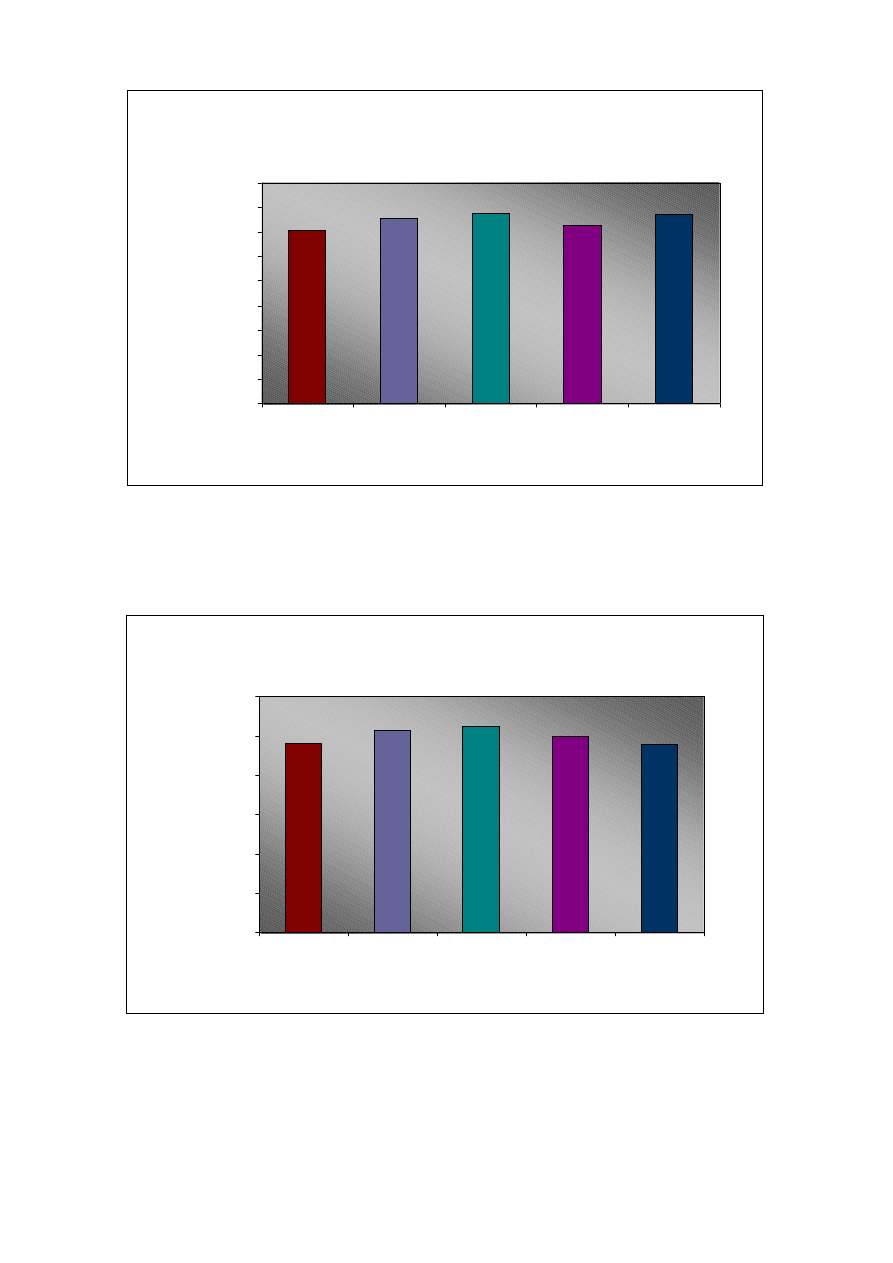
As you can see from the Figures shown below (Figures 2.7 till 2.12), our strategy
performs equally well when parameters are slightly changed. Both for the Intraday ICWR
and the Long-Term ICWR Trading Rules.
The strategy presented in this book is highly consistent. Showing you all the
analysis done in order for us being able to make this statement would go clearly
beyond the scope of this chapter, as we would be forced to bore you with pages
and pages full of complicated statistical stuff. As this is not relevant for your
trading we decided to show you only an extract from our analysis. That is the
graphs showing that our strategy is immune to small changes in the given
parameters – which simulates a slight change in the forex market behaviour.
31
Consistency Analysis of the Intraday ICWR Trading Rules
Minimum Height of Active Wave
0
500
1000
1500
2000
2500
3000
3500
4000
4500
30
35
40
45
50
Minimum Height of Active Wave [pips]
Ne
t Re
s
u
lt
[
p
ip
s
]
Figure 2.7.: Net result [pips] in dependence of the minimum height of the active wave for
the intraday ICWR trading rules
Consistency Analysis of the Long-Term ICWR Trading Rules / Minimum
Height of Active Wave
0
500
1000
1500
2000
2500
3000
100
125
150
175
200
Minimum Height of Active Wave [pips]
N
e
t R
e
s
u
lt
[p
ip
s
]
Figure 2.8.: Net result [pips] in dependence of the minimum height of the active wave for
the long-term ICWR trading rules
32
Consistency Analysis of the Intraday ICWR Trading Rules
Distance of Hard Stop Order from Entry Price
0
500
1000
1500
2000
2500
3000
3500
4000
4500
40
45
50
55
60
Distance of Hard Stop Order from Entry Price [pips]
N
e
t R
esu
lt
[
p
ip
s]
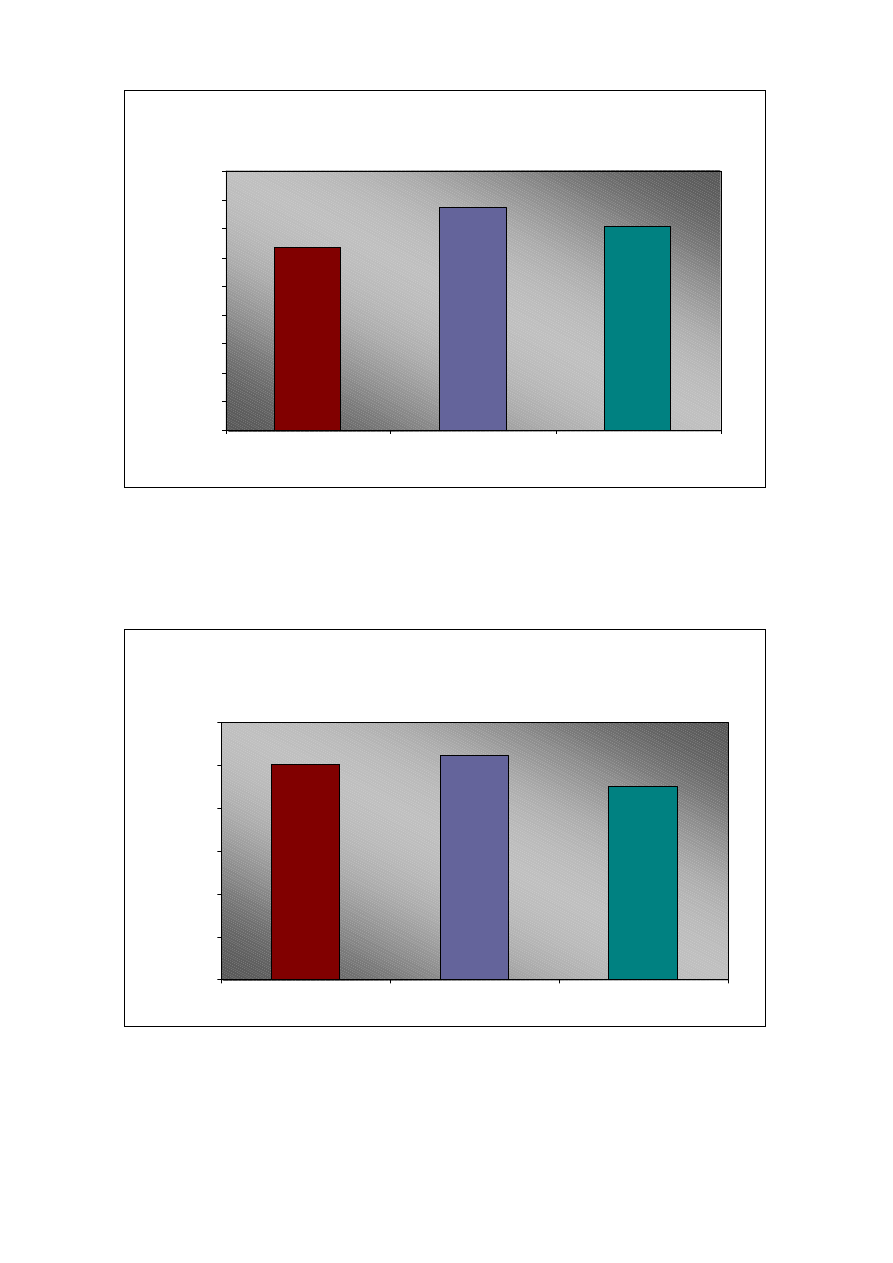
Figure 2.9.: Net result [pips] in dependence of the distance of the stop order from the
entry price for the intraday ICWR trading rules
Consistency Analysis of the Long-Term ICWR Trading Rules / Distance of
Hard Stop Order from Entry Price
0
500
1000
1500
2000
2500
3000
50
75
100
125
150
Distance of Hard Stop Order from Entry Price [pips]
N
e
t R
e
s
u
lt
[p
ip
s
]
Figure 2.10.: Net result [pips] in dependence of the distance of the stop order from the
entry price for the long-term ICWR trading rules
33
Consistency Analysis of the Intraday ICWR Trading Rules
Mimimum RSI for Bullish / Maximum RSI for Bearish
0
500
1000
1500
2000
2500
3000
3500
4000
4500
60/40
50/50
40/60
Mimimum RSI Value for Bullish Signal / Maximum RSI Value for Bearish Signal
Ne
t Re
s
u
lt
[
p
ip
s
]
Figure 2.11.: Net result [pips] in dependence of the minimum/maximum RSI value for the
market considered bullish/bearish for the intraday ICWR trading rules
Consistency Analysis of the Long-Term ICWR Trading Rules / Mimimum RSI
for Bullish / Maximum RSI for Bearish
0
500
1000
1500
2000
2500
3000
60/40
50/50
40/60
Mimimum RSI Value for Bullish Signal / Maximum RSI Value for Bearish Signal
N
e
t R
e
s
u
lt [p
ip
s
]
Figure 2.12.: Net result [pips] in dependence of the minimum/maximum RSI value for the
market considered bullish/bearish for the long-term ICWR trading rules
34
2.4. Why is our entry strategy so profitable?
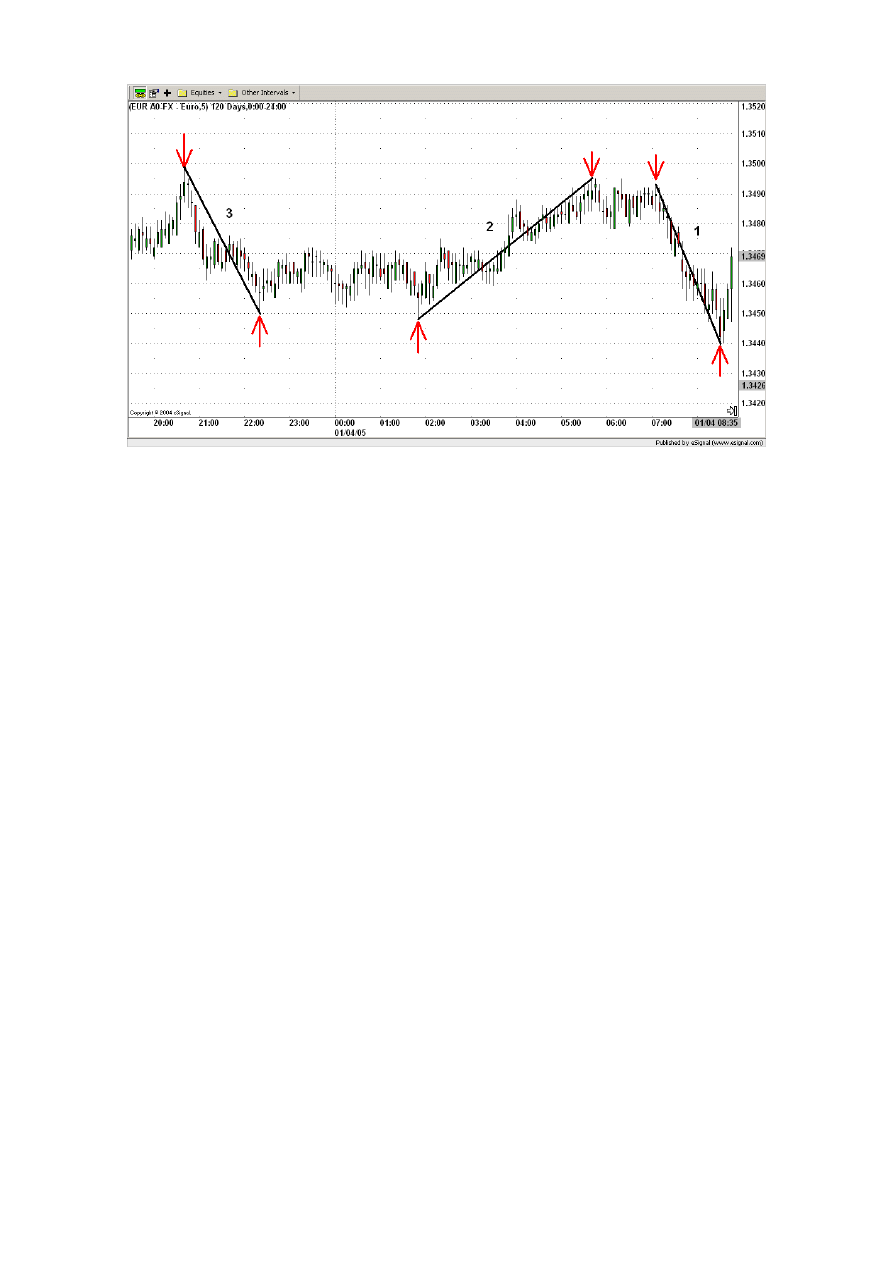
If you look at the entry signals that our strategy produces in Figure 2.13 you can see that
our entry signals are able to predict the main direction that the market will take. This
enables us to catch up a long-term intra-day wave after entering the market and therefore
pick up a considerable number of pips.
Figure 2.13.
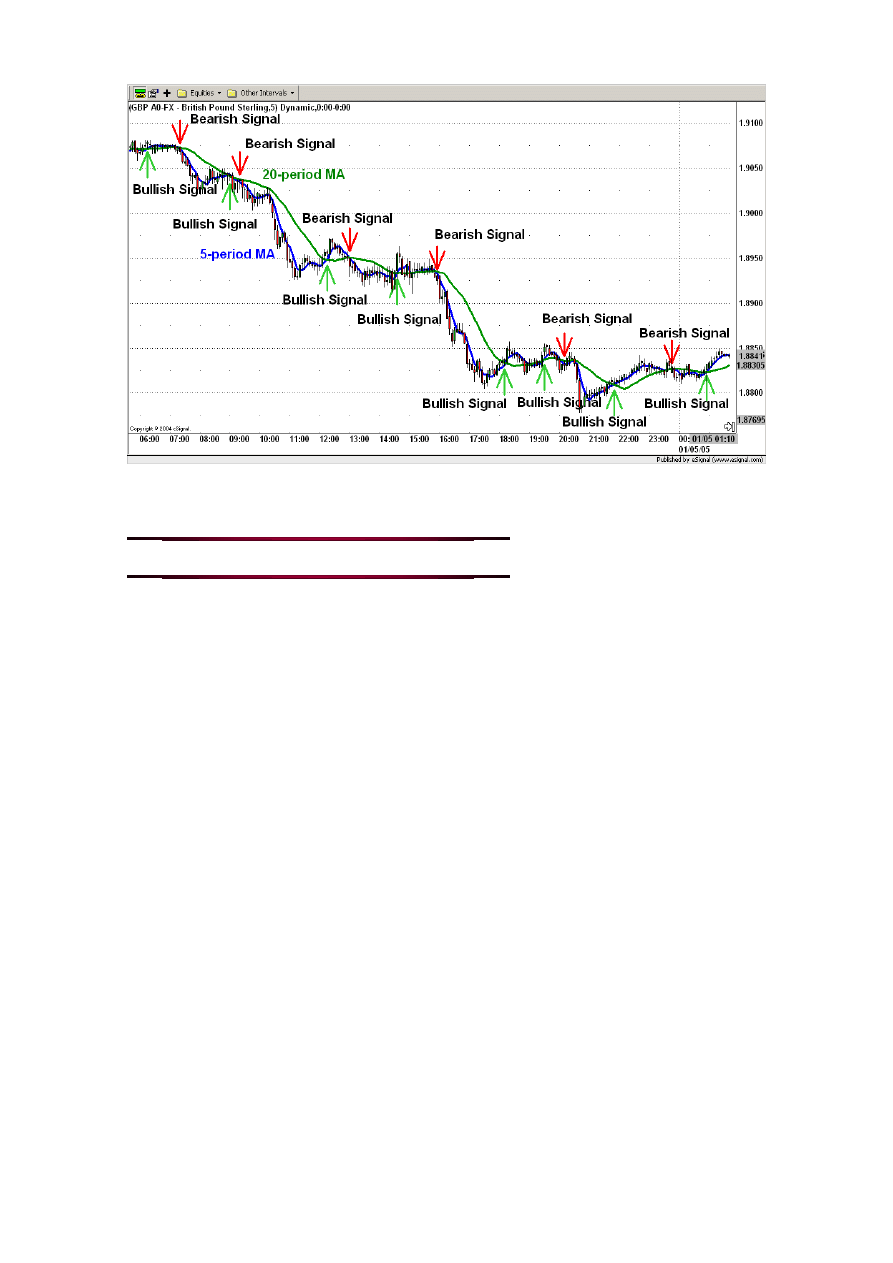
Instead, if you look at the entry signals that would for example have been generated by a
commonly used entry strategy, that is the crossing of the 20-period moving average with
the 5-period moving average, one recognizes that a lot of the entry signals generated by
MA crossings are of really poor quality, as they are not able to predict what will be the
main market trend (see Figure 2.14).
35
Figure 2.14.
2.5. Why is our exit strategy so profitable?
Most traders make a mistake by thinking that entering the trade is more important than
exiting the trade, and if they have found an entry strategy with positive expectations, “the
job is done”. Nothing could be further away from the truth. Exit strategy is equally if not
more important than entry. In majority of strategies that are used by average traders a
trailing stop is used. A trailing stop is definitely better than a hard stop, however our
strategy goes way beyond regular trailing stops when determining the place of exit.
Before we go on, for the ones not knowing the meaning of a trailing stop, we will show
you what a trailing stop is and how it works.
A trailing stop order with a moving rate of 30 pips works as follows: suppose you are
entering long a position at the closing price of 1.2456 at 10:10 AM (see Table 2.1). Using
the above defined exit strategy you will then put your stop order at 1.2426 (30 pips below
1.2456). If the next closing price is at least 30 pips greater than the last stop order, the
new stop order will be the new closing price minus 30 pips. For example at 10:15 AM the
closing price of 1.2490 is 64 pips greater than the last trailing stop. Because of that the
new trailing stop is set to be 1.2460 = 1.2490 – 0.0030. Also at 10:25 AM the closing
price of 1.2495 is 35 pips greater than the last trailing stop. The new trailing stop is set to
36
be 1.2465 = 1.2495 – 0.0030. In this example the position is exited at 10:30, because the
low of that period of 1.259 is below the stop order of 1.2465.
Time
Low
Close
Old stop order New stop order
Comment
10:10:00 1.2446 1.2456
-
1.2426
Entry position /
Stop order at 1.2426
10:15:00 1.2464 1.2490
1.2426
1.2460
Stop order changed
to 1.2460
10:20:00 1.2462 1.2483
1.2460
-
10:25:00 1.2478 1.2495
1.2460
1.2465
Stop order changed
to 1.2465
10:30:00 1.2459 1.2479
1.2465
-
Exit position /
Low below 1.2465
Table 2.1.: Trailing stop with a moving rate of 30 pips
So what is the problem with the exit strategy shown above that uses a trailing stop?
The problem with an exit strategy using a trailing stop is that it works against the
basic fundamental trading rule “cut the losses short and let the profits run”.
And if you use a strategy that doesn’t let your profits run you are in real trouble.
And why does an exit strategy using a trailing stop work against this rule? Because very
often such a strategy fails unnecessarily, it gets you out just at the moment when your
trade needed just a little more space…Why? Every market trend, regardless of how strong
it is, also shows movements against the long-term market trend. These deviations usually
don’t last very long and after them the market moves again in the direction of the long-
term market trend.
We will now give you an example that will show you why a trailing stop is not the best
exit strategy. This example is based on the same EUR/USD long-term trade example from
chapter 7. Let’s have a look at Figures 2.15 to 2.18. Suppose we entered the market long
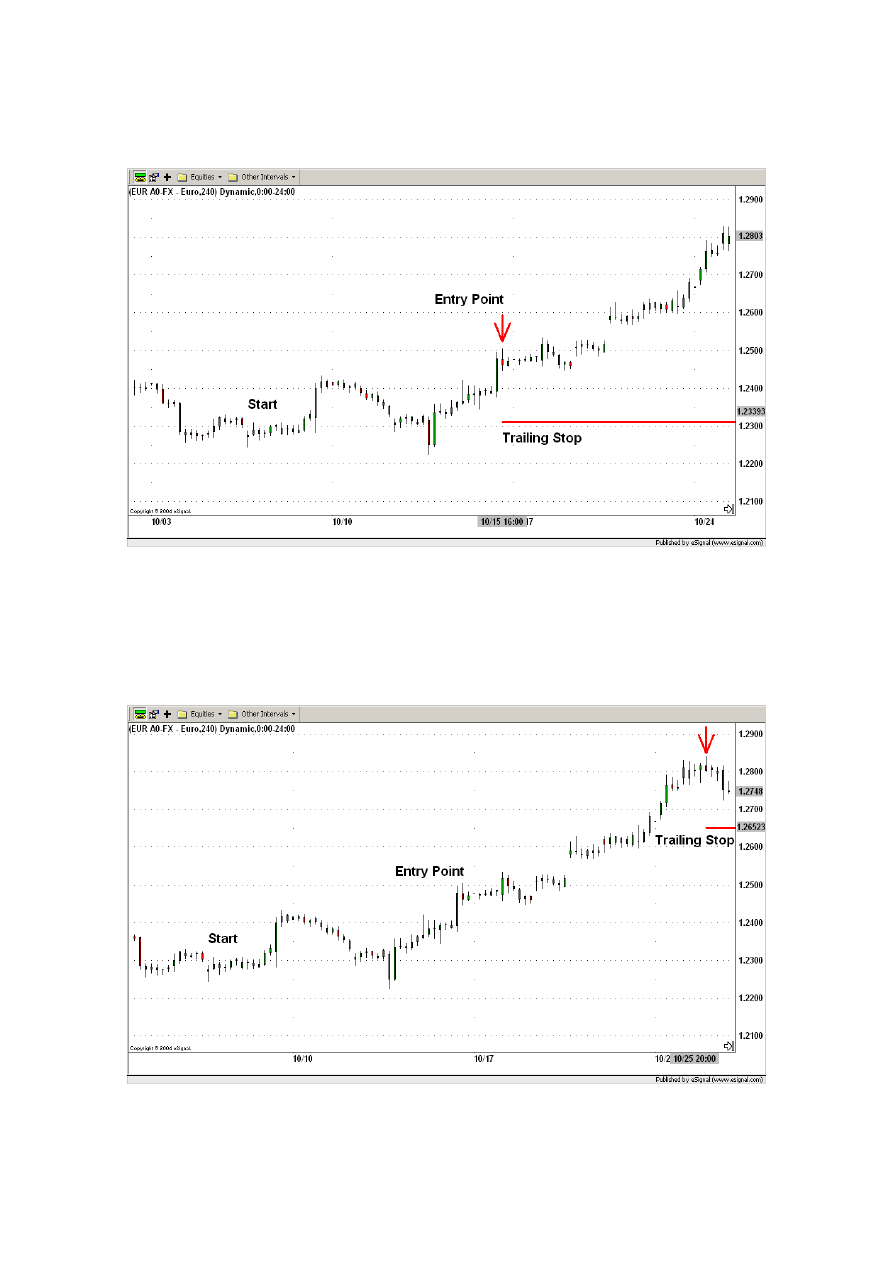
37
at 16:00 on the 10/15/04 at the price of 1.2461 (see Figure 2.15) and also that we will be
using a 150 pips trailing stop, which is an appropriate moving rate for long-term trading.
Figure 2.15.
At 04:00 on the 10/26/04 the closing price reached the price of 1.2802 (see Figure 2.16).
That means according to the rules of a trailing stop, the new stop order is placed 150 pips
below. That means at 1.2652 = 1.2802 - 0.0150.
Figure 2.16.
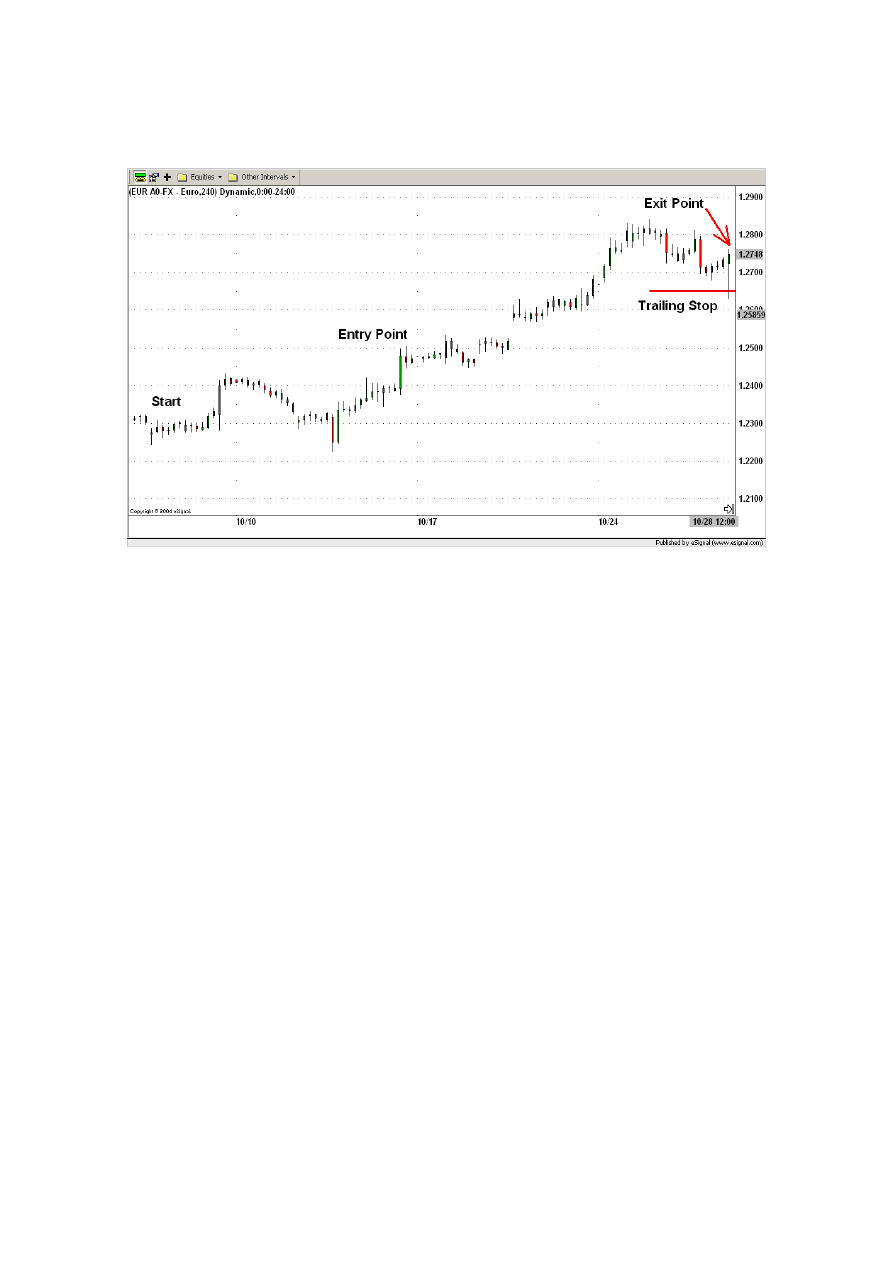
38
At 12:00 on the 10/28/04 the candlestick touches the stop order and the position is exited
at the price of 1.2652 (see Figure 2.17).
Figure 2.17.
The total profit of the trade using the 150 pips trailing stop was 1.2461 - 1.2652 = 191
pips. Although we exited the position with profit (191 pips), we lost the chance of picking
up the amount of pips that were possible in that trade.
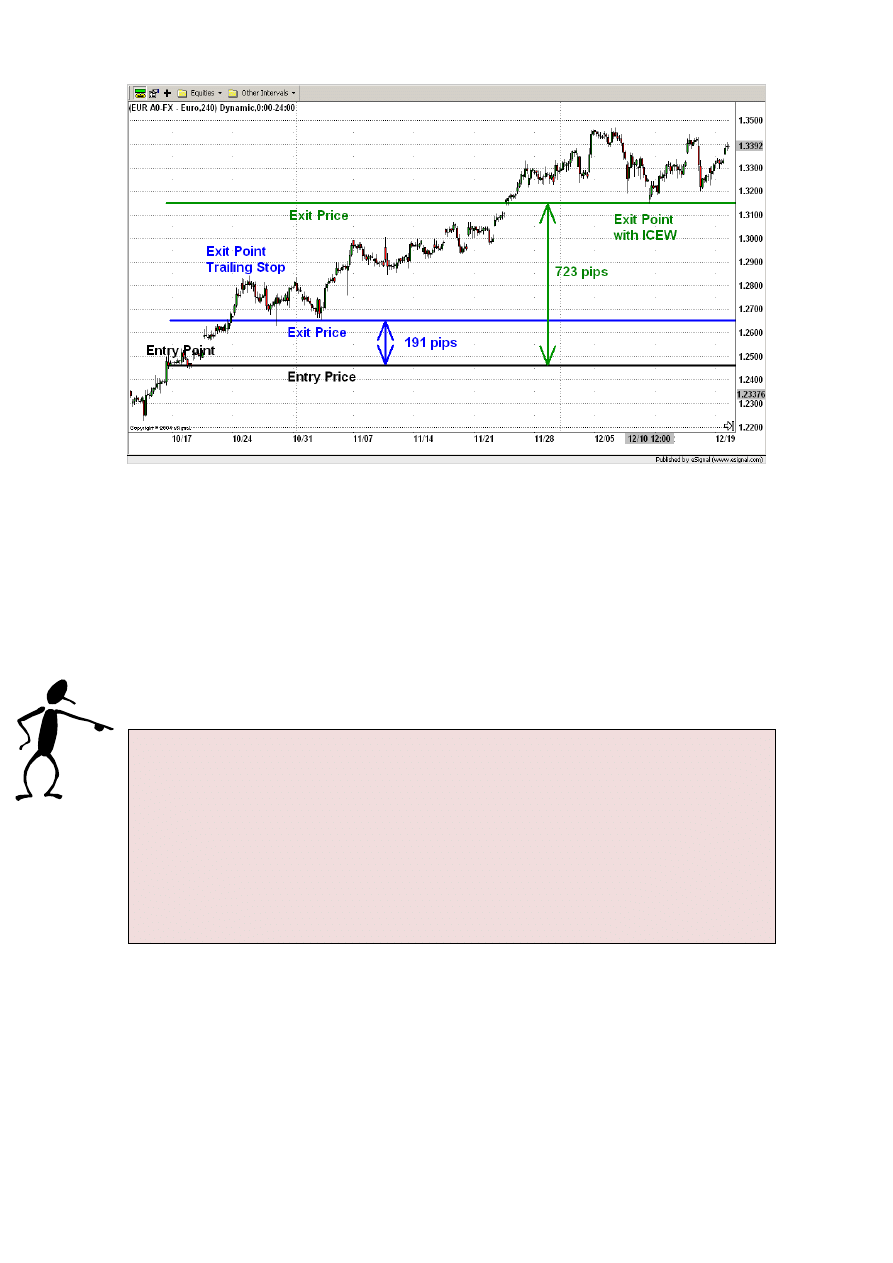
How much profit was actually possible in that trade? As we will show you explicitly in
chapter 7 we made in this trade a profit of 723 pips, when using our exit trading rules. In
Figure 2.18 you can see both the profit gained by the 150 pips trailing stop (191 pips) and
by our exit trading rules (723 pips), which are almost four times higher. Using a simple
trailing stop is not only a pity for the lost pips (532 pips), but it is making trading in the
long run unprofitable: two losses of 150 pips followed by a win of 191 pips result in net
loss of 109 pips. In contrast two losses of 150 pips followed by a win of 723 pips result in
a net win of 423 pips! Do you get the point?
39
Figure 2.18.
The basic error of the strategy with the trailing stop was, that although the market was
clearly going in the direction of the trade (on the 10/26/04 a profit spread of almost 400
pips was already reached) the trailing stop didn’t give the trade enough space to run. In
particular if a profit spread of 400 pips was already reached it makes sense to risk, let’s
say 200 pips to give the trade a bigger chance to double or even triple the profit (at the
end 723 pips were reached!).
Basically the greater the profit spread is the more pips we can risk, in order to
gain even more. Again, one should not forget, that not every position will make
profit and in order not only to come even with the losses but also to make
considerable profit, one needs to milk every possible cent out of every profitable
trade. This is where our strategy comes into play.
40
We hope you could get some impression of the research done behind our trading
strategy. We understand that this chapter was complicated and maybe sometimes
a little bit boring; however we had made it as short and concise as possible. If we
had included all of the tests and calculations that were needed to produce the
ICWR strategy we would had needed at least several hundred pages… In the next
chapter you will be shown every aspect of ICWR strategy that you need to know
in order to be able to implement it successfully. Thank you for your patience. ☺

41
Chapter 3
The Intraday ICWR
Trading Rules
For the purpose of explaining our trading strategy we will be using Esignal charting
software. Which software and which trading platform you will be using is entirely up to
you, however our setup will give you a general idea of what capabilities should your
software have. Our examples will deal with EUR/USD, USD/CAD and GBP/USD.
Basically if you live in Canada we would encourage you to trade USD/CAD, if you live
in Australia you should trade USD/AUD, if you live in East Asia you should trade
USD/JPY, if you live in UK you should trade either USD/GBP or EUR/GBP, if you live
in European Union you are best off trading EUR/USD and finally if you live in the United
States you should trade USD against the currency that you are most familiar with. (EUR,
JPY, GBP, CAD, SFR). Trading the currency that you are familiar with has lots of
advantages vs. trading currencies that you have never used. For example, a person who
lives in Canada remembers approximate range of CAD vs. USD during past ten years or
more and has much better understanding of those currencies than average person from
Japan. Principles and rules that are explained in this strategy can be used to trade any of
the above currencies.
The Intraday ICWR Trading Rules are composed of:
• entry signals generated by impulsive/corrective wave retracement breakouts using a
five minutes candlestick chart
• entry confirmation filters generated by a 1-day based 14-period Relative Strength
Index (RSI) momentum indicator in order to confirm the bullish or bearish entry
signal from the five minutes candlestick chart

42
• exit signals generated by impulsive/corrective wave retracement breakouts using a
five minutes candlestick chart or by a hard stop order of 50 pips using a five minutes
candlestick chart
As you can see our strategy places equal importance on entry and exit signals and this is
where it greatly differs from most of the strategies out there. First of all we will show you
how to recognize the market signals generated by impulsive/corrective wave retracements
(see chapter 3.1). Then we will show you when to enter a trade using the market signals
generated by impulsive/corrective wave retracements filtered with the 1-day based 14-
period RSI momentum indicator (see chapter 3.2). Finally we will show you when to exit
a trade due to either an exit signal generated by an impulsive/corrective wave retracement
or by a hard stop order of 50 pips (see chapter 3.3).
3.1. Market signals generated by ICWR
Before starting to apply the Intraday ICWR Trading Rules, the first thing to do is to
recognize from the candlestick chart the actual candidate for being an impulsive or a
corrective wave. This candidate we will call from now on the active wave. How to
recognize the active wave from the candlestick chart is shown in chapter 3.1.1.
After having recognized the active wave we apply the Intraday ICWR Trading Rules.
Based on these rules our strategy generates bullish or bearish signals that can be used for
entering as well as exiting the trade either on a long or a short side. How to apply the
Intraday ICWR Trading Rules once an active wave is recognized is shown in chapter
3.1.2.
3.1.1. Recognition of the active wave
The active wave is the nearest market movement to the actual time of our trading with a
height greater than 40 pips. In order to find the active wave from the candlestick chart
the following steps are to be done:
First identify all possible upward and downward waves that seem to be close to or greater
than 40 pips on the candlestick chart as shown in Figure 3.1.
43
Figure 3.1.
Then draw the waves, connecting the extreme values of the starting and the ending point
as shown in Figure 3.2. If the wave goes downwards we are going to connect the high
value of the starting point with the low value of the ending point. Else if the wave goes
upwards we are going to connect the low value of the starting point with the high value of
the ending point.
Figure 3.2.
Enumerate the waves starting with the nearest wave to the actual time as shown in Figure
3.3. Please notice that the actual time is always at the right of the candlestick chart.
44
Figure 3.3.
Afterwards read the extreme values of each wave and calculate its height.
Wave 1:
High = 1.3493; Low = 1.3439;
Height = High – Low = 1.3493– 1.3439= 0.0044 = 44 pips
Wave 2:
High = 1.3495; Low = 1.3448;
Height = High – Low = 1. 3495– 1. 3448= 0.0047 = 47 pips
Wave 3:
High = 1.3499; Low = 1.3450;
Height = High – Low = 1. 3499– 1. 3450= 0.0049 = 49 pips
Finally identify the nearest movement to the actual time position with a height equal or
greater than 40 pips. In this example it is the wave 1. This is now the active wave (see
Figure 3.4).
45
Figure 3.4.
If none of the waves has a height greater than 40 pips you have to go further in the past
until the active wave is found.
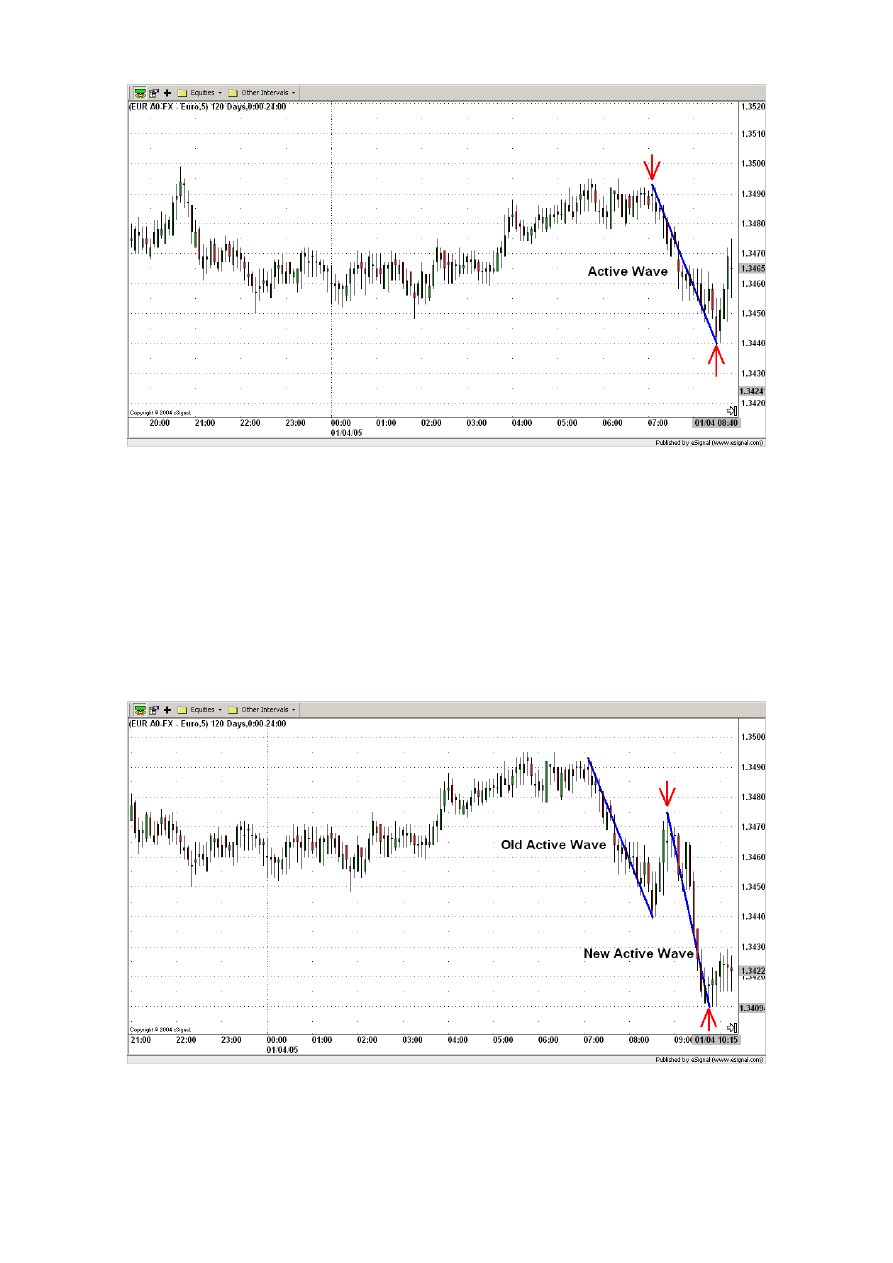
As the time goes on a new movement with a height greater than 40 pips will occur. In that
case the previous active wave gets inactive, and we get the new active wave (see Figure
3.5).
Figure 3.5.
46
3.1.2. Applying the Intraday ICWR Trading Rules to an active wave
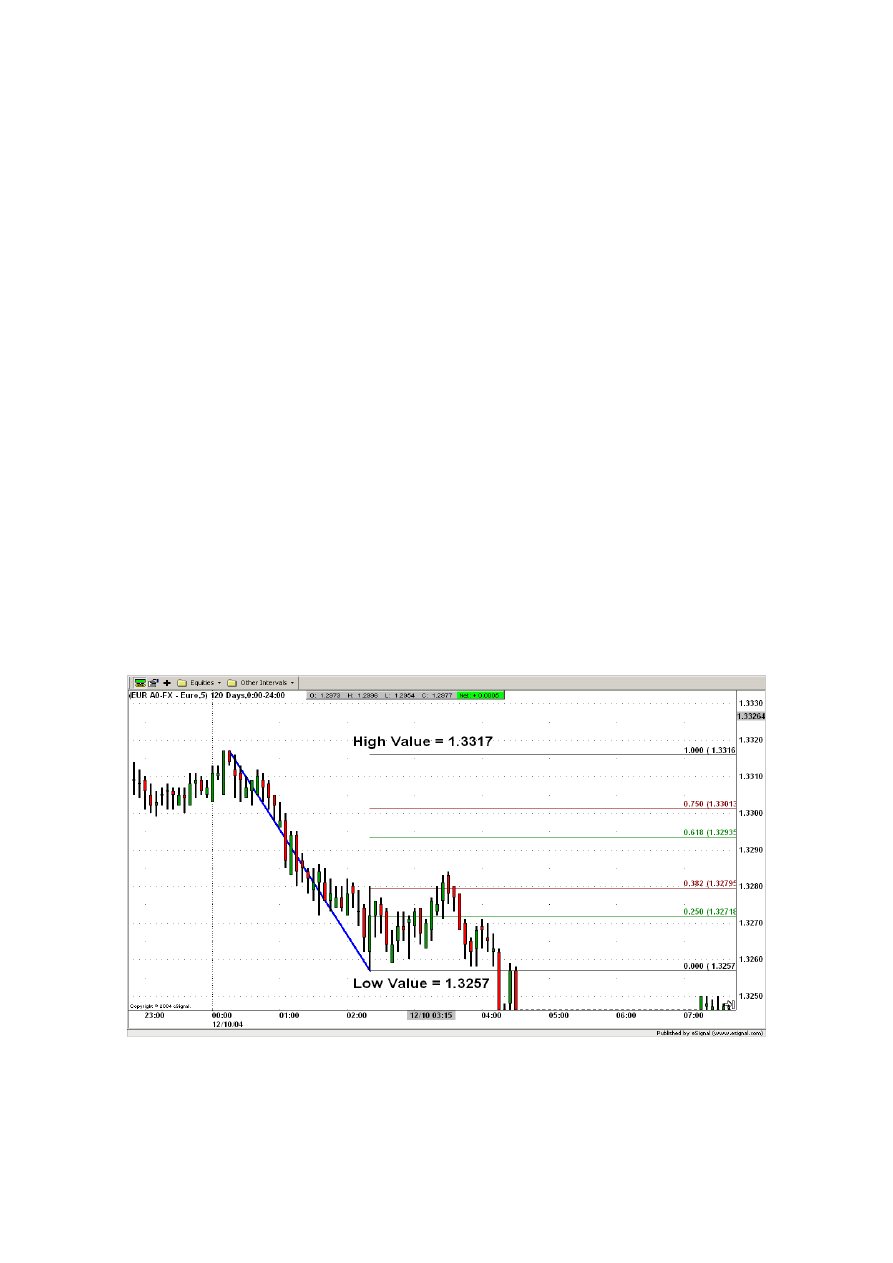
Every time a new active wave is recognized the Fibonacci levels are to be drawn (see
Figure 3.6). We will draw only the 0.000, 0.250, 0.382, 0.618, 0.750 and 1.000 levels.
The level 0.000 is defined by the lower extreme value, the level 1.000 by the higher
extreme value. The Fibonacci levels start at the ending points of the wave. Most of the
software packages will do this automatically for you, however if your software doesn’t
have such a feature you can do it manually. In the example below you would subtract the
low value from the high value (1.3317 – 1.3257) and you would get a height of 0.006 or
60 pips. You would then use the following formulas to get the Fibonacci levels.
0.25 Level = Low Value + 0.25 * Height
0.25 Level = 1.3257 + 0.25 * 0.0060 = 1.3272
0.382 Level = Low Value + 0.382 * Height
0.618 Level = Low Value + 0.618 * Height
0.75 Level = Low Value + 0.75 * Height
Figure 3.6.
47
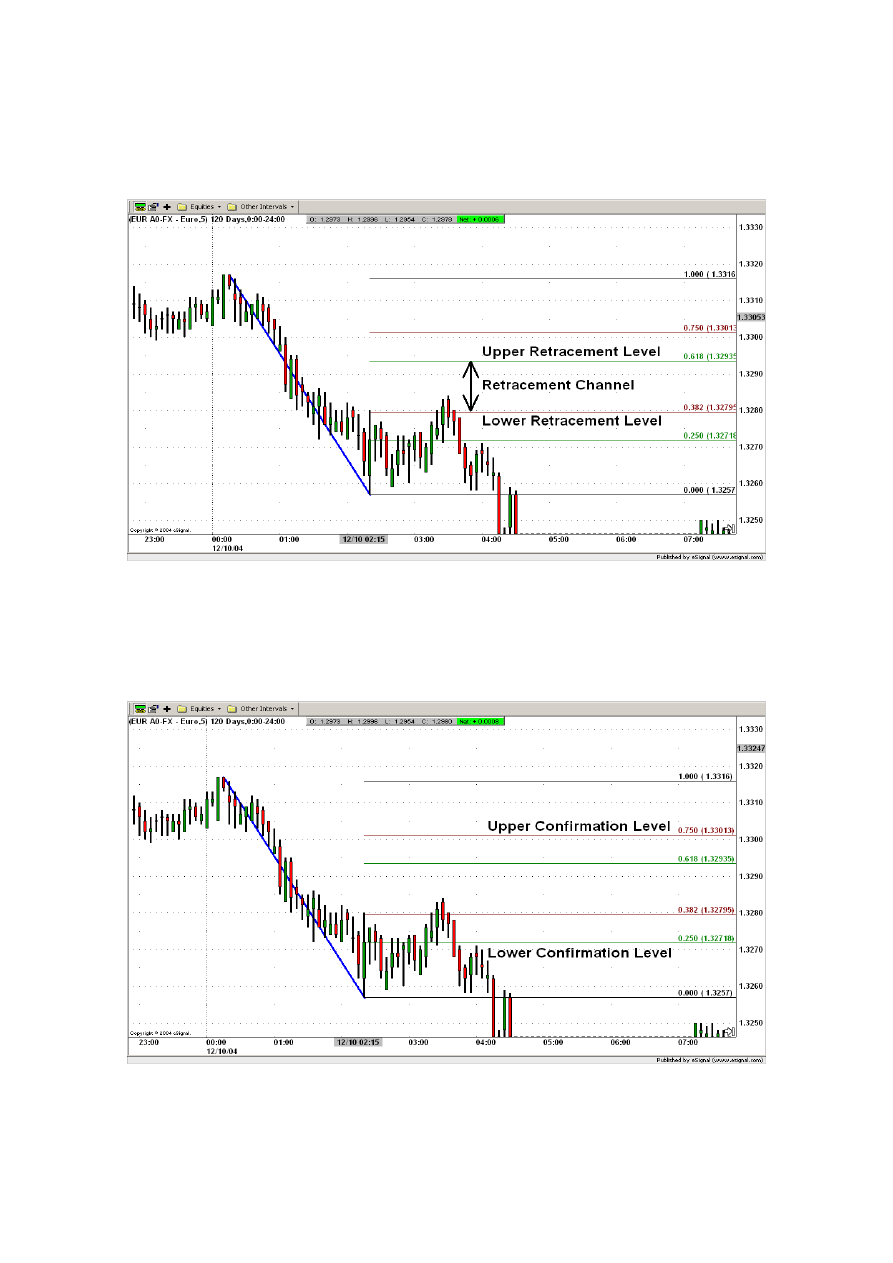
The level 0.382 defines the lower retracement level, the level 0.618 the upper
retracement level. The retracement channel is the channel between the upper and the
lower retracement levels:
Figure 3.7.
The level 0.250 defines the lower confirmation level, the level 0.750 defines the upper
confirmation level:
Figure 3.8.
48
The levels 0.000 and 1.000 have no trading relevance. They are only drawn for
confirming that the Fibonacci levels are drawn properly.
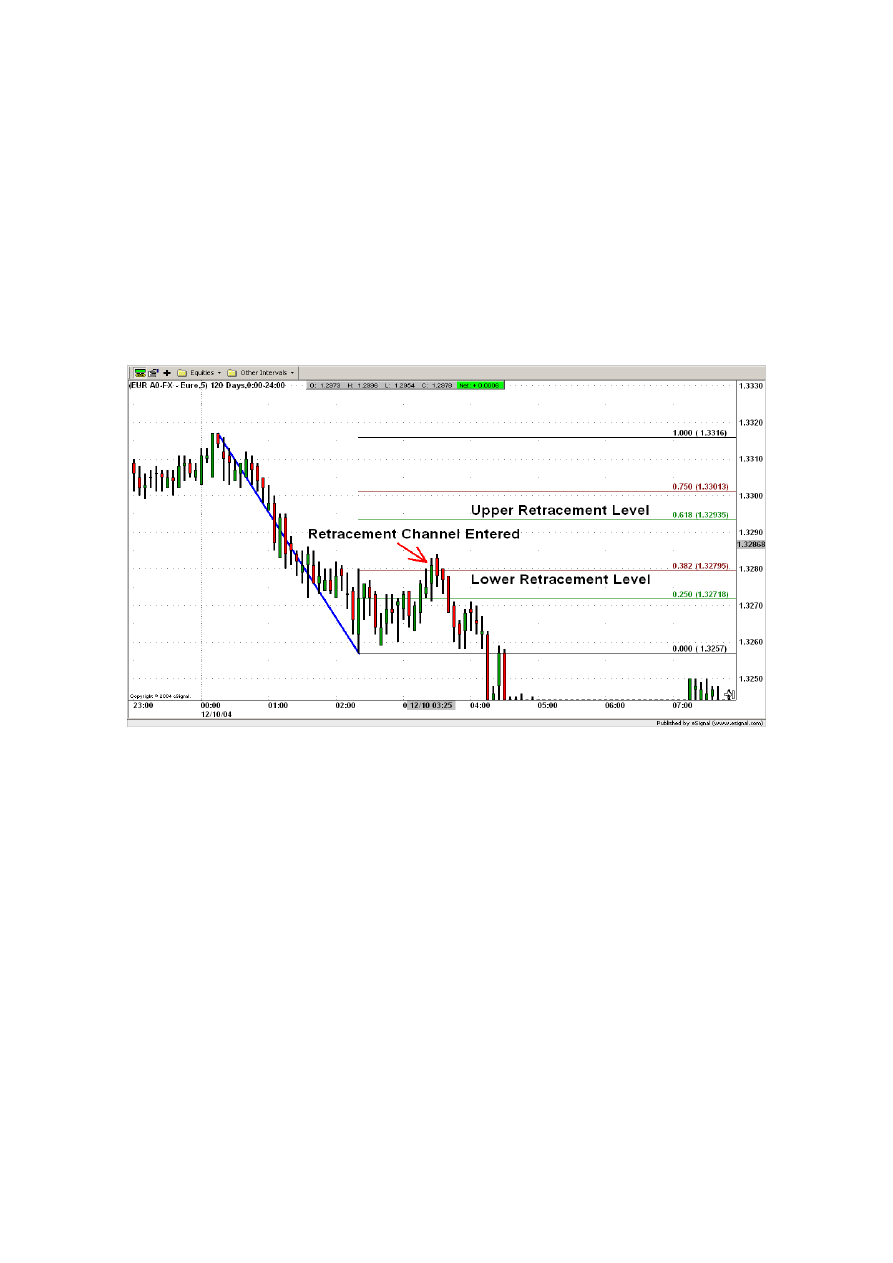
The Intraday ICWR Trading settings are done, now we need to see what the market is
telling us. First we will concentrate only on the retracement channel. We wait until the
retracement channel is triggered. Only then we can use the confirmation levels.
The retracement channel is triggered when the closing price of a candlestick is inside
of the retracement channel.
Figure 3.9.
Once the retracement channel is entered we will forget about it and concentrate only on
the confirmation levels. The following four cases are now possible:
Case 1. “Downward impulsive wave”
If the active wave goes downwards and the whole candlestick goes below the lower
confirmation level (0.250) we identify that wave as an impulsive wave. According to the
chapter 1 the impulsive waves go in the direction of the market trend. As the trend of the
wave is bearish (as it goes downwards) it is giving us the information that the actual
market trend is also bearish. This is a bearish signal. Such a bearish signal is shown in the
Figure 3.10. below.
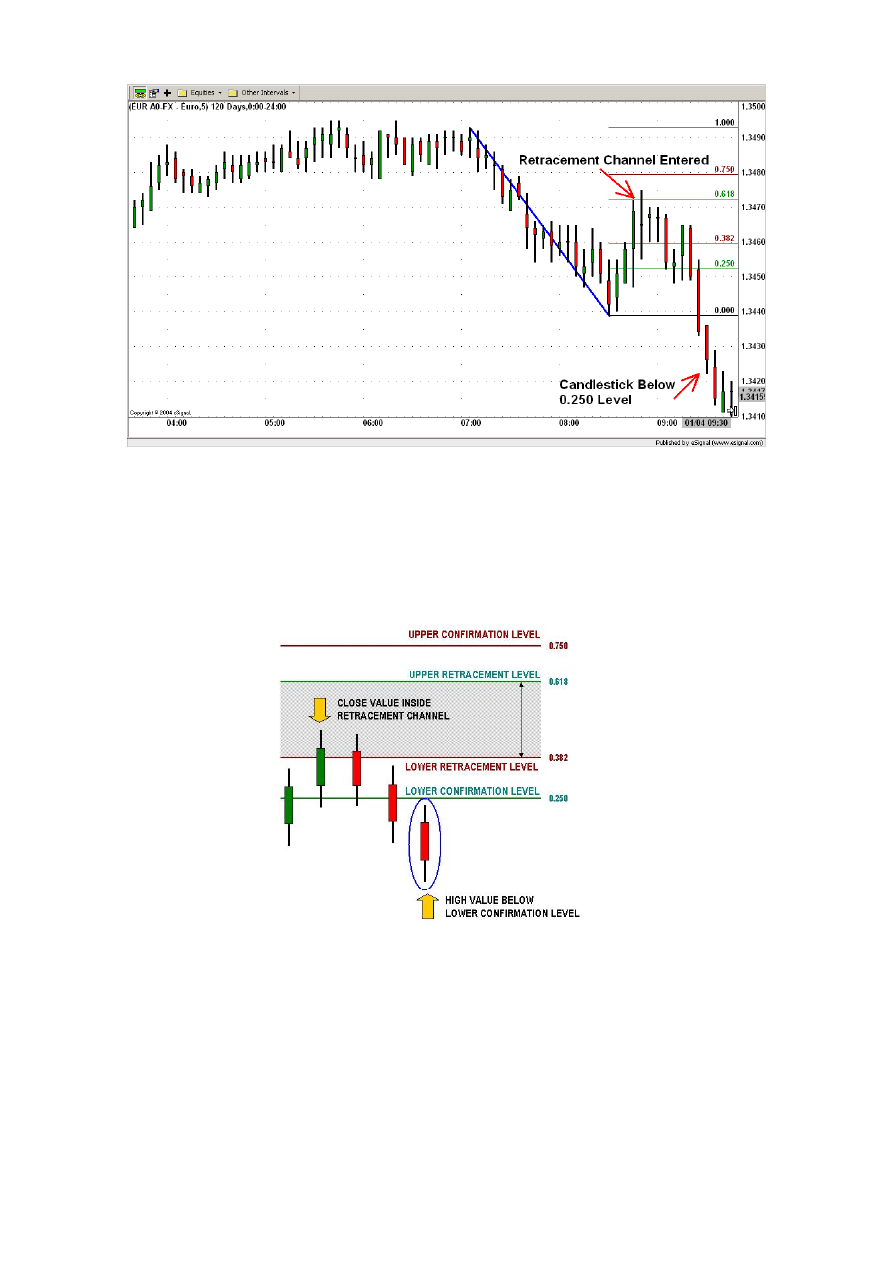
49
Figure 3.10.
Please remember that when we say that the candlestick is below the lower confirmation
level, we actually mean that the whole candlestick is below the lower confirmation level.
This is shown in the Figure 3.11. below.
Figure 3.11.
Case 2 “Upwards impulsive wave”
If the active wave goes upwards and the whole candlestick goes above the upper
confirmation level (0.750) we identify that wave again as an impulsive wave. According
to the chapter 1 the impulsive waves go in the direction of the market trend. As in this
50
case the trend of the wave is bullish (as it goes upwards) it is giving us the information
that the actual market trend is also bullish. This is a bullish signal.
Figure 3.12.
Case 3 “Downwards corrective wave”
If the active wave goes downwards and the whole candlestick goes above the upper
confirmation level (0.750) the active wave is a corrective wave. According to the chapter
1 the corrective waves go against the direction of the market trend. As in this case the
trend of the wave is bearish (as it goes downwards) it is giving us the information that the
actual market trend is opposite to the trend of the active wave and therefore bullish. This
is a bullish signal. Such a bullish signal is shown in the Figure 3.13. below.
51
Figure 3.13.
Case 4 “Upwards corrective wave”
If the active wave goes upwards and the whole candlestick goes below the lower
confirmation level (0.250) the active wave is a corrective wave. According to the chapter
1 the corrective waves go against the direction of the market trend. As in this case the
trend of the wave is bullish (as it goes upwards) it is giving us the information that the
actual market trend is opposite to the trend of the active wave and therefore bearish. This
is a bearish signal.
Figure 3.14.
52
Ok, we know this stuff is a little bit complicated. But don’t be discouraged! Things,
will become more clear for you now. We will now explain to you again in the most
simplest manner the rules for recognizing bearish or bullish signals. That means, what
in the end you have really to understand for trading.
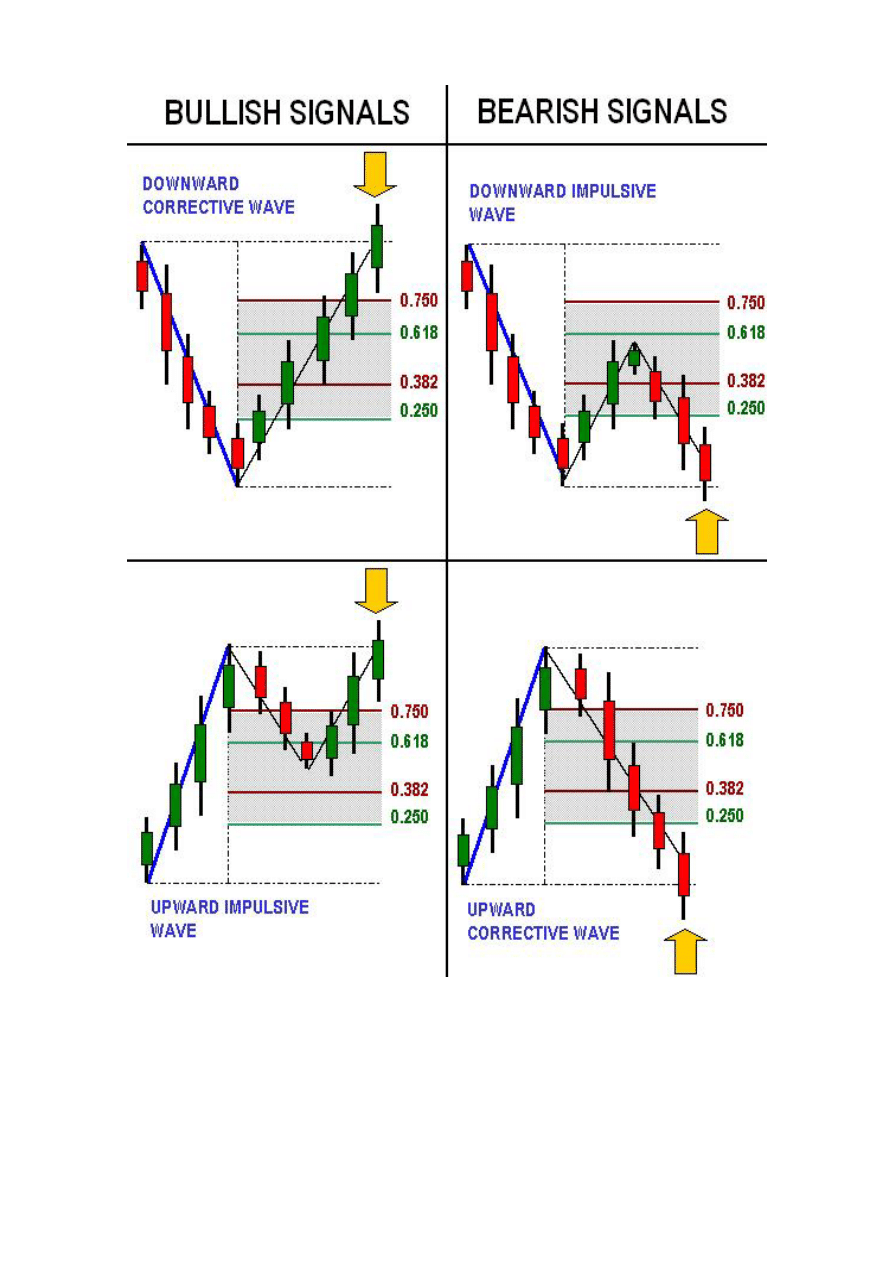
In our strategy there are two different bullish signal scenarios and two bearish signal
scenarios.
A bullish signal occurs if the active wave is recognized as a downward corrective
wave (see Figure 3.15. below). That means the active wave was downward and the
whole candlestick was found above the upper confirmation level (0.750).
A bullish signal also occurs if the active wave is recognized as an upward impulsive
wave (see Figure 3.15. below). That means the active wave was upward and the whole
candlestick was found above the upper confirmation level (0.750).
A bearish signal occurs if the active wave is recognized as a downward impulsive
wave (see Figure 3.15. below). That means the active wave was downward and the
whole candlestick was found below the lower confirmation level (0.250).
A bearish signal also occurs if the active wave is recognized as an upward corrective
wave (see Figure 3.15. below). That means the active wave was upward and the whole
candlestick was found below the lower confirmation level (0.250).
Please note that each time we need to make sure that the retracement channel has been
entered. This is quite obvious for the corrective waves but not for the impulsive waves.
So please pay attention to it.
53
Figure 3.15.
54
Please note as shown in the Figure 3.16. below that, when a new active wave is
recognized, the new Fibonacci levels are drawn and the existent Fibonacci levels of the
previous active wave are deleted.
Figure 3.16.
In the Figure 3.17. shown below you can observe how the market is constantly providing
us with different trading signals.
Figure 3.17.
55
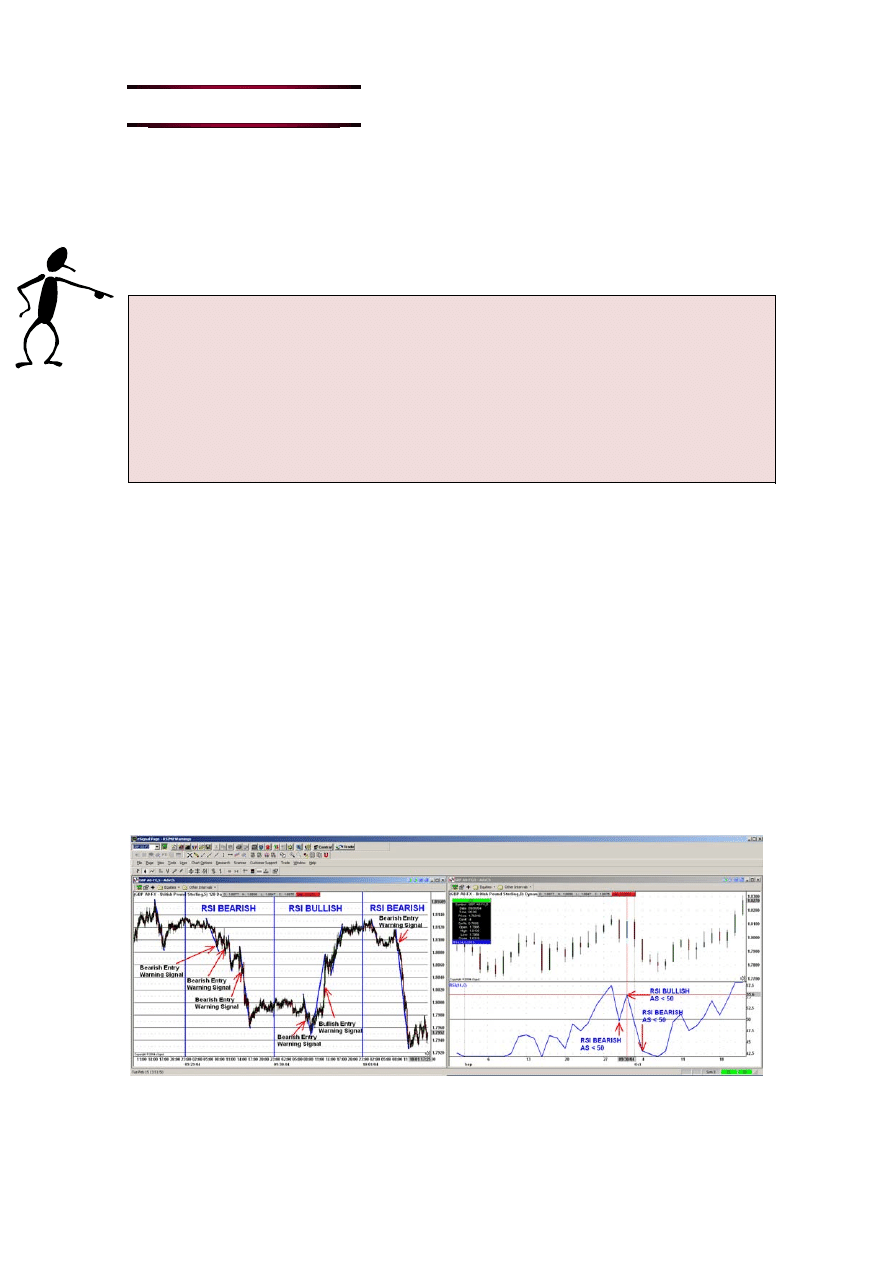
3.2. When to enter a trade
In short, we are going to enter a trade, when a signal generated by an impulsive/corrective
wave retracement (as shown in chapter 3.1) is confirmed by the 1-day 14-period Relative
Strength Index.
In the Figure 3.18. below we can see the two screen set up. On the left side there is a 5
minutes candlestick chart. On the right side there is 1-day candlestick chart with the RSI
signal below. As you can see on the 09/29/04 the RSI is below 50 and therefore bearish.
That means on that day we only use bearish signals generated by impulsive/corrective
wave retracements to enter the market short. In contrast on the 09/30/04 the RSI is above
50 and therefore bullish. That means on that day we only use bullish signals generated by
impulsive/corrective wave retracements to enter the market long. On the 09/31/04 again
we only use bearish signals generated by impulsive/corrective wave retracements to enter
the market short...
Figure 3.18.
If the signal generated by an impulsive/corrective wave retracement is bullish we
ask for the RSI to be greater than 50.
If the signal generated by an impulsive/corrective wave retracement is bearish we
ask for the RSI to be lower than 50.
56
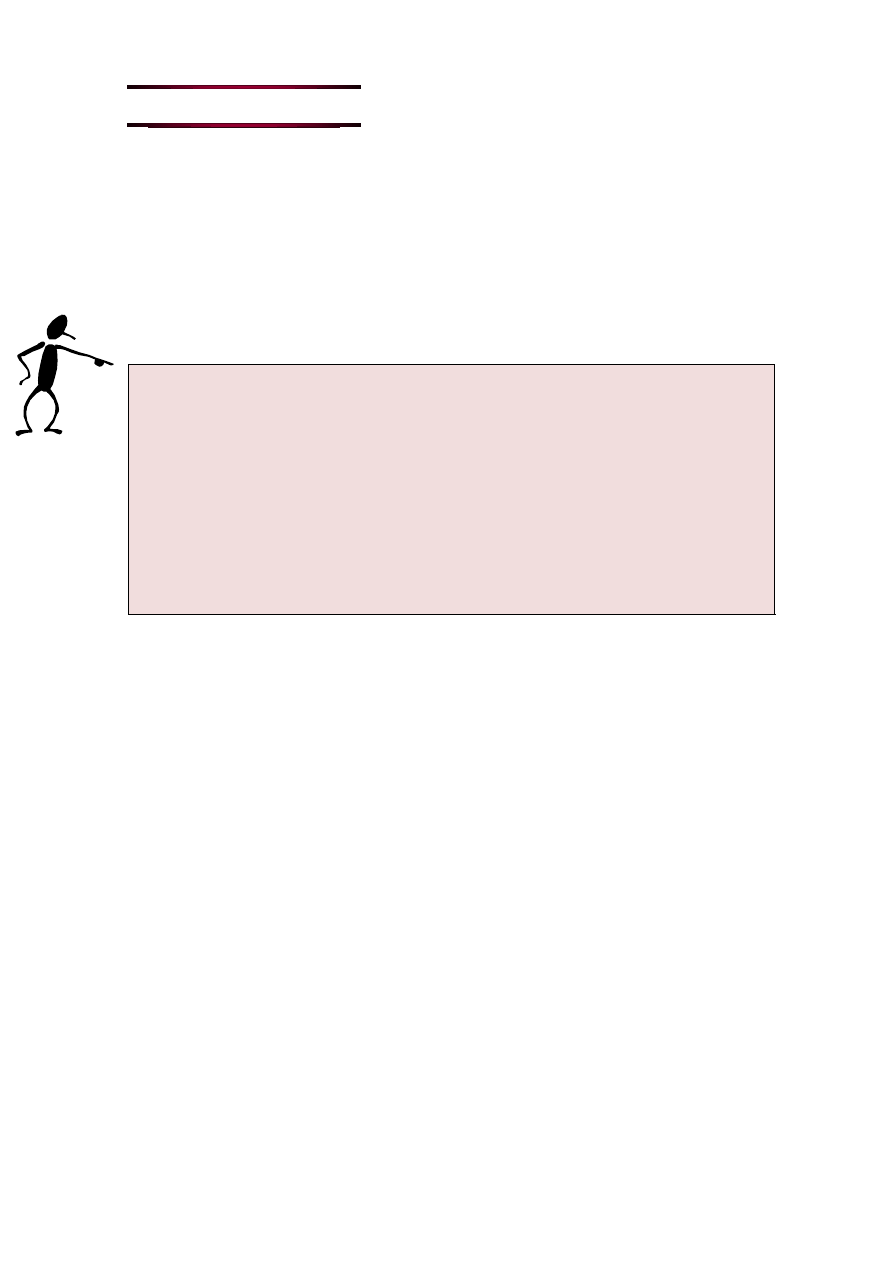
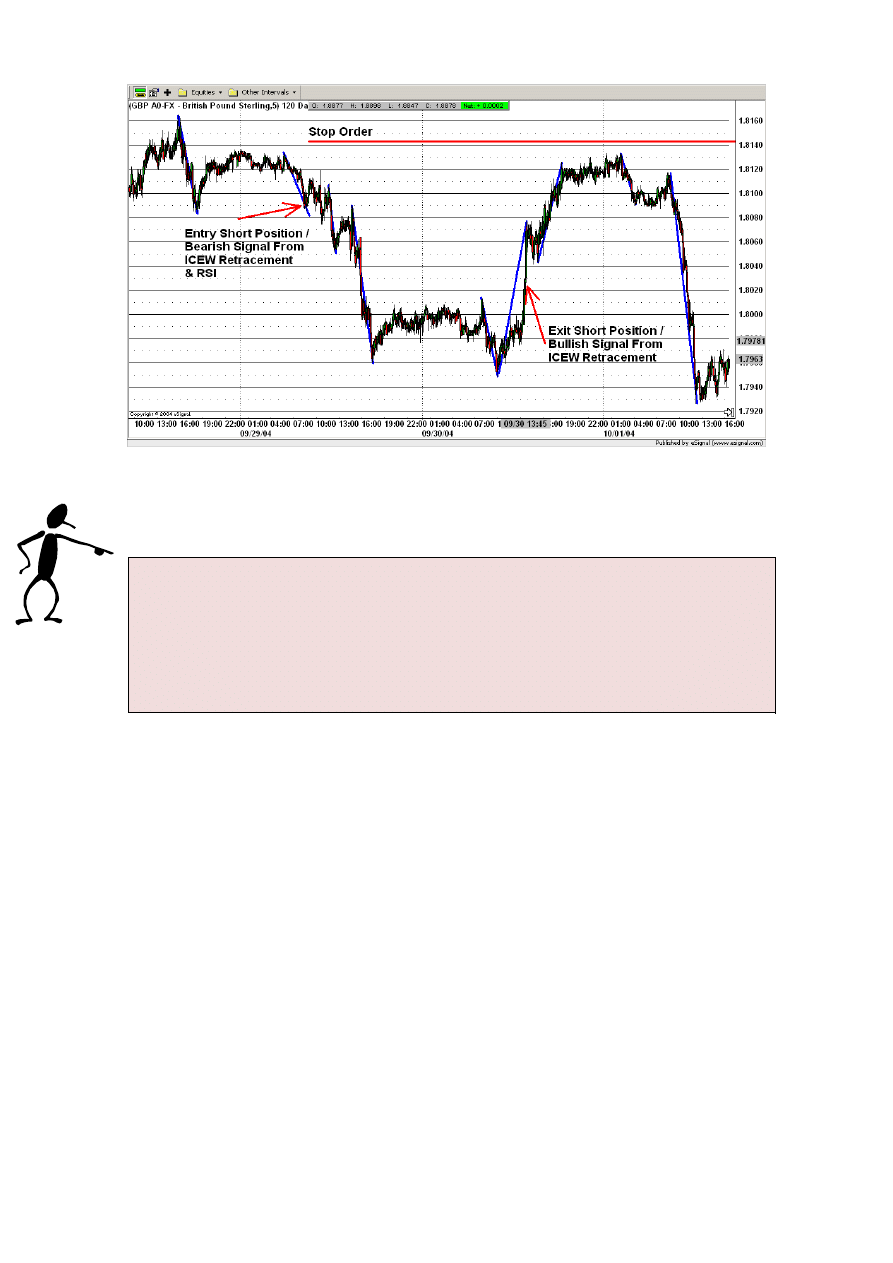
3.3. When to exit a trade
Our main exit strategy is to look for an opposite market signal (opposite to our entry
signal) based on impulsive/corrective wave retracements (in the same manner as for the
entry warning signal). Additionally (only for the sake of security) after entering a
position we place a stop order of 50 pips, because we do not want to loose more than 50
pips in one trade.
In the Figure 3.19. below the market was entered short as both the signals generated by
an impulsive/corrective wave retracement (ICWR) and the RSI were bearish. The position
was entered at 08:20 on the 09/29/04 at the price of 1.8091. Immediately after entering the
position a hard stop order of 50 pips above the entry price (in this case at 1.8091 + 0.0050
= 1.8141) is placed. In this trade the stop order is not triggered. The position is exited
because a bullish signal is generated by an impulsive/corrective wave retracement
(ICWR) at 13:45 on the 09/30/04.
If the market was entered long a position will be exited either because a bearish
signal is generated by an impulsive/corrective wave retracement (as shown in
chapter 3.1) or because of the hard stop order of 50 pips below the entry price.
If the market was entered short a position will be exited either because a bullish
signal is generated by an impulsive/corrective wave retracement (as shown in
chapter 3.1) or because of the hard stop order of 50 pips above the entry price.
57
Figure 3.19.
In this chapter you were introduced to our “Intraday ICWR Trading Rules”. Now
it’s time to go step by step through real trading examples using our strategy so
that you can see our “Intraday ICWR Trading Rules” in action.
58
Chapter 4
Intraday EUR/USD
Trading Example
In this example we are going to trade EUR/USD.
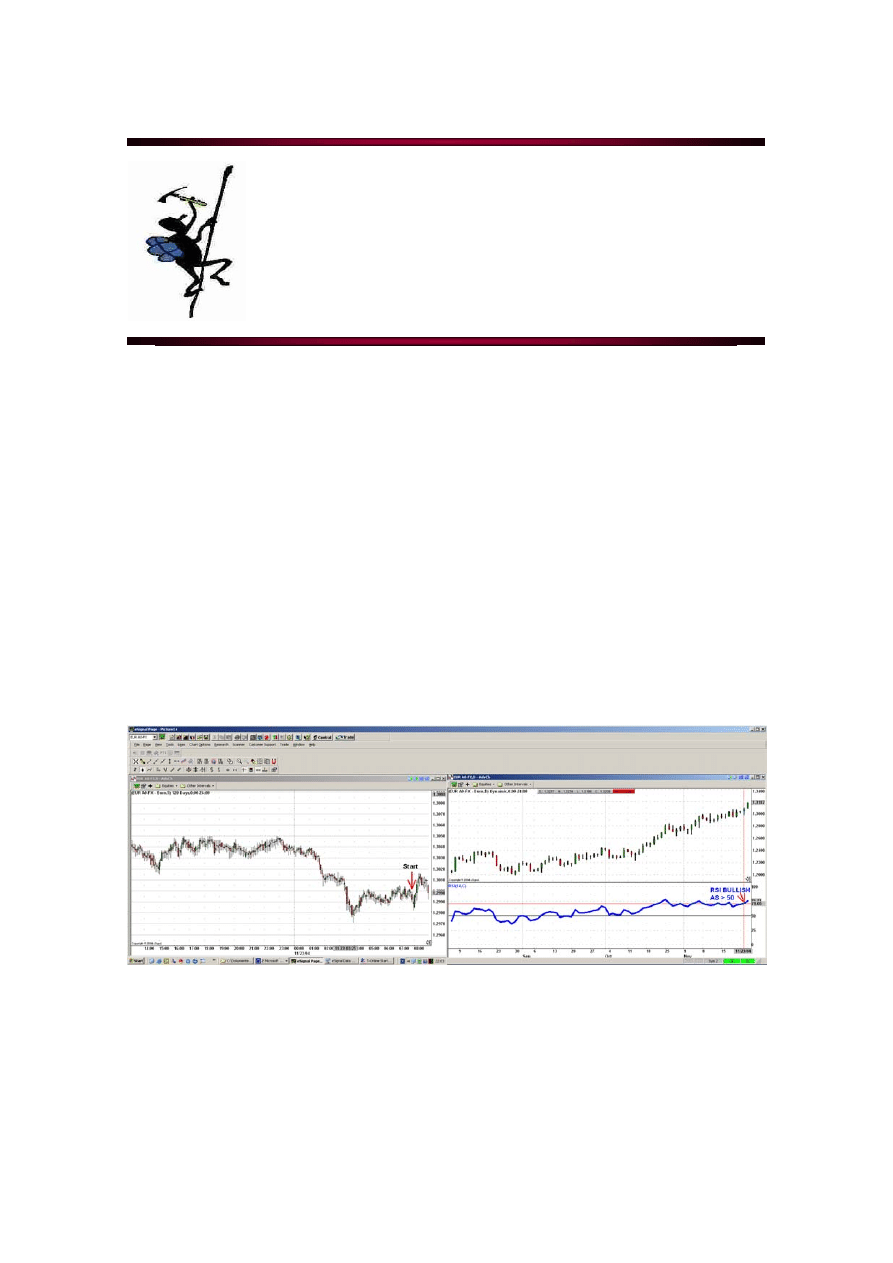
Ok, before we start our trading day we need to set up our screens (see Figure 4.1). On the
left screen we are going to place a five minutes candlestick chart and on the right screen a
one day candlestick chart together with the 14-period RSI (thick blue line). The charting
software usually pictures the RSI automatically together with the 30 and 70 lines (below
30 represents oversold, above 70 overbought). In our case we are not looking for oversold
or overbought signals. We are looking for the market being bullish or bearish. This is
represented by RSI being above 50 (bullish) or below 50 (bearish). So we only need to
draw the 50 centerline (black line).
Figure 4.1.
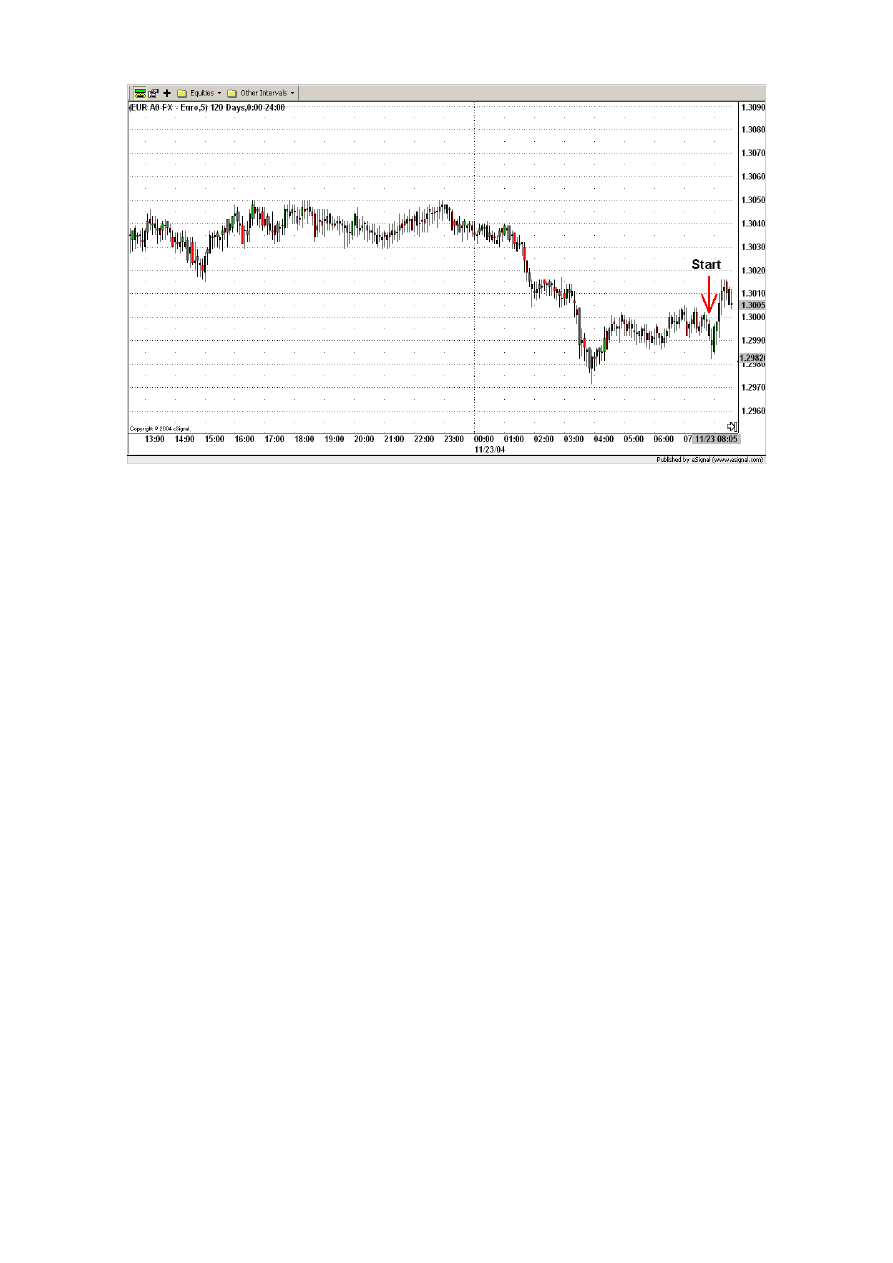
Now we are ready to start. Suppose you started your trading day on the 11/23/04 at 08:00.
At that time the price was 1.2995. As you can see from the right screen the RSI is above
50 and therefore bullish. So today we are looking only for a bullish signal for entering
long the market.
59
Figure 4.2.
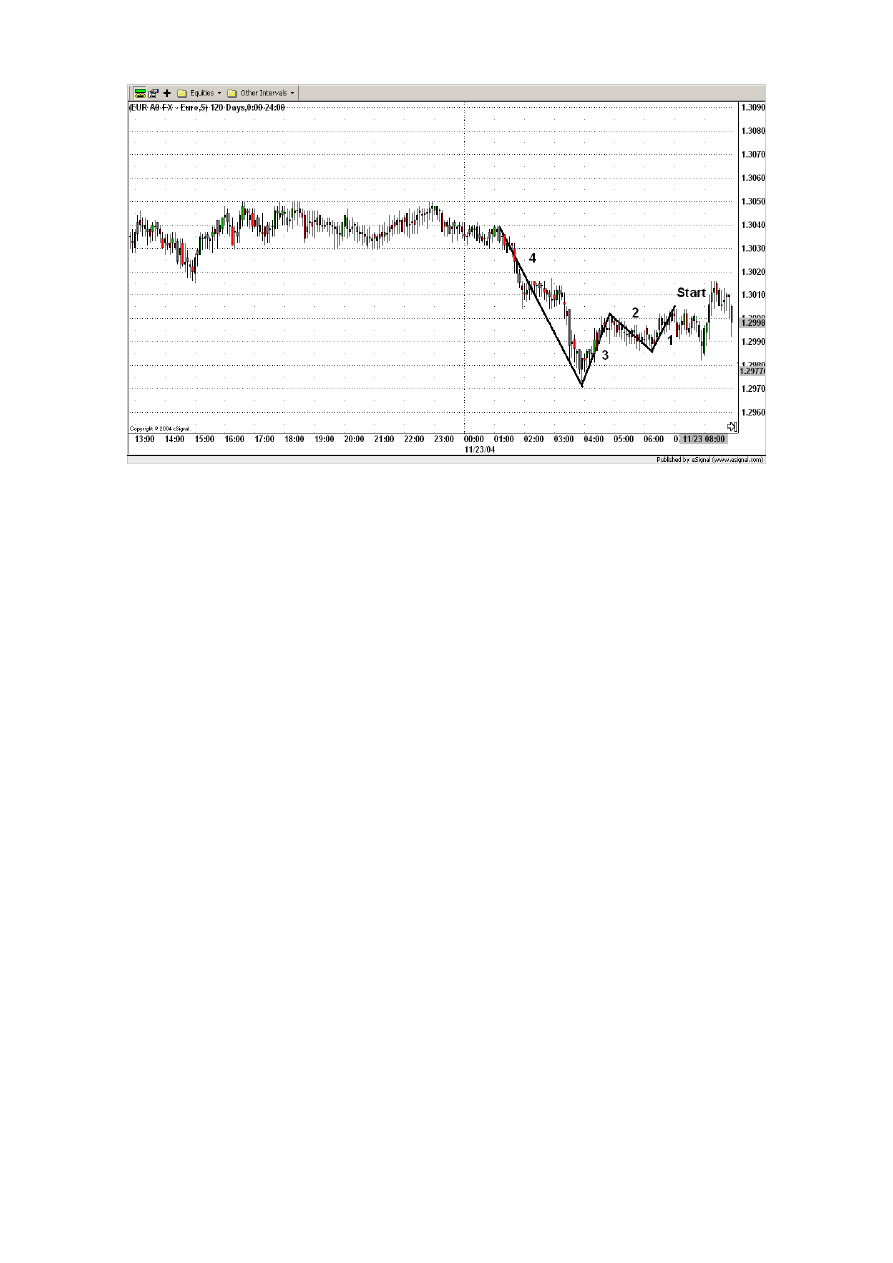
Next thing to do is to recognize the active wave. For that, we are going to look for the
nearest market movement to our starting position with a height greater than 40 pips.
Ok, in order to find the active wave the following steps are to be done:
First all possible waves (black lines) are drawn connecting the high value of the starting
point with the low value of the ending point and then the waves are enumerated starting
with the nearest wave to the actual time (see Figure 4.3).
60
Figure 4.3.
Second read the extreme values of each wave and calculate its height.
Wave 1:
High = 1.3005; Low = 1.2986;
Height = High – Low = 1.3005 – 1.2986= 0.0019 = 19 pips
Wave 2:
High = 1.3002; Low = 1.2986;
Height = High – Low = 1.3002 – 1.2986= 0.0016 = 16 pips
Wave 3:
High = 1.3002; Low = 1.2971;
Height = High – Low = 1.3002 – 1.2971= 0.0031 = 31 pips
Wave 4:
High = 1.3039; Low = 1.2971;
Height = High – Low = 1.3039 – 1.2971= 0.0068 = 68 pips
The nearest movement to our starting position with a height greater than 40 pips is the
wave 4. So that’s our active wave now. The other movements had all a height below 40
pips and therefore are not taken into consideration (throughout our trading we are not
going to pay attention to such movements).
61
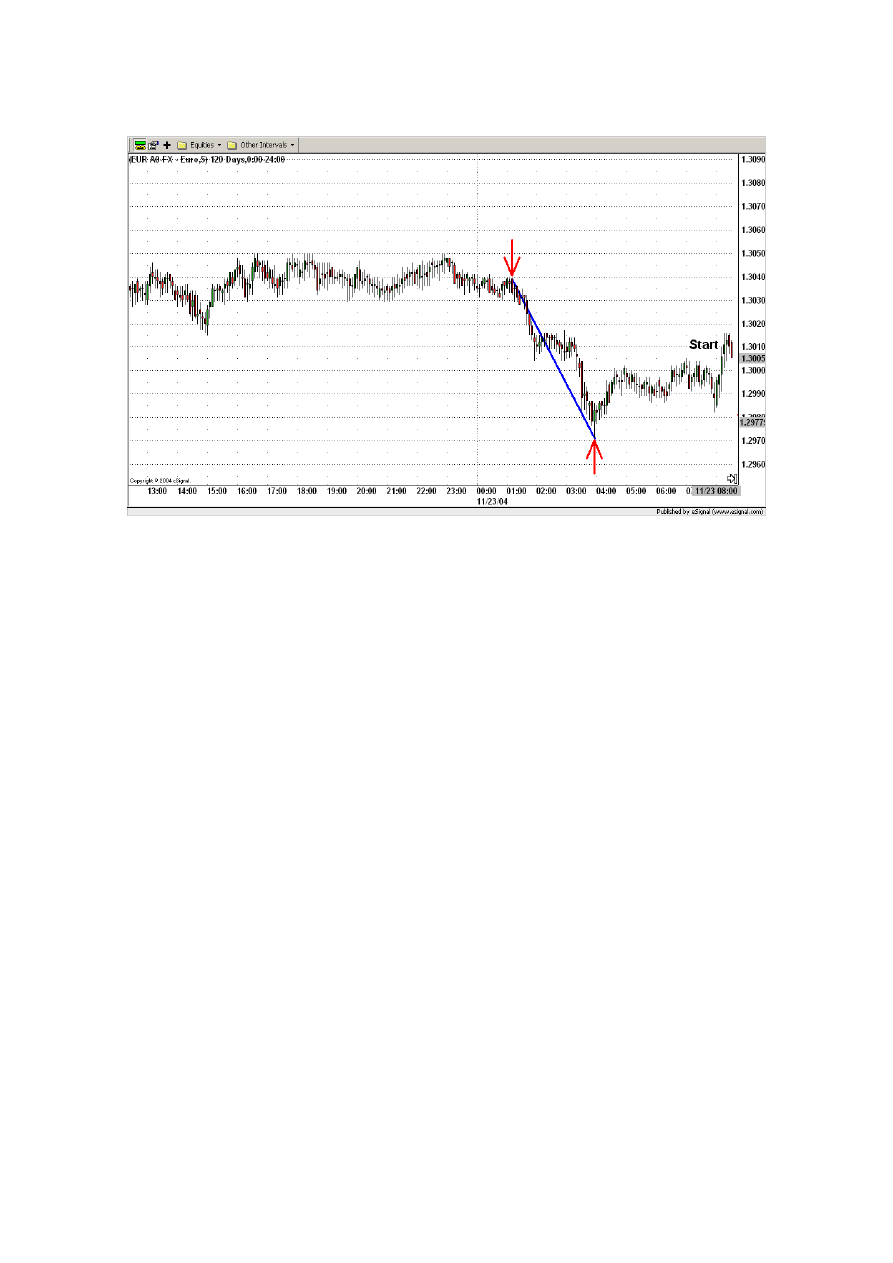
The wave 4 is now our current active wave (see blue line in Figure 4.4).
Figure 4.4.
The task is now to apply the Intraday ICWR Trading Rules.
That means, first the Fibonacci levels 0.000, 0.250, 0.382, 0.682, 0.750 and 1.000 are
inserted using the low as the starting point (level 0.000) and the high as the ending point
(level 1.000). The levels between 0.382 and 0.618 define the retracement channel. The
levels 0.250 and 0.750 define the confirmation levels. See Figure 4.5.
62
Figure 4.5.
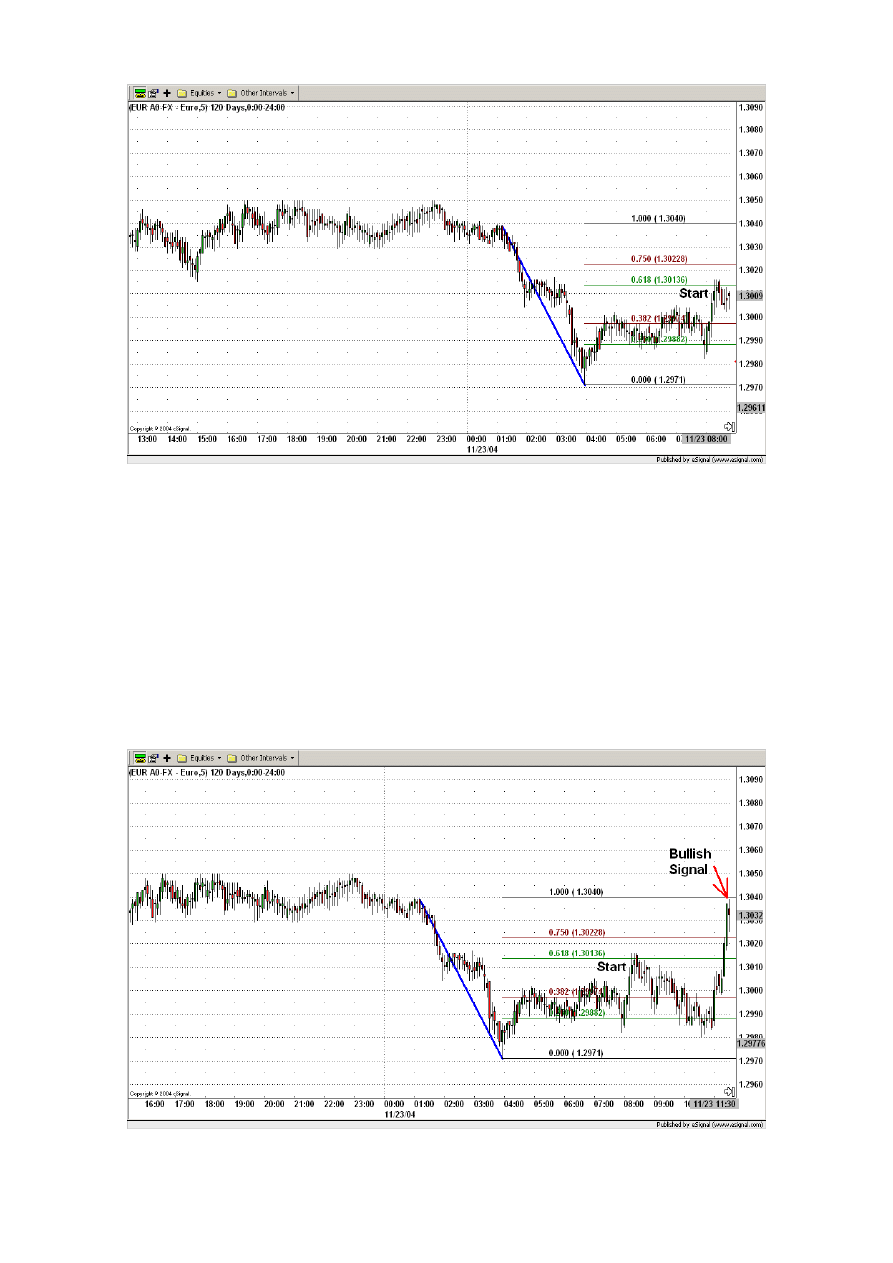
Ok, the Fibonacci levels are placed, now it’s about to see what the market is telling us
At 11:30 on the 11/23/04 the candlestick is above the upper confirmation level (Fibonacci
level 0.750). Since the active wave had a downward movement and the candlestick is
above the upper confirmation level we identify the active wave as a downward corrective
wave. As explained in the chapter 3. “Intraday ICWR Trading Rules” this is a bullish
signal. See Figure 4.6.
Figure 4.6.
63
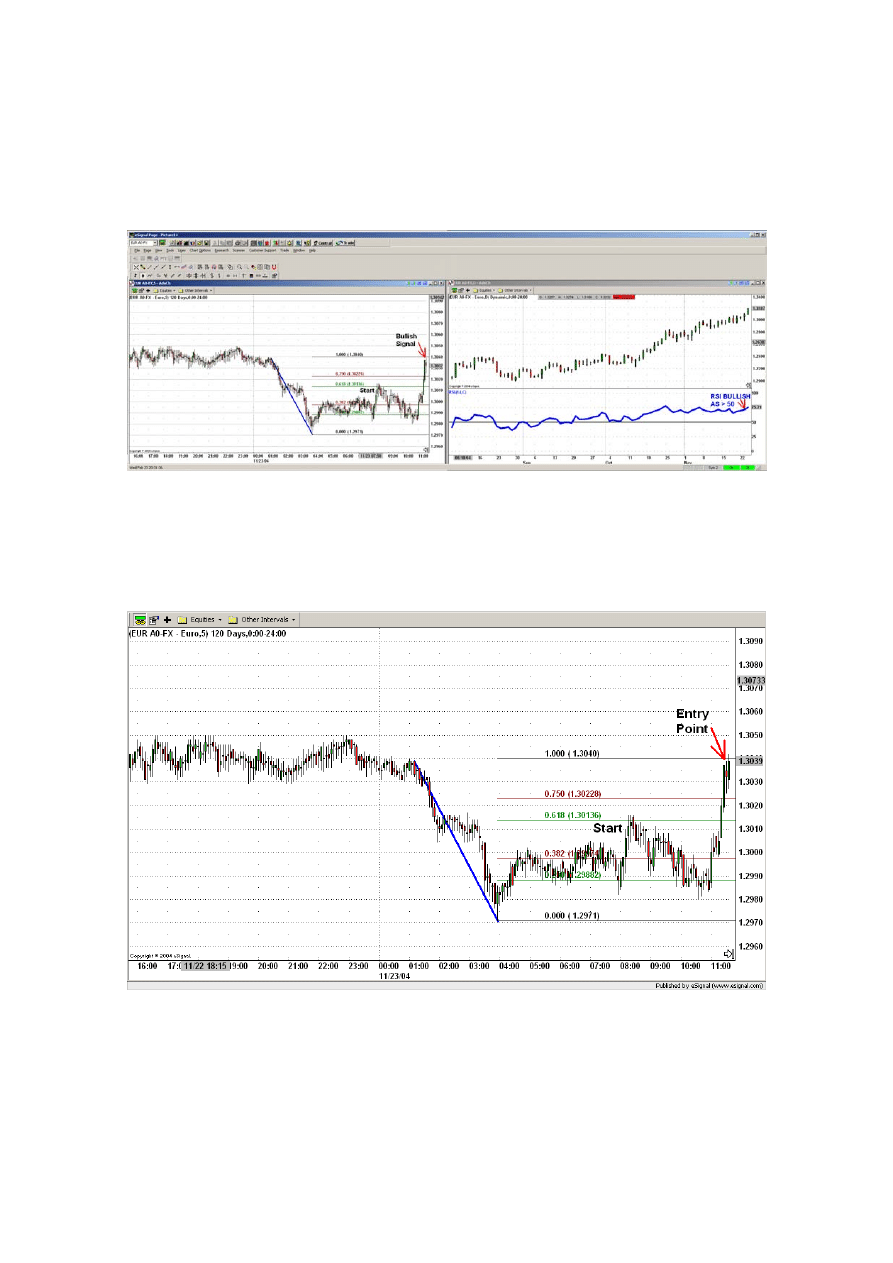
This bullish signal must be confirmed with the Relative Strength Index (RSI). If the RSI
is greater than 50, it’s bullish and we enter the market. If RSI is less than 50, it’s bearish,
so it’s opposite and we do not enter the market. Today as we told before the RSI (blue line
in Figure 4.7) is above the 50 centerline (black line) and therefore bullish.
Figure 4.7.
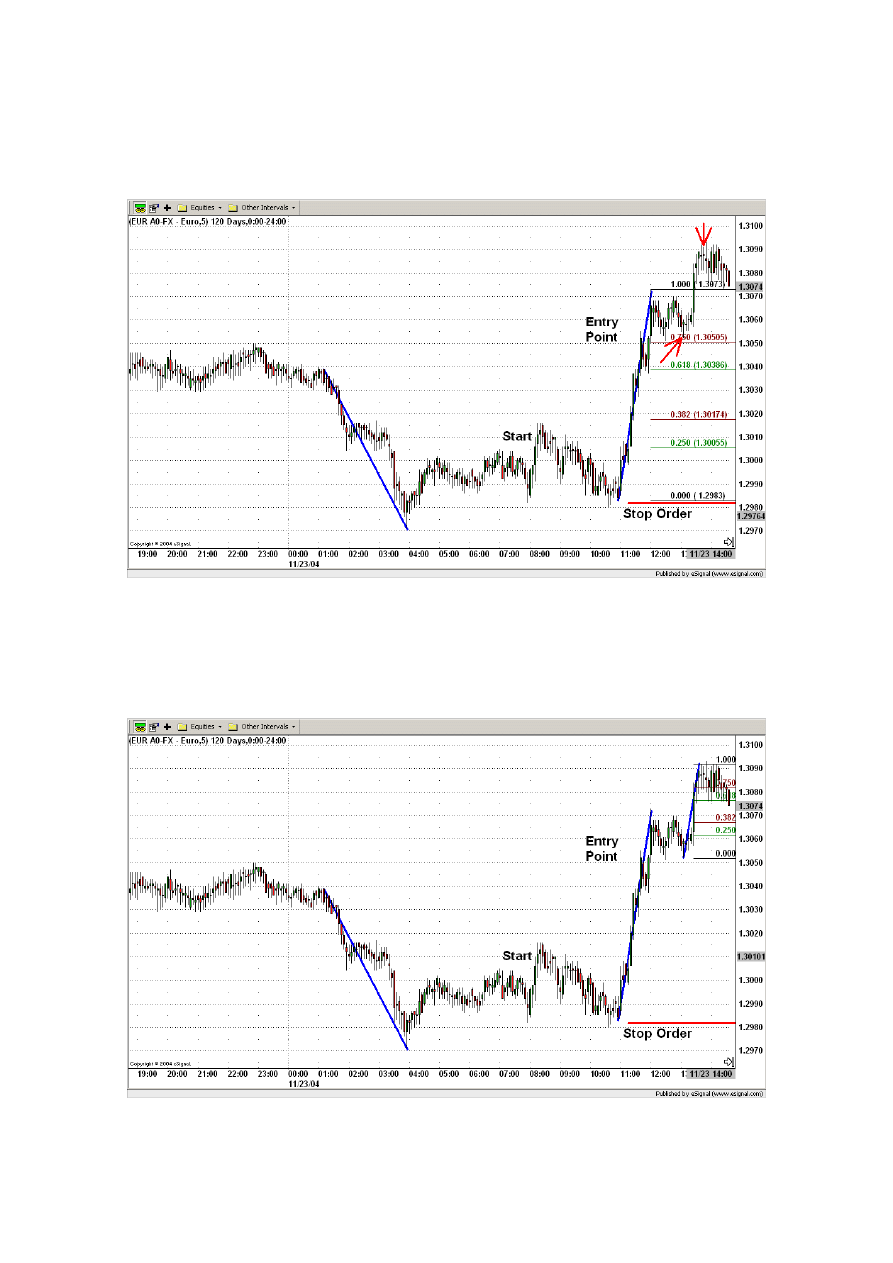
As both signals are bullish we enter the trade at 11:30 on the 11/23/04 at the price of
1.3032 (see Figure 4.8). For example we sell 10,000 USD for the price of 1.3032.
Figure 4.8.
Ok, now it’s about to find how far we will let the market move before we exit our
position.
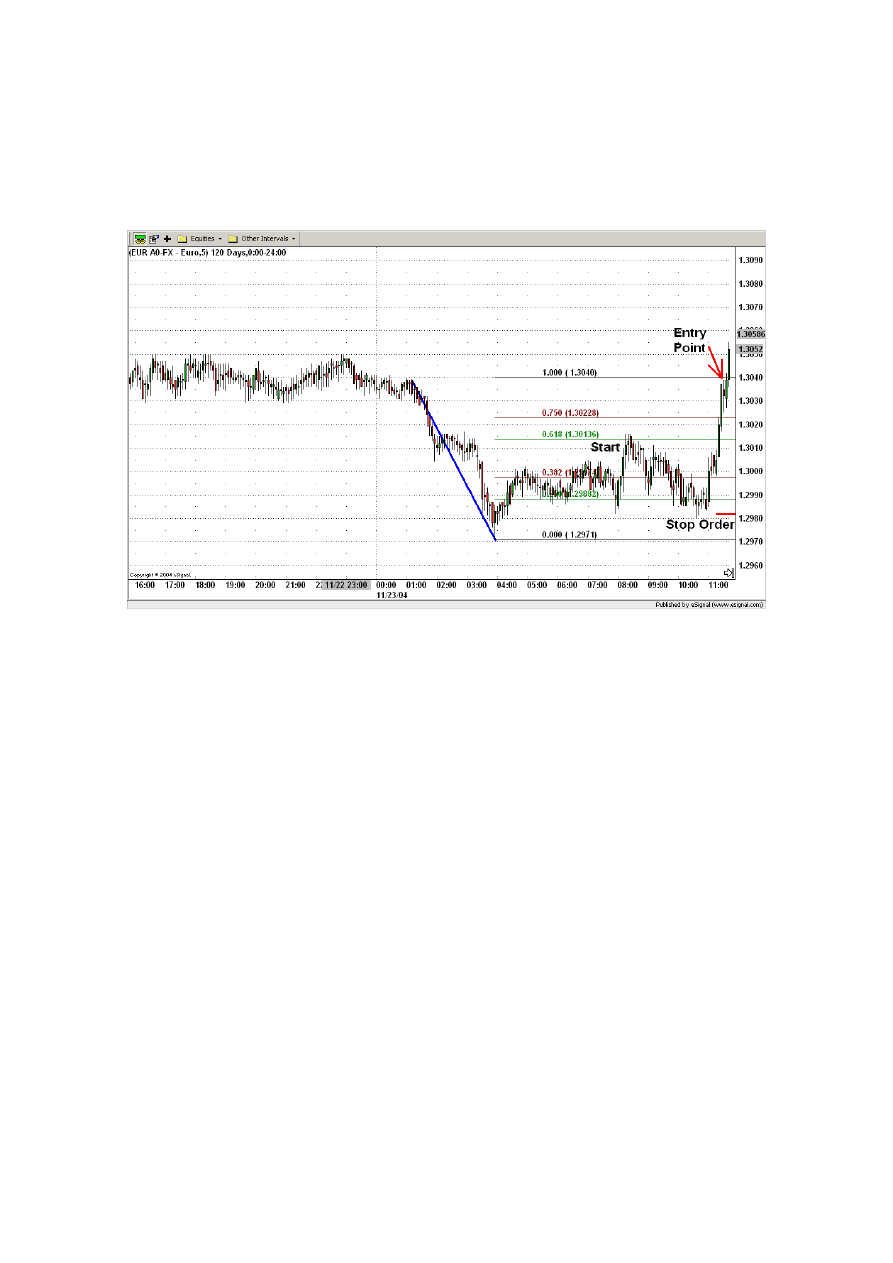
64
First of all we place a stop order 50 pips below the entry price. That means at 1.3032 -
0.0050 = 1.2982. It’s represented by the thick red horizontal line in the picture below
(Figure 4.9). Please notice, as said before, that the hard stop order is only for the sake of
security, because we do not want to loose more than 50 pips in one trade.
Figure 4.9.
In fact, our main exit strategy is to look for an opposite signal generated by an
impulsive/corrective wave retracement (in the same manner as for the entry warning
signal).
In this example we are looking for a bearish signal as we entered long the market. The
task is to look for a whole candlestick being below the lower confirmation level (after
having entered the retracement channel in the case of an impulsive wave). If this happens
we exit the position. Every time a new wave is recognized, new Fibonacci levels are
drawn and the old Fibonacci levels get inactive. This procedure is repeated until an exit
signal occurs.
Ok, let’s look to our opened position at 11:30. Between 11:30 and 13:00 no bearish signal
occurs. So, we don’t exit the trade.
Remember the bearish signal is in this example the exit signal.
65
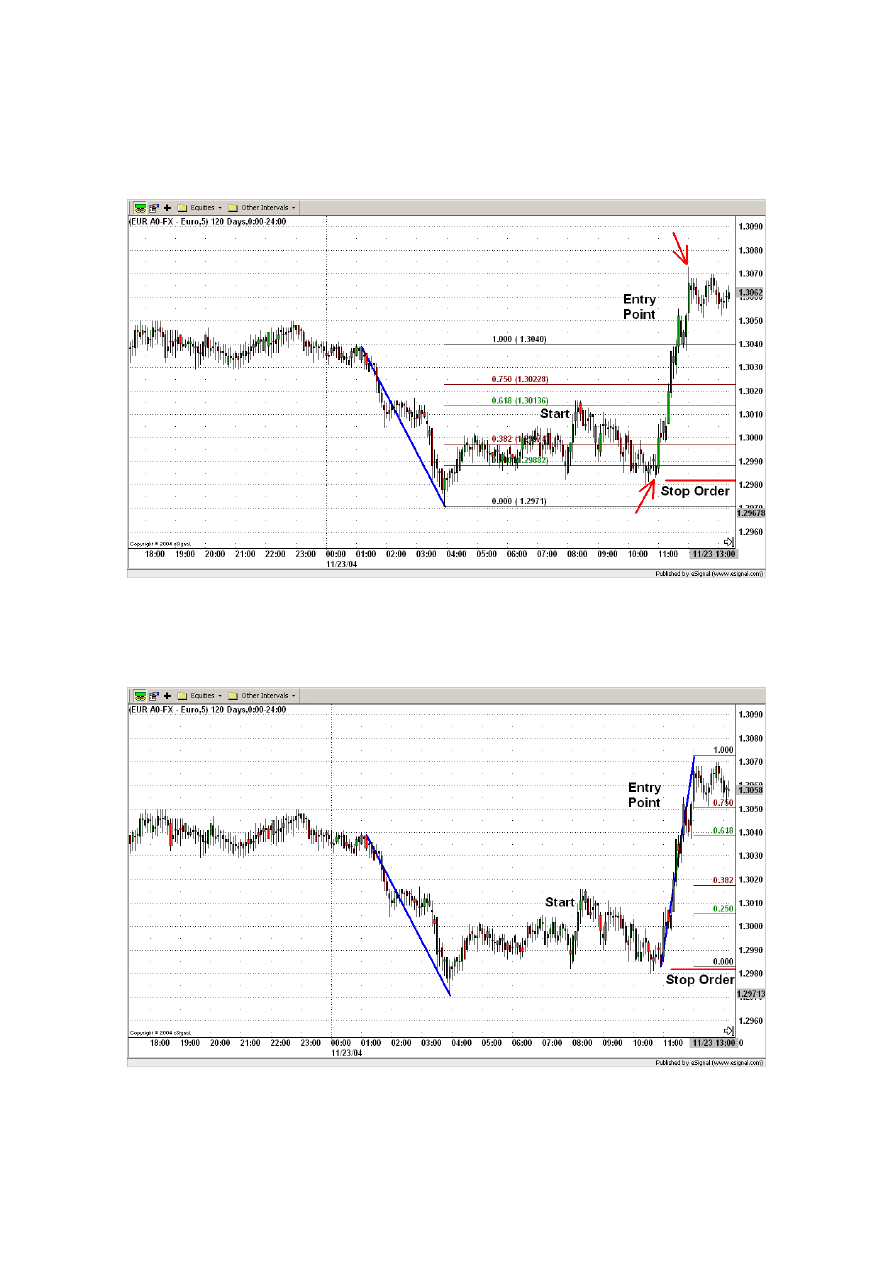
Around 13:00 we recognize a new active wave represented by the upward movement
starting at 10:55 and ending at 12:00 on the 11/23/04. The beginning and the end of the
new active wave are marked with red arrows in Figure 4.10.
Figure 4.10.
New Fibonacci levels are drawn . The old ones are now inactive (see Figure 4.11).
Figure 4.11.
66
For this active wave no exit signal occurs. Instead around 14:00 we recognize a new
active wave represented by the upward movement starting at 13:05 and ending at 13:40
on the 11/23/04. See Figure 4.12.
Figure 4.12.
New Fibonacci levels are drawn and the old ones removed (see Figure 4.13). Now we are
again looking for a candlestick going below the lower confirmation level.
Figure 4.13.
67
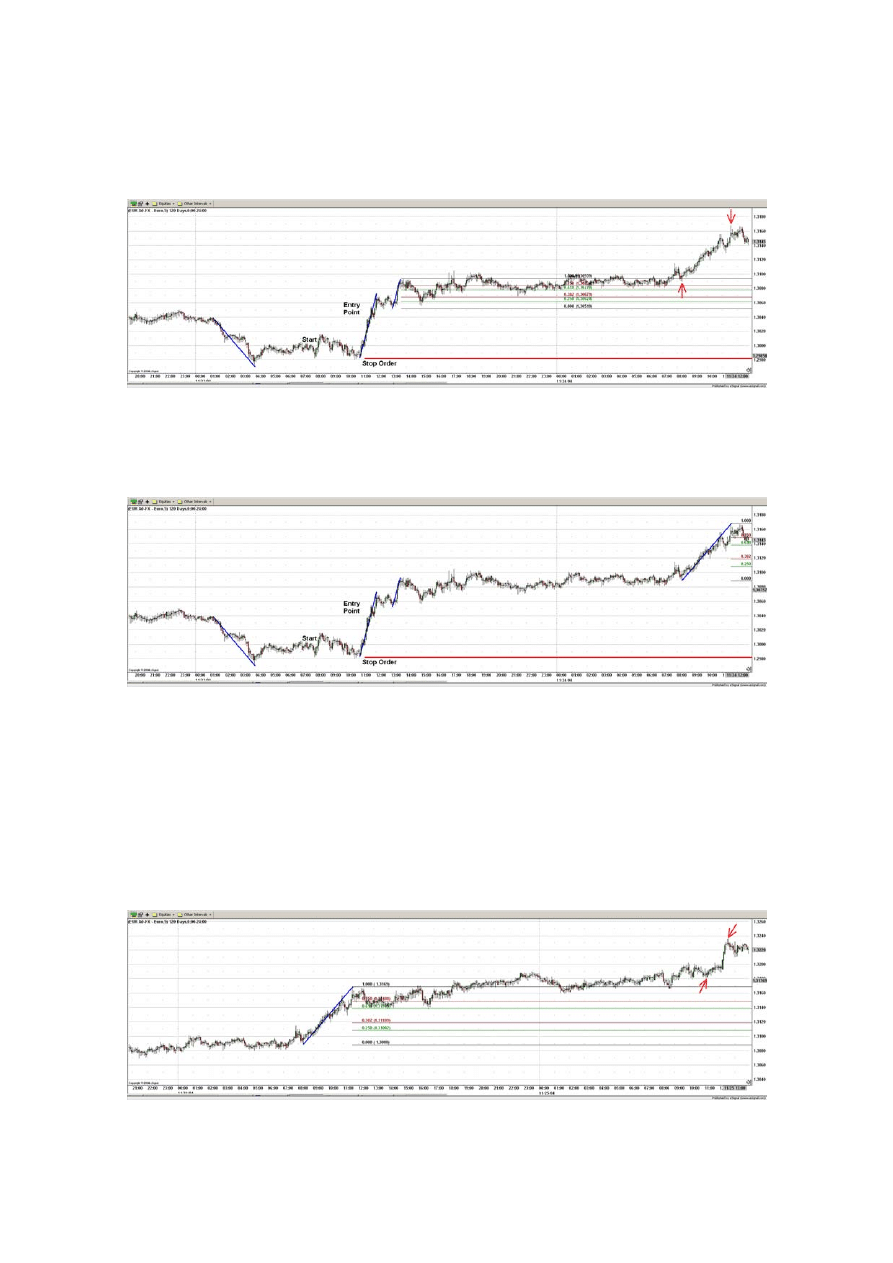
Once again around 12:00 on the 11/24/04 a new active has been recognized before an exit
signal occurs. The new active wave is represented by the upward movement starting at
08:20 and ending at 11:35 on the 11/24/04. See Figure 4.14.
Figure 4.14.
New Fibonacci levels are drawn and the old ones removed (see Figure 4.15).
Figure 4.15.
This happens now several times.
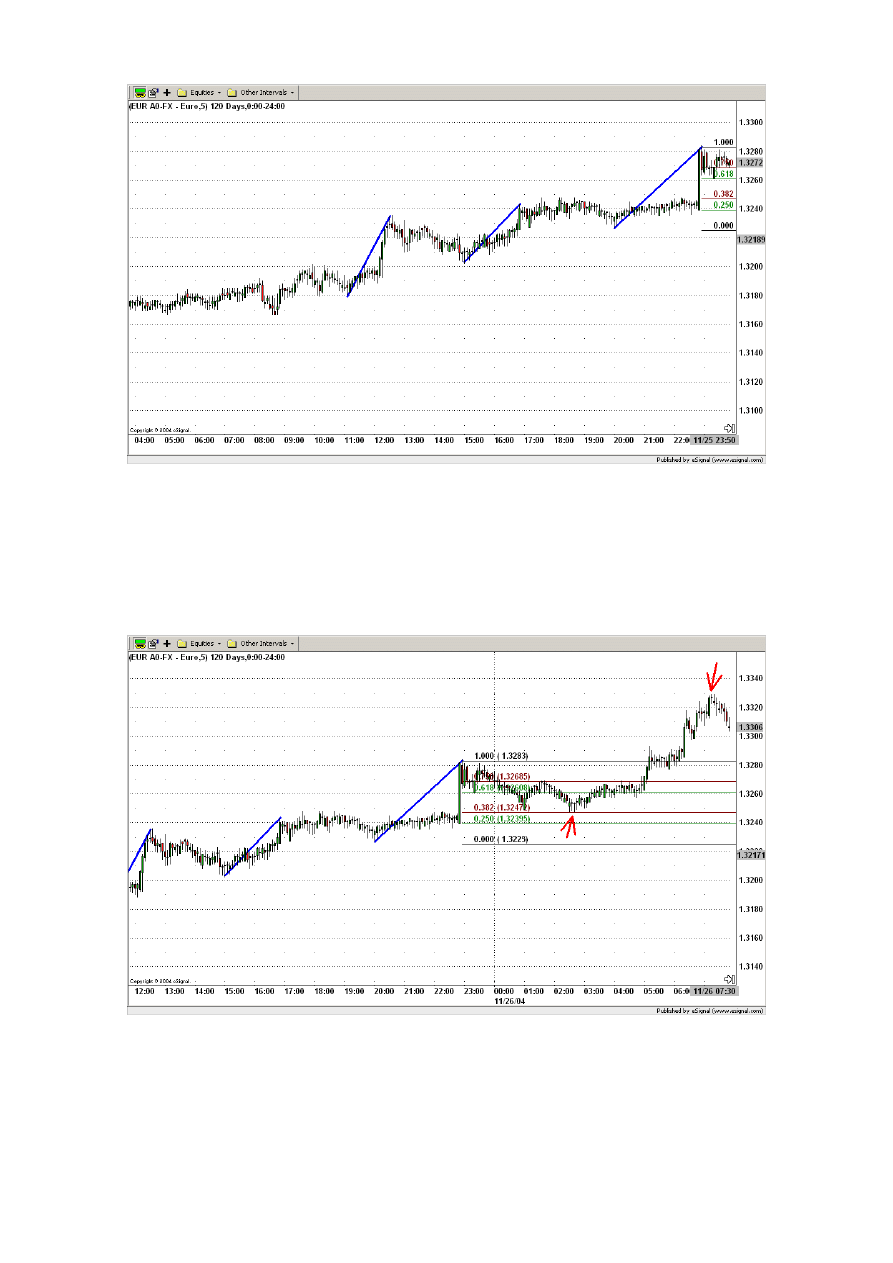
Around 13:00 on the day 11/25/04 a new active wave has been recognized before an exit
signal occurs. The new active wave is represented by the upward movement starting at
11:10 and ending at 12:35 on the 11/25/04. See Figure 4.16.
Figure 4.16.
68
New Fibonacci levels are drawn and the old ones removed (see Figure 4.17).
Figure 4.17.
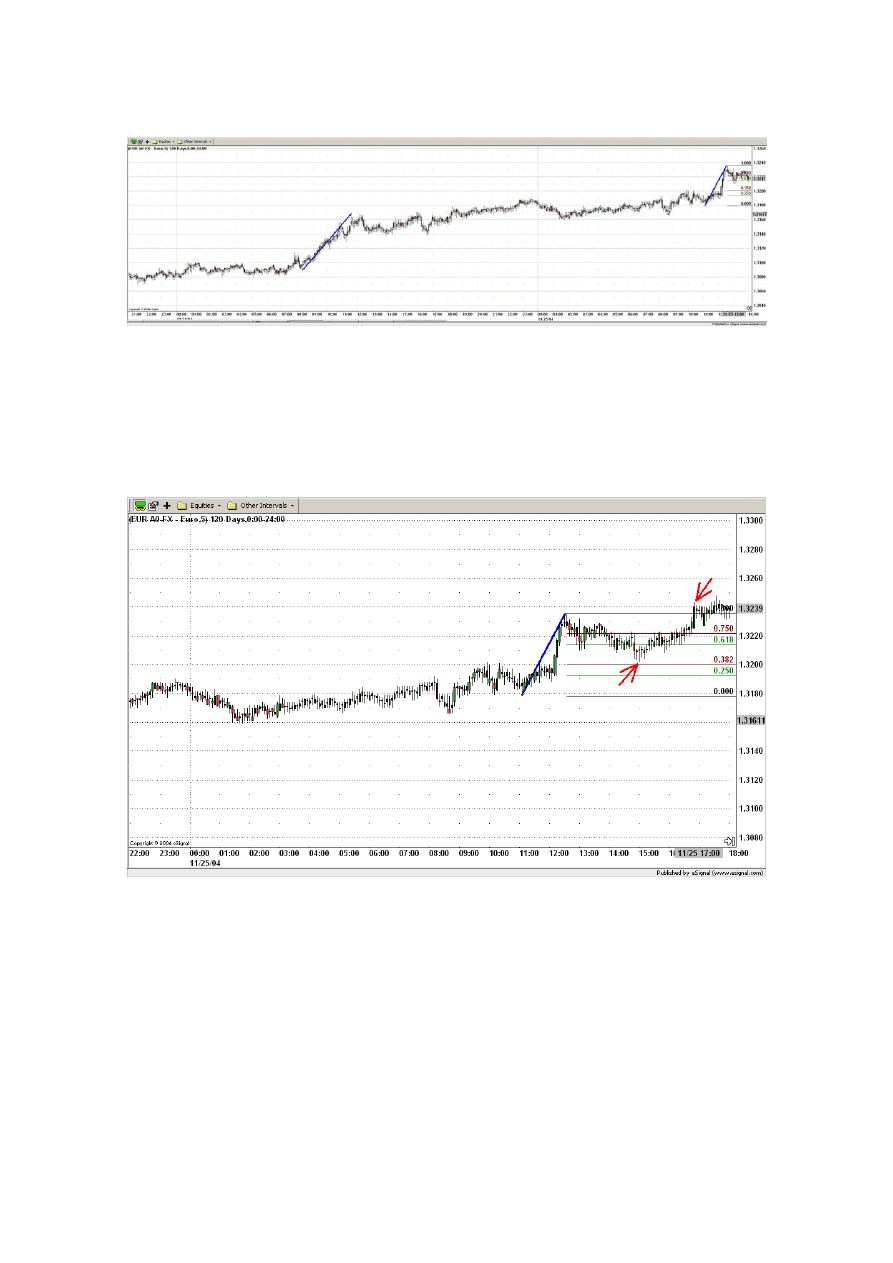
Again around 18:00 on the day 11/25/04 a new active wave has been recognized before
an exit signal occurs. The new active wave is represented by the upward movement
starting at 15:00 and ending at 16:50 on the 11/25/04. See Figure 4.18.
Figure 4.18.
New Fibonacci levels are drawn and old ones removed (see Figure 4.19).
69
Figure 4.19.
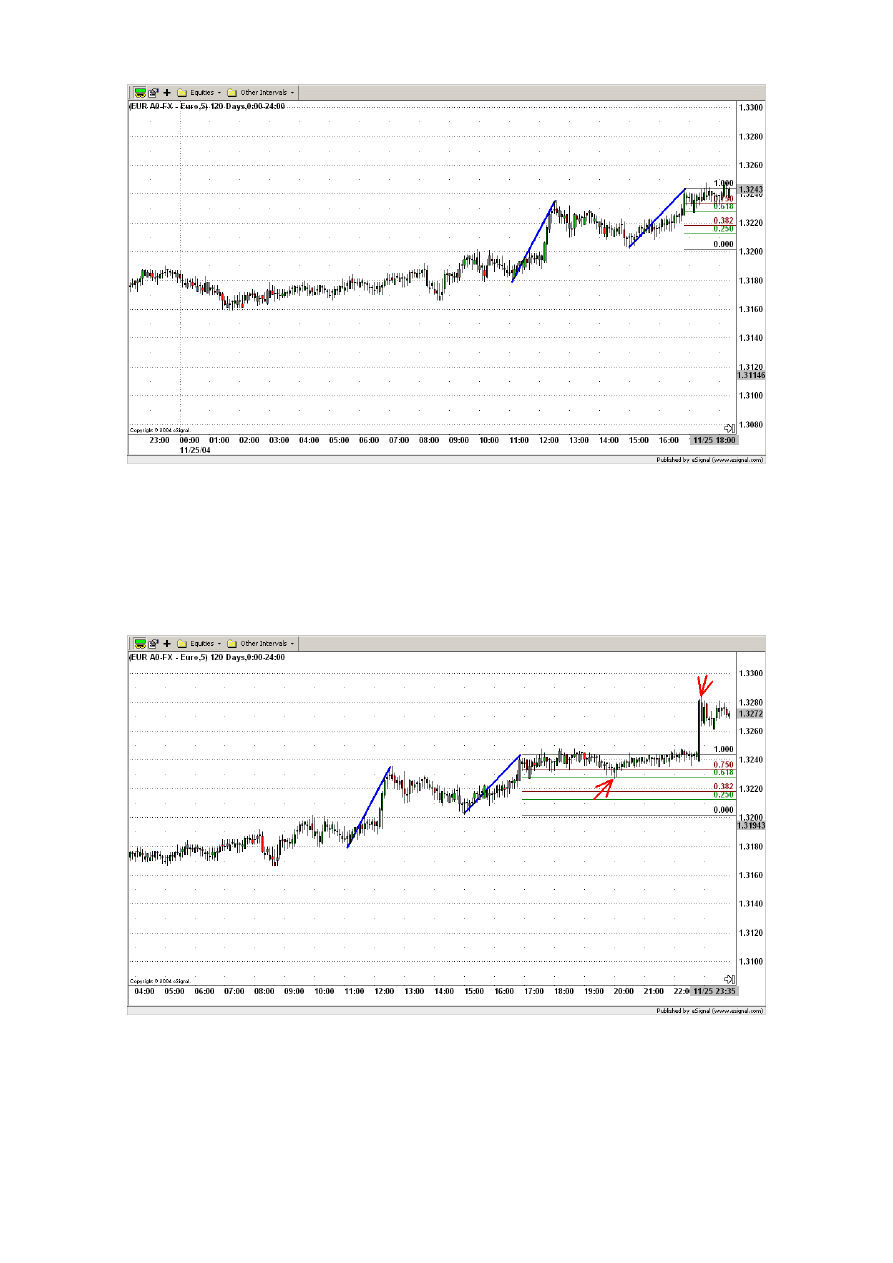
Once again around 00:00 on the day 11/26/04 a new wave has been recognized before an
exit signal occurs. The new active wave is represented by the upward movement starting
at 20:00 and ending at 22:55 on the 11/25/04. See Figure 4.20.
Figure 4.20.
New Fibonacci levels are drawn and old ones removed (see Figure 4.21).
70
Figure 4.21.
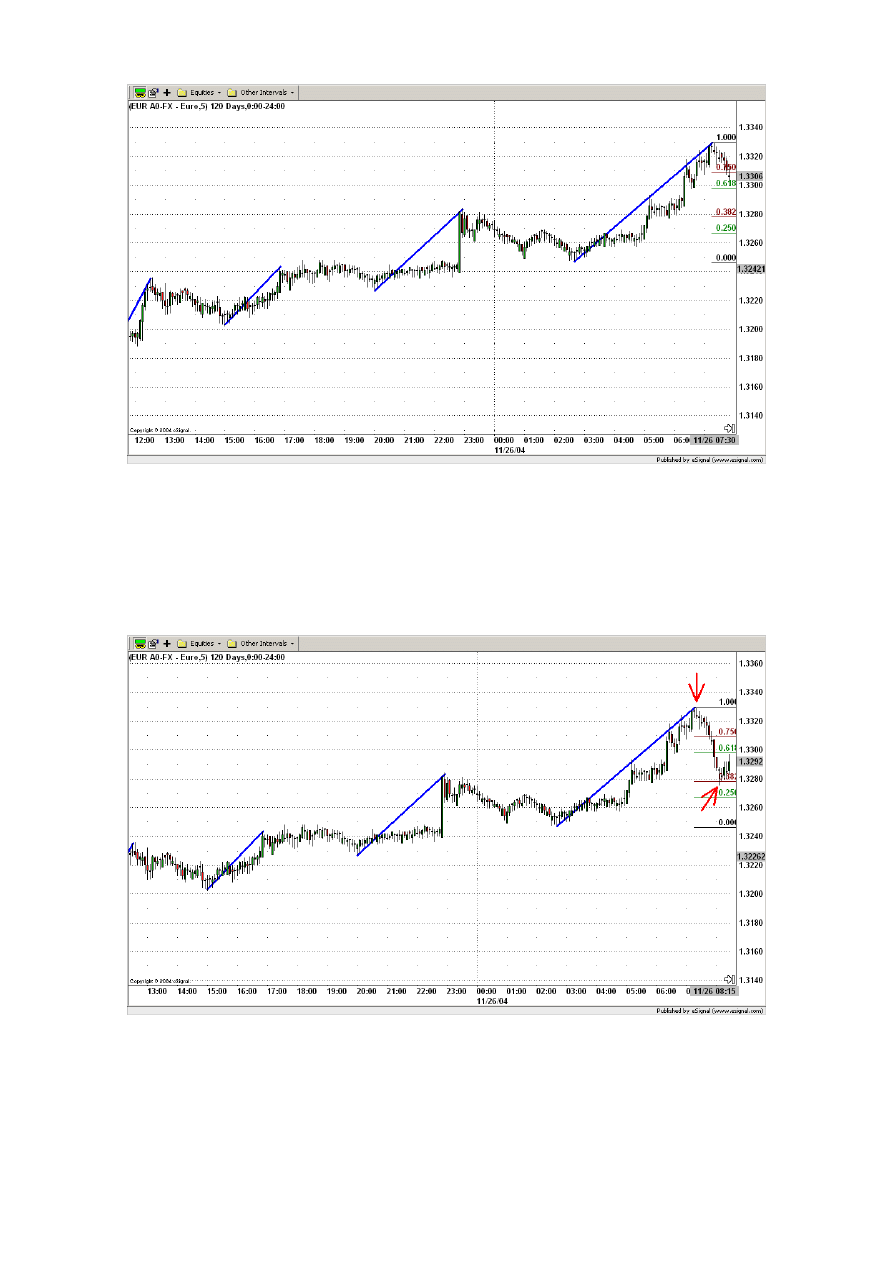
Again around 07:30 on the day 11/26/04 a new wave has been recognized before an exit
signal occurs. The new active wave is represented by the upward movement starting at
02:40 and ending at 07:15 on the 11/26/04. See Figure 4.22.
Figure 4.22.
New Fibonacci levels are drawn and the old ones removed (see Figure 4.23).
71
Figure 4.23.
Again around 08:15 on the day 11/26/04 a new wave has been recognized before an exit
signal occurs. The new active wave is represented by the upward movement starting at
07:20 and ending at 08:05 on the 11/26/04. See Figure 4.24.
Figure 4.24.
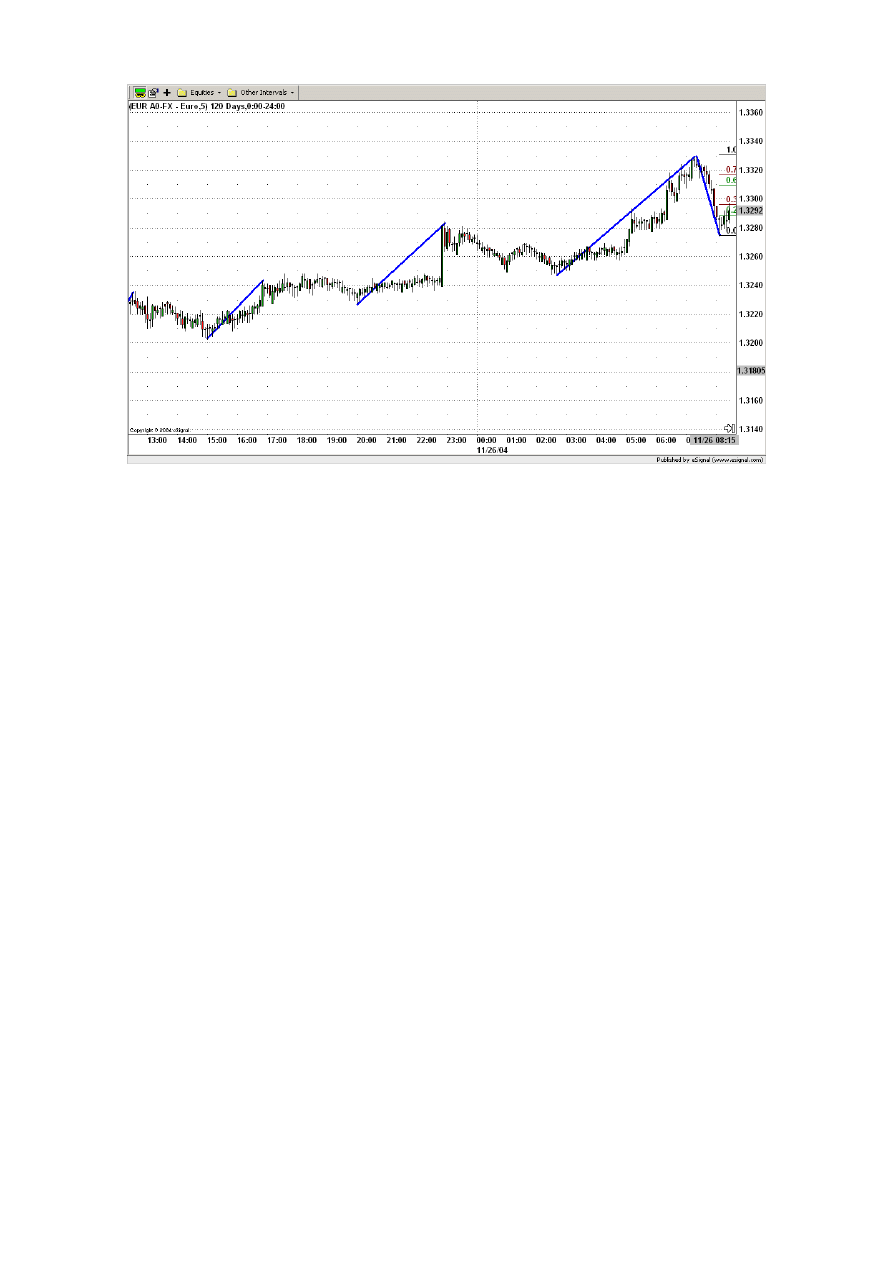
New Fibonacci levels are drawn and the old ones removed (see Figure 4.25).
72
Figure 4.25.
Around 08:30 the market trend starts to reverse (see Figure 4.26.). At 09:00 on the
11/26/04 the candlestick is below the lower confirmation level (Fibonacci level 0.250).
Since the active wave had a downward movement and the candlestick is below the lower
confirmation level we identify the active wave as a downward impulsive wave. As
explained in the chapter 3. “Intraday ICWR Trading Rules” this is a bearish signal.
Please, notice that for the recognition of an impulsive wave it’s important that the
retracement channel is crossed. This occurred at 08:30 as the closing price was then inside
of the retracement channel.
73
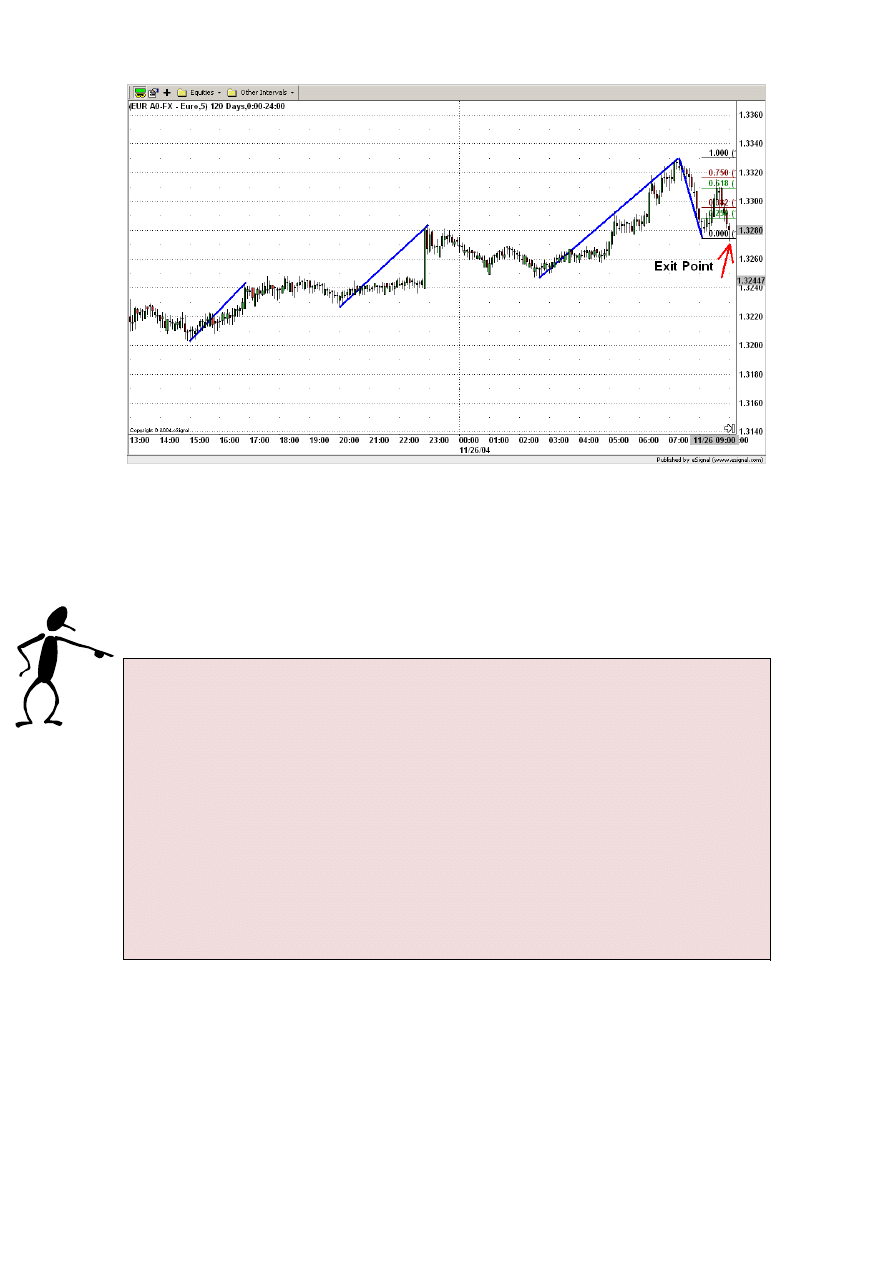
Figure 4.26.
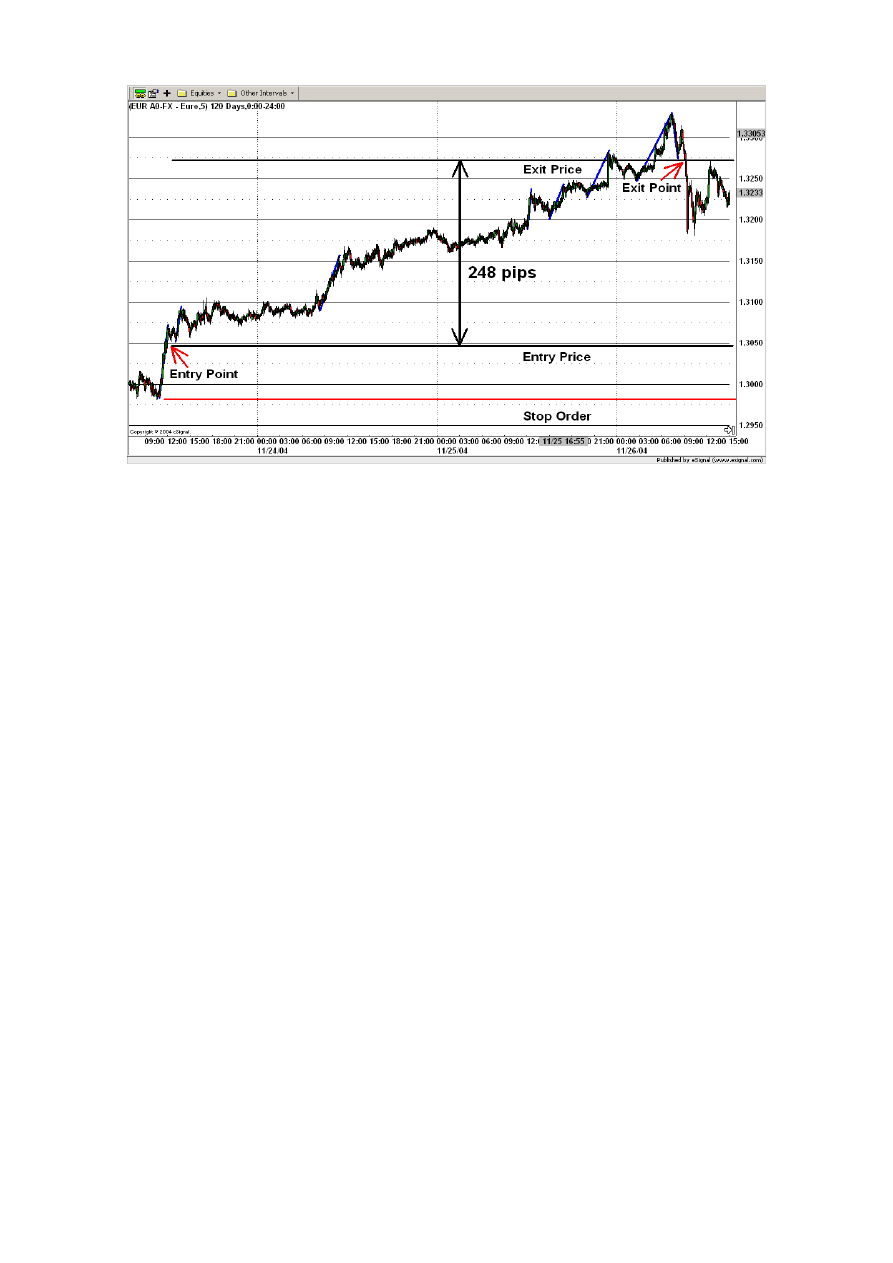
Because of the bearish signal the position is exited at 09:00 on the11/26/04 buying 10,000
USD for the price of 1.3280.
At the end using the Intraday ICWR Trading Rules a profit of
248 pips= (1.3280 – 1.3032) = 0.0248
was achieved (see Figure 4.27).
Using a 1:20 leverage this means
10,000 USD x (0.0248 pips) x 20 leverage = 4,960 USD!
A profit of 4,960 USD for three trading days using the Intraday ICWR Trading
Rules!
74
Figure 4.27.
75
Chapter 5
Intraday CAD /USD
Trading Example
In this example we are going to trade CAD/USD.
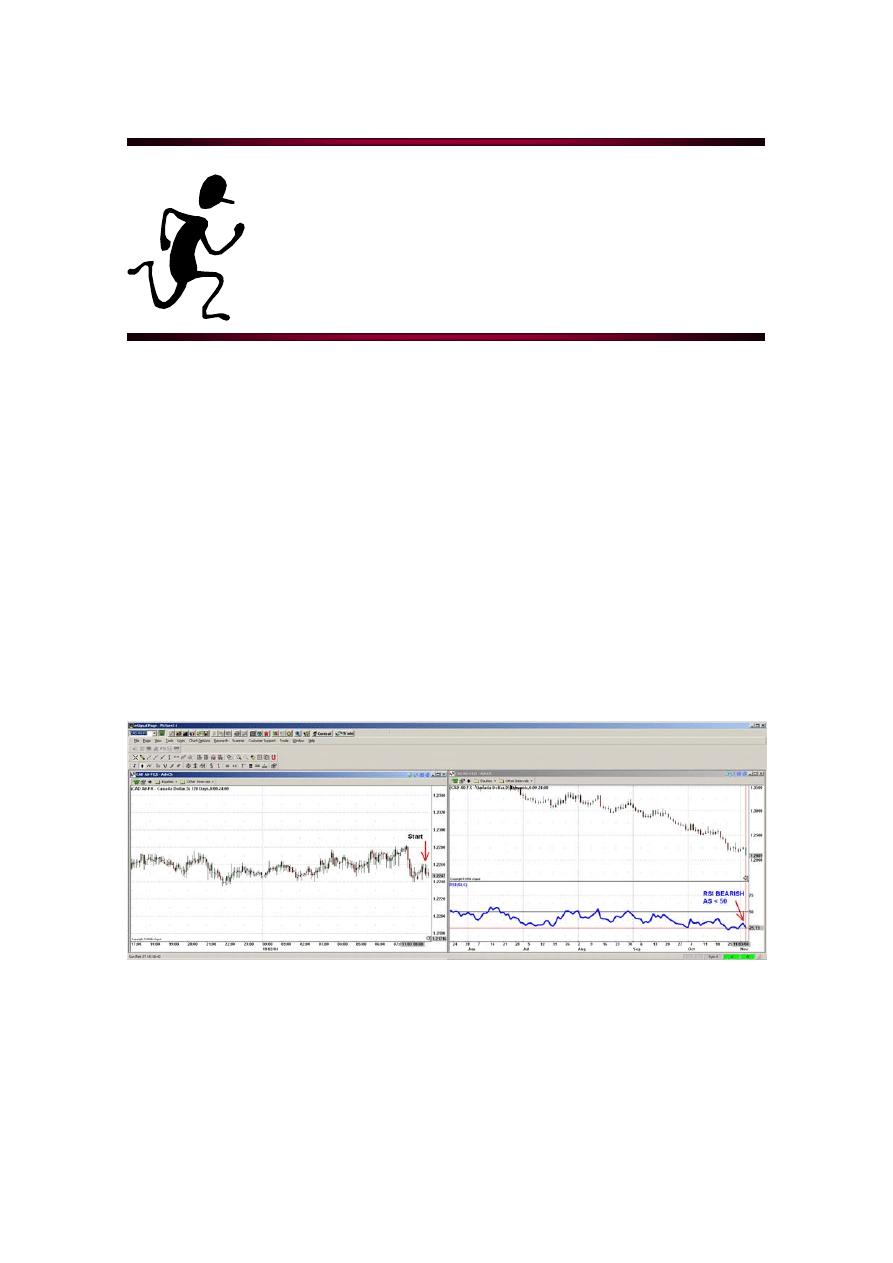
Ok, before we start our trading day we need to set up our screens (see Figure 5.1). On the
left screen we are going to place a five minutes candlestick chart and on the right screen a
one day candlestick chart together with the 14-period RSI (thick blue line). The charting
software usually pictures the RSI automatically together with the 30 and 70 lines (below
30 represents oversold, above 70 overbought). In our case we are not looking for oversold
or overbought signals. We are looking for the market being bullish or bearish. This is
represented by RSI being above 50 (bullish) or below 50 (bearish). So we only need to
draw the 50 centerline (black line).
Figure 5.1.
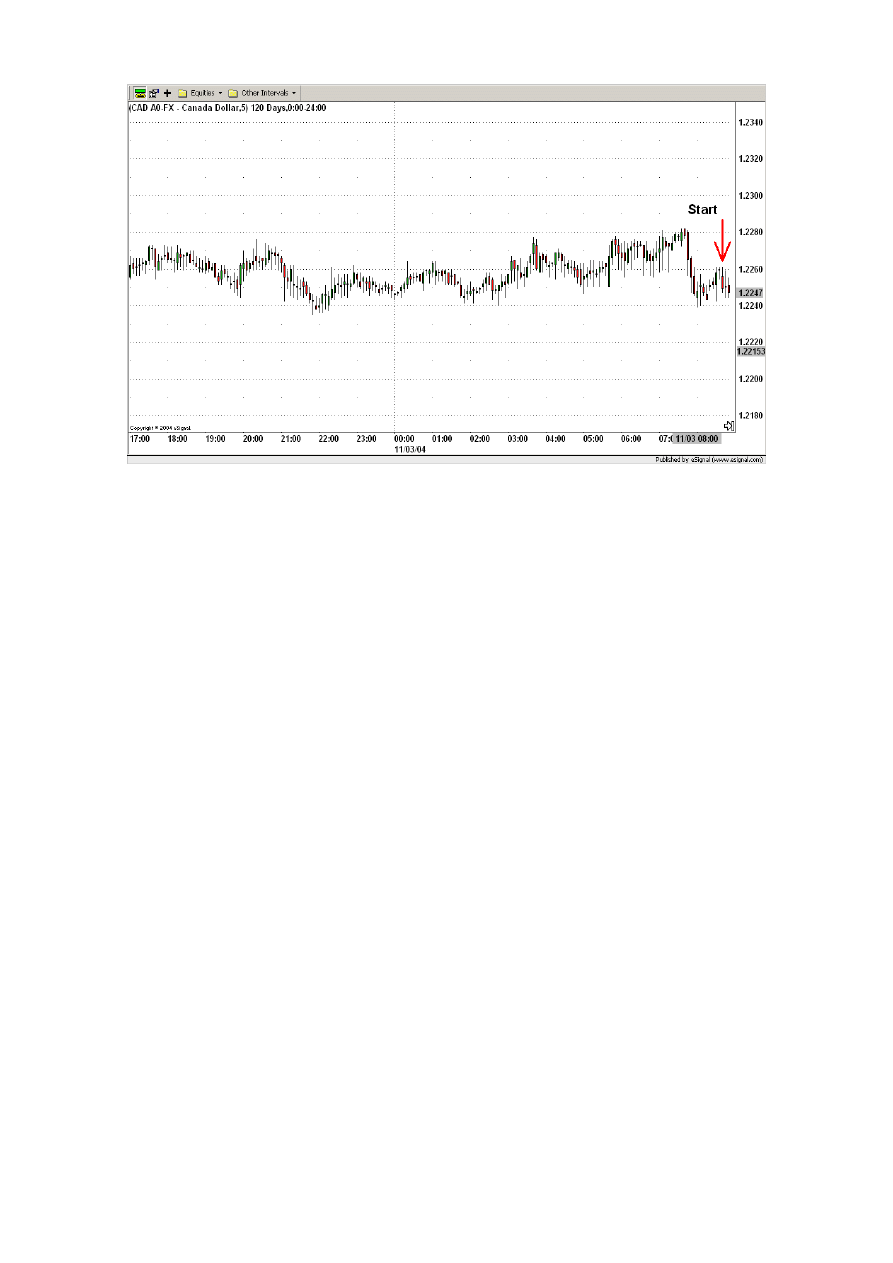
Now we are ready to start. Suppose you started your trading day on the 11/03/04 at 08:00.
At that time the price was 1.2247. As you can see from the right screen the RSI is below
50 and therefore bearish. So today we are looking only for a bearish signal for entering
short the market.
76
Figure 5.2.
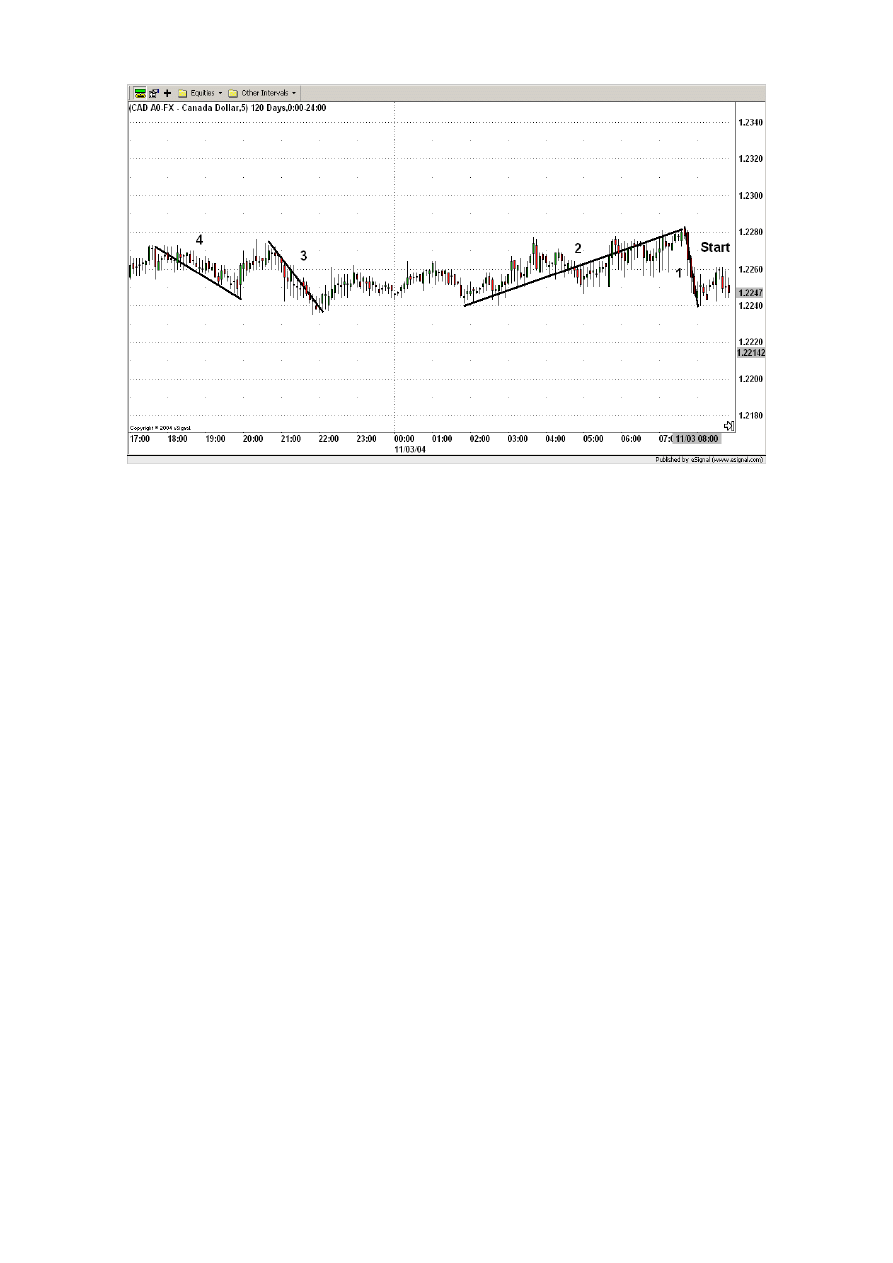
Next thing to do is to recognize the active wave. For that, we are going to look for the
nearest market movement to our starting position with a height greater than 40 pips.
Ok, in order to find the active wave the following steps are to be done:
First all possible waves (black lines) are drawn connecting the high value of the starting
point with the low value of the ending point and then the waves are enumerated starting
with the nearest wave to the actual time (see Figure 5.3).
77
Figure 5.3.
Second read the extreme values of each wave and calculate its height.
Wave 1:
High = 1.2282; Low = 1.2239;
Height = High – Low = 1.2282– 1.2239= 0.0043 = 43 pips
Wave 2:
High = 1.2282; Low = 1.2241;
Height = High – Low = 1.2282– 1.2241= 0.0041 = 41 pips
Wave 3:
High = 1.2273; Low = 1.2236;
Height = High – Low = 1.2273– 1.2236= 0.0037 = 37 pips
Wave 4:
High = 1.2271; Low = 1.2244;
Height = High – Low = 1.2271– 1.2244= 0.0027 = 27 pips
The nearest movement to our starting position with a height greater than 40 pips is the
wave 1. So that’s our active wave now. Throughout our trading we are not going to pay
attention to movements with a height below 40 pips.
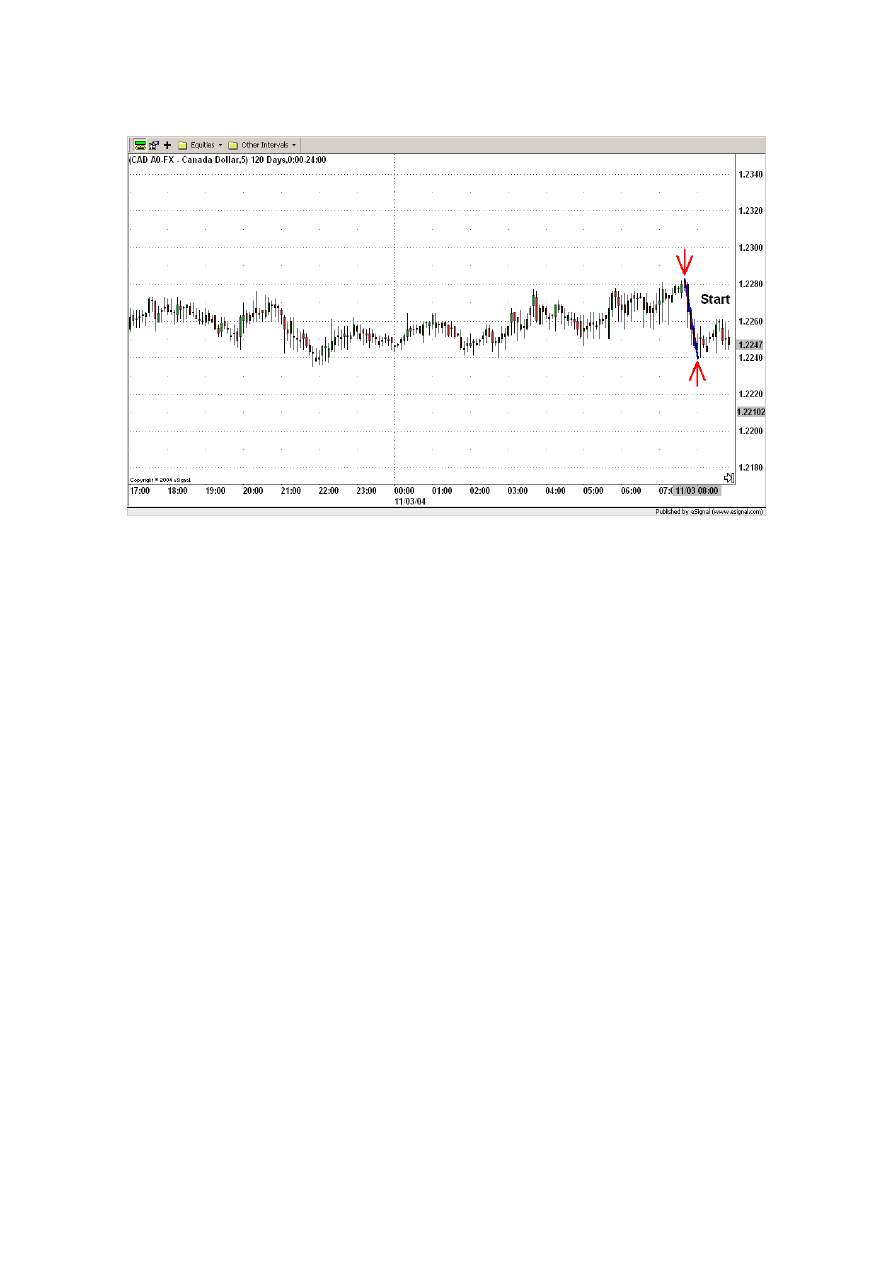
78
The wave 1 is now our current active wave (see blue line in Figure 5.4).
Figure 5.4.
The task is now to apply the Intraday ICWR Trading Rules.
That means, first the Fibonacci levels 0.000, 0.250, 0.382, 0.682, 0.750 and 1.000 are
inserted using the low as the starting point (level 0.000) and the high as the ending point
(level 1.000). The levels between 0.382 and 0.618 define the retracement channel. The
levels 0.250 and 0.750 define the confirmation levels. See Figure 5.5.
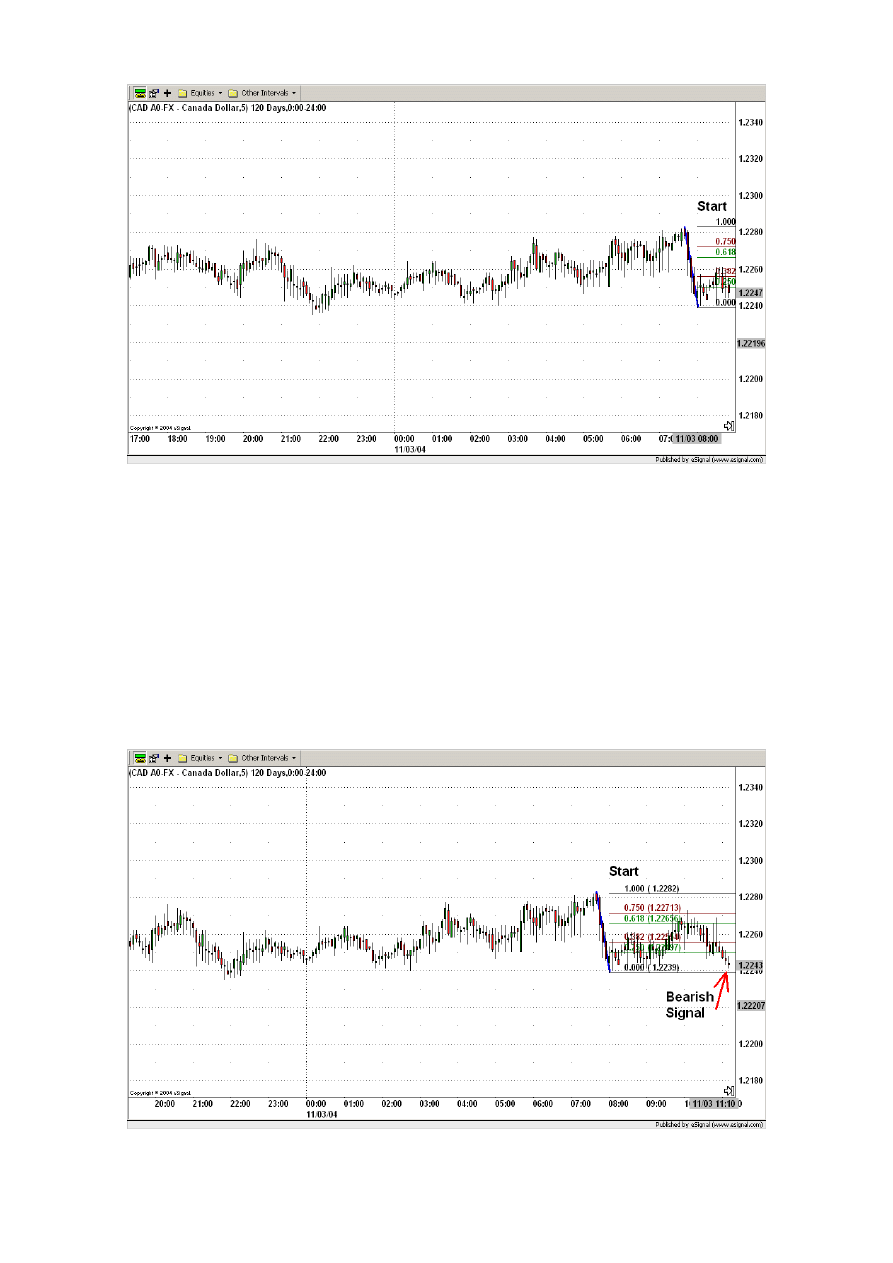
79
Figure 5.5.
Ok, the Fibonacci levels are placed, now it’s about to see what the market is telling us
At 11:10 on the 11/03/04 the candlestick is below the lower confirmation level (Fibonacci
level 0.250). Before, the retracement channel was entered at 08:30. Since the active wave
had a downward movement and the candlestick is below the lower confirmation level we
identify the active wave as a downward impulsive wave. As explained in the chapter 3
“Intraday ICWR Trading Rules” this is a bearish signal. See Figure 5.6.
Figure 5.6.
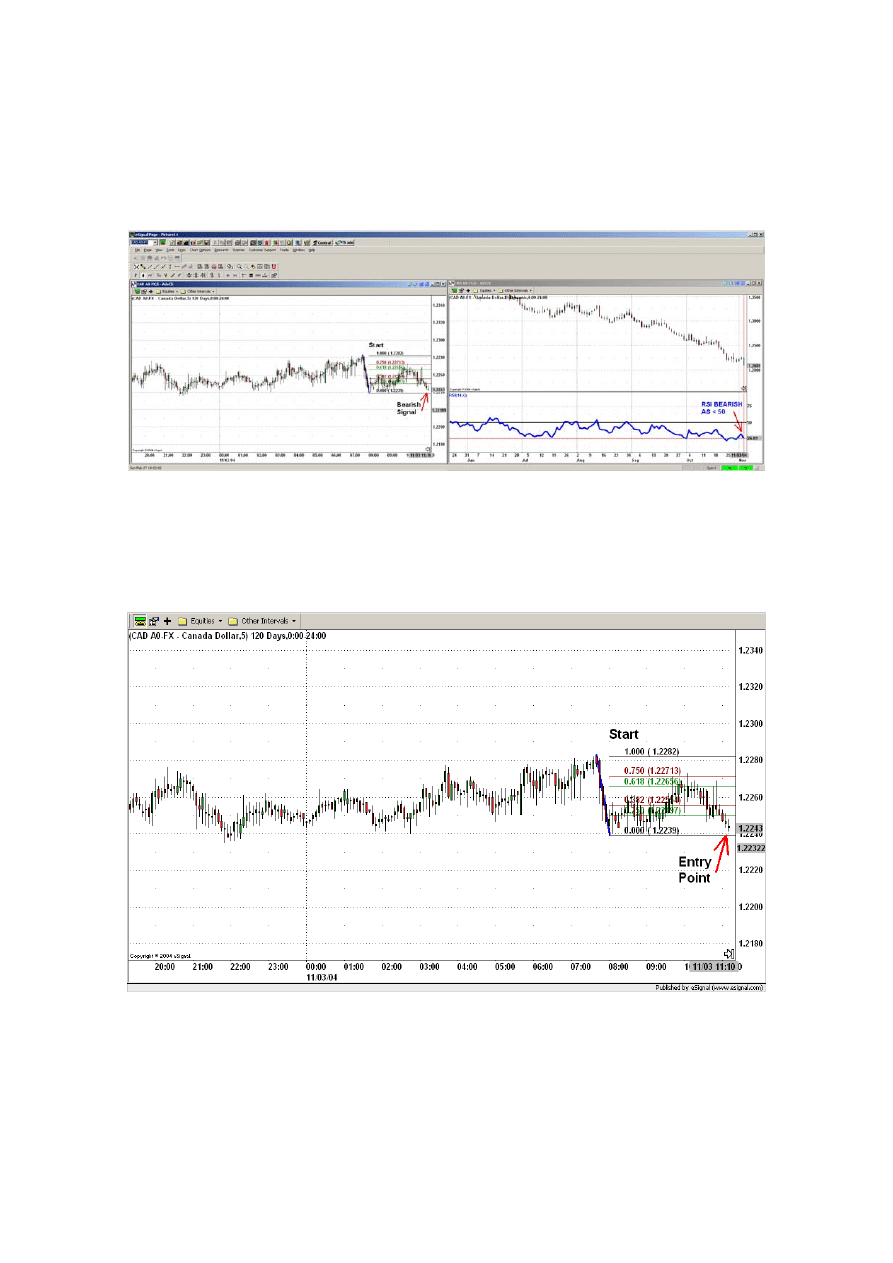
80
This bearish signal must be confirmed with the Relative Strength Index. If the RSI is
greater than 50, it’s bearish and we enter the market. If RSI is greater than 50, it’s bullish,
so it’s opposite and we do not enter the market. Today as we told before the RSI (blue line
in Figure 5.7) is below the 50 centerline (black line) and therefore bearish.
Figure 5.7.
As both signals are bearish we enter the trade at 11:10 on the 11/03/04 at the price of
1.2243. For example we buy 10,000 USD for the price of 1.2243. See Figure 5.8.
Figure 5.8.
Ok, now it’s about to find how far we will let the market move before we exit our
position.
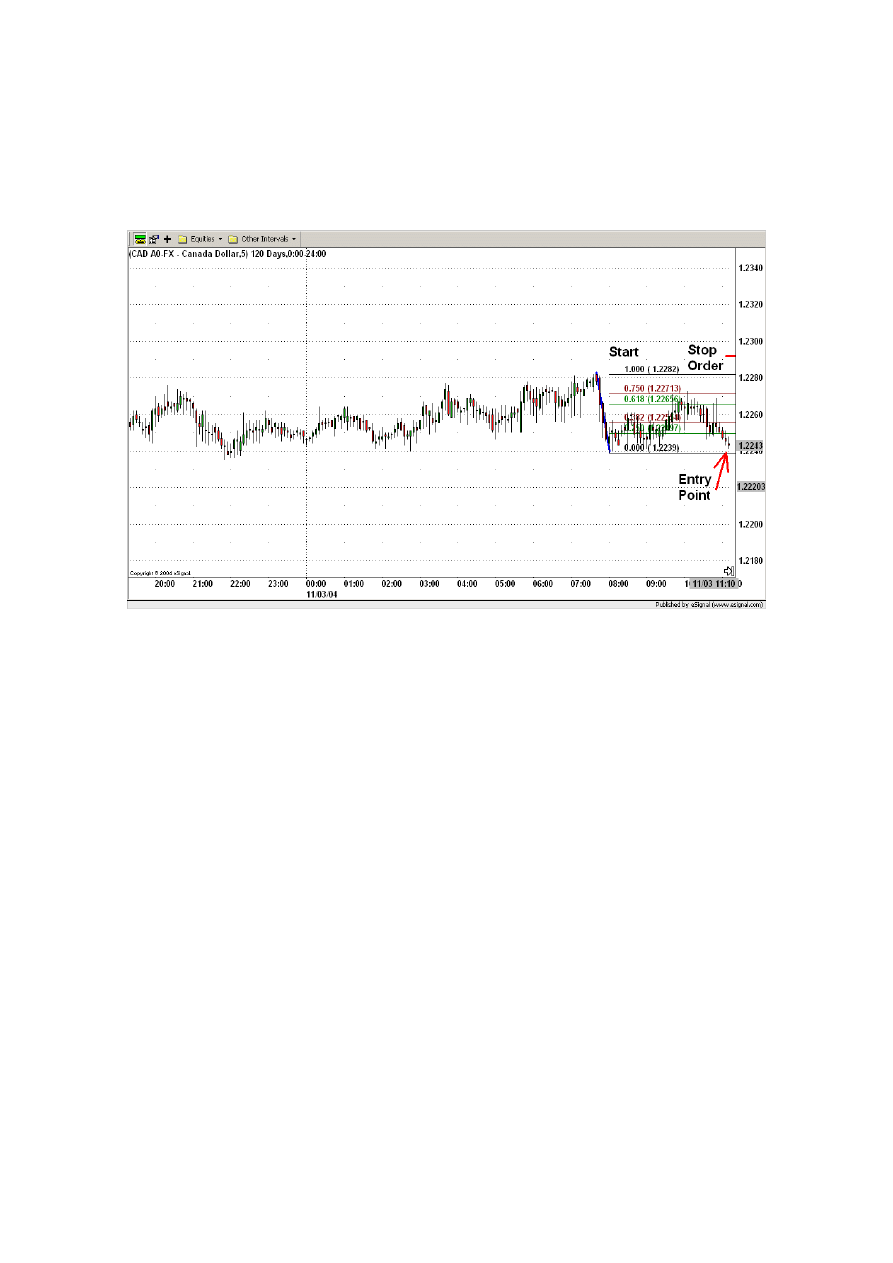
81
First of all we place a stop order 50 pips below the entry price. That means at 1.2243 +
0.0050 = 1.2293. It’s represented by the thick red horizontal line in the picture below
(Figure 5.9). Please notice, as said before, that the hard stop order is only for the sake of
security, because we do not want to loose more than 50 pips in one trade.
Figure 5.9.
In fact, our main exit strategy is to look for an opposite signal generated by an
impulsive/corrective wave retracement (in the same manner as for the entry warning
signal).
In this example we are looking for a bullish signal as we entered short the market. The
task is to look for a whole candlestick being above the upper confirmation level (after
having entered the retracement channel in the case of an impulsive wave). If this happens
we exit the position. Every time a new wave is recognized, new Fibonacci levels are
drawn and the old Fibonacci levels get inactive. This procedure is repeated until an exit
signal occurs.
Ok, let’s look to our opened position at 11:10. Between 11:10 and 12:00 no bearish signal
occurs. So, we don’t exit the trade.
Remember the bullish signal is in this example the exit signal!
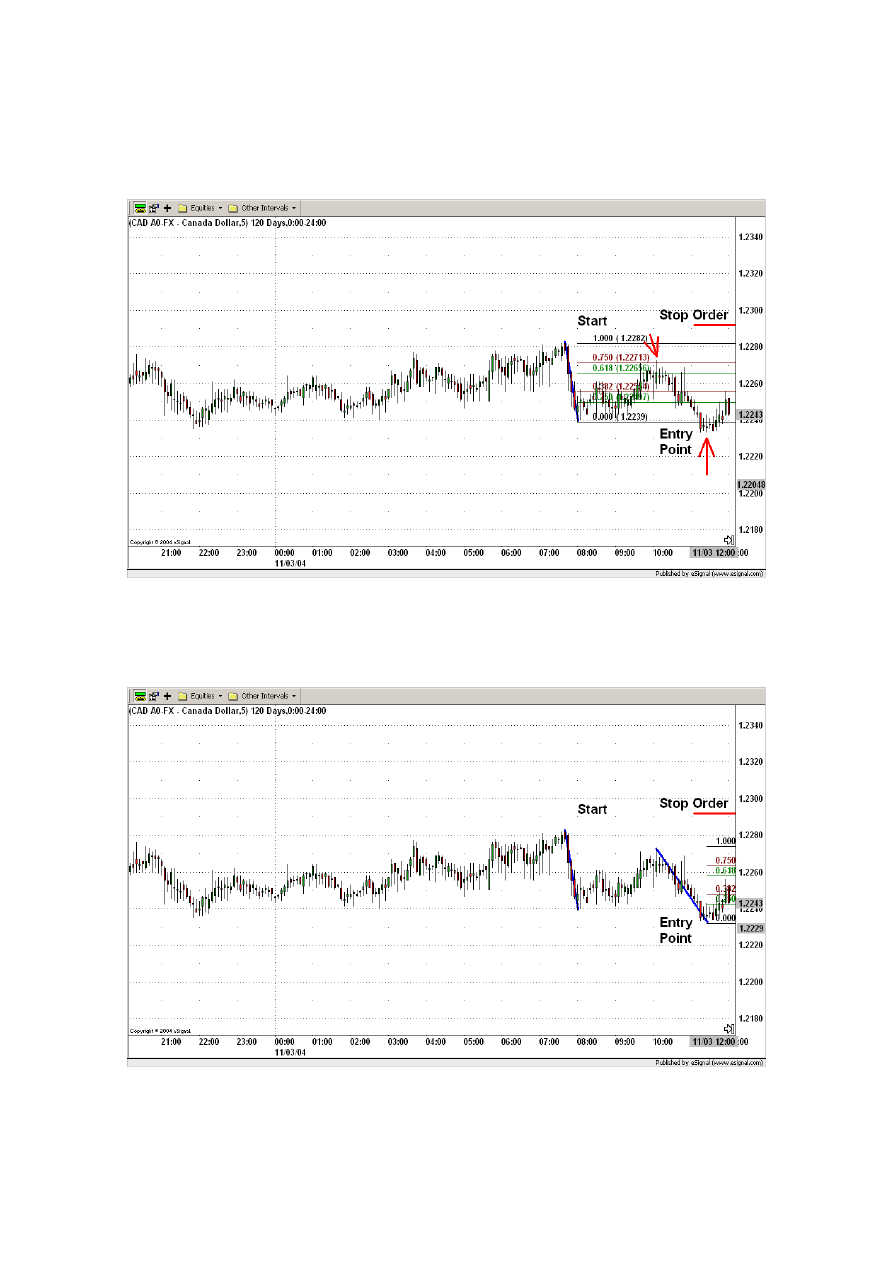
82
Around 12:00 we recognize a new active wave represented by the downward movement
starting at 10:05 and ending at 11:25 on the 11/03/04. The beginning and the end of the
new active wave are marked with red arrows in Figure 5.10.
Figure 5.10.
New Fibonacci levels are drawn. The old ones are now inactive (see Figure 5.11).
Figure 5.11.
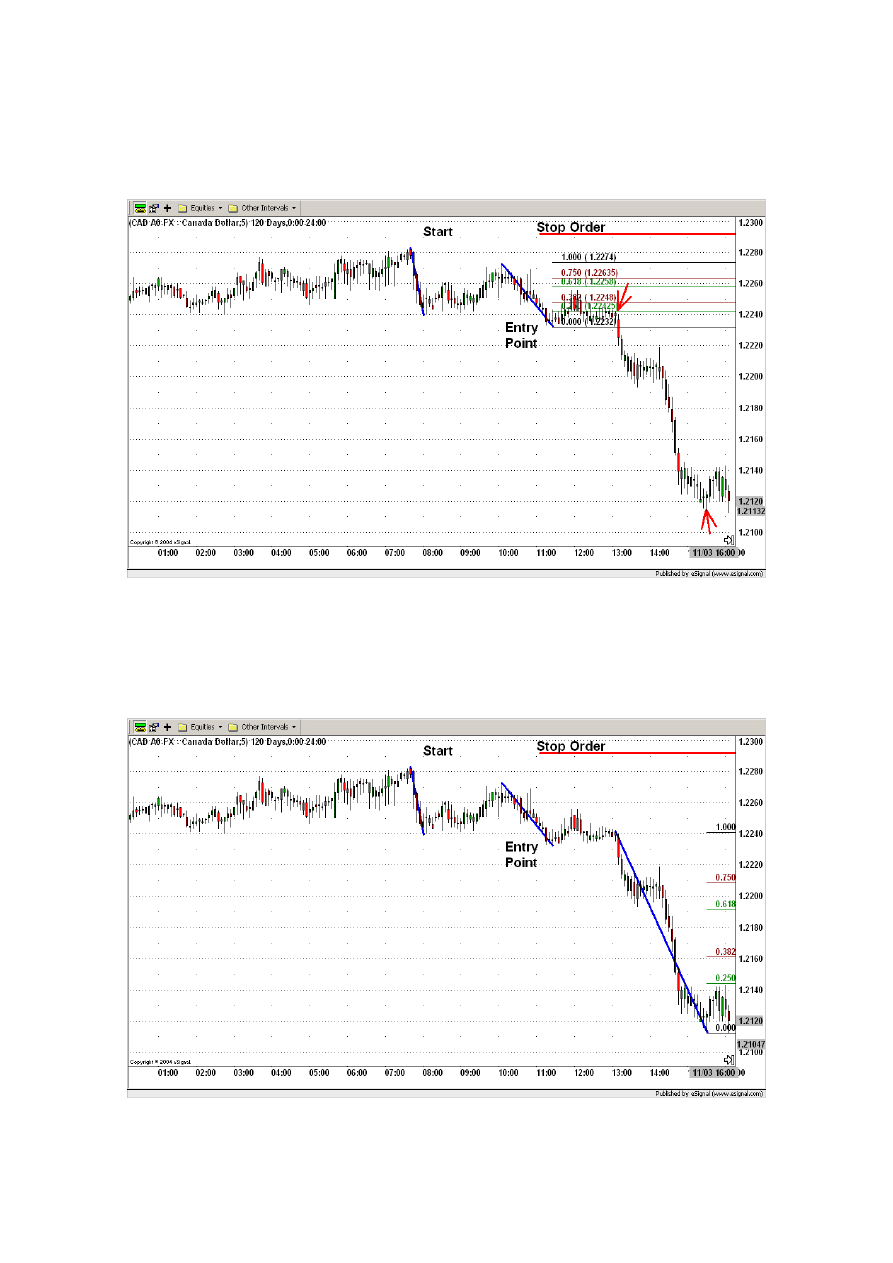
83
For this active wave no exit signal occurs. Instead around 16:00 we recognize a new
active wave represented by the downward movement starting at 13:05 and ending at
15:30 on the 11/03/04. See Figure 5.12.
Figure 5.12.
New Fibonacci levels are drawn and the old ones removed (see Figure 5.13). Now we are
again looking for a candlestick going below the lower confirmation level.
Figure 5.13.
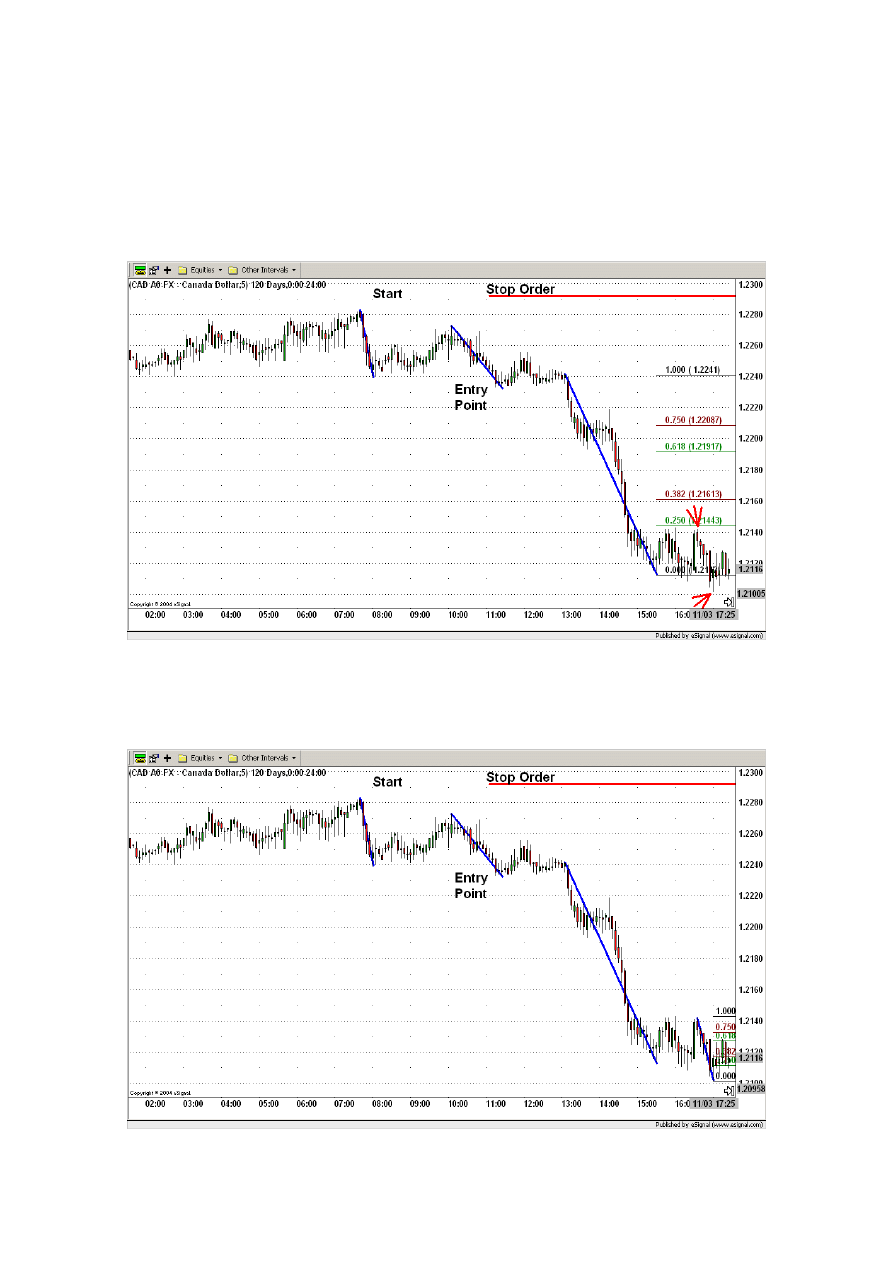
84
Once again around 17:30 on the 11/03/04 a new active wave has been recognized before
an exit signal occurs. The new active wave is represented by the downward movement
starting at 16:35 and ending at 17:00 on the 11/24/04. Please notice that the height of the
previous downward movement was too low to be considered as an active wave. See
Figure 5.14.
Figure 5.14.
New Fibonacci levels are drawn and the old ones removed (see Figure 5.15).
Figure 5.15.
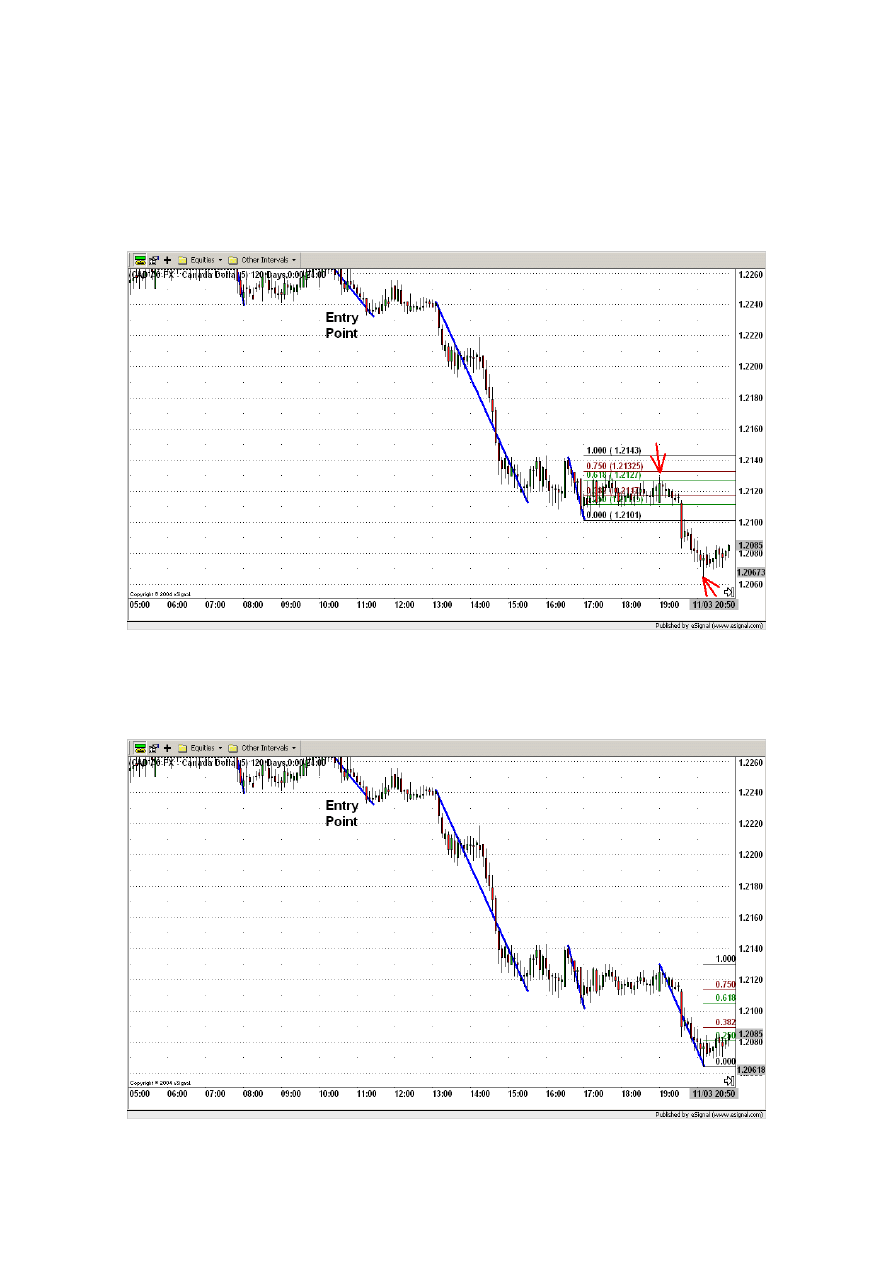
85
This happens now several times.
Around 21:00 on the day 11/03/04 a new active wave has been recognized before an exit
signal occurs. The new active wave is represented by the downward movement starting at
19:00 and ending at 20:10 on the 11/03/04. See Figure 5.16.
Figure 5.16.
New Fibonacci levels are drawn and the old ones removed (see Figure 5.17).
Figure 5.17.
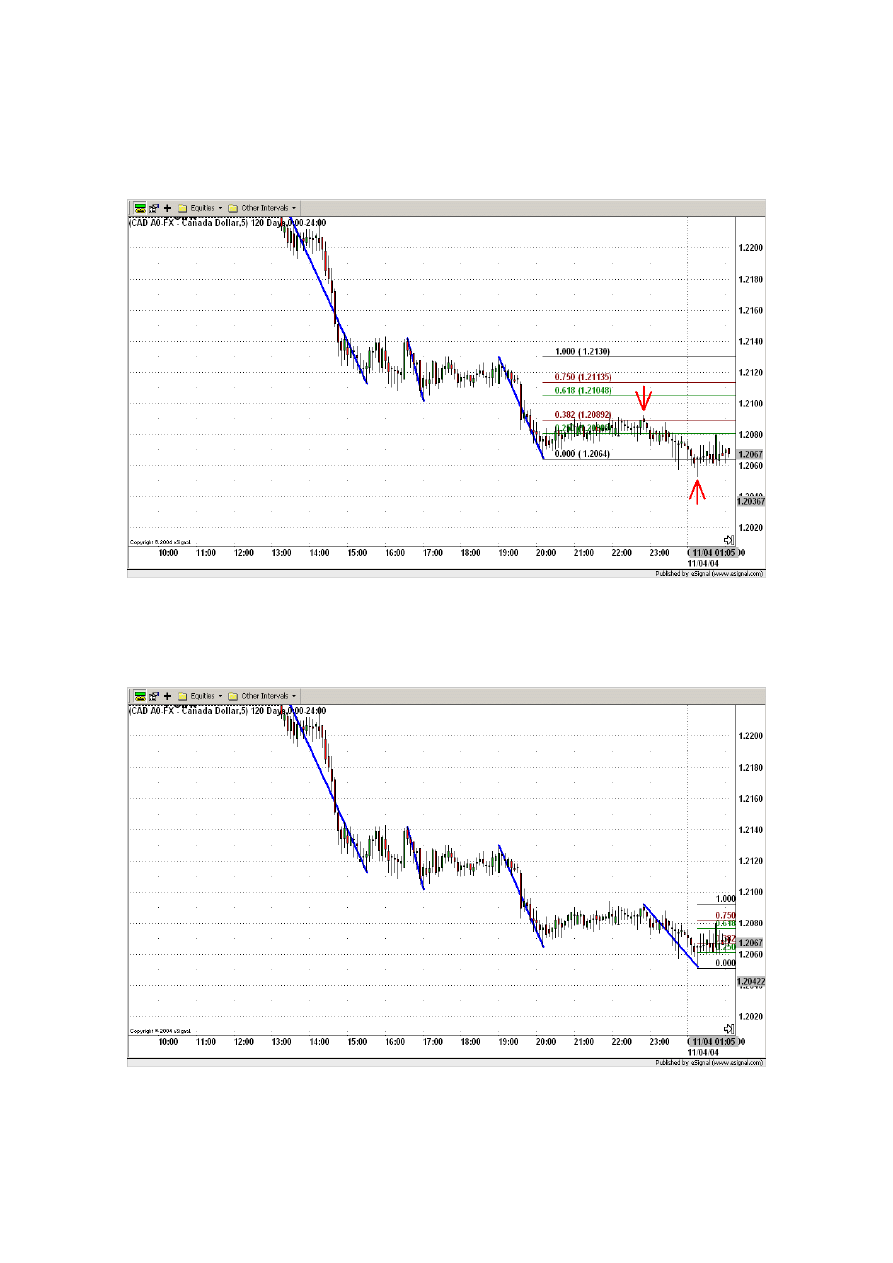
86
Again around 01:00 on the day 11/03/04 a new active wave has been recognized before
an exit signal occurs. The new active wave is represented by the downward movement
starting at 22:50 on the 11/03/04 and ending at 00:10 on the 11/04/04. See Figure 5.18.
Figure 5.18.
New Fibonacci levels are drawn and old ones removed (see Figure 5.19).
Figure 5.19.
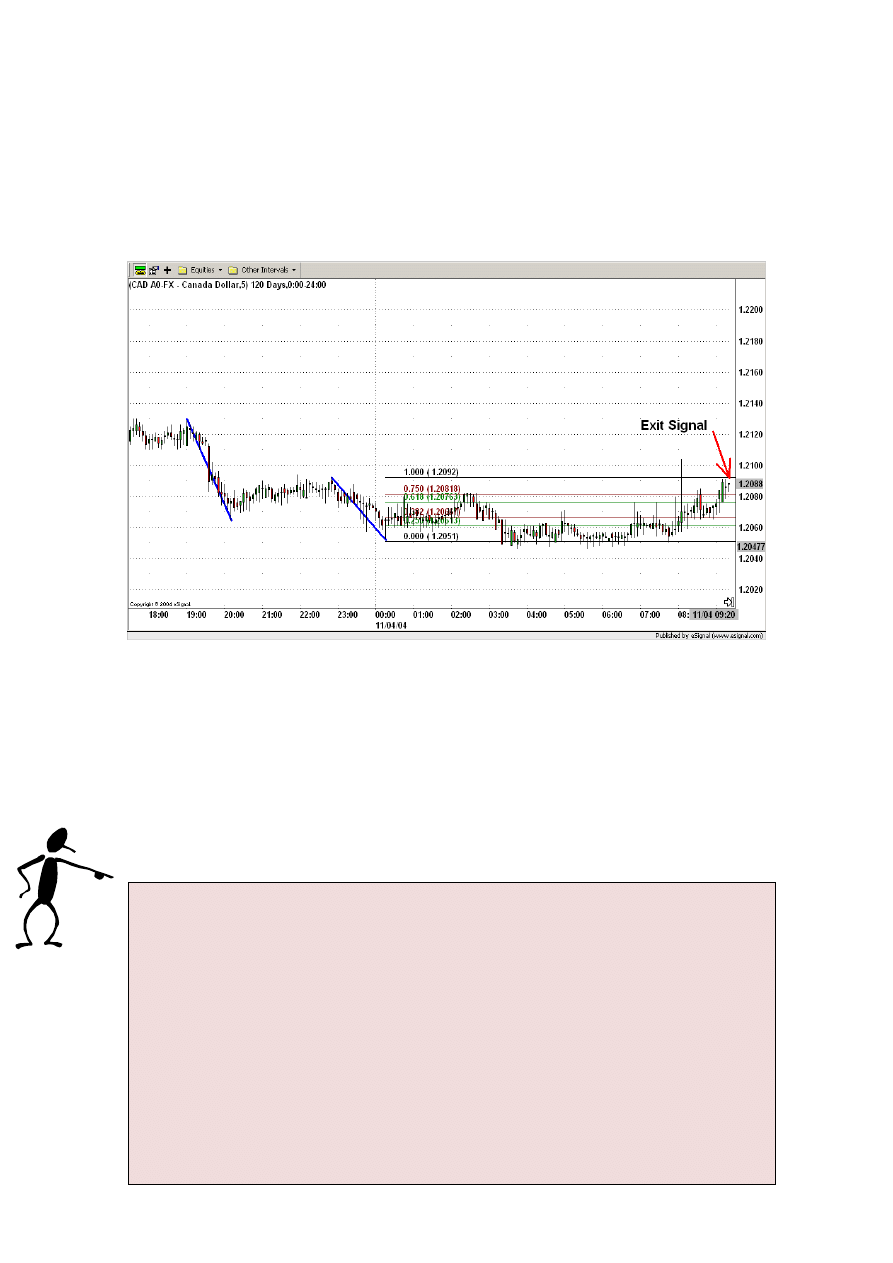
87
Around 07:00 the market trend starts to reverse (see Figure 5.20). At 09:20 on the
11/04/04 the candlestick is above the upper confirmation level (Fibonacci level 0.750).
Since the active wave had a downward movement and the candlestick is above the upper
confirmation level we identify the active wave as an downward corrective wave. As
explained in the chapter “Intraday ICWR Trading Rules” this is a bullish signal.
Figure 5.20.
Please notice that the height of the previous downward movement (between 02:00 and
03:00) was too low to be considered as an active wave.
Because of the bullish signal the position is exited at 09:20 on the11/04/04 selling 10,000
USD for the price of 1.2088.
At the end using the Intraday ICWR Trading Rules a profit of
155 pips= (1.2243 – 1.2088) = 0.0155
was achieved (see Figure 5.21).
Using a 1:20 leverage this means
10,000 USD x (0.0155 pips) x 20 leverage = 3,100 USD!
A profit of 3,100 USD for two trading days using the Intraday ICWR Trading
Rules!
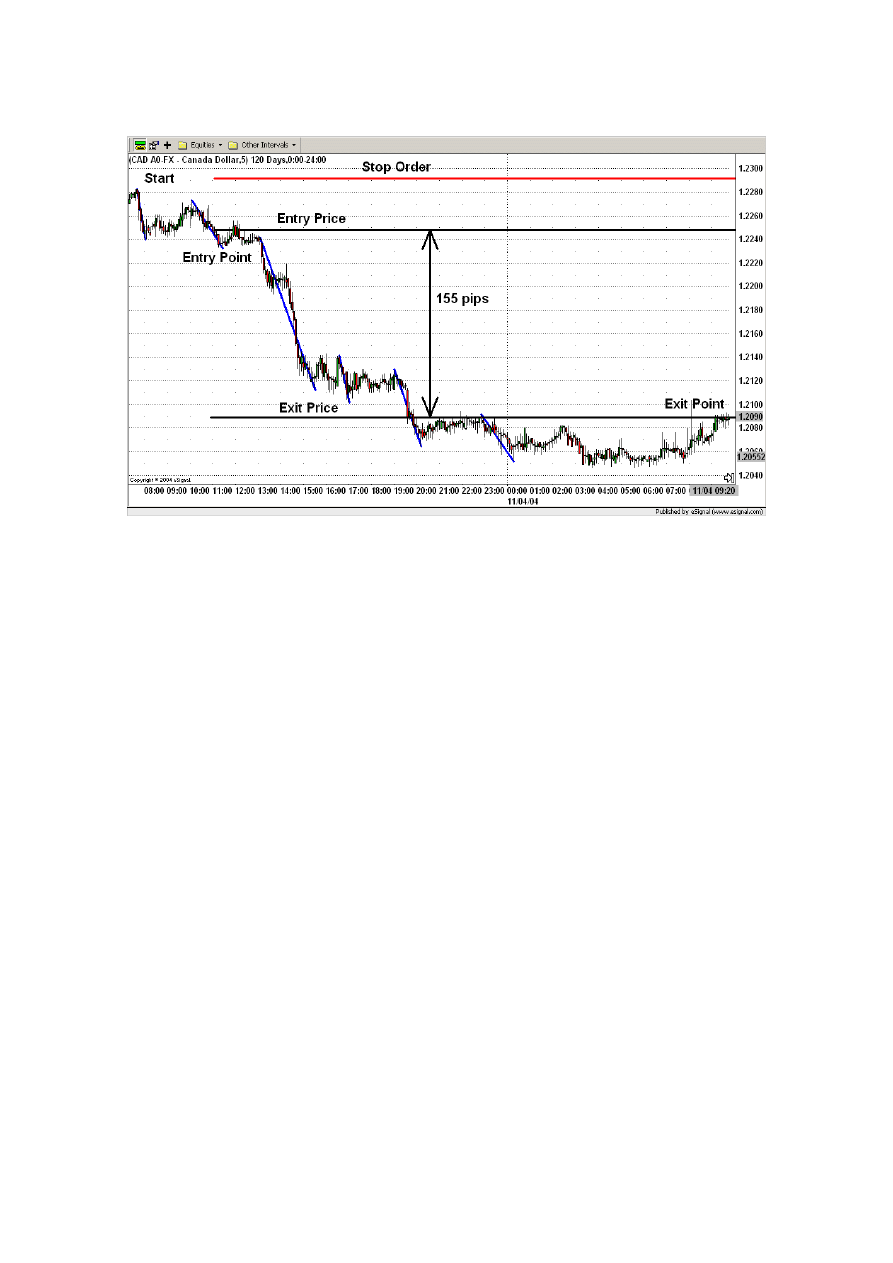
88
Figure 5.21.

89
Chapter 6
The Long-Term
ICWR Trading Rules
The Long-Term ICWR Trading Rules are very similar to the Intraday ICWR Trading
Rules (see chapter 3.), as only the values of some parameters are changed. Because of that
fact we will not repeat all the explanations as done before for the Intraday ICWR Trading
Rules. Basically, we are only going to repeat the basics of the strategy, pointing out the
main differences between the Long-Term and the Intraday ICWR Trading Rules.
The Long-Term ICWR Trading Rules are composed of:
• Entry signals generated by impulsive/corrective wave retracements using a four
hours candlestick chart. The condition for an active wave is a height of 150 pips or
more.
• Entry confirmation signals generated from a 1-day based 14-period Relative Strength
Index (RSI) momentum indicator in order to confirm the bullish or bearish entry
signal from the four hours candlestick chart (acting as a filter for entry signals)
• Exit signals generated by impulsive/corrective wave retracements or by a hard stop
order of 100 pips using a four hours candlestick chart. The condition for an active
wave is a height of 150 pips or more.
Using the 4 hour candlestick chart doesn’t mean that you have to look every 4 hours at the
candlestick chart. It is enough that you check the chart once per day. For example, when
you return from work, or when you get up, or before you go to bed…
90
6.1. When to enter a trade
In short, we are going to enter a trade, when a signal generated by an impulsive/corrective
wave retracement is confirmed with the 1-day 14-period Relative Strength Index.
6.2. When to exit a trade
Our main exit strategy is to look for an opposite market signal (opposite to our entry
signal) based on impulsive/corrective wave retracements (in the same manner as for the
entry warning signal). Additionally (only for the sake of security) after entering a position
we place a stop order of 100 pips, because we do not want to loose more than 100 pips in
one trade.
If the signal generated by an impulsive/corrective wave retracement is bullish we
ask for the RSI to be greater than 50.
If the signal generated by an impulsive/corrective wave retracement is bearish we
ask for the RSI to be lower than 50.
If the market was entered long a position will be exited either because of a bearish
signal generated by an impulsive/corrective wave retracement or because of the
hard stop order 100 pips below the entry price.
If the market was entered short a position will be exited either because of a bullish
signal generated by an impulsive/corrective wave retracement or because of the
hard stop order 100 pips above the entry price.
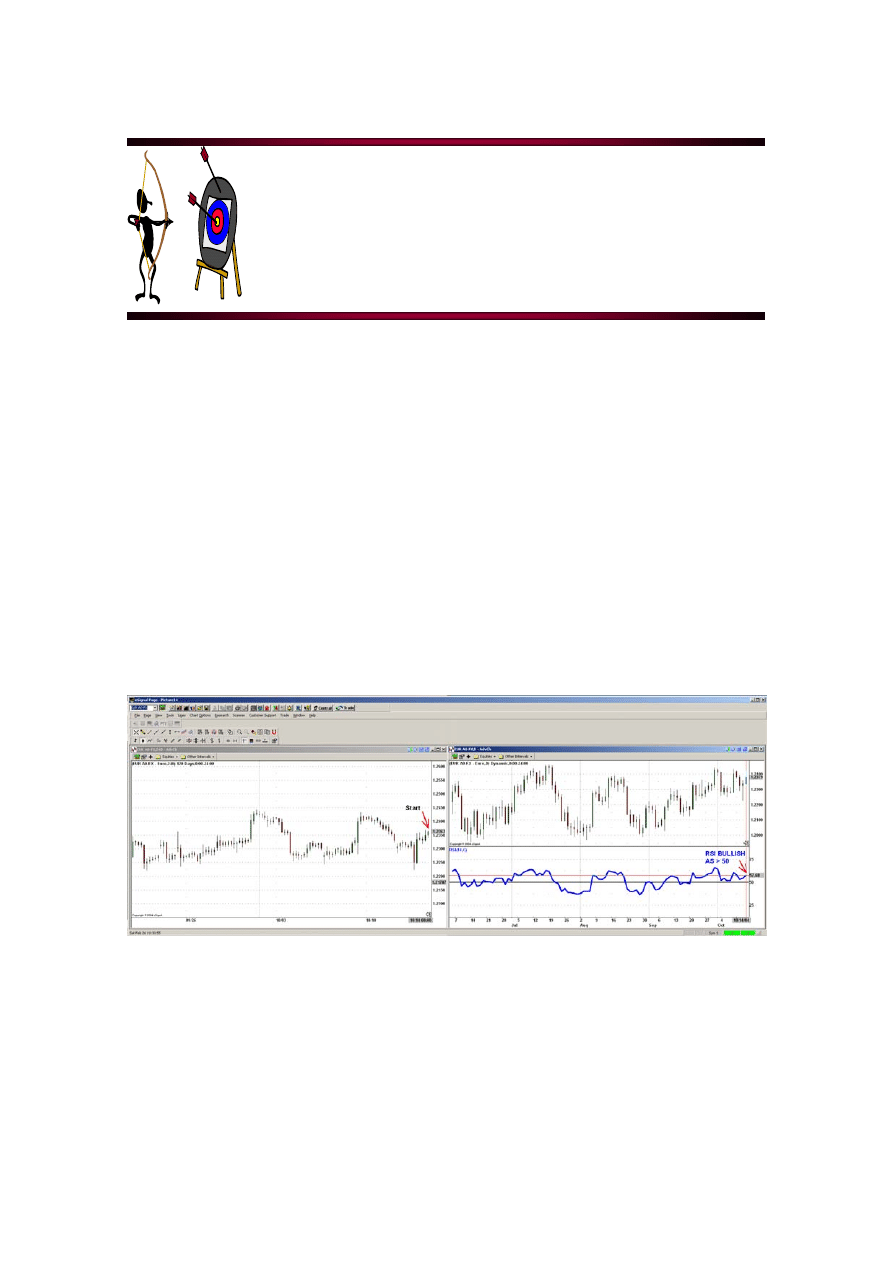
91
Chapter 7
Long-Term EUR/USD
Trading Example
In this example we are going to trade EUR/USD.
Ok, before we start our trading day we need to set up our screens (see Figure 7.1). On the
left screen we are going to place a 4 hours candlestick chart and on the right screen a one
day candlestick chart together with the 14-period RSI (thick blue line). The charting
software usually pictures the RSI automatically together with the 30 and 70 lines (below
30 represents oversold, above 70 overbought). In our case we are not looking for oversold
or overbought signals. We are looking for the market being bullish or bearish. This is
represented by RSI being above 50 (bullish) or below 50 (bearish). So we only need to
draw the 50 centerline (black line).
Figure 7.1.
Now we are ready to start. Suppose you started your trading day on the 10/14/04 at 08:00.
At that time the price was 1.2363. As you can see from the right screen the RSI is above
50 and therefore bullish. So at least today we are looking only for a bullish signal for
entering long the market.
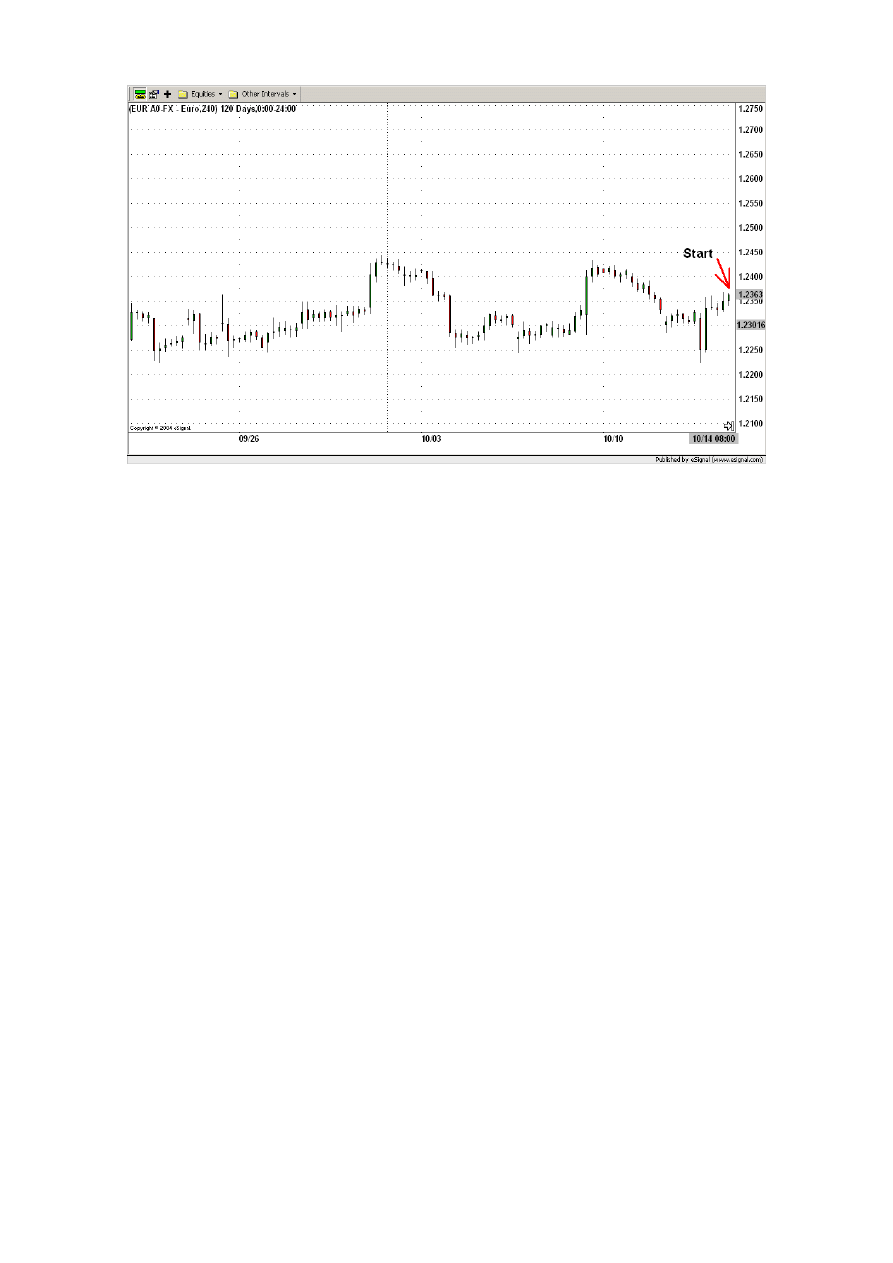
92
Figure 7.2.
Next thing to do is to recognize the active wave. For that, we are going to look for the
nearest market movement to our starting position with a height greater than 150 pips.
Ok, in order to find the active wave the following steps are to be done:
First all possible waves (black lines) are drawn connecting the high value of the starting
point with the low value of the ending point and then the waves are enumerated starting
with the nearest wave to the actual time (see Figure 7.3).
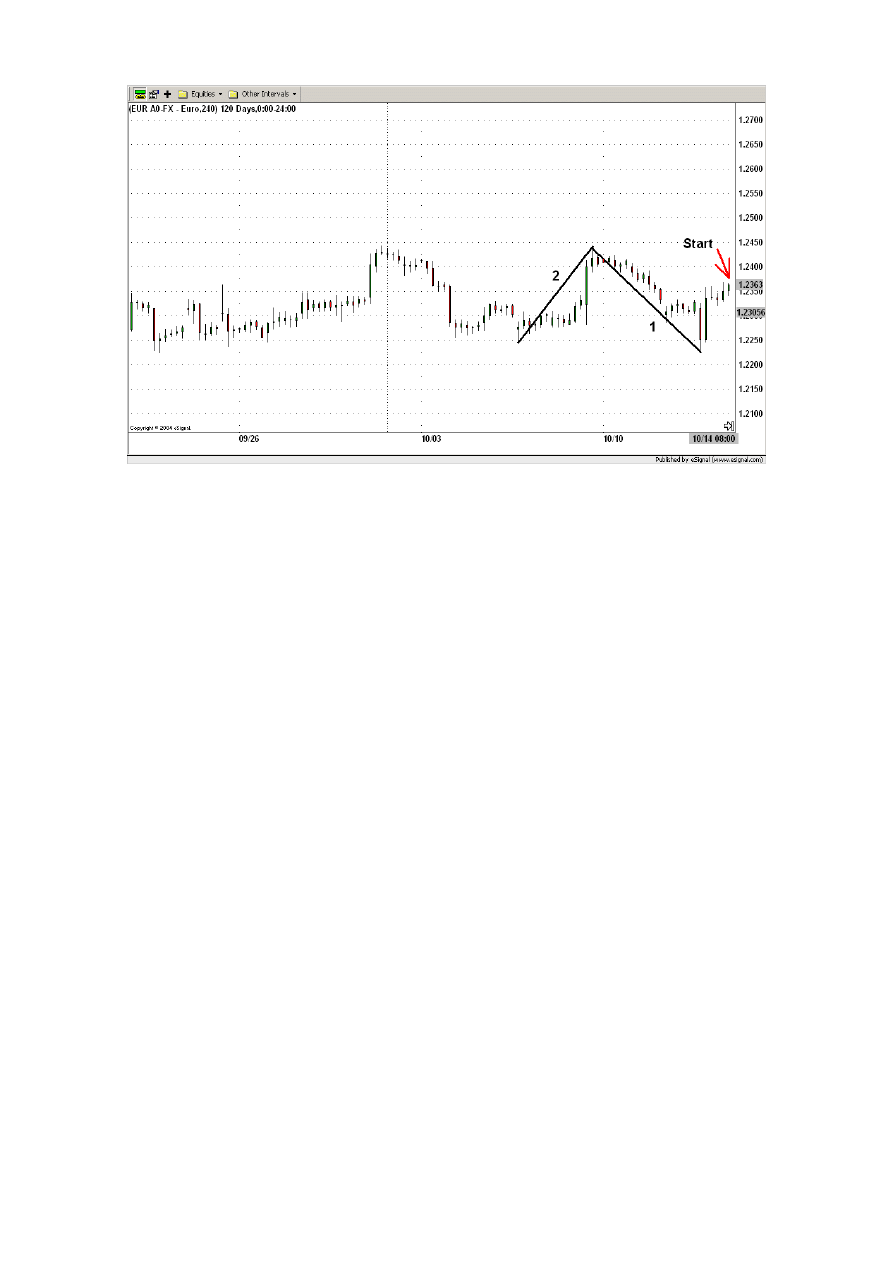
93
Figure 7.3.
Second read the extreme values of each wave and calculate its height.
Wave 1:
High = 1.2433; Low = 1.2223;
Height = High – Low = 1.2433 – 1.2223= 0.0210 = 210 pips
Wave 2:
High = 1.2433; Low = 1.2243;
Height = High – Low = 1.2433 – 1.2243= 0.0190 = 190 pips
The nearest movement to our starting position with a height greater than 150 pips is the
wave 1. So that’s our active wave now. Throughout our trading we are not going to pay
attention to movements with a height below 150 pips .
The wave 1 is now our current active wave (see blue line in Figure 7.4).
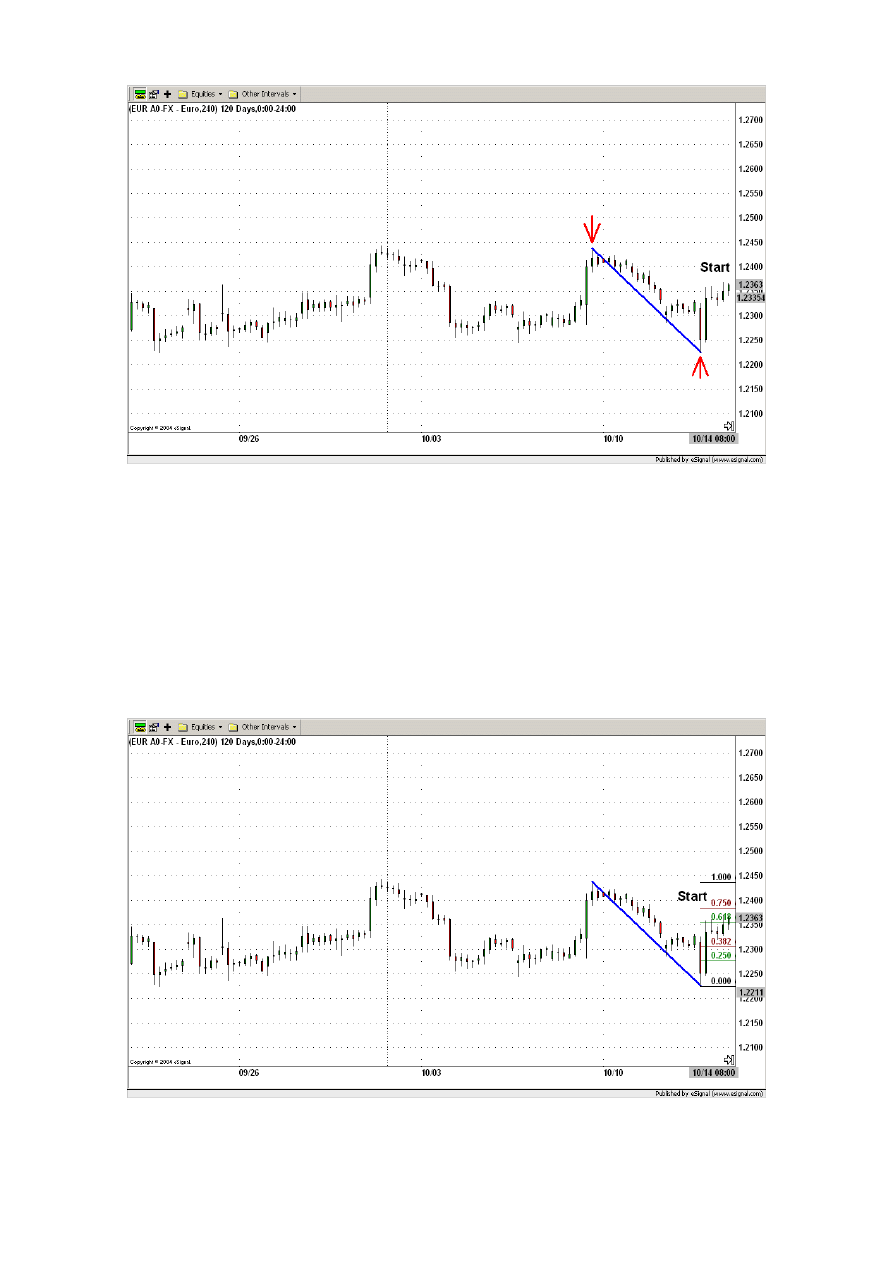
94
Figure 7.4.
The task is now to apply the Long-Term ICWR Trading Rules.
That means, first the Fibonacci levels 0.000, 0.250, 0.382, 0.682, 0.750 and 1.000 are
inserted using the low as the starting point (level 0.000) and the high as the ending point
(level 1.000). The levels between 0.382 and 0.618 define the retracement channel. The
levels 0.250 and 0.750 define the confirmation levels. See Figure 7.5.
Figure 7.5.
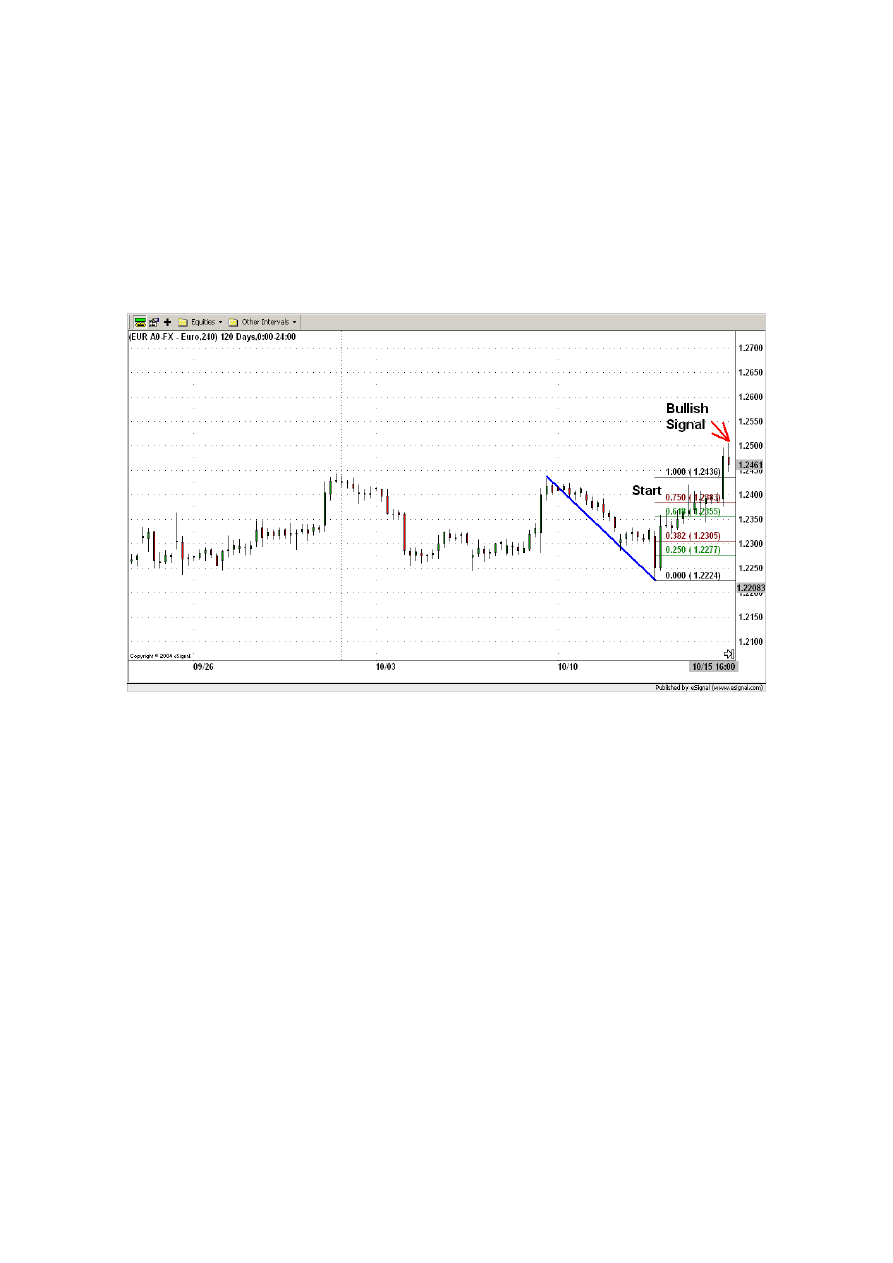
95
Ok, the Fibonacci levels are placed, now it’s about to see what the market is telling us.
At 16:00 on the 10/15/04 the candlestick is above the upper confirmation level (Fibonacci
level 0.750). Since the active wave had a downward movement and the candlestick is
above the upper confirmation level we identify the active wave as a downward corrective
wave. As explained in the chapter 3. “Intraday ICWR Trading Rules” this is a bullish
signal. See Figure 7.6.
Figure 7.6.
This bullish signal must be confirmed with the Relative Strength Index. If the RSI is
greater than 50, it’s bullish and we enter the market. If RSI is less than 50, it’s bearish, so
it’s opposite and we do not enter the market. Today the RSI (blue line in Figure 7.7) is
above the 50 centerline (black line) and therefore bullish.
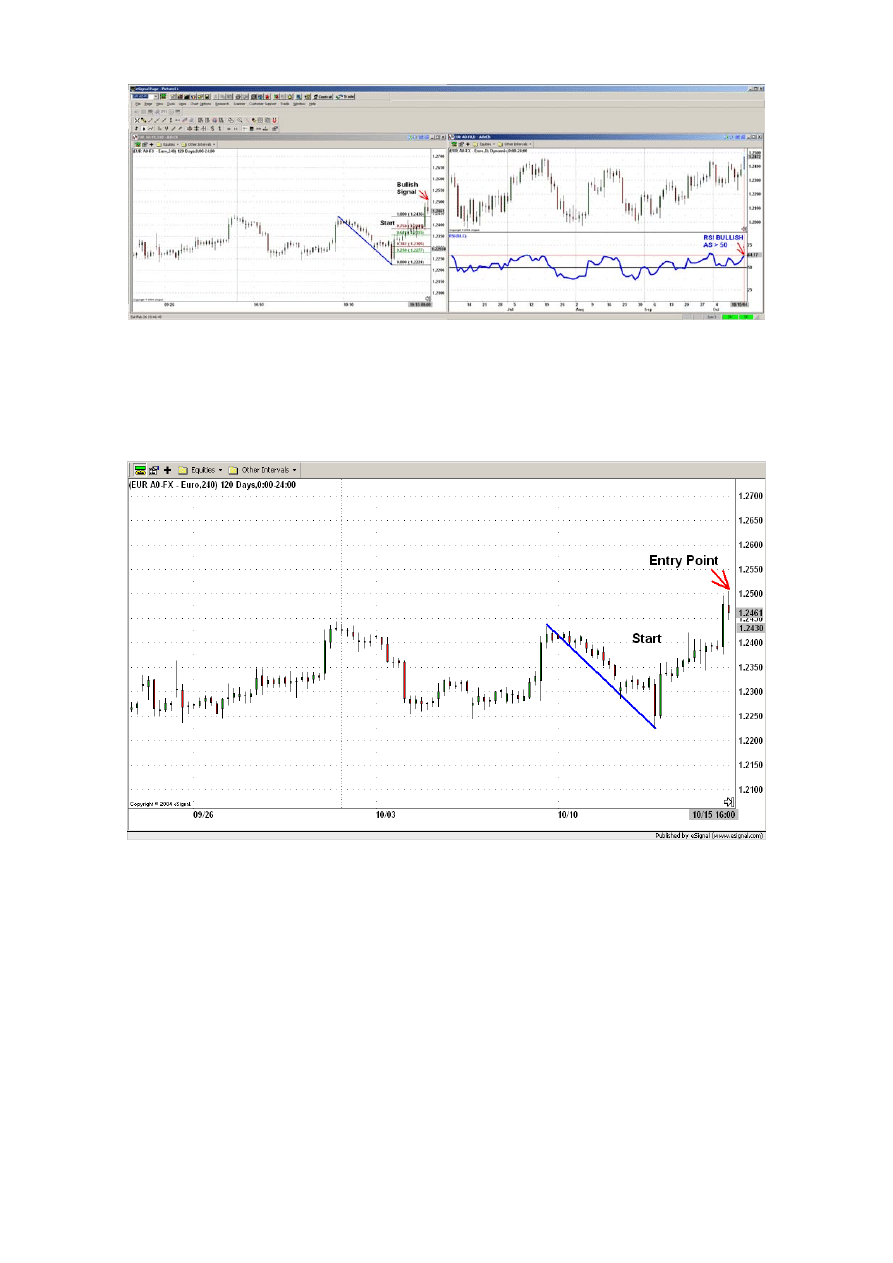
96
Figure 7.7.
As both signals are bullish we enter the trade at 16:00 on the 10/15/04 at the price of
1.2461. For example we sell 10,000 USD for the price of 1.2461. See Figure 7.8.
Figure 7.8.
Ok, now it’s about to find how far we will let the market move before we exit our
position.
First of all we place a stop order 100 pips below the entry price. That means at 1.2461 -
0.0100 = 1.2361. It’s represented by the thick red horizontal line in the picture below (see
Figure 7.9). Please notice, as said before, that the hard stop order is only for the sake of
security, because we do not want to loose more than 100 pips in one trade.
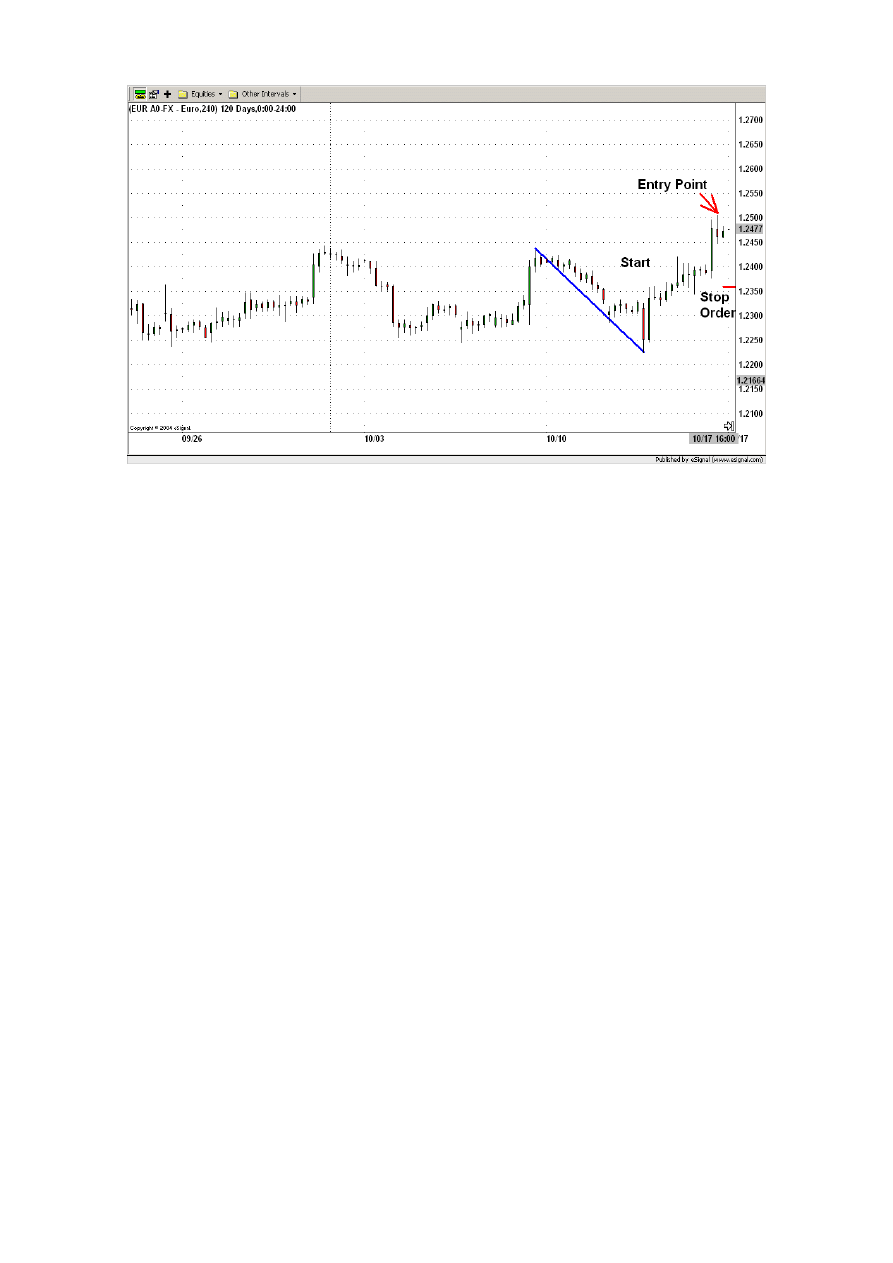
97
Figure 7.9.
In fact, our main exit strategy is to look for an opposite signal generated by an
impulsive/corrective wave retracement (in the same manner as for the entry warning
signal).
In this example we are looking for a bearish signal as we entered long the market. The
task is to look for a whole candlestick being below the lower confirmation level (after
having entered the retracement channel in the case of an impulsive wave). If this happens
we exit the position. Every time a new wave is recognized, new Fibonacci levels are
drawn and the old Fibonacci levels get inactive. This procedure is repeated until an exit
signal occurs.
Ok, let’s look to our opened position. Between 10/15/04 and the 10/26/04 no bearish
signal occurs. So, we don’t exit the trade. Remember the bearish signal is in this example
the exit signal.
Around the 10/27/04 we recognize a new active wave represented by the upward
movement starting the 10/12/04 and ending the 10/26/04. The beginning and the end of
the new active wave are marked with red arrows in Figure 7.10.
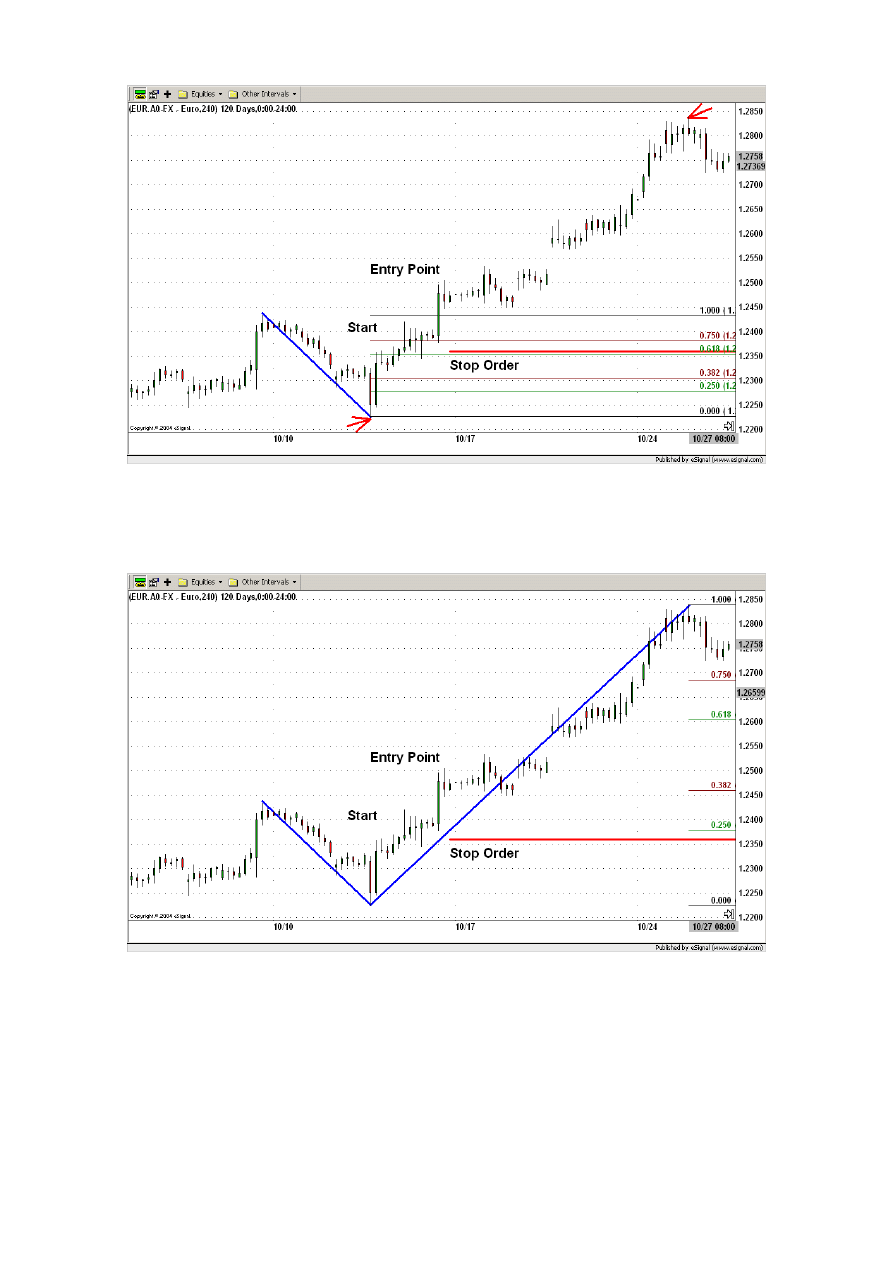
98
Figure 7.10.
New Fibonacci levels are drawn. The old ones are now inactive (see Figure 7.11).
Figure 7.11.
For this active wave no exit signal occurrs. Instead around the 10/29/04 we recognize a
new active wave represented by the upward movement starting on the 10/26/04 and
ending on the 10/28/04. See Figure 7.12.
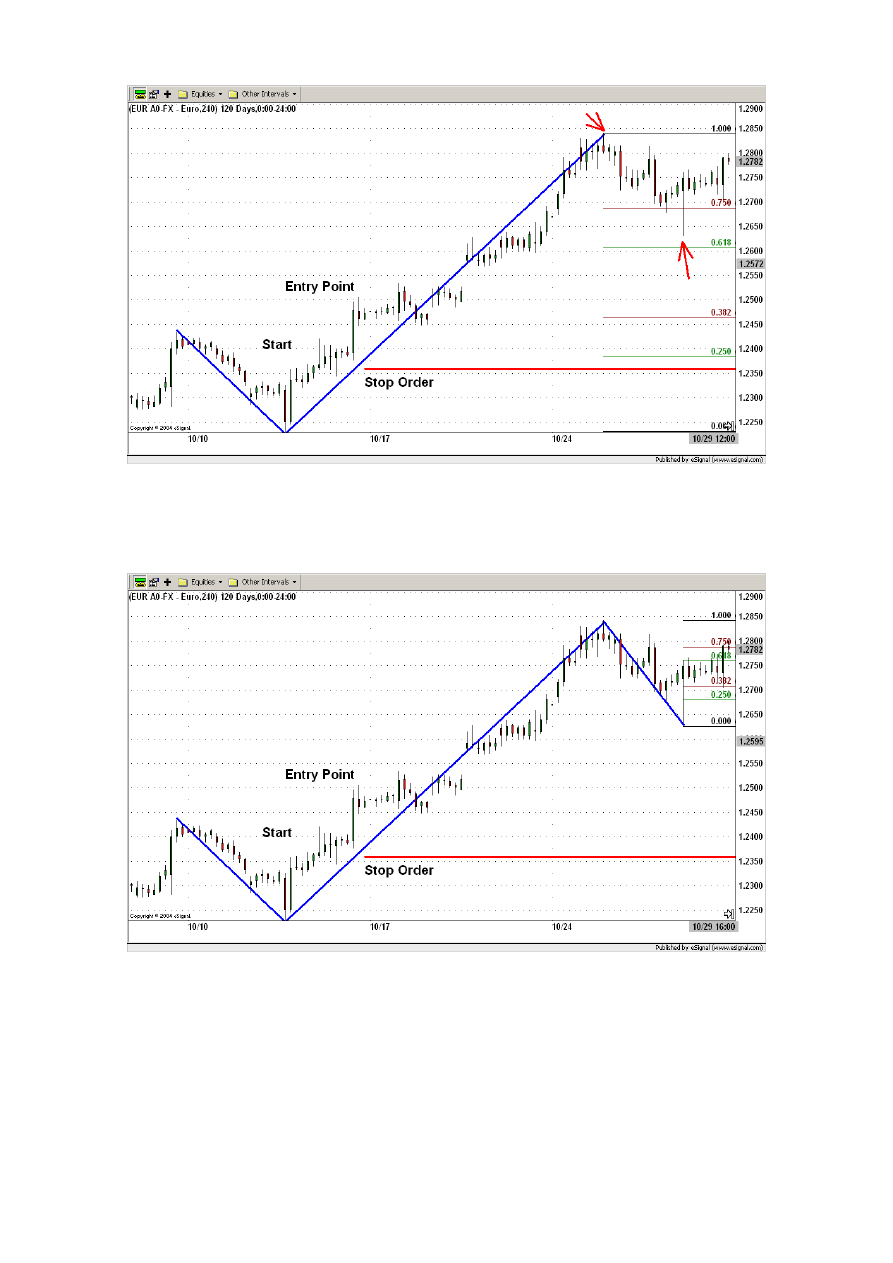
99
Figure 7.12.
New Fibonacci levels are drawn. The old ones are now inactive (see Figure 7.13).
Figure 7.13.
Around the 11/01/04 a new active wave has been recognized before an exit signal occurs.
The new active wave is represented by the upward movement starting on the 10/28/04
and ending on the 11/01/04. See Figure 7.14.
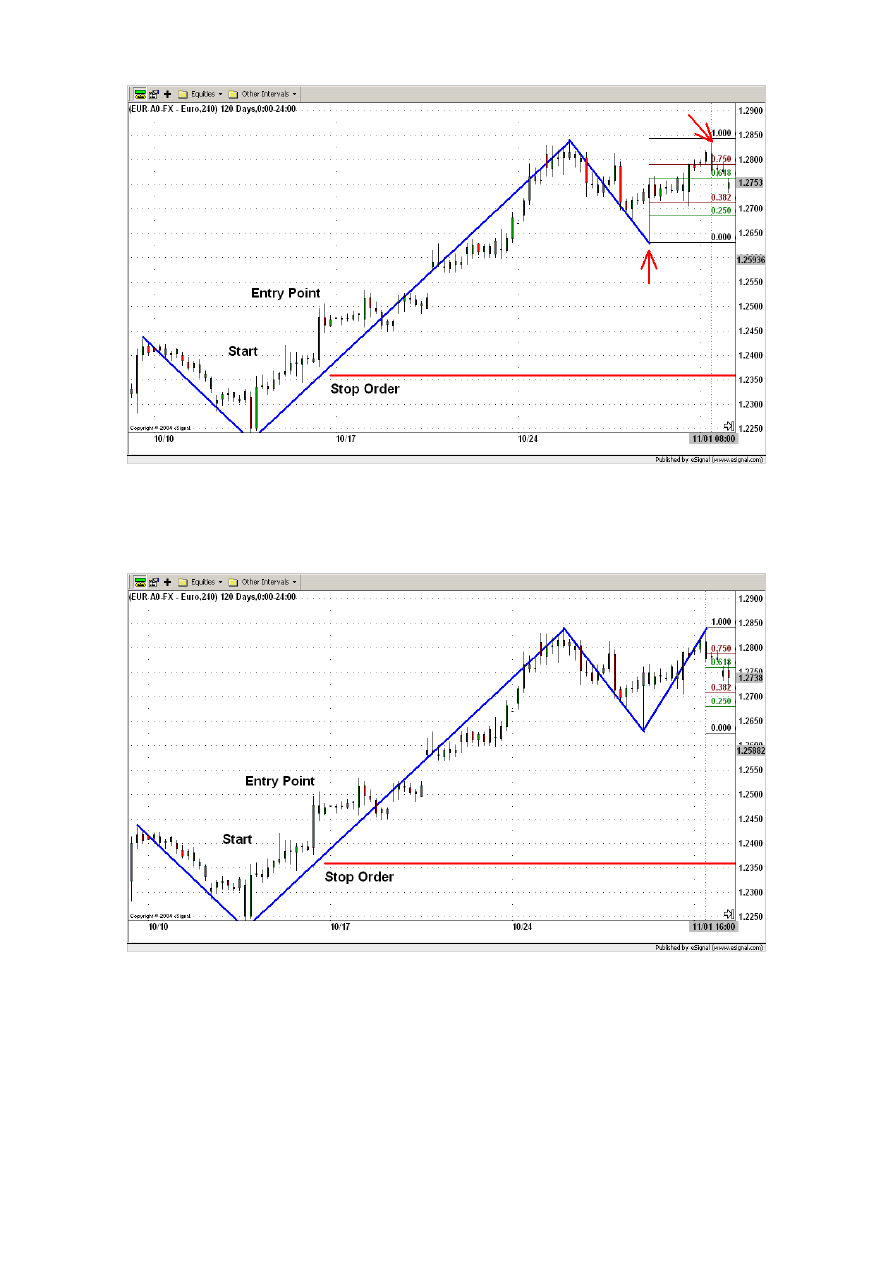
100
Figure 7.14.
New Fibonacci levels are drawn. The old ones are now inactive (see Figure 7.15).
Figure 7.15.
Around the 11/03/04 a new active wave has been recognized before an exit signal occurs.
The new active wave is represented by the upward movement starting on the 11/01/04
and ending on the 11/03/04. See Figure 7.16.
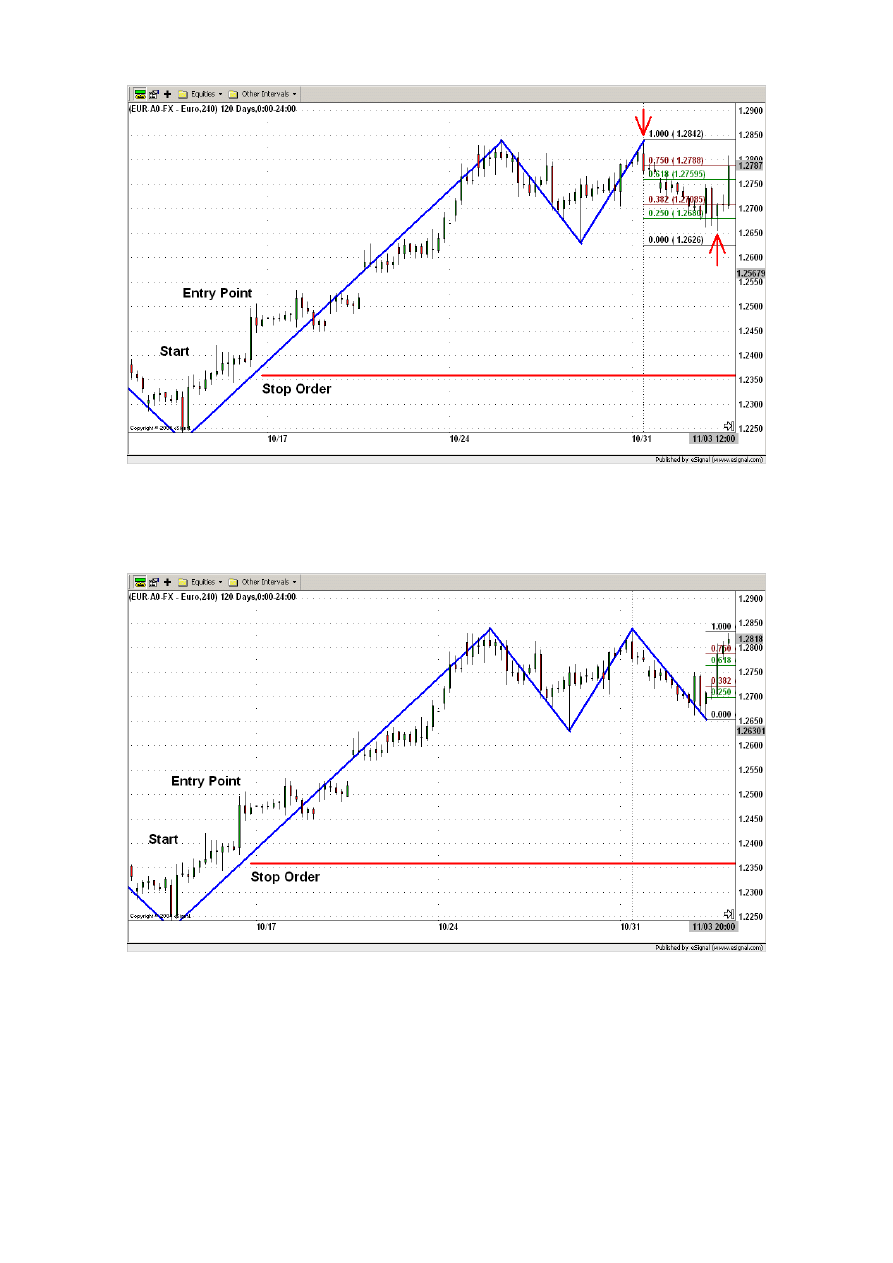
101
Figure 7.16.
New Fibonacci levels are drawn. The old ones are now inactive (see Figure 7.17).
Figure 7.17.
Around the 11/08/04 a new active wave has been recognized before an exit signal occurs.
The new active wave is represented by the upward movement starting on the 11/03/04
and ending on the 11/07/04. See Figure 7.18.
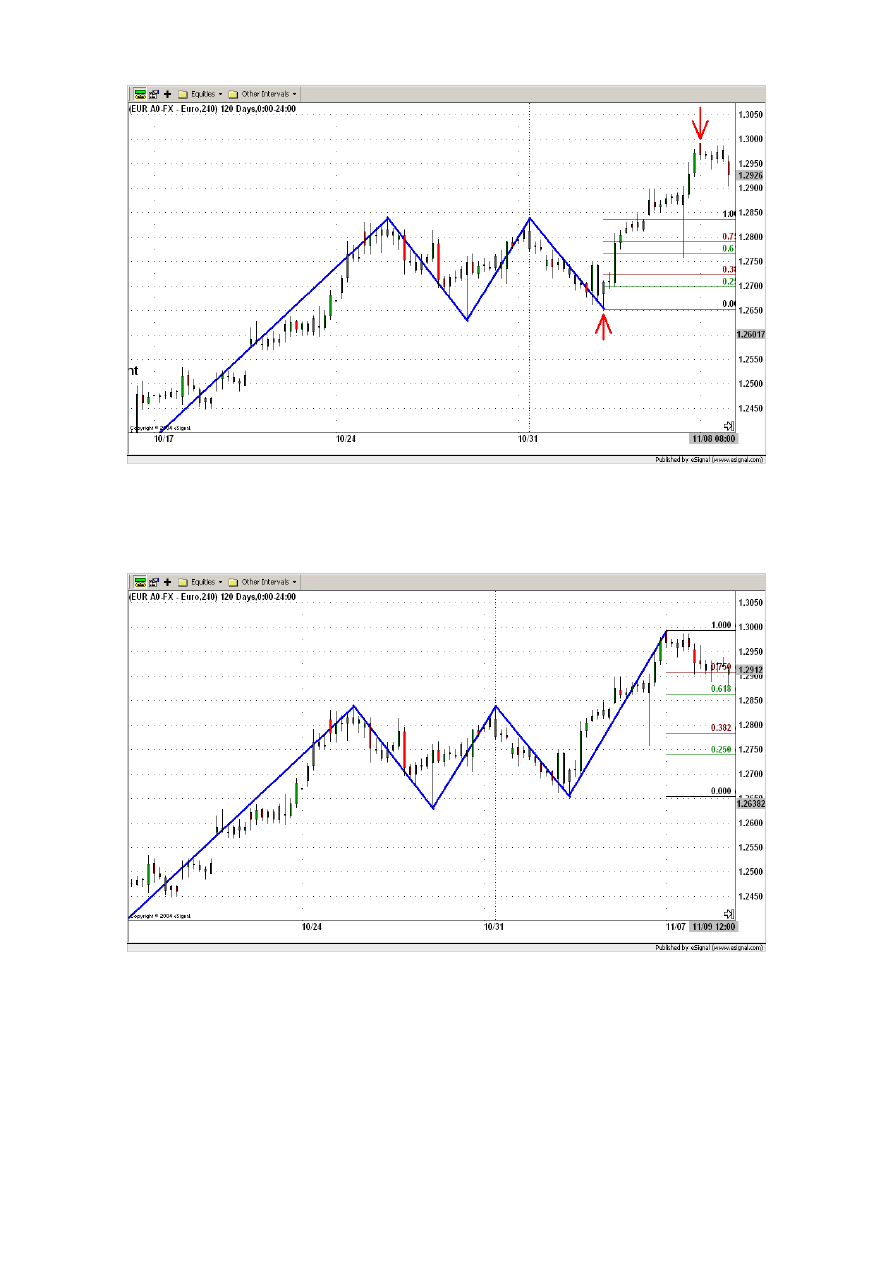
102
Figure 7.18.
New Fibonacci levels are drawn. The old ones are now inactive (see Figure 7.19).
Figure 7.19.
Around the 11/12/04 a new active wave has been recognized before an exit signal occurs.
The new active wave is represented by the upward movement starting on the 11/07/04
and ending on the 11/10/04. See Figure 7.20.
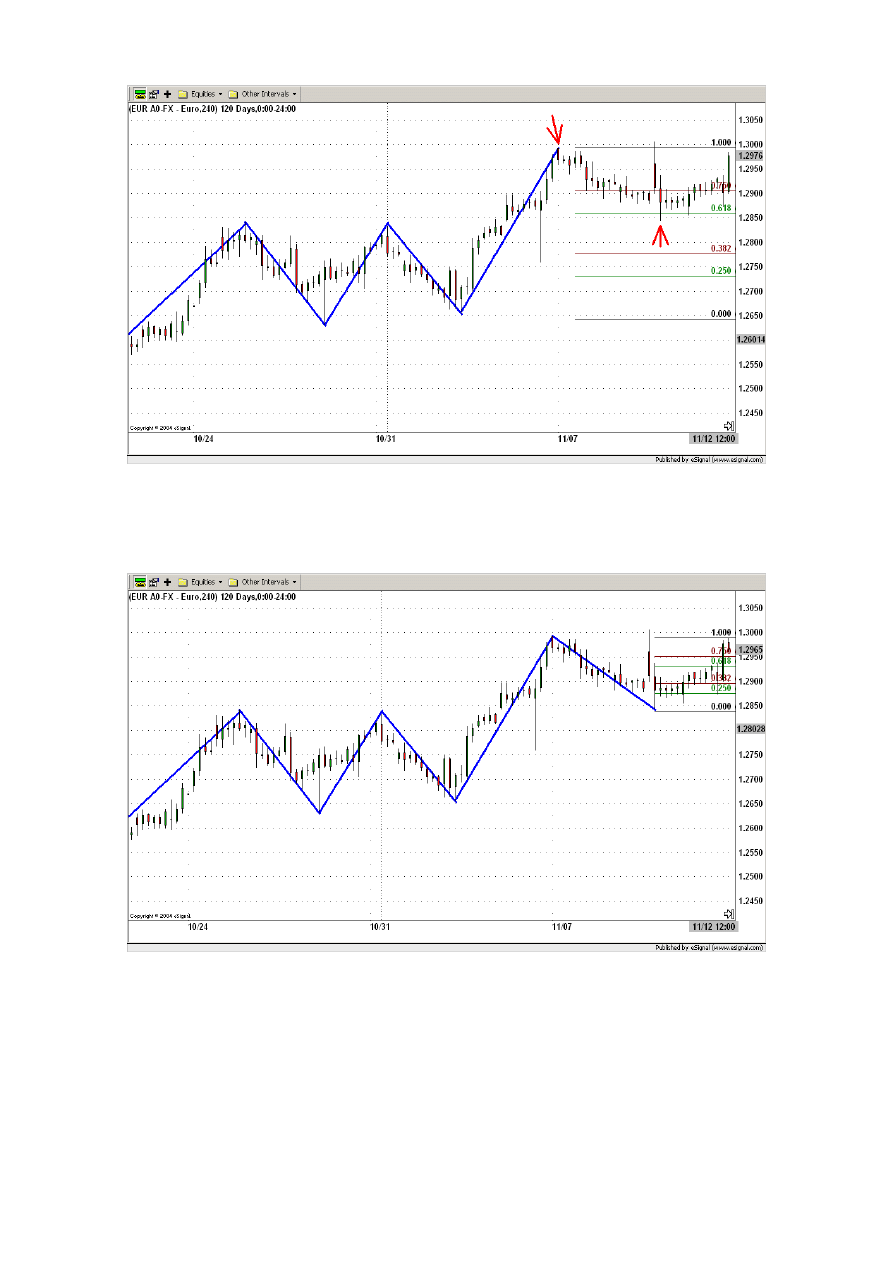
103
Figure 7.20.
New Fibonacci levels are drawn. The old ones are now inactive (see Figure 7.21).
Figure 7.21.
Around the 11/18/04 a new active wave has been recognized before an exit signal occurs.
The new active wave is represented by the upward movement starting on the 11/10/04
and ending on the 11/18/04. See Figure 7.22.
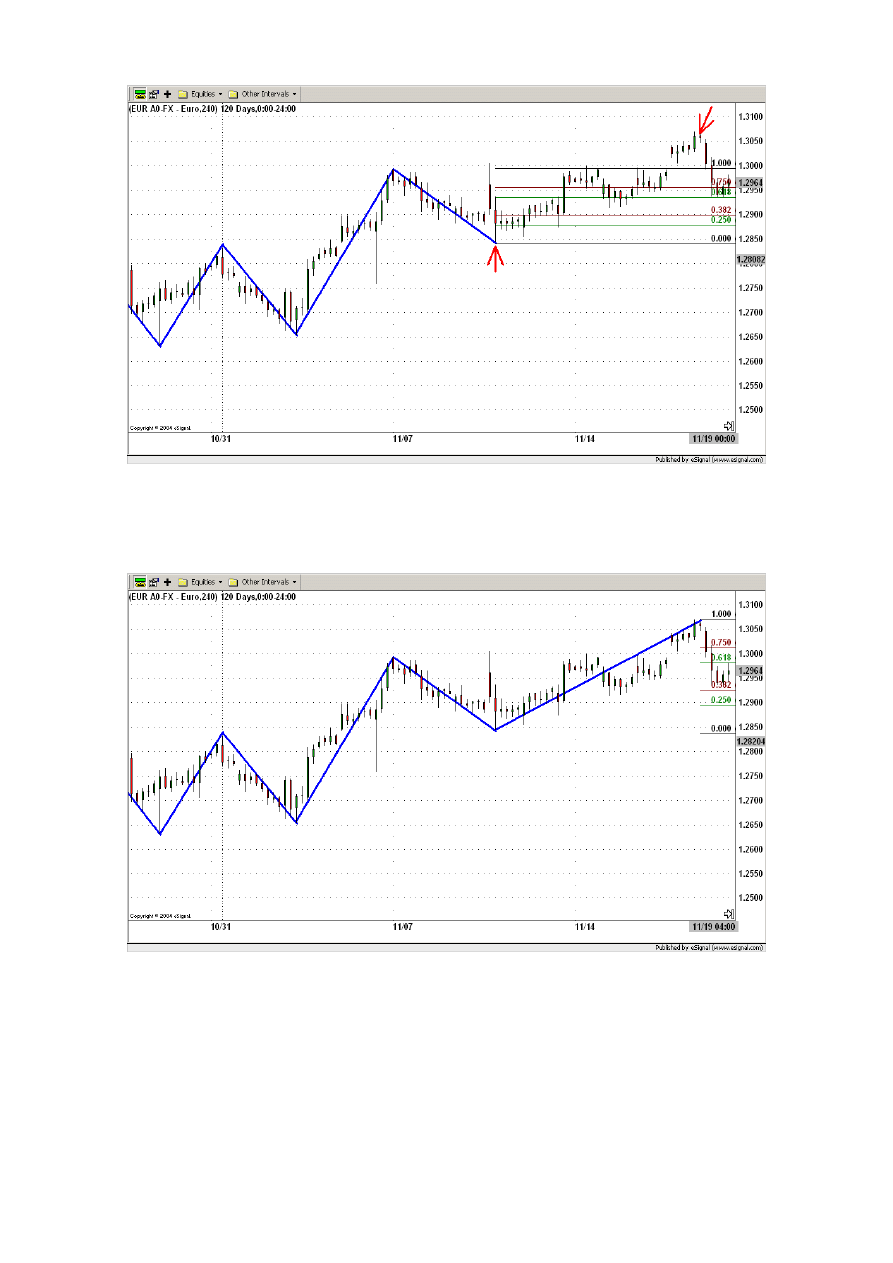
104
Figure 7.22.
New Fibonacci levels are drawn. The old ones are now inactive (see Figure 7.23).
Figure 7.23.
Around the 11/29/04 a new active wave has been recognized before an exit signal occurs.
The new active wave is represented by the upward movement starting on the 11/23/04
and ending on the 11/26/04. See Figure 7.24.
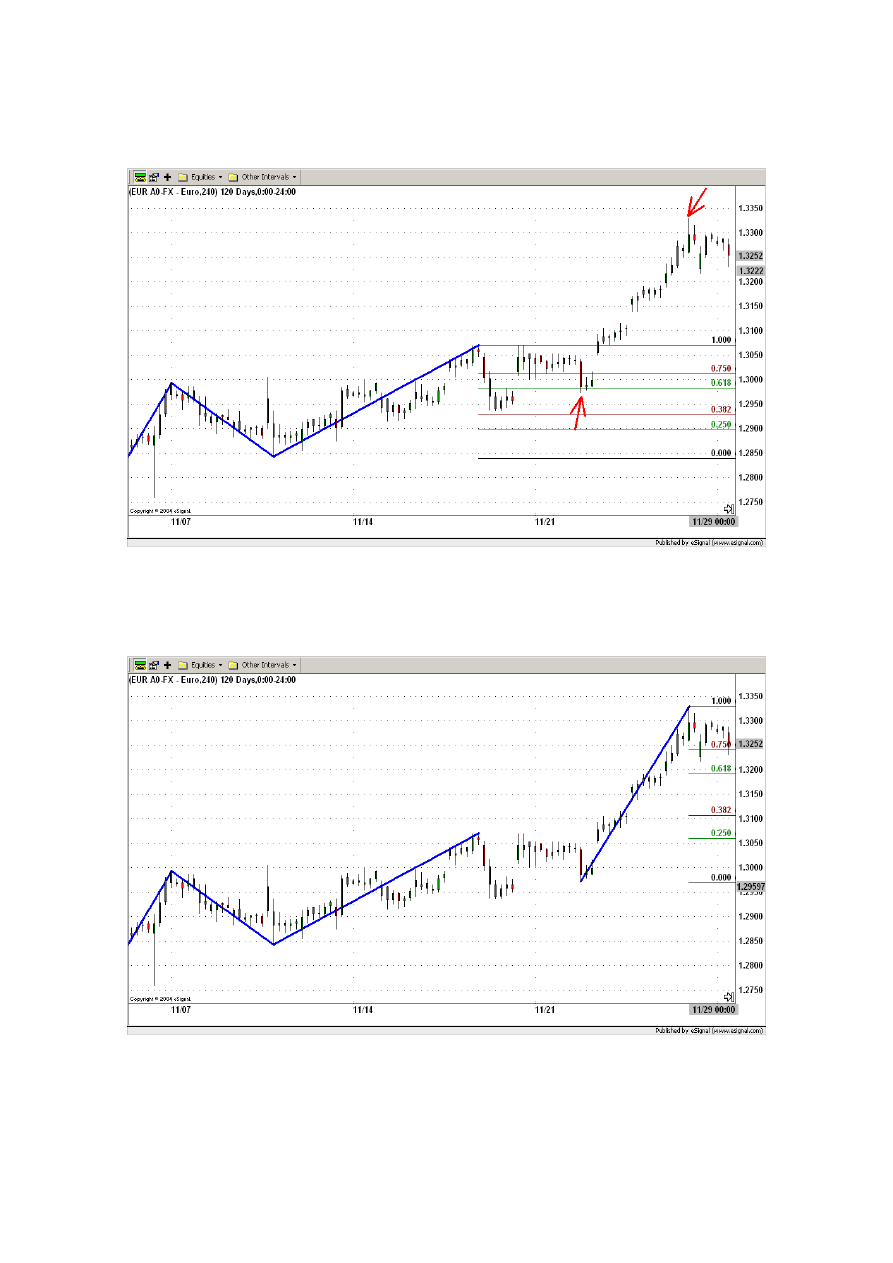
105
Please remember that movements with a height less than 150 pips are not taken into
account!
Figure 7.24.
New Fibonacci levels are drawn. The old ones are now inactive (see Figure 7.25).
Figure 7.25.
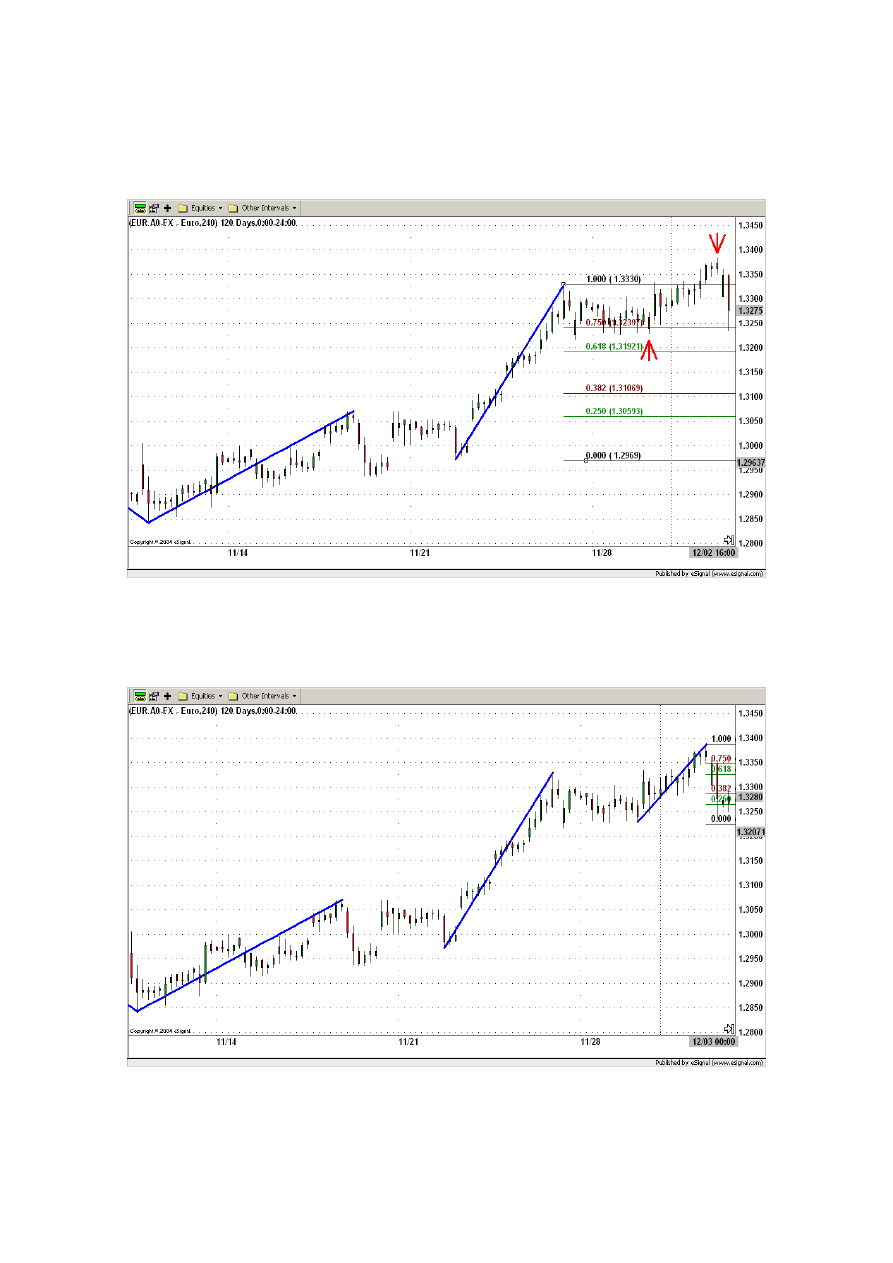
106
Around the 12/02/04 a new active wave has been recognized before an exit signal occurs.
The new active wave is represented by the upward movement starting on the 11/30/04
and ending on the 12/02/04. See Figure 7.26.
Figure 7.26.
New Fibonacci levels are drawn. The old ones are now inactive (see Figure 7.27).
Figure 7.27.
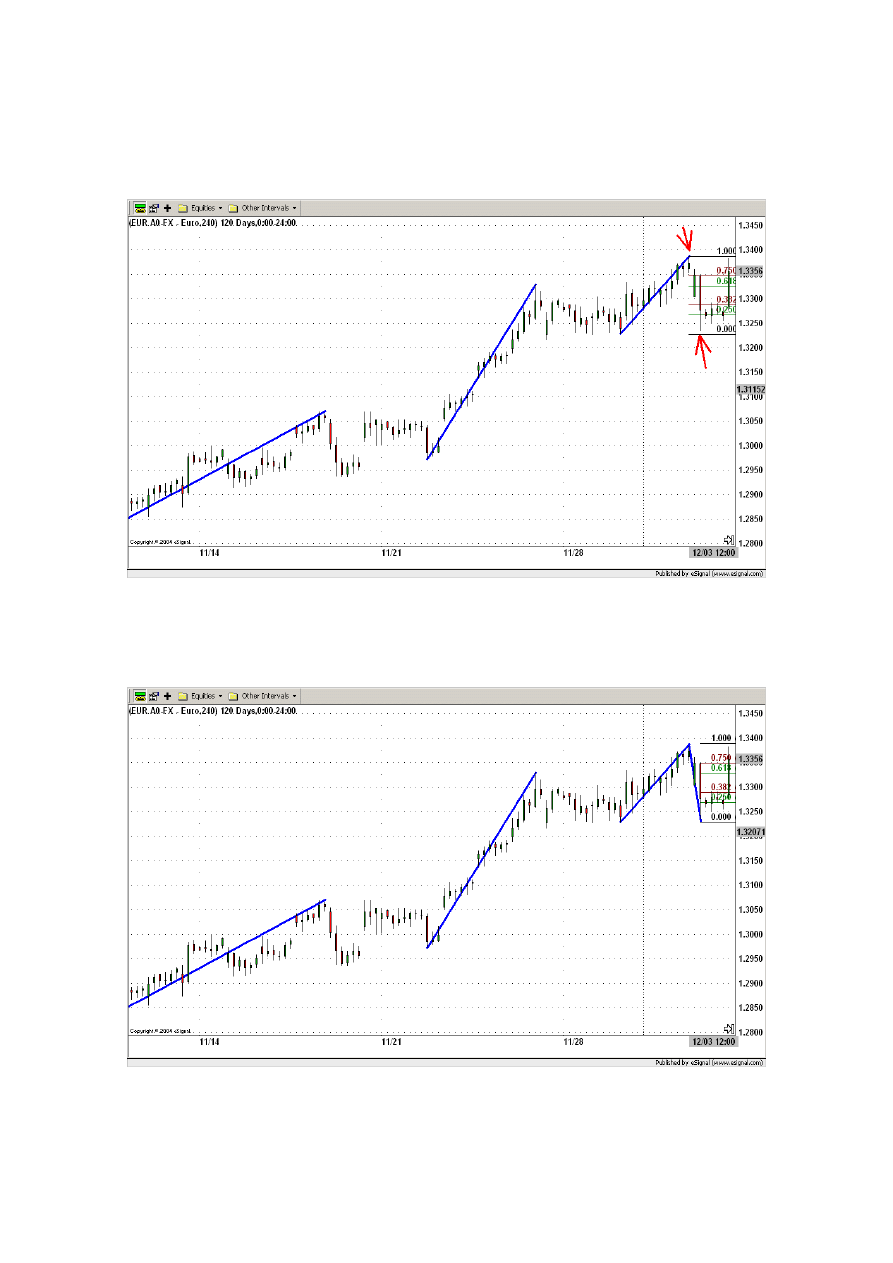
107
Around the 12/03/04 a new active wave has been recognized before an exit signal occurs.
The new active wave is represented by the upward movement starting on the 12/02/04
and ending on the 12/02/04. See Figure 7.28.
Figure 7.28.
New Fibonacci levels are drawn. The old ones are now inactive (see Figure 7.29).
Figure 7.29.
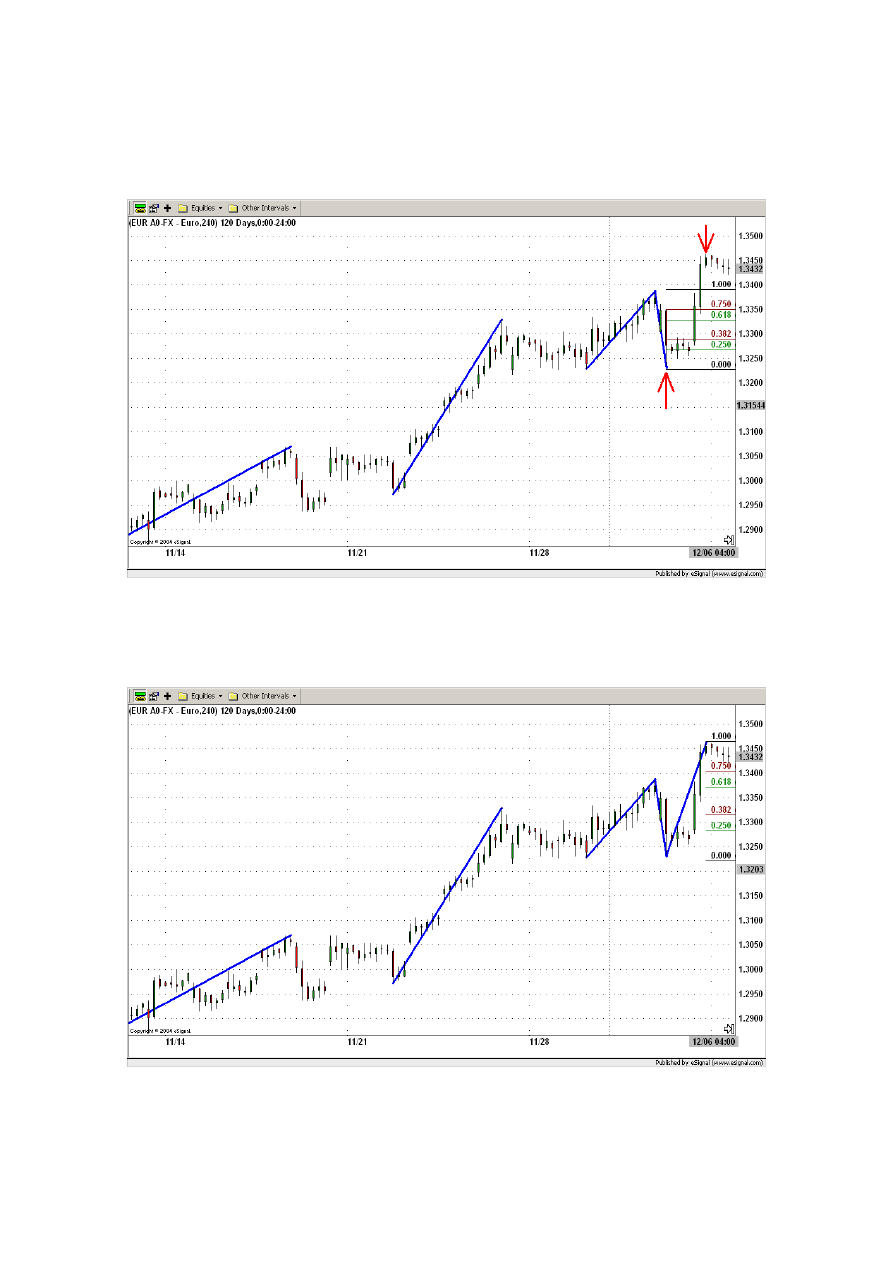
108
Around the 12/06/04 a new active wave has been recognized before an exit signal occurs.
The new active wave is represented by the upward movement starting on the 12/02/04
and ending on the 12/03/04. See Figure 7.30.
Figure 7.30.
New Fibonacci levels are drawn. The old ones are now inactive (see Figure 7.31).
Figure 7.31.
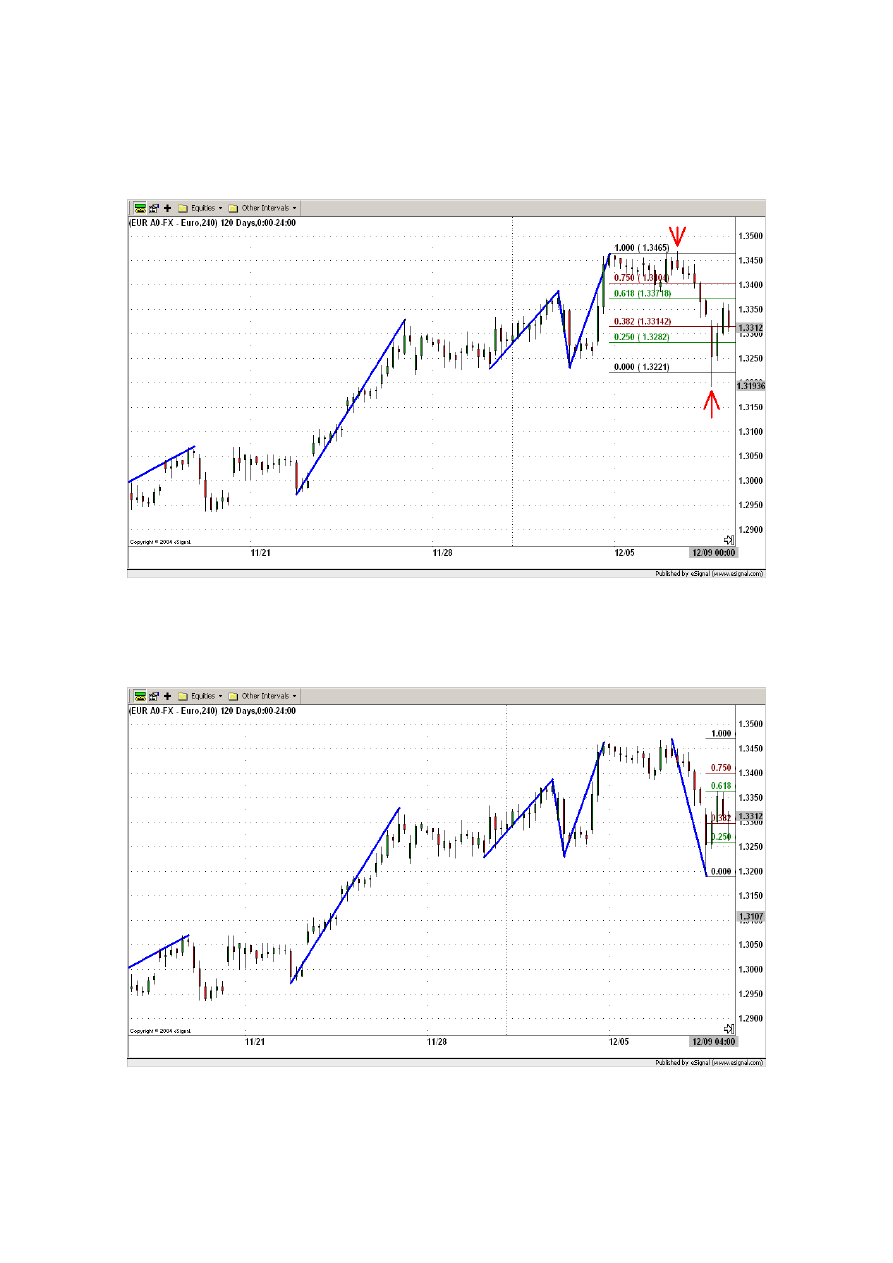
109
Around the 12/09/04 a new active wave has been recognized before an exit signal occurs.
The new active wave is represented by the upward movement starting on the 12/07/04
and ending on the 12/08/04. See Figure 7.32.
Figure 7.32.
New Fibonacci levels are drawn. The old ones are now inactive (see Figure 7.33).
Figure 7.33.
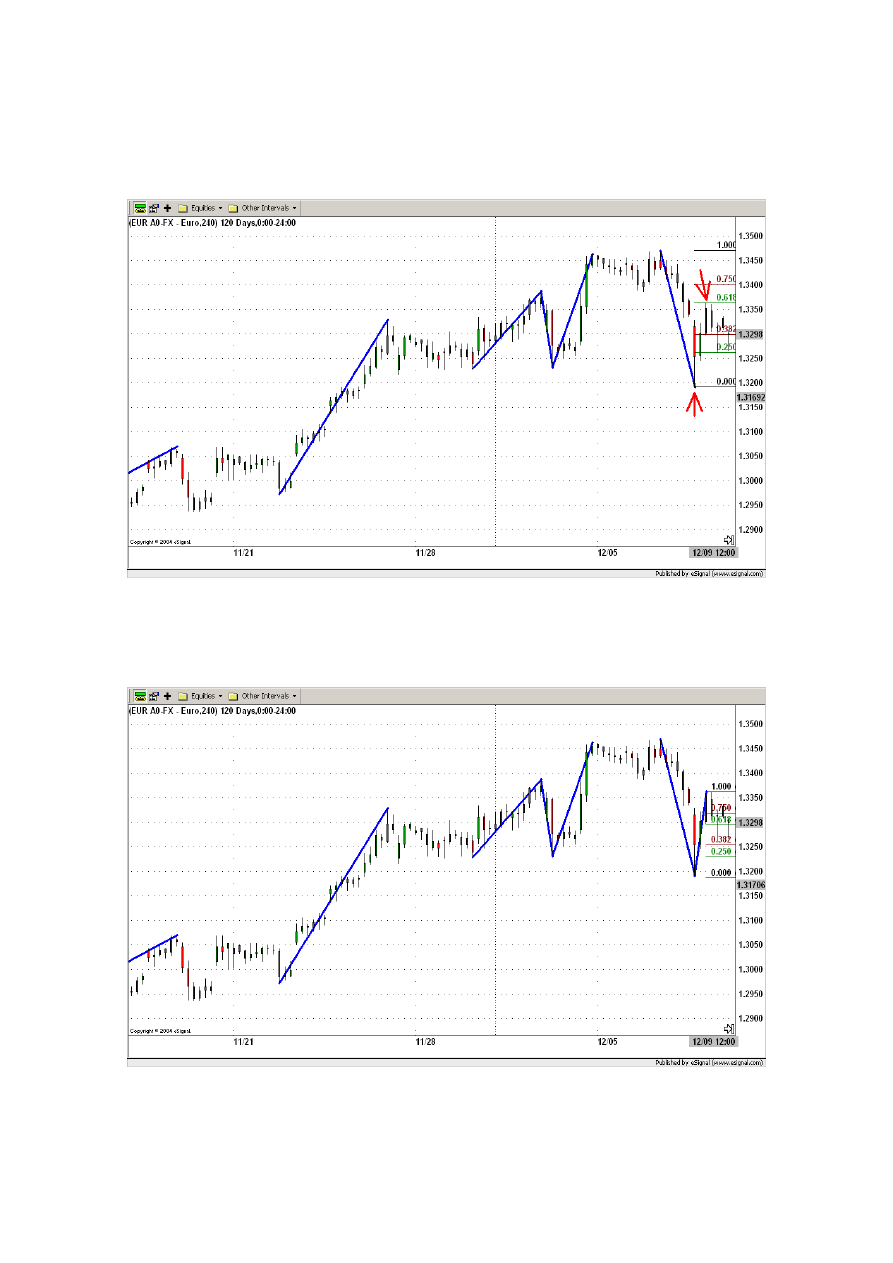
110
The same day a little bit later a new active wave has been recognized before an exit signal
occurs. The new active wave is represented by the upward movement starting on the
12/09/04 and ending on the 12/09/04. See Figure 7.34.
Figure 7.34.
New Fibonacci levels are drawn. The old ones are now inactive (see Figure 7.35).
Figure 7.35.
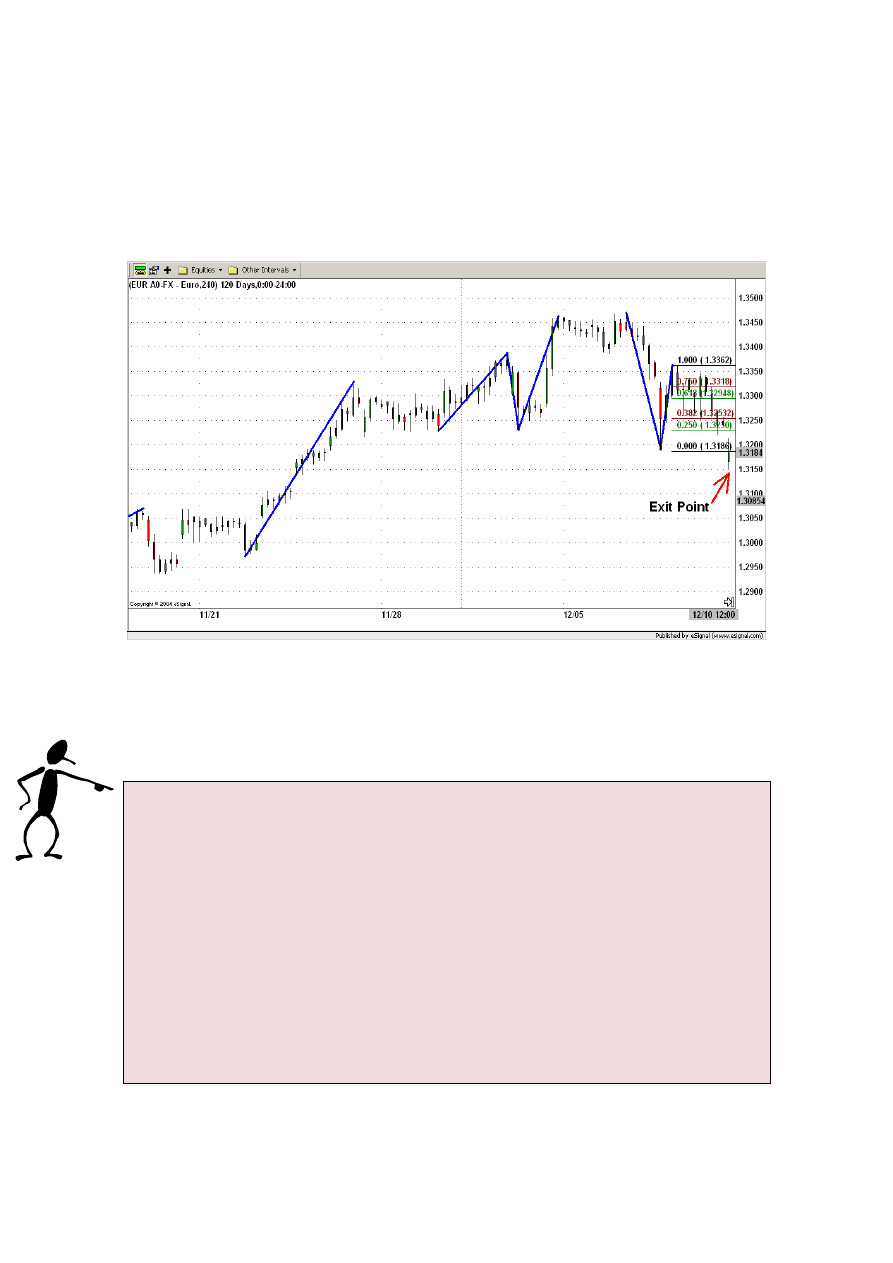
111
The market trend starts to reverse. At 12:00 on the 12/10/04 the candlestick is below the
lower confirmation level (Fibonacci level 0.250). Since the active wave had a upward
movement and the candlestick is below the lower confirmation level we identify the
active wave as an upward corrective wave. As explained in the chapter 3. “Intraday
ICWR Trading Rules” this is a bearish signal. See Figure 7.36.
Figure 7.36.
Because of the bearish signal the position is exited at 12:00 on the12/10/04 buying 10,000
USD for the price of 1.3184.
At the end using the Long-Term ICWR Trading Rules a profit of
723 pips= (1.3184 – 1.2461) = 0.0723
was achieved (see Figure 7.37).
Using a 1:20 leverage this means
10,000 USD x (0.0723 pips) x 20 leverage = 14,460 USD!
A profit of 14,460 USD after two months using the Long-Term ICWR Trading
Rules!
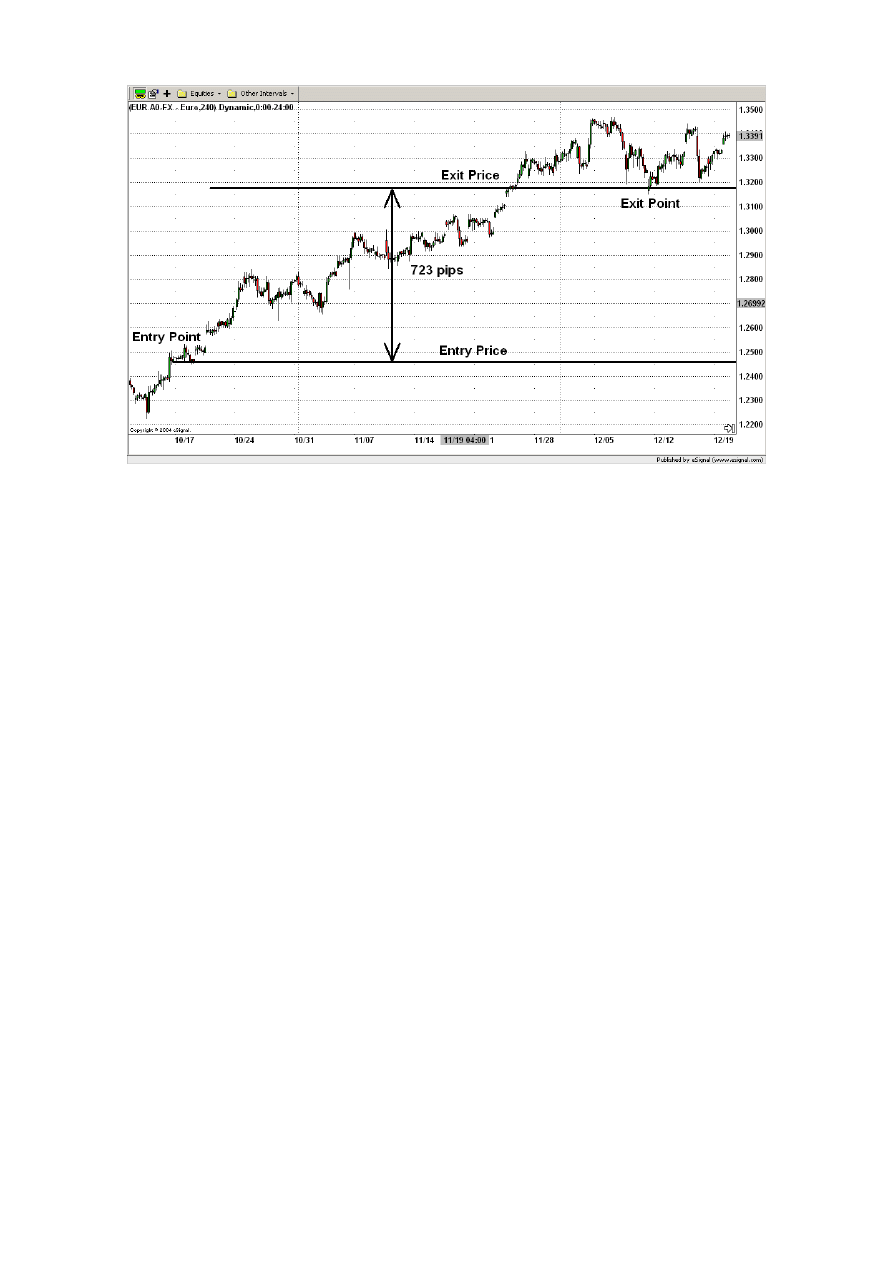
112
Figure 7.37.
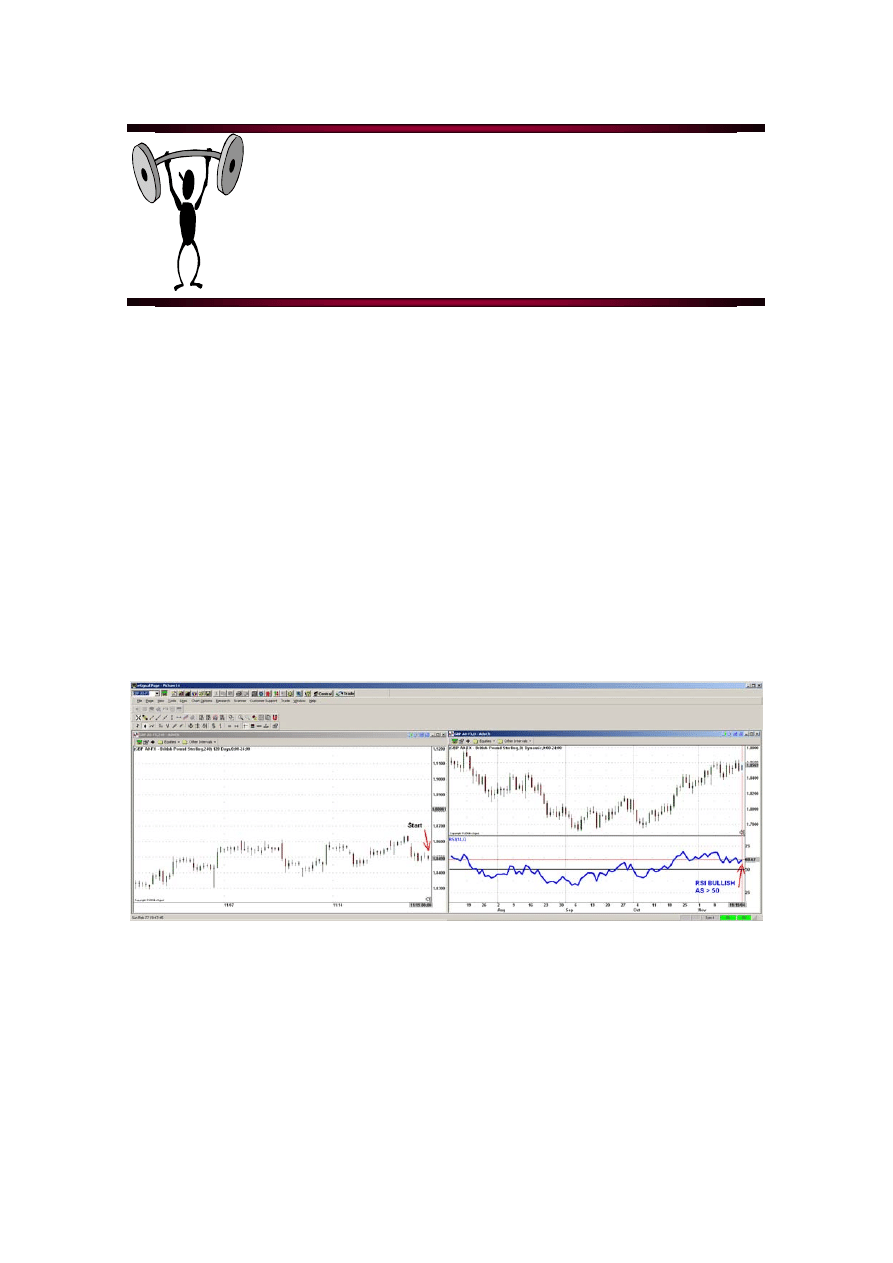
113
Chapter 8
Long-Term GBP/USD
Trading Example
In this example we are going to trade GBP/USD.
Ok, before we start our trading day we need to set up our screens (see Figure 8.1). On the
left screen we are going to place a 4 hours candlestick chart and on the right screen a one
day candlestick chart together with the 14-period RSI (thick blue line). The charting
software usually pictures the RSI automatically together with the 30 and 70 lines (below
30 represents oversold, above 70 overbought). In our case we are not looking for oversold
or overbought signals. We are looking for the market being bullish or bearish. This is
represented by RSI being above 50 (bullish) or below 50 (bearish). So we only need to
draw the 50 centerline (black line).
Figure 8.1.
Now we are ready to start. Suppose you started your trading day on the 11/19/04 at 08:00.
At that time the price was 1.8490. As you can see from the right screen the RSI is above
50 and therefore bullish. So at least today we are looking only for a bullish signal for
entering long the market.
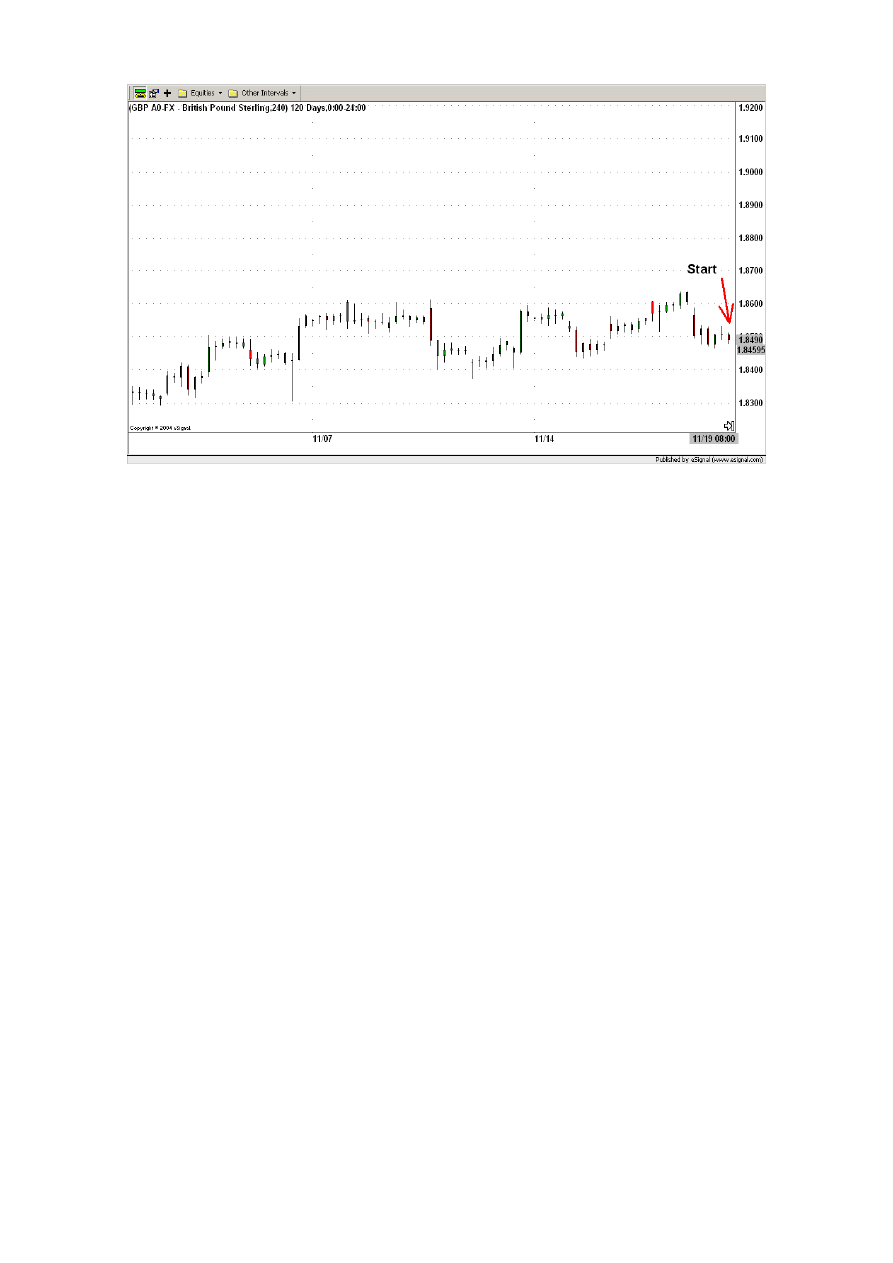
114
Figure 8.2.
Next thing to do is to recognize the active wave. For that, we are going to look for the
nearest market movement to our starting position with a height greater than 150 pips.
Ok, in order to find the active wave the following steps are to be done:
First all possible waves (black lines) are drawn connecting the high value of the starting
point with the low value of the ending point and then the waves are enumerated starting
with the nearest wave to the actual time (see Figure 8.3).
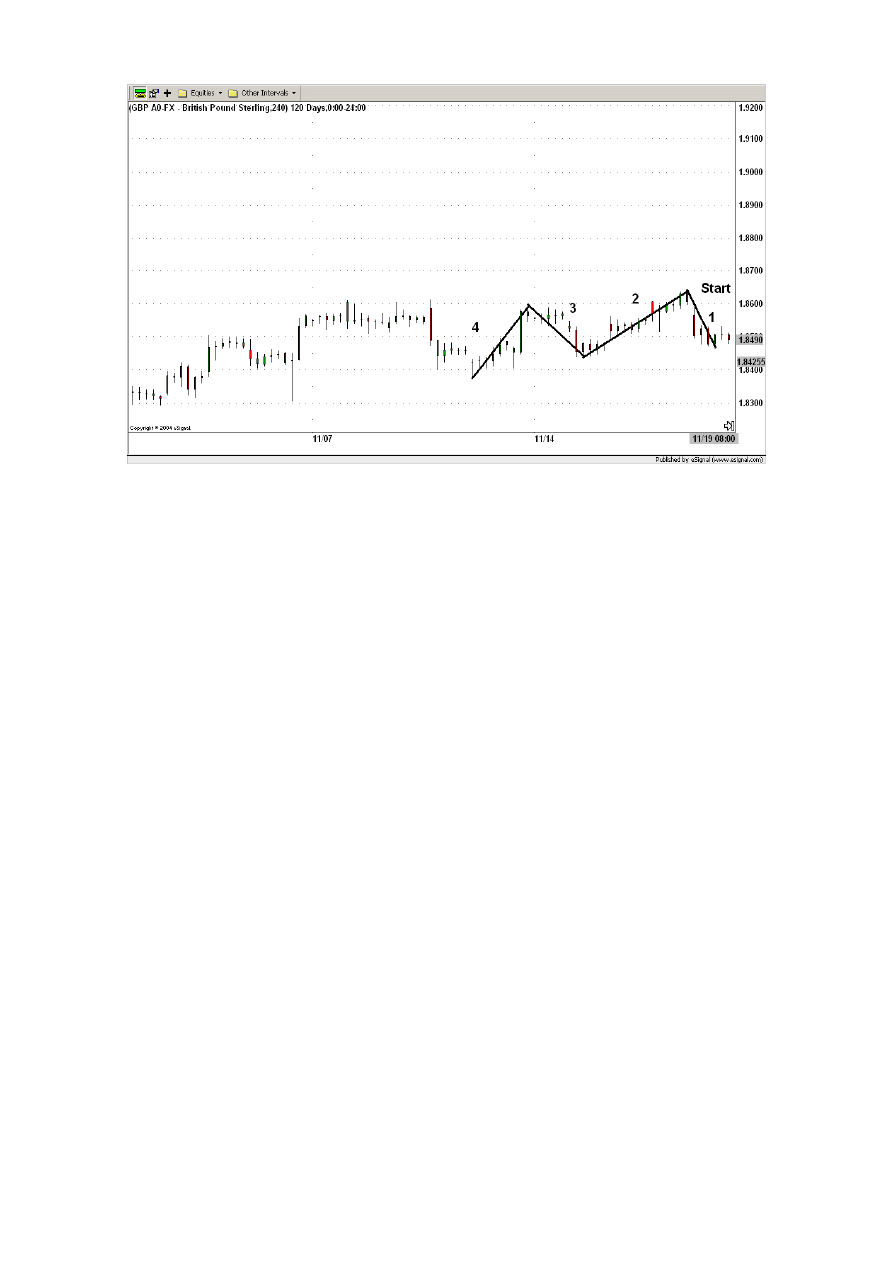
115
Figure 8.3.
Second read the extreme values of each wave and calculate its height.
Wave 1:
High = 1.8636; Low = 1.8464;
Height = High – Low = 1.8636– 1.8464= 0.0172 = 172 pips
Wave 2:
High = 1.8636; Low = 1.8435;
Height = High – Low = 1.8636– 1.8435= 0.0201 = 201 pips
Wave 3:
High = 1.8596; Low = 1.8435;
Height = High – Low = 1.8596– 1.8435= 0.0161 = 161 pips
Wave 4:
High = 1.8596; Low = 1.8372;
Height = High – Low = 1.8596– 1.8372= 0.0224 = 224 pips
The nearest movement to our starting position with a height greater than 150 pips is the
wave 1. So that’s our active wave now. Throughout our trading we are not going to pay
attention to movements with a height below 150 pips .
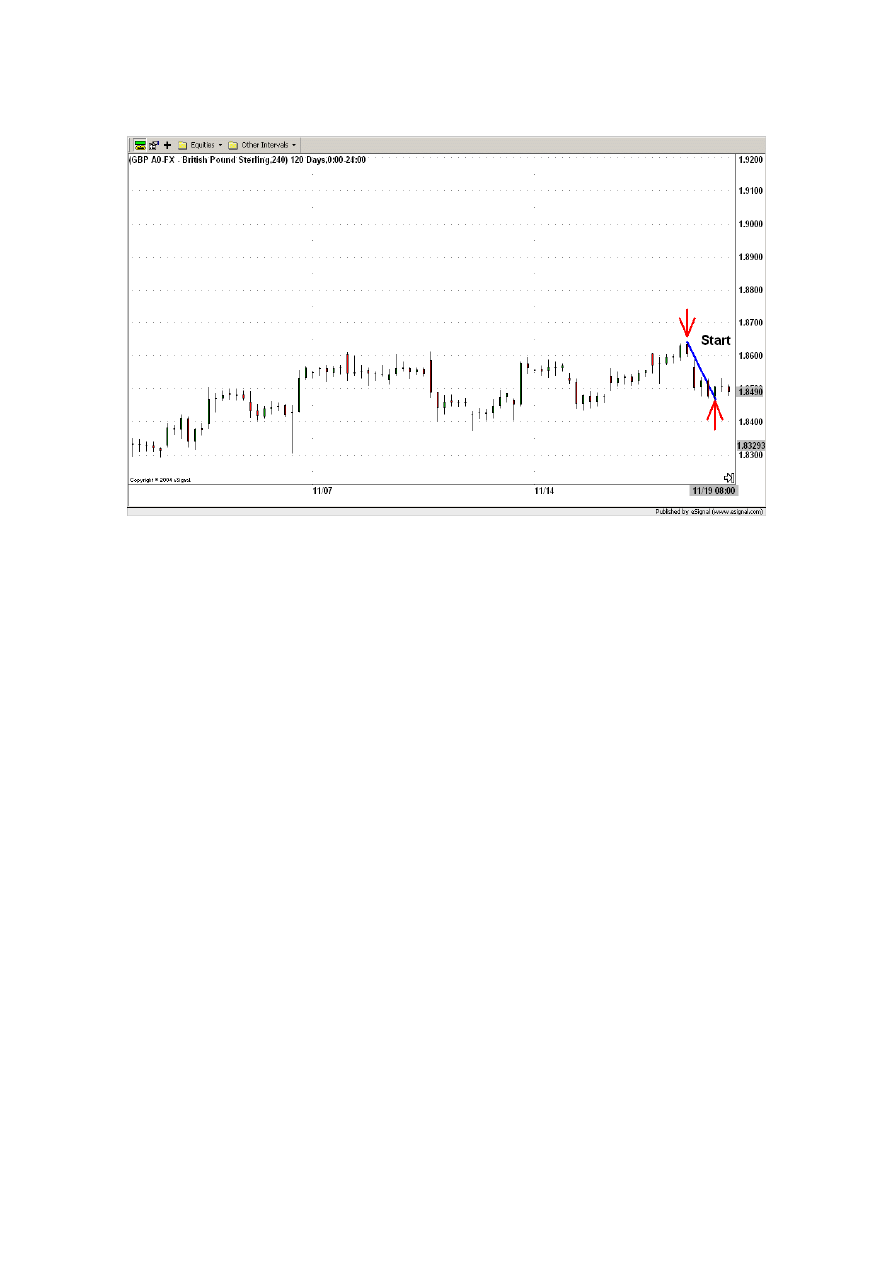
116
The wave 1 is now our current active wave (see blue line in Figure 8.4).
Figure 8.4.
The task is now to apply the Long-Term ICWR Trading Rules.
That means, first the Fibonacci levels 0.000, 0.250, 0.382, 0.682, 0.750 and 1.000 are
inserted using the low as the starting point (level 0.000) and the high as the ending point
(level 1.000). The levels between 0.382 and 0.618 define the retracement channel. The
levels 0.250 and 0.750 define the confirmation levels. See Figure 8.5.
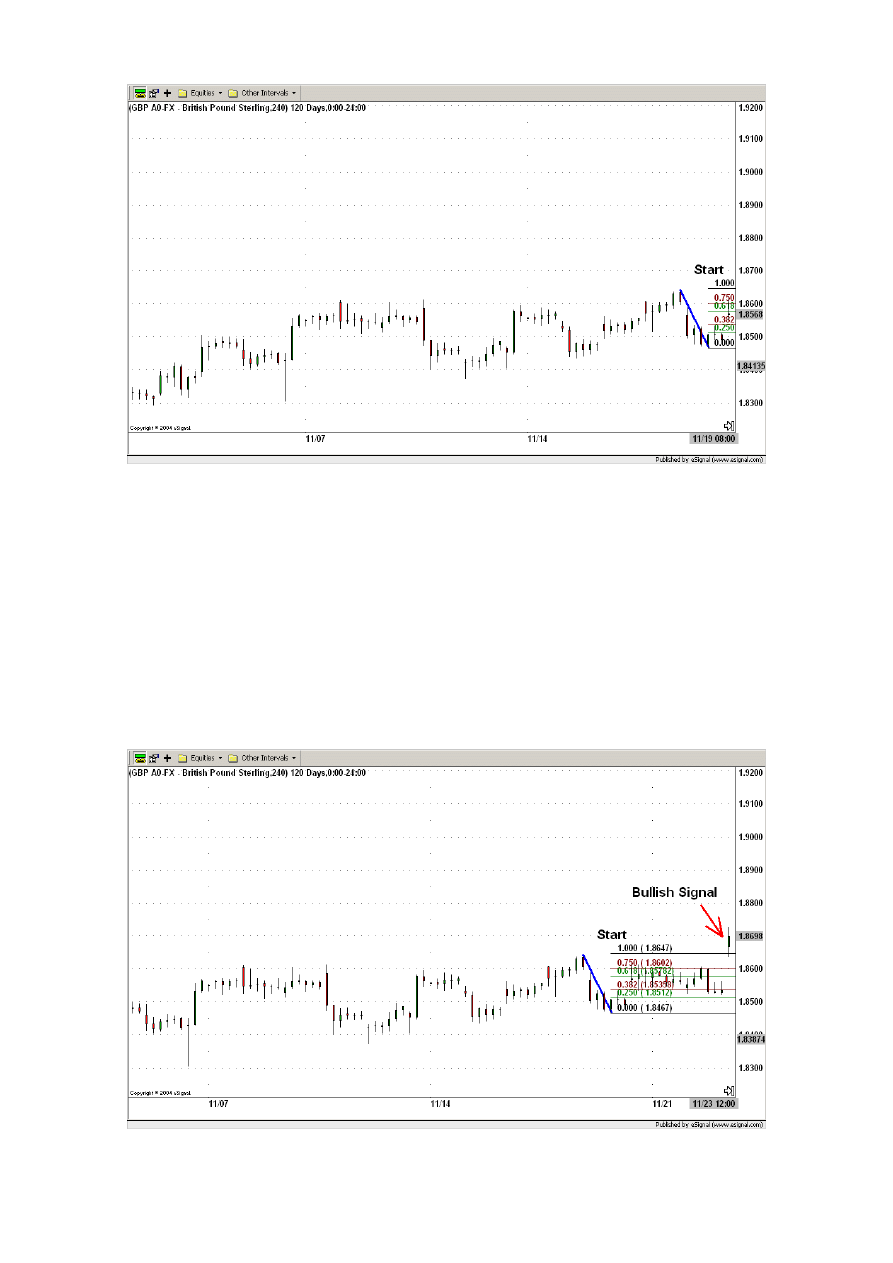
117
Figure 8.5.
Ok, the Fibonacci levels are placed, now it’s about to see what the market is telling us
At 12:00 on the 11/23/04 the candlestick is above the upper confirmation level (Fibonacci
level 0.750). Since the active wave had a downward movement and the candlestick is
above the upper confirmation level we identify the active wave as an upward corrective
wave. As explained in the chapter 3. “Intraday ICWR Trading Rules” this is a bullish
signal. See Figure 8.6.
Figure 8.6.
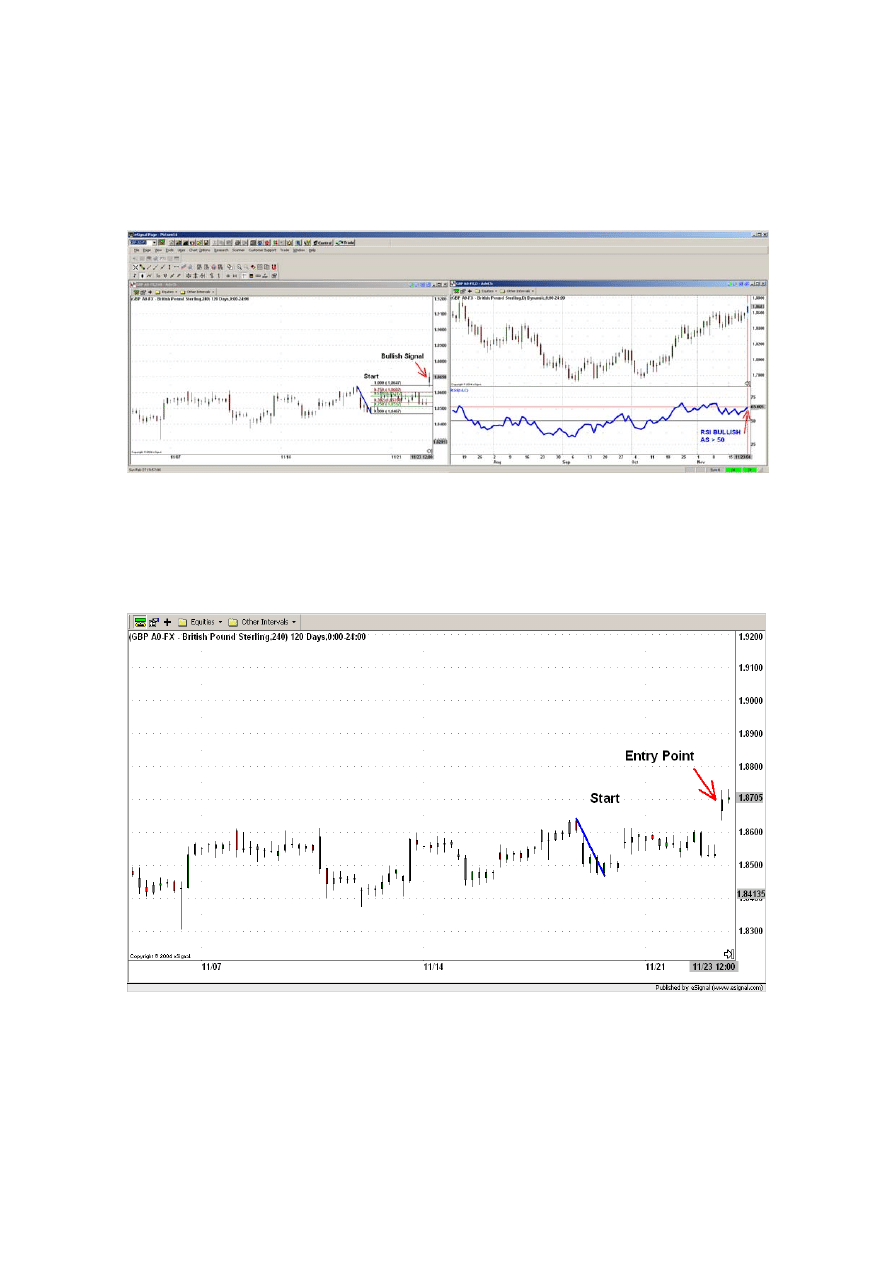
118
This bullish signal must be confirmed with the Relative Strength Index. If the RSI is
greater than 50, it’s bullish and we enter the market. If RSI is less than 50, it’s bearish, so
it’s opposite and we do not enter the market. Today the RSI (see blue line in Figure 8.7) is
above the 50 centerline (black line) and therefore bullish.
Figure 8.7.
As both signals are bullish we enter the trade at 12:00 on the 11/23/04 at the price of
1.8698. For example we sell 10,000 USD for the price of 1.8698. See Figure 8.8.
Figure 8.8.
Ok, now it’s about to find how far we will let the market move before we exit our
position.
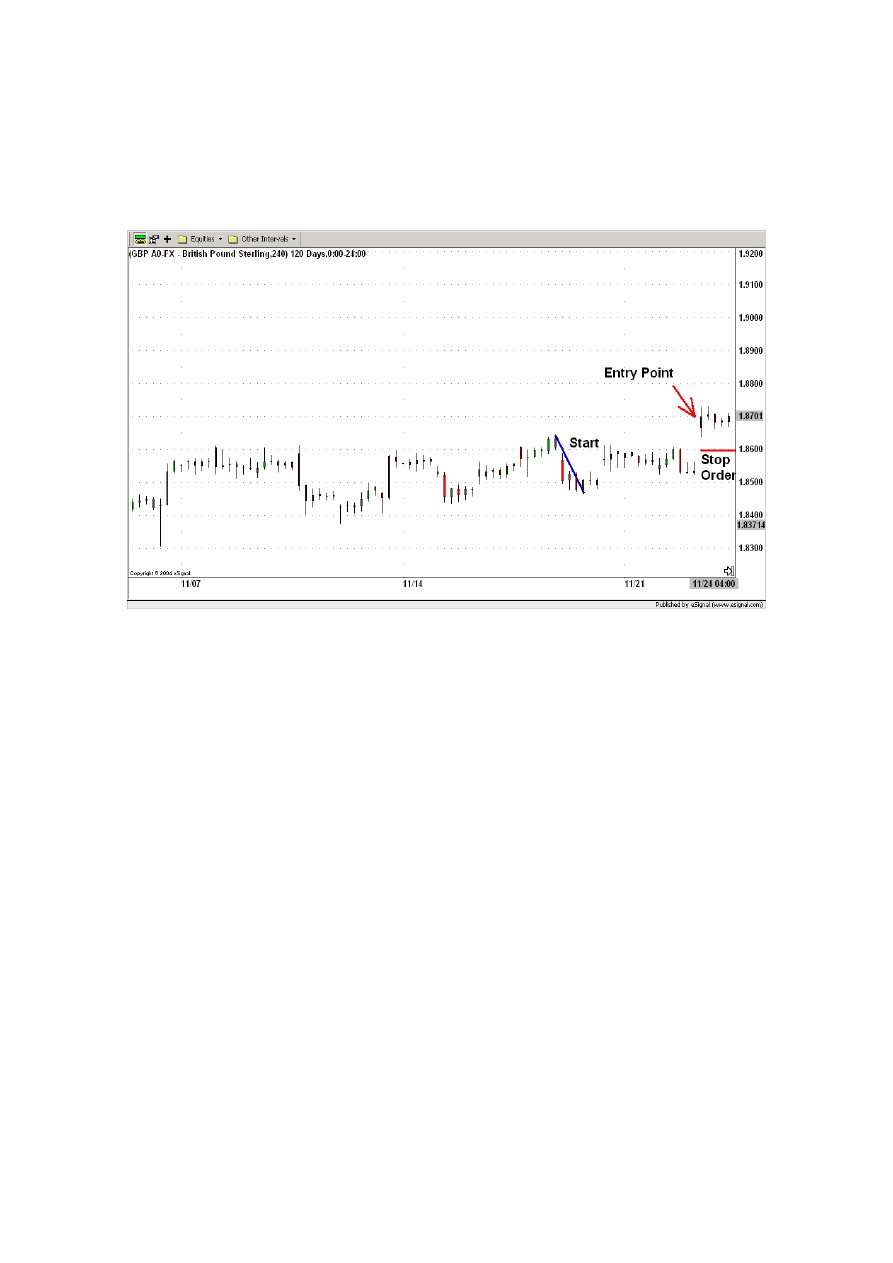
119
First of all we place a stop order 100 pips below the entry price. That means at 1.8698-
0.0100 = 1.8598. It’s represented by the thick red horizontal line in the picture below (see
Figure 8.9). Please notice, as said before, that the hard stop order is only for the sake of
security, because we do not want to loose more than 100 pips in one trade.
Figure 8.9.
In fact, our main exit strategy is to look for an opposite signal generated by an
impulsive/corrective wave retracement (in the same manner as for the entry warning
signal).
In this example we are looking for a bearish signal as we entered long the market. The
task is to look for a whole candlestick being below the lower confirmation level (after
having entered the retracement channel in the case of an impulsive wave). If this happens
we exit the position. Every time a new wave is recognized, new Fibonacci levels are
drawn and the old Fibonacci levels get inactive. This procedure is repeated until an exit
signal occurs.
Ok, let’s look to our opened position. Between 10/15/04 and the 10/26/04 no bearish
signal occurs. So, we don’t exit the trade. Remember the bearish signal is in this example
the exit signal.
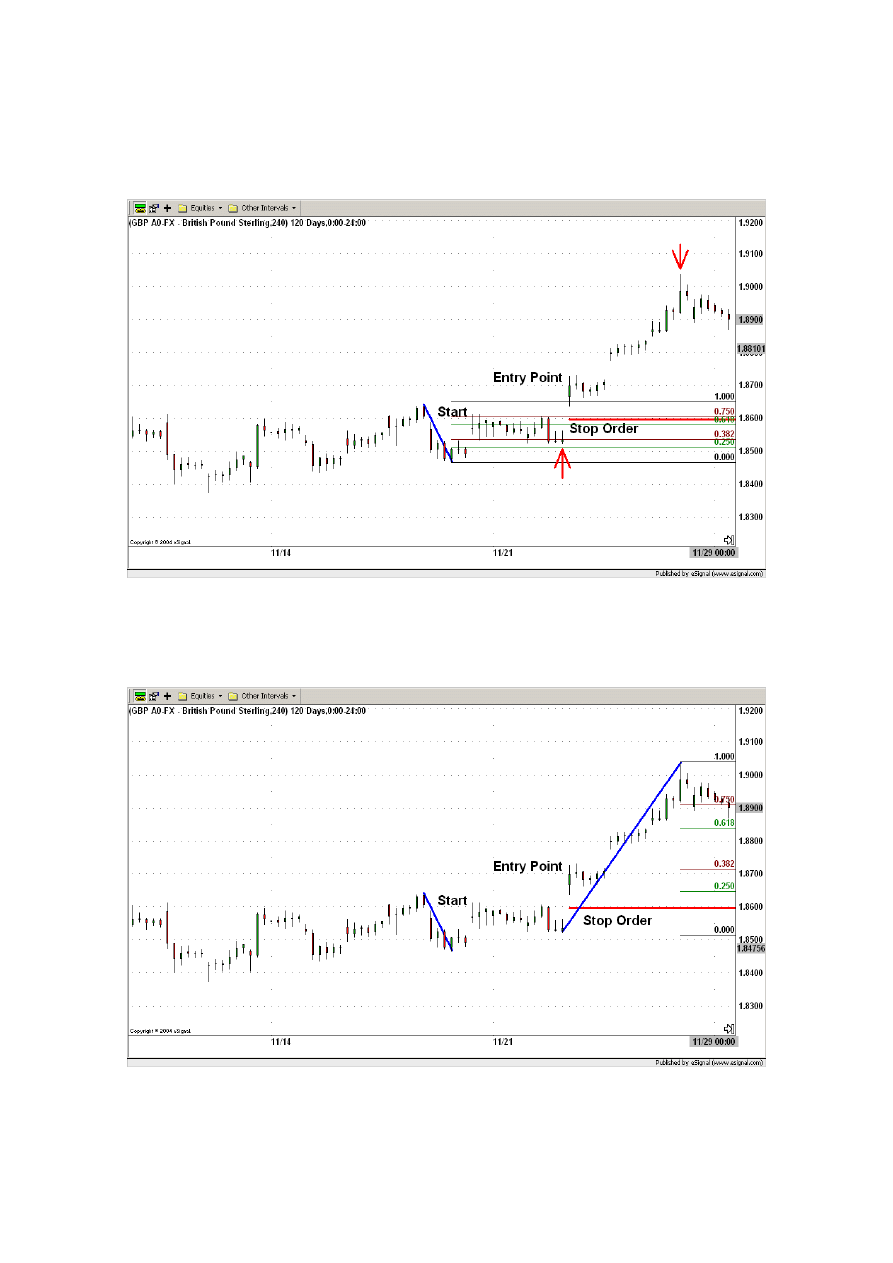
120
Around the 11/28/04 we recognize a new active wave represented by the upward
movement starting the 11/23/04 and ending the 11/26/04. The beginning and the end of
the new active wave are marked with red arrows in Figure 8.10.
Figure 8.10.
New Fibonacci levels are drawn. The old ones are now inactive (see Figure 8.11).
Figure 8.11.
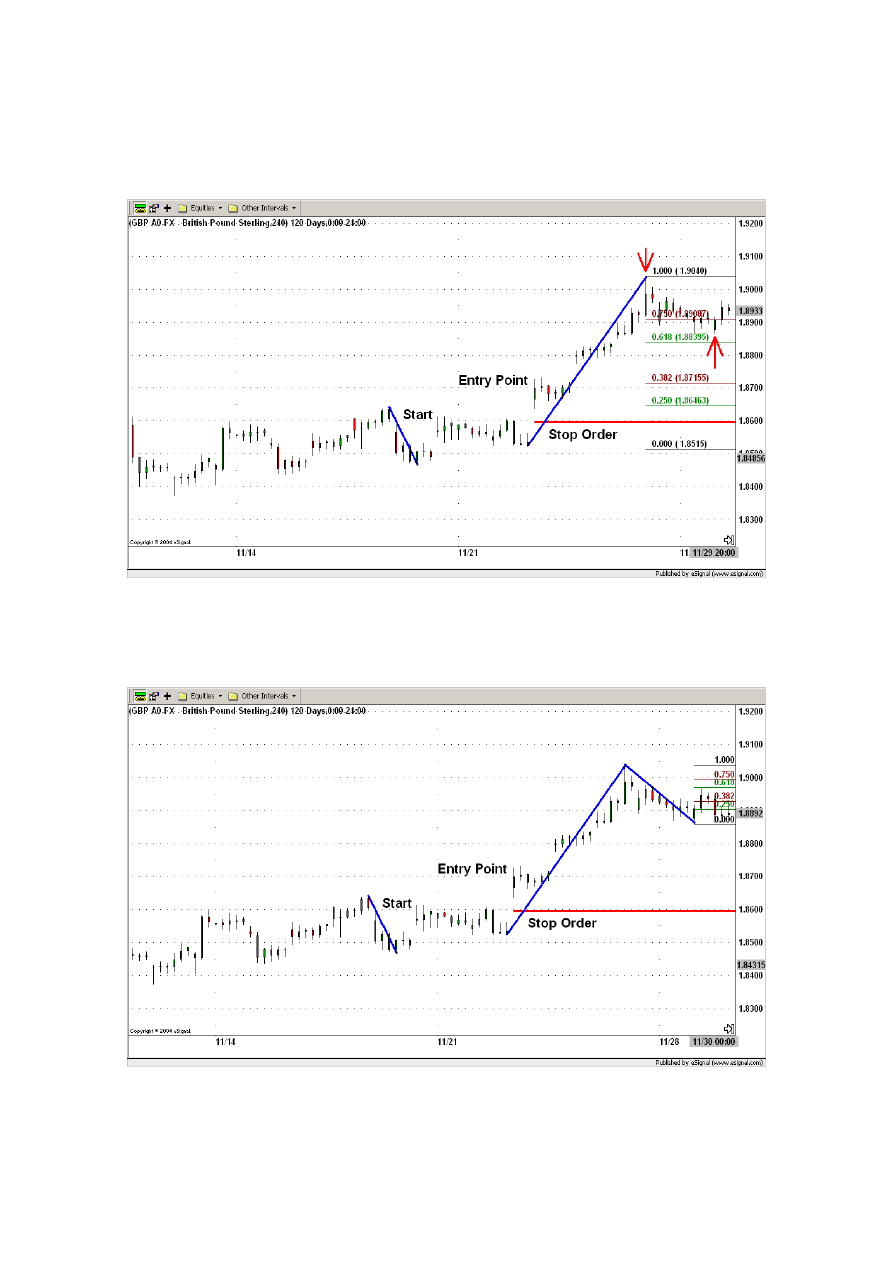
121
For this active wave no exit signal occurrs. Instead around the 11/29/04 we recognize a
new active wave represented by the downward movement starting on the 11/26/04 and
ending on the 11/29/04. See Figure 8.12.
Figure 8.12.
New Fibonacci levels are drawn. The old ones are now inactive (see Figure 8.13).
Figure 8.13.
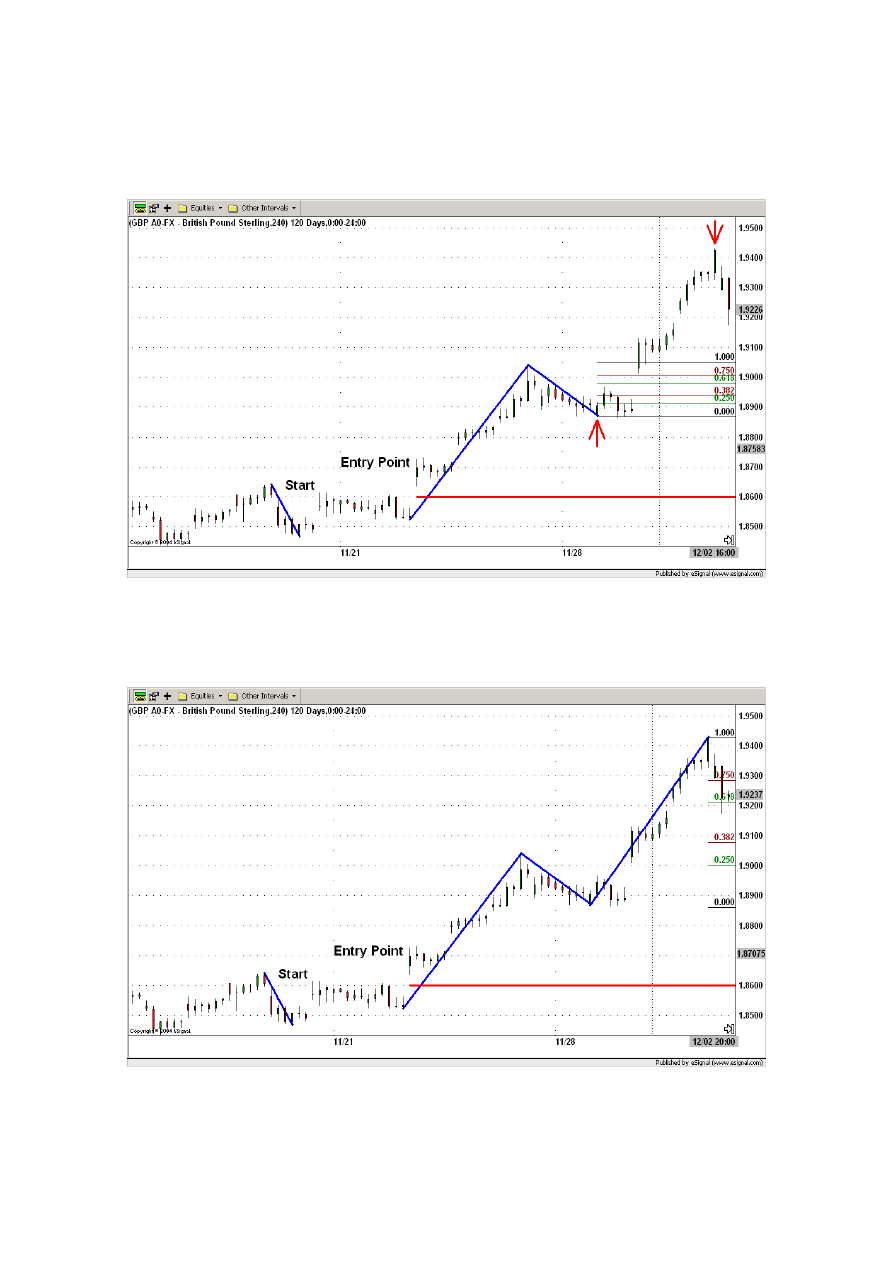
122
Around the 12/02/04 a new active wave has been recognized before an exit signal occurs.
The new active wave is represented by the upward movement starting on the 11/29/04
and ending on the 12/02/04. See Figure 8.14.
Figure 8.14.
New Fibonacci levels are drawn. The old ones are now inactive (see Figure 8.15).
Figure 8.15.
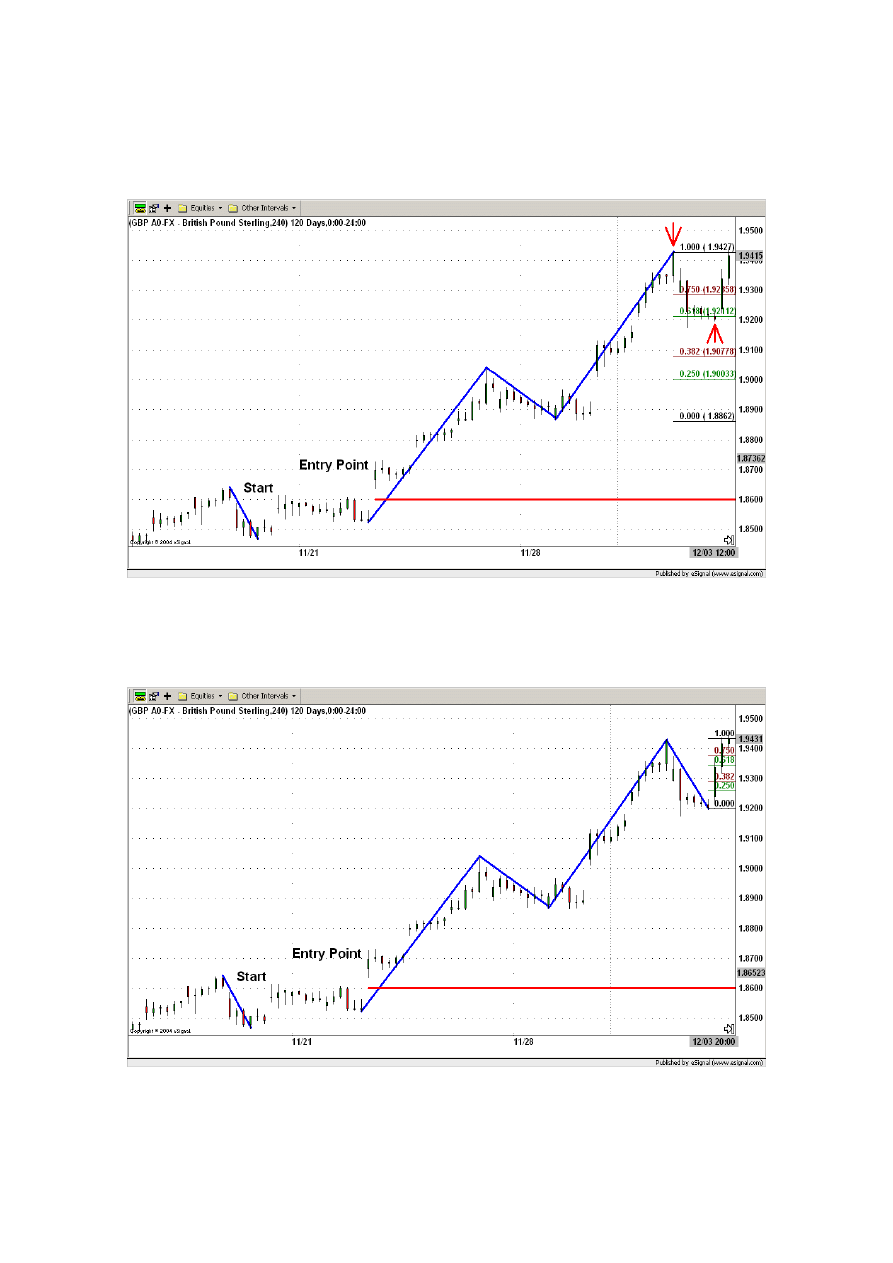
123
Around the 12/03/04 a new active wave has been recognized before an exit signal occurs.
The new active wave is represented by the downward movement starting on the 12/01/04
and ending on the 12/03/04. See Figure 8.16.
Figure 8.16.
New Fibonacci levels are drawn. The old ones are now inactive (see Figure 8.17).
Figure 8.17.
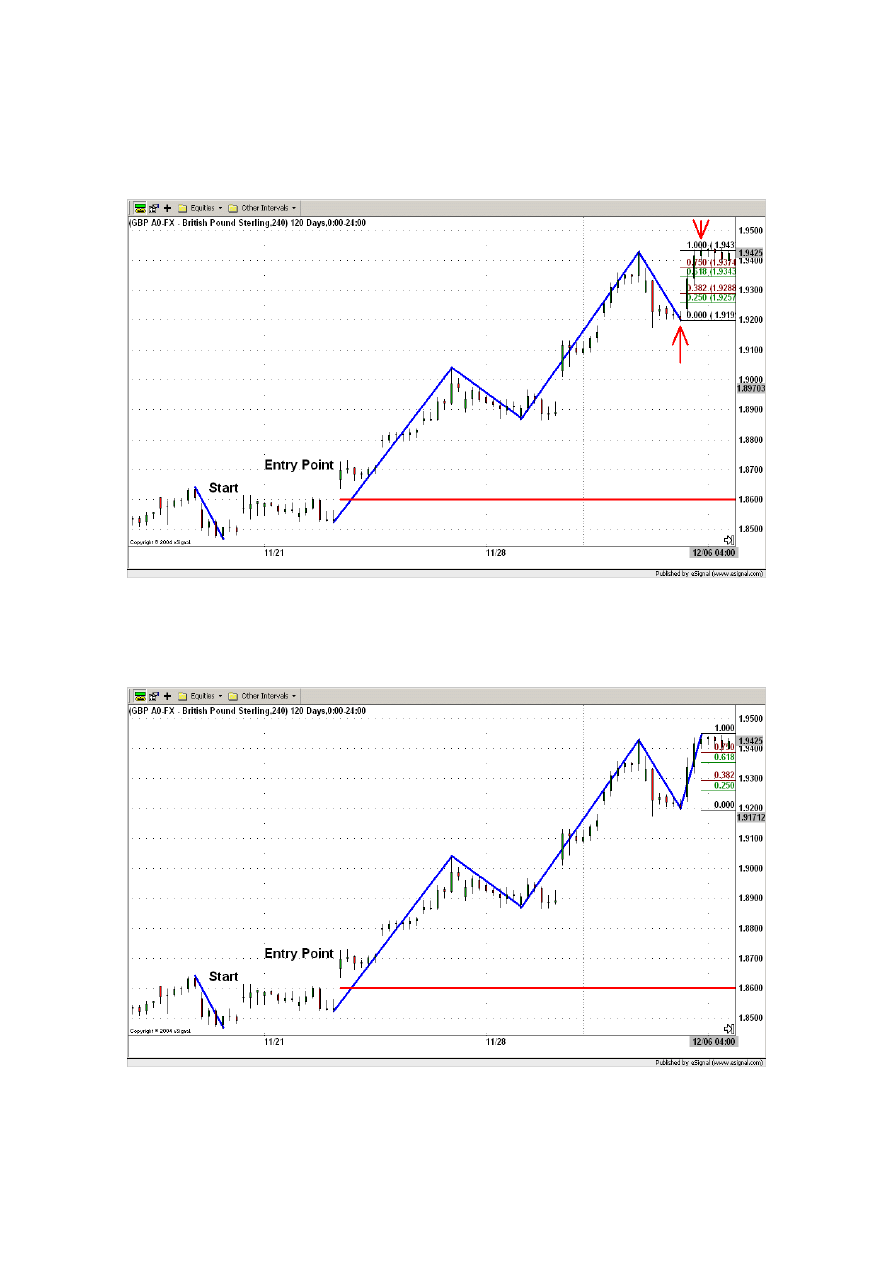
124
Around the 12/06/04 a new active wave has been recognized before an exit signal occurs.
The new active wave is represented by the upward movement starting on the 12/03/04
and ending on the 12/03/04. See Figure 8.18.
Figure 8.18.
New Fibonacci levels are drawn. The old ones are now inactive (see Figure 8.19).
Figure 8.19.
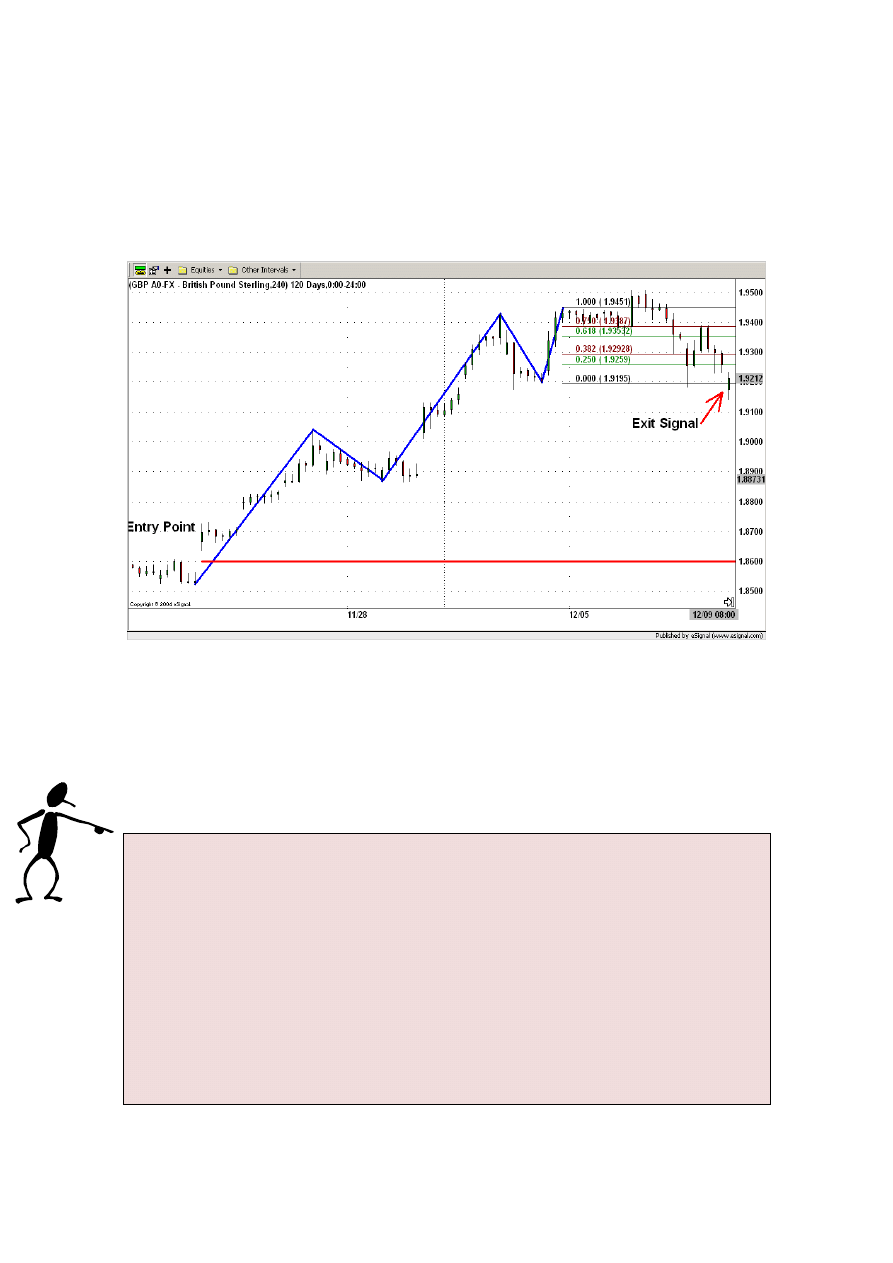
125
The market trend starts to reverse (see Figure 8.20). At 08:00 on the 12/09/04 the
candlestick is below the lower confirmation level (Fibonacci level 0.250). Since the active
wave had a upward movement and the candlestick is below the lower confirmation level
we identify the active wave as an upward corrective wave. As explained in the chapter 3.
“Intraday ICWR Trading Rules” this is a bearish signal.
Figure 8.20.
Because of the bearish signal the position is exited at 12:00 on the12/09/04 buying 10,000
USD for the price of 1.9212.
At the end using the Long-Term ICWR Trading Rules a profit of
514 pips= (1.9212 – 1.8698) = 0.0514
was achieved (see Figure 8.21).
Using a 1:20 leverage this means
10,000 USD x (0.0514 pips) x 20 leverage = 10,280 USD!
A profit of 10,280 USD after 20 days using the Long-Term ICWR Trading Rules!
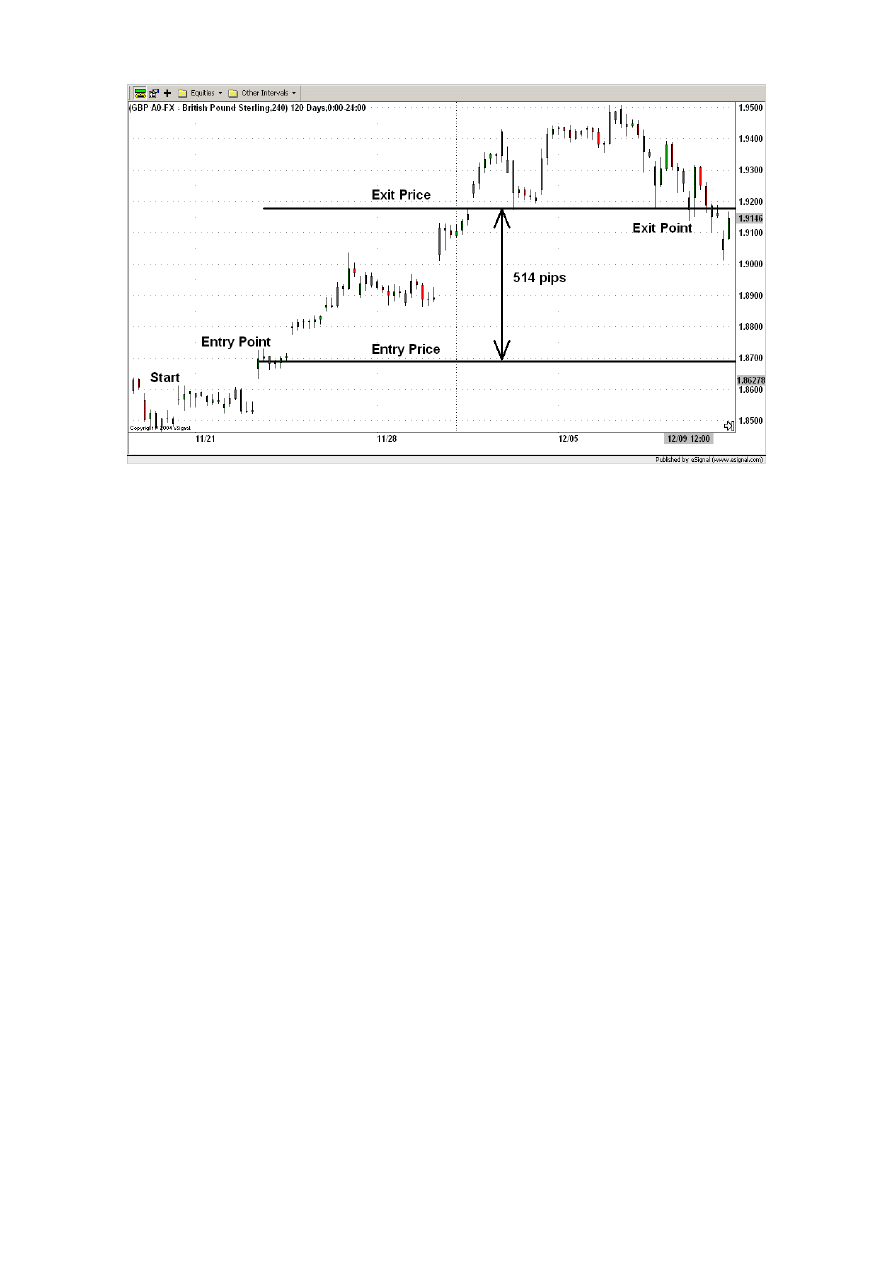
126
Figure 8.21.
Wyszukiwarka
Podobne podstrony:
Forex Trading Strategy Learn how to day tradeswing trade major currency pairs(1)
11 FOREX Trading Strategies
Trading Forex trading strategies Cashing in on short term currency trends
Fibonacci Practical Fibonacci Methode For Forex Trading
1fta Forex Trading Course
Avoiding mistakes in forex trading forextrader
Encyclopedia of Trading Strategies
Forex Trading Guide
Introduction To Forex Trading
Introduction To Forex Trading
FOREX Systems Research Practical Fibonacci Methods For Forex Trading 2005
BASIC FOREX TRADING GUIDE Ebook Nieznany
LEAPS Trading Strategies Powerful Techniques for Options Trading Success with Marty Kearney
80 Trading strategies id 47247 Nieznany (2)
więcej podobnych podstron