
Practical Analysis Techniques of Polymer Fillers by
Fourier Transform Infrared Spectroscopy (FTIR)
Barbara J. Coles, Caryn J. Hall
Hauser, Inc.
ABSTRACT
The identification of polymers by FTIR is often complicated by the presence of fillers. How-
ever for kaolin clay, an FTIR analysis should be able to identify the filler and predict its con-
centration using a standard curve. The resulting percentage is more reliable than a simple ash,
which may change the chemical composition of the filler.
INTRODUCTION
In the growing plastics industry, there is often need to identify polymer formulations.
Whether the analysis is done to reproduce the material, identify another supplier, or provide
insight into the cause of failure, the filler is an important aspect. Fillers are used for several
reasons; to extend the amount of polymer for overall cost reduction, to add structural stability
or impart specific physical characteristics to the polymer such as chemical, temperature, or
flame resistance, or to add color to a polymer. Several commonly occurring fillers include:
silicates, aluminum trihydrate, calcium carbonate, fiberglass, and talc. These fillers have
characteristic FTIR bands which can be easily identified within a spectrum of the polymer.
The amount of filler present in the formulation can be of great importance to the performance
of the polymer.
THEORY
FTIR is a powerful analytical tool. Not only does it provide qualitative identification, but also
quantitative information. The use of FTIR to quantify the amount of filler present in a poly-
mer formulation should follow Beer's Law:
A = abc
where: A = absorbance, a = absorptivity (a constant specific to the material), b = thickness of
sample, c = concentration.
The challenge in FTIR quantitative analysis of polymers is the thickness of the sample.
The use of peak ratios standardizes the absorbance signal and eliminates the thickness vari-
able. Attenuated total reflectance (ATR) and microscope FTIR were the two methods chosen
to acquire the FTIR spectra. The filler content in the polymer was confirmed by ashing.
DESCRIPTION OF EQUIPMENT AND PROCESS
An Analect Diamond 20 FTIR with ATR attachment equipped with a KRS-5 45
o
crystal as
well as a XAD-Plus Microscope attachment was used to acquire the FTIR spectra.
Kaolin powder was chosen for its peaks by microscope FTIR at 3695, 3668, 3652, 3618,
1115, 1032, 1008, 937, and 913 cm
-1
as well as its distinctive shape above 3600 cm
-1
and in the
192
Coloring Technology for Plastics
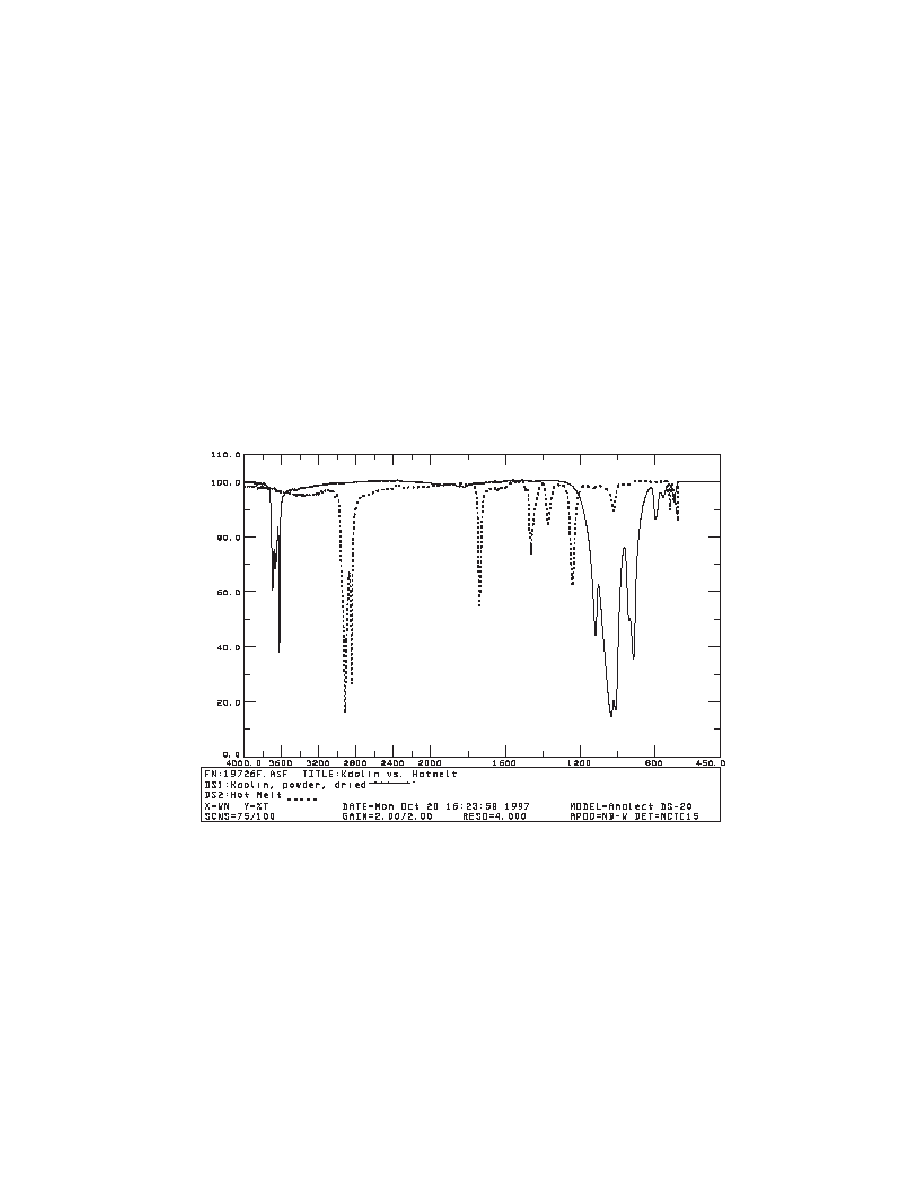
Figure 1. FTIR microscope spectra of kaolin vs. polyethylene vinyl acetate.
fingerprint region. Kaolin also has a distinctive peak around 540 cm
-1
in ATR spectra. A hot
melt (polyethylene/vinyl acetate) was chosen because of the relative lack of interferences
with kaolin (see Figure 1) and the ability to easily mix various amounts of filler.
Fourier Transform Infrared Spectroscopy
193
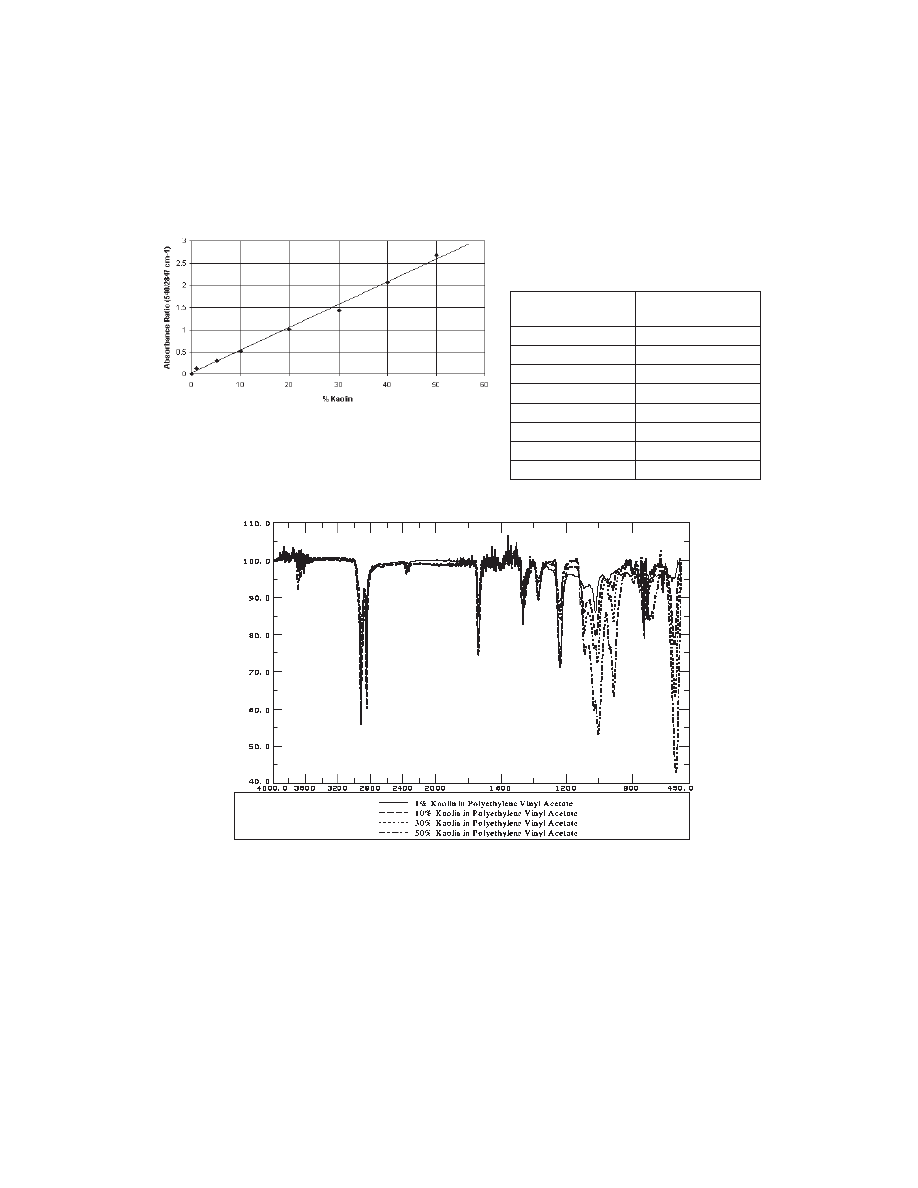
Figure 2. Standard curve for % kaolin vs. absorbance ratio
(slope=0.0514, intercept=0.0118, R
2
=0.995.
Table 1. Summary of results of
ashing prepared samples
Calculated %
kaolin in hot melt
Average % ash of
samples at 500
o
C
0
0.03
1
0.80
5
4.19
10
8.47
20
17.68
30
26.61
40
35.59
50
44.74
Figure 3. ATR spectra for 1, 10, 30, and 50% kaolin in PVAc.
The standards were prepared by weighing appropriate amounts of kaolin and hot melt
into aluminum dishes to achieve filler percentages of 0, 1, 5, 10, 20, 30, 40, and 50%. The alu-
minum dishes were then heated on a hot plate to 128
o
C to melt the hot melt. The kaolin and
hot melt were then mixed together and formed into thick films using an 8 mil draw down bar
on silicone release paper. Portions of the films were cut and analyzed by both ATR and Micro-
scope FTIR and portions were ashed at 500
o
C in a muffle furnace overnight and allowed to
cool in a desiccator.
PRESENTATION OF DATA AND RESULTS
ATR was the most consistent tool to obtain a good correlation of peak ratios to percent filler.
We obtained a standard curve with an R squared value of 0.995 using the kaolin peak at 540
cm
-1
and the CH
2
stretch of polyethylene vinyl acetate at 2847 cm
-1
. The standard curve is
shown in Figure 2 and the overlay of the ATR spectra for 1 to 50% filler is shown in Figure 3.
Summary of results of the ashing of the samples is shown in Table 1.
194
Coloring Technology for Plastics
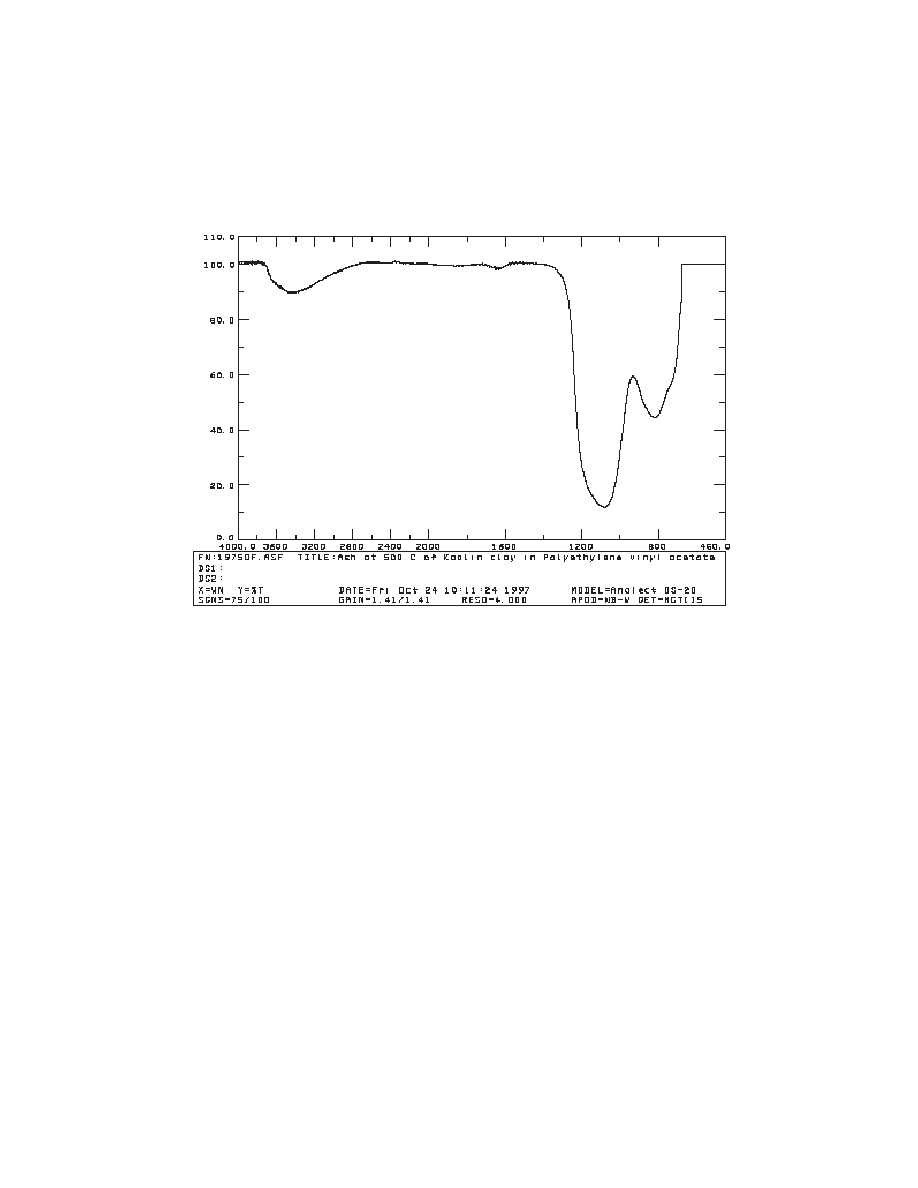
Figure 4. FTIR microscope spectrum of ashed (500
o
C) kaolin in PVAc.

INTERPRETATION OF DATA
The microscope FTIR, while providing better resolution of kaolin, did not have a large
enough sampling area and so was subject to small shifts in concentration of filler within the
sample. ATR was not as sensitive to kaolin as microscope FTIR, but provided a larger sam-
pling area and more consistent results.
The ashing of the samples at 500
o
C produced an unanticipated event. Kaolin clay holds
water even when considered “bone dry.” This water was liberated from the clay when it was
ashed. Aluminum silicate underwent a partial transformation to aluminum oxide and silicon
oxide. Figure 4 is the FTIR spectrum of the ashed material. This raises a problem with simply
doing percent filler by ashing when the filler is kaolin clay; the results can be 12-20% low
based on percent water and degree of conversion. Also, FTIR of the ashed material could be
misinterpreted as silicates rather than aluminum silicate.
CONCLUSIONS
It is possible to predict percent kaolin by ATR examination. This method may also apply to
other fillers in polymers. It is important to identify the type of filler in polymers to get an ac-
curate picture of the polymer. However, care must be taken when a polymer is ashed then the
ash analyzed by FTIR as the composition of the filler could change during the ashing process.
An FTIR spectrum should be taken both before and after an ashing process.
REFERENCES
1
N. B. Colthup, L. H. Daly, S. E. Wiberley, Introduction to Infrared and Raman Spectroscopy. 3rd Ed. Boston:
Academic Press, Inc., 1990.
2
R. Gaechter, and H. Mueller, Plastics Additives Handbook. 2nd Ed. New York: Hanser, 1987.
A Primer on Colorful Additives
195
Wyszukiwarka
Podobne podstrony:
The Techniques of Astral Projection by Dr Douglas M Baker
Dream Yoga and the practice of Natural Light by Namkhai Norbu
Design of porous polymeric scaffolds by gas foaming
Analysis of Scared to Death of Dying Article by Herbert He
Thermal conductivity of polymers, glasses & ceramics by modulated dsc
The Dwale of Avagddu Being A Treatise on The Practice of Certain Sorceries by Jeffrey Wyndham
Theory of analyte extraction by selected porous polymer SPME
Assessment of cytotoxicity exerted by leaf extracts
Test 3 notes from 'Techniques for Clasroom Interaction' by Donn Byrne Longman
Fundamentals of Polymer Chemist Nieznany
Electrochemical properties for Journal of Polymer Science
Modeling of Polymer Processing and Properties
czynności obsługi technicznej honda civic gen 5 by asrock11
Huang et al 2009 Journal of Polymer Science Part A Polymer Chemistry
Induction of two cytochrome P450 genes, Cyp6a2 and Cyp6a8 of Drosophila melanogaster by caffeine
Characterization of Polymers
USŁUGI, World exports of commercial services by region and selected economy, 1994-04
Myth & Religion of The North by Turville Petre
więcej podobnych podstron