
J Comput Virol (2010) 6:181–195
DOI 10.1007/s11416-008-0096-y
E I C A R 2 0 0 8 E X T E N D E D V E R S I O N
Measuring virtual machine detection in malware using DSD tracer
Boris Lau
· Vanja Svajcer
Received: 20 January 2008 / Revised: 6 June 2008 / Accepted: 27 June 2008 / Published online: 5 August 2008
© Springer-Verlag France 2008
Abstract Most methods for detecting that a process is
running inside a virtual environment such as VMWare or
Microsoft Virtual PC are well known and the paper briefly
discusses the most common methods measured during the
research. The measurements are conducted over a representa-
tive set of malicious files, with special regards to packer code.
The results are broken down with respect to malware cate-
gory, families and various commercial and non-commercial
packers and presented in a graphical and tabular format.
The extent of virtual machine detection problem is estimated
based on the results of the research. The main subject of the
paper is measurement of actual usage of Virtual machine
detection methods in current malware. The research uses
DSD Tracer, a dynamic-static tracing system based on an
instrumented Bochs virtual machine. The system employs
tracing to produce traces of execution that can be scripted or
used as a basis for disassembly/emulation in IDA Pro when
combined with a customised version of IDAEmul (emula-
tor). The paper gives an overview of design and usage of
DSD Tracer.
1 Introduction
Virtual machine technology is not new. The concept was orig-
inally developed by IBM in the late fifties and early sixties
to allow sharing of resources on large and fast mainframe
computers of the day.
B. Lau (
B
)
· V. Svajcer
Sophoslabs, Sophos Plc, The Pentagon,
Abingdon Science Park, Abingdon OX14 3YP, UK
e-mail: boris.lau@sophos.com
V. Svajcer
e-mail: vanja.svajcer@sophos.com
With the increase of interest in virtualization and usage of
virtual machines in production environment the virtualiza-
tion technology has attracted a lot of attention from the virus
writers and computer security research community.
It is a well-known fact that virtualization technology was
adopted in its early stage by security researchers and anti-
virus laboratories. Virtual machines provide a powerful
malware analysis environment and are widely used in IT
security community. Anti-virus researchers were one of the
early adopters of the technology as early as 1999.
Soon after the initial adoption period, it became clear that
many anti-virus companies are using virtualisation in the
analysis process. For this reason malware writers invested
a significant amount of time in analysis of various virtualiza-
tion implementations with the objective to find methods that
will allow malware to detect the presence of virtual machine.
If the virtual machine was detected, malware could simply
behave like a legitimate program or more commonly, refuse
to run inside the virtual environment. If automated logic was
used to decide if a program is malicious based solely on its
behaviour, the malware would be able to avoid detection by
anti-virus software—the detection signatures would not be
created and the sample would be archived (or discarded) as
non-malicious.
As a result of the virus writer’s and security researcher’s
efforts, several methods of detection have been developed.
Although it is well known that many malware samples are
VM-aware, we have not been able to find any research that
attempts to measure the proportion of VM-aware malware in
the set of all known malware samples. This proportion is very
important when investigating the feasibility of developing a
large scale automated analysis system.
If the proportion of VM-aware samples is very small
(
<0.1%) we may be able to ignore it and manually analyze
samples that do not produce results when run inside a virtual
123

182
B. Lau, V. Svajcer
environment. If the proportion is higher than that, an effort
has to be made to account for development of an environment
able to successfully analyze VM-aware malware. For exam-
ple, a multi-stage automated system could be developed. In
the first stage the sample is moved to virtual environment and
run inside the guest OS providing a relatively quick check
using a simplified hardware configuration (full analysis net-
work running inside one physical machine). Only if the vir-
tualized analysis system does not produce conclusive result
the sample is moved to the next phase - a system based on
real hardware.
1.1 Virtualization and security research
Despite the fact that there are several detection methods, vir-
tualisation is often used in computer security research. Here
are just some of the most common use cases.
1.1.1 Software vulnerability research
Vulnerability research is in many ways similar to product
testing. A vulnerability researcher may use virtual machines
to create environment to test security of an application on
several operating systems or test the security of the operating
system itself.
Since virtual machines can be configured to create virtual
network environment within the host operating system, secu-
rity researchers often use them to perform black box analysis
by creating unexpected application input (often using auto-
mated tools), which may expose vulnerabilities in the appli-
cation or the operating system.
Furthermore, the researchers often install system debug-
gers which help them investigate the state of the system once
an error condition is triggered by the unexpected input to the
application.
Virtual machines can be used for testing of exploits and
vulnerability payloads, including ones supplied with popular
exploit development frameworks such as Metasploit.
1.1.2 Malware analysis
With the number of new potential malware samples discov-
ered every day approaching 10.000 and constantly increasing
it is very important for anti-malware researchers to be able
to analyze incoming samples as quickly as possible.
Virus researchers were one of the first to recognize bene-
fits of software virtualization for their work. Virtual machines
allow creation of many different operating system environ-
ments which can be saved in a known state and restored in a
matter of seconds.
With every new malware sample analyzed the analyst has
to restore known clean state of the system in order to observe
side-effects of malware infection.
The side-effects include file system changes, registry
changes, network communication such as opening a socket
to listen on a port for remote connections by the attacker
or connecting to a web site to download and run additional
malware components or potentially unwanted applications
(PUAs).
Virtual machines allow creation of isolated networks that
simulate standard network services (DNS, SMTP, POP3,
HTTP, IRC, IM, P2P) expected to be online if a machine
is connected to internet and redirect network traffic gener-
ated by the infected machine to a safe destination which will
not expose any real machines on the internet.
In addition to manual analysis methods virtual machines
are commonly used in automated analysis systems with dedi-
cated clusters analyzing thousands of potential samples every
day.
1.1.3 Honeypots
The detection of malware in a real world situation often
depends on the moment when a security company receives
the first sample of the threat. It is very important to obtain
the new sample as soon as it appears in the wild.
Self replicating malware samples are often acquired using
honeypots, systems that provide value to the owner by attract-
ing unauthorized traffic.
Virtualization technology can be deployed to provide a
secure environment with configuration identical to the
machines targeted by malware. This non-production envi-
ronment is exposed to the network and any access the system
can be considered unauthorized.
From the attacker’s position, the virtualized machine
appears identical to a real machine and the malware will
attempt to infect it. As soon as the infection is detected by
the honeypot management system (which can be manual or
automated) the new sample will be isolated and the detection
added to the set of signatures used by the product.
2 Virtual machine detection methods
As already mentioned, it is a well known fact that virtual
machines are used for malware analysis. For that reason, sev-
eral malware families include detection of virtual machine
environment. Commonly, when a virtual machine environ-
ment is detected the malware adopts its behaviour to its
environment, most commonly stopping the execution or
launching a specially crafted payload designed to be run if
the presence of a virtual machine is detected.
Most notably, family of Zlob (Puper, DNSChanger)
Trojans contain code to detect if they are being executed
inside Virtual PC and VMWare. If the virtual machine is
detected the Trojan attempts to remove itself from the system.
123

Measuring virtual machine detection in malware using DSD tracer
183
Big families of IRC bots such as Agobot and Sdbot also
contain detection of virtual machines. If virtualization is
detected the main bot functionality will not be exhibited and
the bot will terminate its execution.
With the increasing usage of virtualization in a production
environment a decrease in the number of malware which does
not work in a virtual machine environment is expected.
Some of the executable packers also check for the pres-
ence of virtual machine. For example Themida is a very well
known packer that does not unpack the underlying code if it
is running under VMware.
In the following section we documented some well known
examples of code used by malware to detect presence of a
virtualised environment. Here, we only describe common
methods we used to measure the overall detection of virtual
machines. A fully comprehensive coverage of other virtual
machine detection methods is provided by several existing
papers [
].
2.1.1 Detection of running under MS virtual PC using VPC
communication channel
This method relies on the communication channel between a
virtual machine guest and Virtual Machine Manager (VMM).
The code sets up ebx and eax registers with required values
and emits an invalid instruction code 0x0f,0x3f which causes
an exception if the code is not running under a Microsoft vir-
tual machine. If no exception is triggered, the code is running
under a Microsoft Virtual Machine.
The invalid instruction 0x0f,0x3f provides a method of
communication between the guest OS and the Virtual PC
VMM. Bytes 3 and 4 can contain several other values, each
representing a call to a different VMM service although the
values used in the following code snippet are by far the most
common ones (0x07 and 0x0b) observed in Virtual PC (VPC)
aware malware.
DWORD __forceinline
IsInsideVPC_exceptionFilter
(LPEXCEPTION_POINTER ep)
{
PCONTEXT ctx = ep->ContextRecord;
ctx->Ebx = -1; // Not running VPC
ctx->Eip += 4; // skip past the "call
VPC" opcodes
return EXCEPTION_CONTINUE_EXECUTION;
// we can safely resume execution
since we skipped faulty
}
instruction
// High level language friendly version
of IsInsideVPC()
bool IsInsideVPC()
{
bool rc = false;
__try
{
_asm push ebx
_asm mov ebx, 0 // It will stay ZERO
if VPC is running
_asm mov eax, 1 // VPC function
number
// call VPC
_asm __emit 0Fh
_asm __emit 3Fh
_asm __emit 07h
_asm __emit 0Bh
_asm test ebx, ebx
_asm setz [rc]
_asm pop ebx
}
// The except block shouldn’t get
triggered if VPC is running!!
__except(IsInsideVPC_exceptionFilter
(GetExceptionInformation()))
{
}
return rc;
}
Invalid instruction VPC communication channel
detection
2.1.2 Detection of running under Vmware using VMWare
control API
This technique uses VMWare “backdoor” communication
using port 0x5658 (VX) to detect the presence of Vmware
[
]. In a real machine, communication with any port using
in and out instructions of the processor in user mode (ring3)
will cause an exception. However, if an application is run-
ning under Vmware, reading from port 0x5658 with VMWare
magic value (0x564D5868—VMXh) in register eax and func-
tion number in ebx will start communication with the VMM.
In case of Agobot and most of the other programs that
check for the presence of VMWare, it is simply sufficient
to check for the presence of the expected VMWare magic
number in register ebx after the in instruction was executed.
This method can be disabled if the following undocu-
mented options are added to the virtual machine configu-
ration file [
]. These settings prevent Agobot, Zlob and
several other malware families from detecting the VMWare
presence.
123

184
B. Lau, V. Svajcer
isolation.tools.getPtrLocation.disable = "TRUE"
isolation.tools.setPtrLocation.disable = "TRUE"
isolation.tools.setVersion.disable = "TRUE"
isolation.tools.getVersion.disable = "TRUE"
monitor_control.disable_directexec = "TRUE"
monitor_control.disable_chksimd = "TRUE"
monitor_control.disable_ntreloc = "TRUE"
monitor_control.disable_selfmod = "TRUE"
monitor_control.disable_reloc = "TRUE"
monitor_control.disable_btinout = "TRUE"
monitor_control.disable_btmemspace = "TRUE"
monitor_control.disable_btpriv = "TRUE"
monitor_control.disable_btseg = "TRUE"
Anti-VMWare prevention virtual machine initialization
settings
/* executes VMware backdoor I/O
function call */
#define VMWARE_MAGIC 0x564D5868 //
Backdoor magic number
#define VMWARE_PORT 0x5658 // Backdoor
port number
#define VMCMD_GET_VERSION 0x0a // Get
version number
int VMBackDoor(unsigned long *reg_a,
unsigned long *reg_b, unsigned
long *reg_c, unsigned long *reg_d)
{
unsigned long a, b, c, d;
b=reg_b?*reg_b:0;
c=reg_c?*reg_c:0;
xtry {
__asm {
push eax
push ebx
push ecx
push edx
mov eax, VMWARE_MAGIC
mov ebx, b
mov ecx, c
mov edx, VMWARE_PORT
in eax, dx
mov a, eax
mov b, ebx
mov c, ecx
mov d, edx
pop edx
pop ecx
pop ebx
pop eax
}
} xcatch(...) {}
if(reg_a) *reg_a=a; if(reg_b) *reg_b=b;
if(reg_c) *reg_c=c; if(reg_d) *reg_d=d;
return a;
}
/* Check VMware version only */
int VMGetVersion()
{
unsigned long version, magic, command;
command=VMCMD_GET_VERSION;
VMBackDoor(&version, &magic, &command,
NULL);
if(magic==VMWARE_MAGIC) return
version;
else return 0;
}
/* Check if running inside VMWare */
int IsVMWare()
{
int version=VMGetVersion();
if(version) return true; else return
false;
}
VMWare detection using VMWare communication
channel
2.1.3 Redpill (using SIDT, SGDT or SLDT)
At the heart of this detection method is the SIDT x86 instruc-
tion (encoded as 0F01[addr]), which stores the contents of the
interrupt descriptor table register (IDTR) in a memory loca-
tion. SIDT is one of the few instructions that can be executed
in the non privileged mode (ring3) but it returns the contents
of the sensitive register, used internally by operating system.
SxxT are only one type of instructions of x86 instruction set
that can be used to detect that the application is running inside
a virtual machine (Vmware or Virtual PC). It is important to
note that developers of VMWare and Virtual PC could have
probably used dynamic translation to translate SIDT instruc-
tion to a safe format that returns the same results in a virtual
environment as in real environment but they made a decision
not to do it. This is why this method (in some systems) can
be reliably used to detect virtual machines.
It was first observed by Joanna Rutkowska that because
there is only one IDTR register, but there are at least two
OS running concurrently (i.e. the host and the guest OS),
123

Measuring virtual machine detection in malware using DSD tracer
185
VMM needs to shadow the guest’s IDTR in a safe place, so
that it will not conflict with host’s one. On VMWare with a
single processor, the relocated address of IDT was at address
0xffXXXXXX, while on Virtual PC it is 0xe8XXXXXX.
However, this assumption is not correct if the system is
fully emulated or there is more than one hardware CPU
installed, which is the case with most modern multi-core
processors. In a multi processor system every processor uses
its own interrupt descriptor table (IDT) and has its own reg-
ister (IDTR) to point to the IDT. Often, the IDT memory
address for the second CPU is in the region 0xf7XXXXXX,
which means that the method used by Redpill [
] and
Scoopy Doo [
] detection programs can often show
incorrect results.
int detect_vm () {
/* setup memory areas for returned IDTR
content and the assembly */
unsigned char m[2+4], sidtc[] = ‘‘\x0f
\x01\x0d\00\x00\x00\x00\xc3";
/* patch assembly with the pointer to
buffer allocated for IDTR */
*((unsigned*)&sidtc[3]) = (unsigned)m;
/* call the code to retrieve IDTR */
((void(*)())&sidtc)();
/* if MSB of the IDTR is larger than
0xd0 assume virtual machine */
return (m[5]>0xd0) ? 1 : 0;
}
Redpill detection method
The Redpill’s method checks the first byte of the IDTR
and compares it with 0xd0. If the byte greater than 0xd0 the
program assumes that it is running inside a virtual machine.
In case of a dual processor system this approach will generate
false positive detection in 50% of the time [
].
A more reliable method may be to use sldt instruction since
LDTR registers for individual processors running Windows
seem to be initialised to point to the same memory location
and the false positive rate is minimised.
2.1.4 SMSW VMWare detection
An alternative method of checking for the presence of
VMWare has been found in several samples of an IRC back-
door Troj/Zyklo (Backdoor.Zyklobot). The method uses the
SMSW (Store Machine Specific Word) instruction. The
instruction is supposed to return 16-bit result and if the 32
bit register is used to store the result, the higher 16 bits are
undefined, according to the Intel’s Instruction Set Reference.
In an experiment [
] conducted by Danny Quist of Offen-
sive computing, it has been observed that on Intel processors,
the return value of top 16 bits is consistently 0x8001, while
on virtualized CPU in VMWare the target register contains
the value preserved before the instruction was executed. This
fact was used in the SMSW method. First the target register is
initialized with a “magic” value and the SMSW is executed.
If after the execution of the instruction the target register
still contains the magic value, the program is deemed to be
running inside VMWare.
int mswCheck(void)
{
int rc = 0;
unsigned int reax = 0;
__asm
{
mov eax, 0xCCCCCCCC; // This is the
magic value
smsw eax;
mov DWORD PTR [reax], eax;
}
printf("MSW: %2.2x%2.2x%2.2x%2.2x\n",
(reax >> 24) & 0xFF, (reax >>
16) & 0xFF, (reax >> 8) & 0xFF,
reax & 0xFF);
// If the high order bits are still
0xCC, then we are in a VMWare
session
// with emulation turned off.
if ( (( (reax >> 24) & 0xFF) == 0xcc)
&& (( (reax >> 16) & 0xFF) == 0xcc))
rc = 1;
else
rc = 0;
return rc;
}
This code has been observed in few other malware families,
indicating a code reuse.
2.1.5 Other detection methods
Presence of a virtual machine can also be detected by check-
ing other operating system objects such as:
123
186
B. Lau, V. Svajcer
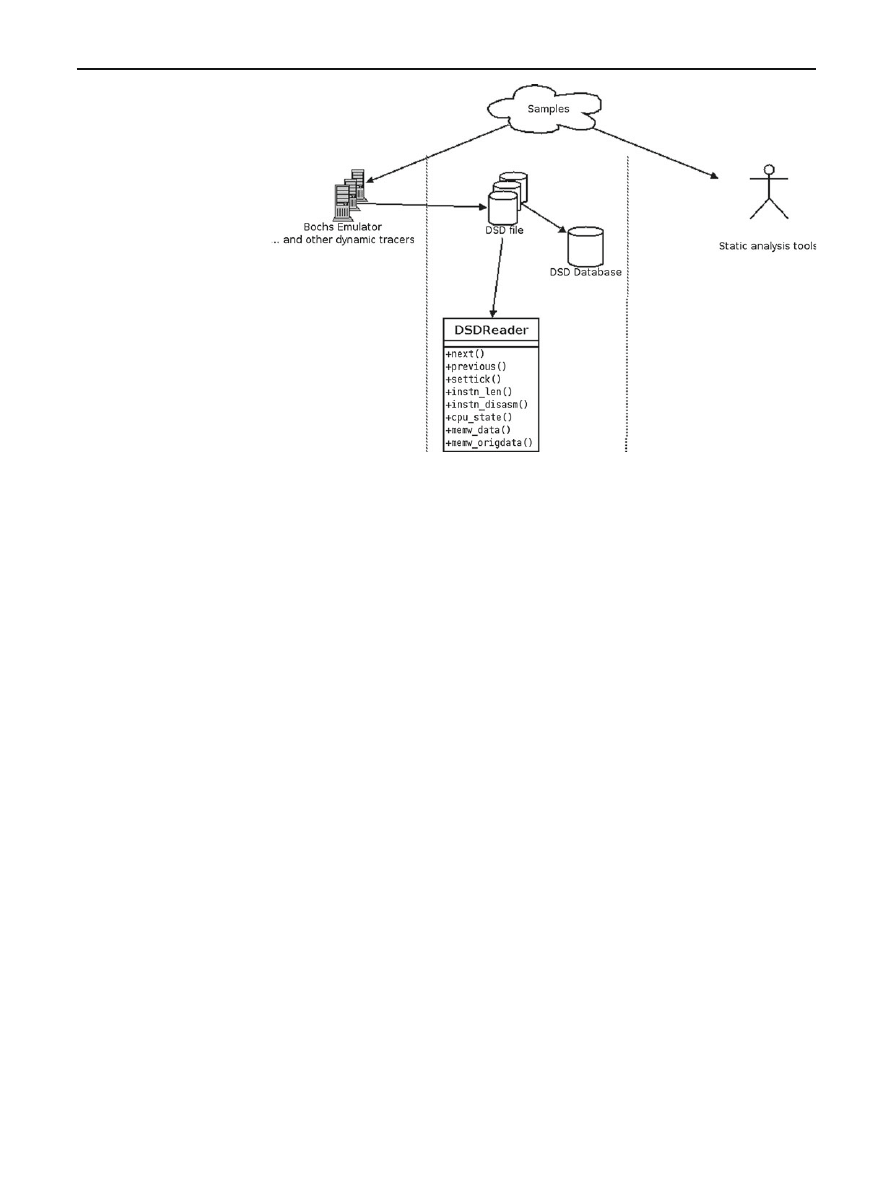
Fig. 1 Architecture of
DSD-Tracer
• System services (for presence of VMWare Tools service)
• Virtual network card MAC specific addresses
• System BIOS (for Virtual machine specific BIOS emula-
tion)
• System hardware devices (both VMWare and Virtual PC
virtualize a specific set of devices)
• File system
• System CPU (CPUID instruction, returns ConnectixCPU
if the system is a VPC machine)
• Registry keys referencing VMWare or Connectix
(Microsoft Virtual PC).
3 Methodology of our study with DSD-Tracer
In our study, we utilized DSD-Tracer, a malware analysis
framework developed in house for our own research. We
aimed to use DSD-Tracer to identify the families of obfusca-
tion packers which employ VM-aware detection techniques,
while detection of other non-obfuscated virtualization aware
malware was implemented using a set of static analysis rules
and dynamic rules applied to the output of Sophos virus
engine built-in emulator.
DSD-Tracer is a framework that integrates dynamic and
static analysis. Detailed discussion of DSD-Tracer is outside
of the scope of this paper. Interested parties can refer to [
] for
detailed discussion of the framework. In the following section
we will briefly discuss our methodology and advantages of
employing DSD-Tracer as our tool for analysing samples
(Fig.
3.1.1 Dynamic component
DSD-Tracer provides a detailed trace of the executable in
dynamic state, including the following information:
• Instructions decoded before its execution.
• All CPU registers.
• Reads/writes to virtual/physical memory.
• Interrupts/exceptions generated.
At the core of the dynamic component is an instrumented
virtual machine which aims to capture every instruction run
by the sample. The specification of the framework enables
tools to communicate low level information about samples.
There are existing studies on automated replication sys-
tems; some previous studies for using VM to automate analy-
sis (such as TTAnalyze [
], Cobra [
], see
references) focused on using VM to obtain high-level infor-
mation as opposed to low level assembly traces.
DSD-Tracer collects low-level information about the run-
ning sample. We argue this ability for collecting low-level
information is essential for our investigation since techniques
for detecting virtual machine (e.g. the invalid instruction exe-
cution to detect Virtual PC which only requires one instruc-
tion) can be observed at only low level.
3.1.2 Static component
Serialized dynamic information can be accessed via a well
defined interface. The interface module was written in C++
which is wrapped into a high-level language module using
123

Measuring virtual machine detection in malware using DSD tracer
187
SWIG module ( supporting Perl, PHP, Python, Tcl, Ruby,
PHP, etc.)
The following summarise the interface used to access the
serialized dynamic information:
class dsd_reader {
public:
dsd_reader(char *logname);
˜dsd_reader();
tick cputick();
tick min_cputick();
tick max_cputick();
dsd_reader* next();
dsd_reader* previous();
dsd_reader* set_tick(tick t);
//check if certain block exists
dsd_block* read_block();
//dsd_block* read_block(const char*
type);
dsd_block* read_block(block_type type);
// return current instructions
address instn_laddr();
unsigned instn_len();
byte* instn_buf(); //return array of
null-terminated bytes
char* instn_disasm();
// return details about memory write
address memw_laddr();
address memw_paddr();
unsigned memw_len();
byte* memw_data();
byte* memw_origdata();
//return cpu states
Bit32u cpu_eax();
Bit32u cpu_ebx();
Bit32u cpu_ecx();
Bit32u cpu_edx();
Bit32u cpu_ebp();
Bit32u cpu_esi();
Bit32u cpu_edi();
Bit32u cpu_esp();
};
An example of C++ interface declaration
We have taken advantage of this interface and written a
Python script to detect known techniques for detecting VM
detailed in previous paragraphs. The script takes the trace,
steps through each CPU tick and performs matching to see if
the trace matches one of the previously discussed VM detec-
tion techniques.
3.1.3 Automatic replication harness
In order to handle large number of samples to obtain reliable
statistics, manual generation of dynamic traces and analysis
is impractical (Fig.
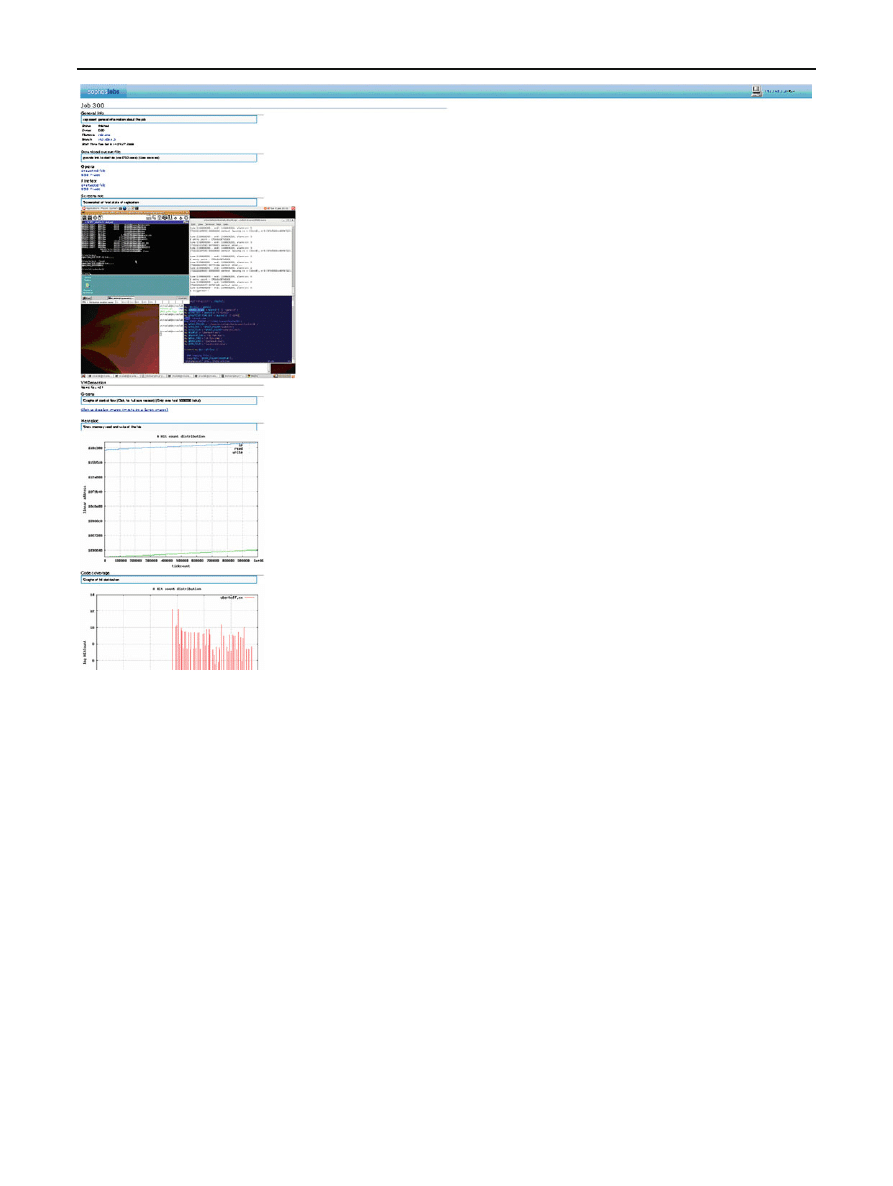
We have implemented a web-based automatic replication
harness which allows feeding large number of samples, and
automatically performs required analysis to detect if the sam-
ple has employed known VM detection techniques (in addi-
tion to various code-coverage analysis, data-I/O analysis as
shown in above screenshot).
The result of our analysis was obtained by the web-based
interface which displays the proportion and category of
detected VM-aware techniques.
3.2 Case study: DSD-Tracer on Themida
To give insight into the complexity of analyzing packers
that employ virtualization detection techniques, we will
use Themida packer as an example. Themida [
] is a com-
plex packer that employs various armouring techniques,
metamorphic/junk instructions insertions and virtualization
detection.
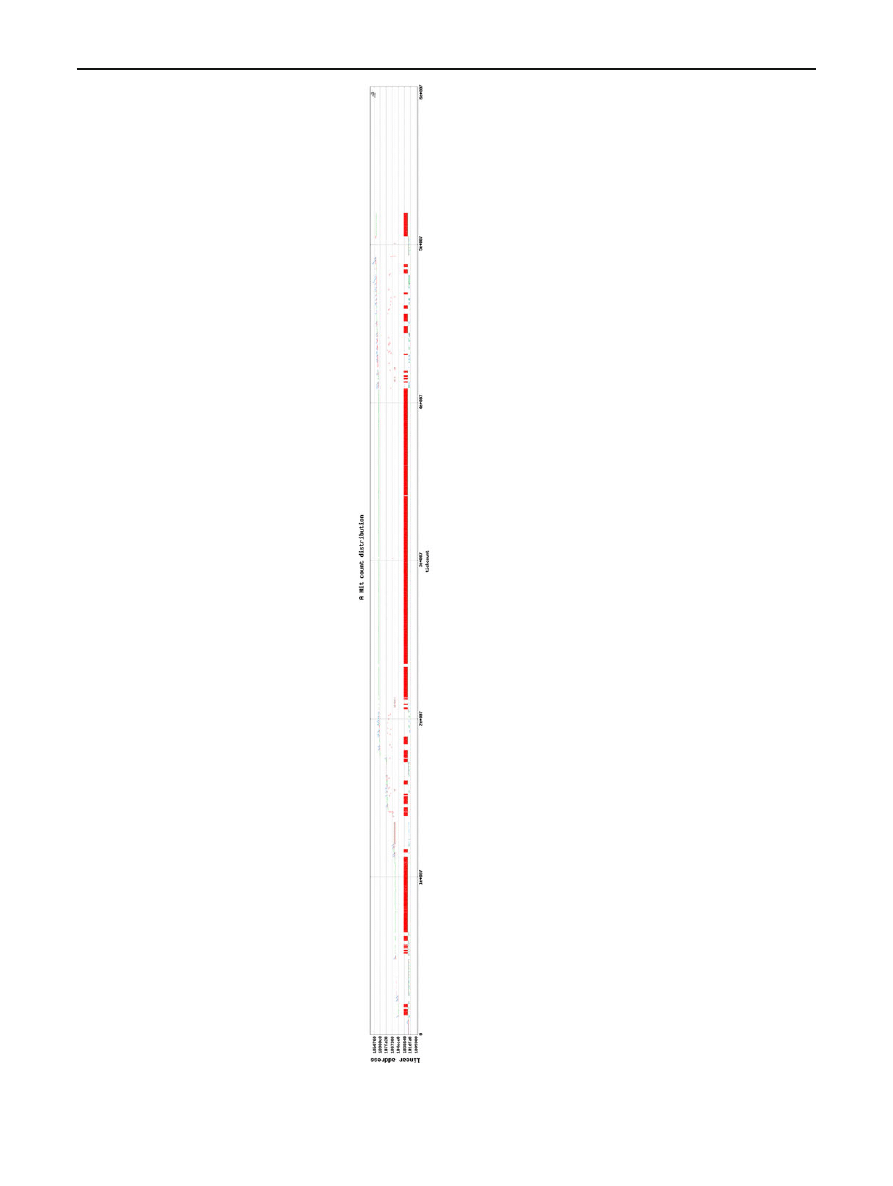
3.2.1 Complexity of Themida
The complexity of Themida can be illustrated by the follow-
ing Data I/O graph produced from a trace of DSD-Tracer of
the Themida unpacking (Fig.
The red line shows the IP, blue line shows the write address,
green is the read address. This graph illustrates a few things:
1. The multiple layers of encryption employed by Themida.
2. The large red blob in the middle is the embedded Virtual
Machine code by Themida—the virtual machine itself
employs excessive junk jumps which cause the large
spread of the IP.
Analyzing Themida through traditional debugger/static tech-
nique is very labor intensive.
3.2.2 Static analysis of the dsddump sample
One of the frequently used too in DSD-Tracer is “dsddump”.
Since DSD-Tracer recorded all memory I/O operations of the
original executable, we can simply replay all the recorded
memory-io and produce a “dump” of the packed sample
in static environment. Advantage of such method compare
to dumping directly from memory includes ability to
123
188
B. Lau, V. Svajcer
Fig. 2 Screenshot of our post-analysis results
circumvent various page-level anti-dumping techniques
as well as ability to inspect the “dump” at different time
slices.
If we look at the information extracted from the replication
harness.
Both the CPU tick (relative to the start of the process) and
the virtual address of the technique is recorded.
Now we can refer to the de-obfuscated “dsddump” sample.
We can investigate the virtual address at which the VM-aware
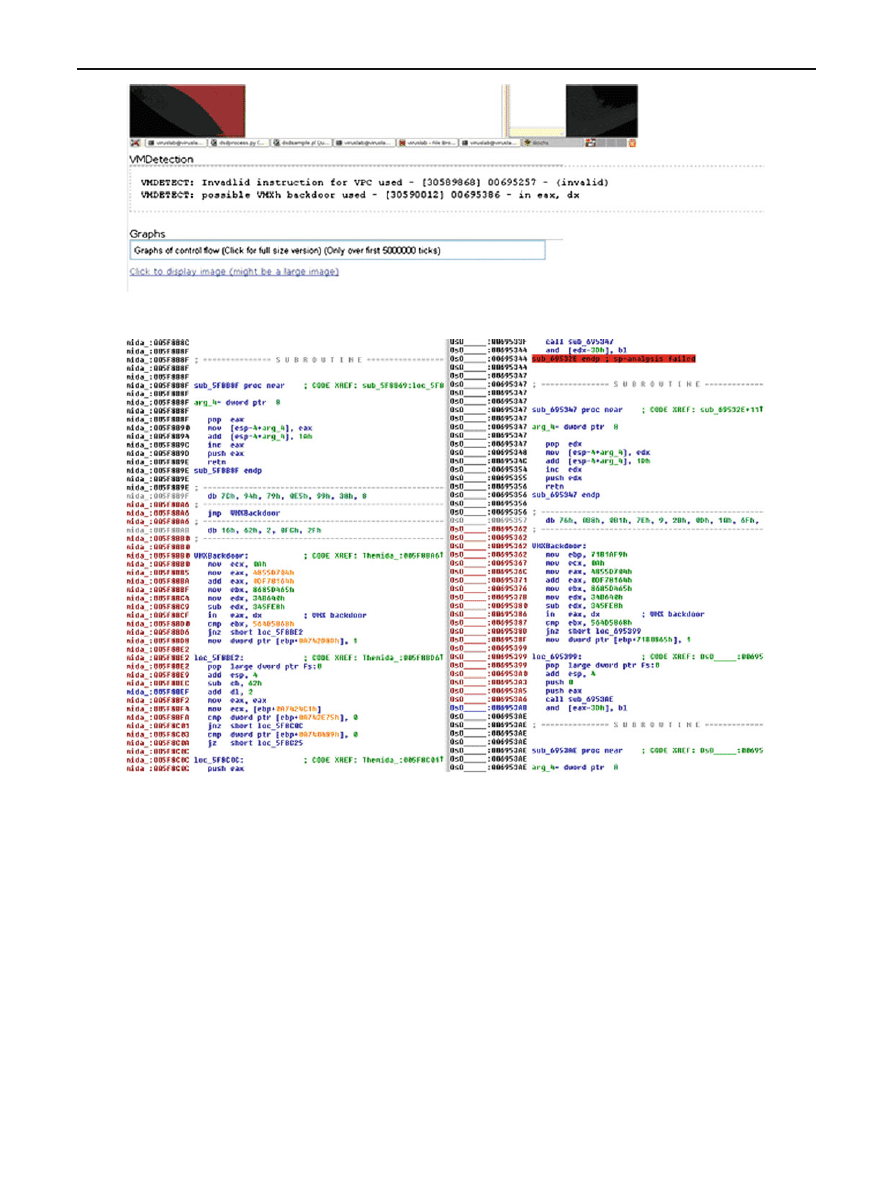
technique occurred (Fig.
This allows us to cross verified the VM-aware technique
used between samples. For example, the following is a side
by side comparison for the VMX backdoor technique used
between two samples (Fig.
Note the:
1. The junk jump instruction in front of the technique. The
junk jumps are modified between different samples.
2. Simple algebraic instruction is used to build up the req-
uired register values to avoid static detection and looks
polymorphic. However, we found that these algebraic
operations are relatively constant between the samples
and might not be generated at the time of packing.
In summary, DSD-Tracer provides us with an effective and
accurate way of analysing packers without requiring manu-
ally trace through the sample.
3.3 Justification for using DSD-Tracer
3.3.1 Coverage of packed samples
In malware research, a large number of samples are packed.
At least 20% of samples from Sophos sample set are packed
with known packers, although this percentage is on decrease.
123
Measuring virtual machine detection in malware using DSD tracer
189
Fig. 3 Data I/O graph from a
trace of DSD-Tracer (Themida
unpacking)
Such packed samples prevent static analysis techniques from
discovering that the sample is VM-aware. Unpacking the
sample does not help towards our goal since one of our
major goals was to investigate VM-aware techniques which
are embedded within the packer, and unpacking the sample
will strip the sample of such property.
By using DSD-Tracer, we record a trace of dynamically
executed samples, and recognize a Virtual Machine detection
technique even if it is hidden deep inside the packer and
cannot be seen by static analysis techniques.
This ability is demonstrated by the previously discussed
case-study of Themida.
3.3.2 Low-level accuracy
There are existing tools for obtaining low level assembly
information through emulation, including the Norman Sand-
box Analyzer [
]. It constructs an ad-hoc subset of CPU/OS
functionality, which means there are often flaws which mal-
ware can detect easily (e.g. “Detecting Norman by IDT” [
]
[av07]). Nevertheless, these are valuable tools to cross-verify
trace information in the framework. ida-x86emu [
] is an
x86 emulator written as an IDA plug-in , with limited OS-
level emulation. Note that most of these tools are designed
with different goals—Norman Sandbox analyzer is a real-
time analysis tool with efficiency in mind, while ida-x86emu
is a tool aimed at assisting unpacking in IDA as opposed to
being a full emulator - so accuracy of emulation might not
be the most important goal of these tools.
3.3.3 Circumventing armour techniques
DSD-Tracer uses an instrumented Virtual Machine for which
the “debugger” runs below Ring0 (using x86 terminology
here) and so it had been labelled as Ring-1 debugger. Ring -1
debuggers provide a more accurate simulation environment
since no modification is required to the OS-level. It can mon-
itor the debugee without affecting any of the host OS envi-
ronment or the CPU state (e.g. debugging registers).
There are alternative solutions which also allow kernel
mode debugging, such as VMware workstation, or QEmu
kernel mode debugger. However, we have chosen Bochs as
our final choice due to the fact that in Bochs, the CPU is
fully emulated (as oppose to some other VM such as QEMU
[
], KQEMU and VMware which, for efficiency purposes,
execute some instructions natively on the machine). It does
not employ any dynamic binary translation technique, which
greatly simplifies implementing the VM at CPU execution
level. This property makes Bochs relatively accurate and
robust compare to other VMs.
123
190
B. Lau, V. Svajcer
Fig. 4 Screenshot of DSD presenting where VM aware technique is used
Fig. 5 Comparision of 2 Themida samples using VM aware techniques
3.4 Mitigating factors in using DSD-Tracer
While DSD-Tracer does provide some advantage for our
research, we have to also be aware of certain caveats in using
it. Below detailed some of our concerns while employing
DSD-Tracer, and describe measures to minimize the impact
of such factors.
Bochs as a Virtual Machine
DSD-Tracer currently employs Bochs as the analysis envi-
ronment at the core of the dynamic stage. There are known
techniques for detecting Bochs—most easily on the emulated
device characteristic.
In our evaluation of suitability for Bochs as analysis envi-
ronment, we had tried to establish if any malware employs
known technique in detecting Bochs. However, from our
research, we had not been able to find any samples which
tried to detect the existence of Bochs machine.
In the original description of DSD-Tracer in [
], it is pro-
posed that multiple dynamic analysis trace generated on dif-
ferent environment can be cross-verified against each other to
make VM-aware techniques (and in general, armoring tech-
nique) almost impossible, since armoring techniques would
123

Measuring virtual machine detection in malware using DSD tracer
191
display a divergence between the 2 traces. We have imple-
mented a proof of concept version of such framework which
will be discussed in the following section.
3.4.1 Scalability
Due to the large amount of information handled by DSD-
Tracer, the current throughput of our experimental setup of
DSD-Tracer is close to 4 samples/hour. Our main aim of
research for using DSD-Tracer is to establish the amount of
packed samples which employ VM-aware techniques.
To best-employ our limited bandwidth with our DSD-
Tracer replication harness, we have taken random samples
from each known (as several custom) packers so we can
accurately establish if a family of packer contain VM-aware
techniques or not. We took 5 samples from each of the com-
monly used sets of packed, while for packers with smaller
population we have taken 2.
Some packers, such as Themida, have Virtual Machine
detection as an optional feature. It is not necessary true that
the samples we chose from our collection to represent the
packer will have such option enabled. However, we argue
that it is likely that malware authors would more often than
not enable such features since:
1. Malware running in a virtualized environment is often
less valuable than one on real environment
2. Malware researchers make use of virtualization as their
analysis environment is a well known fact, and hence
malware authors are likely to enable such option.
We have done a brief research on the percentage of samples
which had VM technique turned on for Themida, we found
more than 85% of them contain VM-aware techniques.
3.5 Proof of concept experiment for DSD-Tracer
on VMware
One of the core-idea of DSD-Tracer is the ability to cross-
verified multiple dynamic analysis trace generated on dif-
ferent environment to make VM-aware techniques (and in
general, armoring technique) almost impossible, since armor-
ing techniques would display a divergence between the 2
traces.
In the following section we shall describe our attempt to
implement another implementation of DSD-Tracer of which
we could verify against the trace generated from Bochs.
We have also implemented a prototype version of the
DSD-Tracer running on VMware Workstation 6 using its
GDB debugging stub and implementing a customized GDB
client on the host environment which will single step and
record the trace.
The setup was quite simple. Following instruction from
], the vmx file needed to be configured with following lines:
debugStub.listen.guest32 = "TRUE"
debugStub.listen.guest32.remote = "TRUE"
In addition, we would like to enable the “invisible break-
point” [
] option that does not use the usual software break-
points affecting the guest memory. Invisible breakpoints allow
VMware to maintain a set of internal breakpoints similar to
hardware breakpoints.
debugStub.hideBreakpoints=1
One advantage of such “invisible breakpoints” is that they
operate on virtual addresses. They work on all page tables—
even if the process has not yet been created. This is a very
convenient mechanism which allows us to set a breakpoint
at the entry point of the process.
With the above options enabled we can connect a GDB
client to port 8832 and it will act as a kernel mode debugger
on the host, using the following command in gdb:
target remote localhost:8832
As a simple experiment, we can use the following simple
GDB script to print out the assembly execution trace from the
client. Note that we would only target the Ring 3 instructions
from the specific process we are investigating.
target remote localhost:8832
# default disassembly flavour for gdb is
att set disassembly-flavour intel
# set breakpoint at the entry point
(remember to use invisible breakpoint)
b *0x4010000
continue
# list of contextswap breakpoints
(at win2k KiSwap Context)
b *0x80403b96
b *0x80403c6c
# internal function for getting Process
ID from PEB
# Note it might not be able to read the
necessary memory when in Ring 0,
# thus will return -1 if it fail. See
below
define getpid
# cannot get pid in ring 0
set $pidnow = -1
# PEB->PID
set $pidnow = *0x7ffde020
end
123

192
B. Lau, V. Svajcer
# get current pid
set $pid = *0x7ffde020 # PEB.pid at
Win2k
printf "current pid = %i\n", $pid
while 1
set $switchcount = 0
getpid
while ($pid != $pidnow)
printf "waiting to be switched (pid =
%i)...\n", $pidnow
continue
set $switchcount = $switchcount + 1
if ($switchcount > 1000)
printf "switched too many times! quit
...\n"
quit
end
getpid
end
# only print disassembly if not in r0
if ($cs != 8)
# print one instruction
x/i $pc
end
si
end
quit
To avoid error in memory read while running the script, it
will require a patch on the GDB client to handle memory
read errors without stopping the script. This can be done by
patching the source of GDB client with patches based on [
(the above script assumed a simplified version of the patch
that all errors are ignored).
Using this setup, we are able to demonstrate detection on
the VMX backdoor technique, by showing the differences
between the traces generated from Bochs and VMware. We
are able to locate the exact instruction at which the
VM-detection have occurred.
A problem with our proof of concept is that the throughput
of this experimental setup is very low. It takes approximately
6 hours to run a proof of concept sample on VMware work-
station with single stepping GDB client, this is mainly due
to 2 reasons:
1. overhead in communication between the GDB client on
the host and GDB stub in the VMware.
2. when investigating SIDT VM-aware technique, we
noticed that the returned IDT value shows that accel-
eration was disabled. It seems that turning on debugging
stub would implicitly disable acceleration, which is a
side effect of our investigation.
Note that since QEMU also has the GDB stub support, it is
possible to implement the above technique in QEMU as well.
This proof of concept, DSD-Tracer on VMware demon-
strates our technique of cross-verifying traces against each
other to detect armoring techniques. However, improvements
are needed to be made if we are to employ it on a large sample
set.
4 Results
Our research attempted to measure the proportion of
VM-aware files in the malware set using a combination of
static and dynamic analysis methods. During the process we
were aware of the limitation of both approaches with regards
to the modern malware that often employs obfuscation meth-
ods to make analysis more difficult and in many ways our
measurement will amount to approximation where our target
to come up with “worst case” numbers.
For example, if we found that a significant number of
family members are VM-aware we used the full number of
family members as the worst case. With this approach we
hope we have taken in account the number of malicious files
and families that were not detected due to obfuscation and
insufficiencies of our testing methods.
4.1 VM detection in packers
DSD-Tracer test has been run on a set of around 400 samples
packed by 193 different generic and custom packers classi-
fied by out database. We have taken 5 random samples from
each of the commonly used sets of packed, while for packers
with smaller population we have taken 2. More than one sam-
ple of each packer is taken to eliminate uncertainties around
determination of the VM detection in the packer code. Only if
two or more of the tested samples were found to exhibit VM
detection we attributed the detection to packer code, other-
wise we would attribute the detection to the underlying mal-
ware. Overall, our tests have shown only one major packer
that actively used VM detection code—Themida accounting
for 1.03% samples in our test set.
One border line case we found is ExeCryptor (accounted
for 0.15% of our testset). ExeCryptor provides an option for
making the packed executable compatible with Virtual envi-
ronment (Fig.
Fig. 6 Execryptor VMWare compatibility protection option
123

Measuring virtual machine detection in malware using DSD tracer
193
However, when we tried to investigate further, we found:
• We have taken a number of ExeCryptor samples from our
test set, and verify that they all behaved the same between
virtual and real environment.
• We created our own ExeCrytor executables with and with-
out the VM compatibility option but could not spot any
differences in execution path between the samples in
DSD-Tracer.
• Static analysis concludes that it does not contains any
known techniques for detecting Virtual environment.
Therefore we have decided to exclude ExeCrytor from our
list of packers which detects Virtual environment.
Nevertheless, we found several samples of various cus-
tom packers that also exhibited this VM detection behaviour.
Since we know that these custom packers were specifically
created to obfuscate malware we can conclude that there is a
higher probability of VM detection code in custom packers
than in the generic packers. We do not have the names for
these packers as they are detected under Sophos generic cus-
tom packer detection name EncPk. When VM-aware custom
packers are taken in account, the overall VM detection rate
in packer code raises to 1.15%.
4.2 VM detection in malware families
This part of testing was conducted using a combination of
purely static analysis (disassembly) rules and dynamic
(Sophos virus engine emulation) rules. The rules were run
over a set consisting of around 2 million known malicious
files. The rules are also tested on a large set of known clean
files to make sure that none of the rules trigger too many false
positive detections.
Some rules, for example SIDT scanning static rule gener-
ated too many false positive detections. We use these rules to
identify a list of possible candidates which uses VM-aware
techniques, and then use slower and more detail static analy-
sis technique via IDA scripting to disassemble the sample
and determine if the technique was used (Table
Table 1 Virtual machine detection method breakdown
Method
Number
Percentage (%)
FP rate
VMWare backdoor
4,524
0.232
Low
SIDT, SLDT
8,668
0.444
Medium_to_high
Redpill copy
68
0.003
None
VPCDet-A
2,630
0.135
Low
VMWare string
3,216
0.165
Medium
VMsmsw
4
None
Overall
0.978
Rules based testing (excluding packers) shows that a little
bit less of 1% of samples may be VM-aware. To get overall
percentage, we should add the percentage of files that use
VM-aware packers.
In terms of family breakdown there are a lot of smaller
families implementing VM detection methods, the largest of
them comprise of Dorf (not all samples), Zlob (again only
downloading component) and Agobot and various IRCBot
variants (Table
Another significant contribution comes from a family of
dialers Dial/FlashL, although the full behaviour will still be
exhibited regardless of the fact that a VM was detected.
Dial/FlashL will however report the presence of a virtual
machine in its infection report using HTTP post request to
its home website.
4.3 Overall numbers
If we add numbers from the previous two sections, we get
a good approximation of the overall number of VM-aware
malicious files.
4.4 Some interesting observations
Of the samples using the VMWare backdoor detection
method, 50% of them also contain detection of Virtual PC
using the VPC illegal instruction detection method. How-
ever, of the samples using the VPC illegal instruction detec-
tion method 93% of them also contain VMWare detection
method.
This possibly reflects the opinion among virus writers that
VMWare is considered to be used most commonly used for
anti-virus research, which may be true. Another possibility
is that it may reflect the fact that VMWare appeared earlier
in the market.
Table 2 Virtual machine detection with significant families
Noticable family
VMware
VMware SIDT
VPC invalid
backdoor
instructions
Agobot
Y
DelpDldr
Y
Dorf
Y
Y
DwnLd
Y
IRCBot
Y
SmallDn
Y
Y
Torpig
Y
Y
Virtum
Y
Zlob
Y
Y
Customized
Y
Y
packers (EncPk)
123
194
B. Lau, V. Svajcer
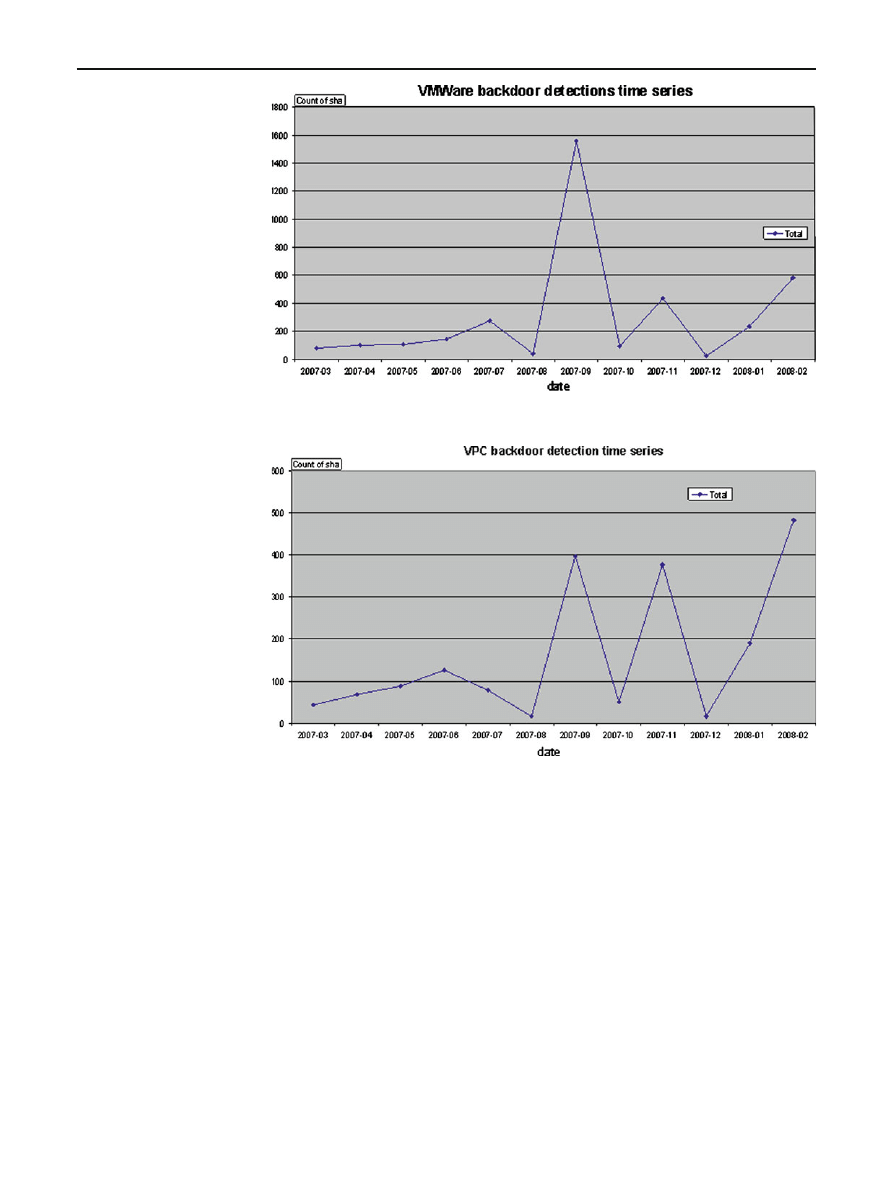
Fig. 7 VMWare backdoor
detections in 2007
Fig. 8 VPC backdoor
detections in 2007
In our research we have also attempted to find out if there
is a growing or decreasing trend in VM detections by mea-
suring a number of files that arrived to Sophos every month
versus detections of particular VM detection rules. While a
sharp increase attributed to VM-aware Dorf variants is clearly
visible in September 2007, both detections of VMWare and
VPC backdoor detections give overall inconclusive results
(Figs.
and
5 Conclusion
Measuring proportion of VM-aware malware is not an easy
task. When measuring this proportion, one cannot simply
rely on static analysis methods, since they can be easily
circumvented with obfuscated and encrypted code. Dynamic
analysis using DSD-Tracer is slow and it would take to long
to measure over a statistically representative set of sam-
ples (e.g. to achieve low margin of error and high level of
certainty).
We think that the combination of static and dynamic
method gives a good approximation that allows the reader
to make decisions based on the content of the paper. We have
developed DSD-Tracer—a system that can reliably, with time
constraint, measure several virtual machine detection meth-
ods in a program.
Finally, we measured that the overall proportion of
VM-aware samples is 2.13%. This number is not as high as
sometimes claimed, but still represents a significant number
that must be taken in account while conducting analysis using
123

Measuring virtual machine detection in malware using DSD tracer
195
virtual machines. It also shows that measures to minimise the
possibility of VM detection have to be taken when designing
VM-based automated analysis systems.
References
1. Lau, B.: DSD-Tracer: experimentation and implementation.
In: Virus Bulletin 2007 Conference proceedings (2007)
2. Moser, A., Kruegel, C., Kirda, E.: Exploring Multiple Execution
Paths for Malware Analysis (2006)
3. Bayer, U.: TTAnalyze: a tool for analyzing Malware. Master’s The-
sis, Technical University of Vienna (2005)
4. Vasudevan, A., Yerraballi, R.: Cobra: fine-grained Malware analy-
sis using stealth localized-executions. In: IEEE and Signature Gen-
eration of Exploits on Commodity Software (2006)
5. Willems, A., Holz, C., Freiling, T., Felix A.: Toward Automated
Dynamic Malware Analysis Using CWSandbox.
(2007)
6. Simplified Wrapper and Interface Generator.
(2000)
7. Natvig, K.: Norman sandbox white paper.
no/whitepapers/whitepaper_Norman_SandBox.pdf
(2003)
8. Vidstrom, A.: Evading the Norman SandBox Analyzer. BugTraq
bulletin (2007)
9. Eagle, C.: Attacking Packed Code with IDA Pro.
, Black-hat Asia (2006)
10. Bellard, F.: QEMU Emulator User Documentation # GDB usage.
http://fabrice.bellard.free.fr/qemu/qemu-doc.html#SEC46
(2005)
11. Ormandy, T.: An empirical study into the security exposure to hosts
of hostile virtualized environments, CanSecWest (2007)
12. Ferrie, P.: Attacks on virtual machine emulators (2007)
13. Xu M., et al.: ReTrace: Collecting execution trace with virtual
machine deterministic replay (2007)
14. Herrod, S.: The amazing VM record/replay feature in VMware
Workstation
6.
http://blogs.vmware.com/sherrod/2007/04/
(2007)
15. Technology, O.: Themida overview.
(2007)
16. Malyugin, V.: Application debugging with Record/Replay.
http://stackframe.blogspot.com/2007/09/
application-debugging-with-recordreplay.html
(2007)
17. Malyugin, V.: VMware forum thread.
(2007)
18. Callanan, S.: Terminate-on-error patch for GDBcli.
sourceware.org/ml/gdb-patches/2005-08/msg00120.html
(2005)
19. Schneider, O.: Redpill getting colorless?
net/wp-content/uploads/2007/04/redpill_getting_colorless.pdf
(2007)
20. Rutkowska, J.: Red Pill.
http://invisiblethings.org/papers/redpill.
(2004)
21. Klein, T.: Jerry.
http://www.trapkit.de/research/vmm/jerry/index.
(2005)
22. Klein, T.: Scoopy Doo.
http://www.trapkit.de/research/vmm/
(2005)
23. Kato, K.: VMWare Back.
http://chitchat.at.infoseek.co.jp/vmware/
(2003)
24. Liston, T., Skoudis, E.: On the cutting edge: thwarting
virtual
machine
detection.
http://handlers.sans.org/tliston/
ThwartingVMDetection_Liston_Skoudis.pdf
(2006)
25. O’Dea, H.: Trapping worms in a virtual net. In: Virus Bulletin 2004
Conference Proceedings (2004)
26. Intel.: Intel architecture software developer’s manual, vol
2: instruction set reference manual.
design/pentiumii/manuals/243191.htm
(2003)
27. Quist, D.: Vmdetect.
http://www.offensivecomputing.net/dc14/
(2006)
123
Document Outline
- Measuring virtual machine detection in malware using DSD tracer
- Abstract
- 1 Introduction
- 2 Virtual machine detection methods
- 3 Methodology of our study with DSD-Tracer
- 4 Results
- 5 Conclusion
- References
Wyszukiwarka
Podobne podstrony:
Detection of Metamorphic and Virtualization based Malware using Algebraic Specification
Detection of Metamorphic and Virtualization based malware using Algebraic Specification 001
Using Qualia and Hierarchical Models in Malware Detection
SubVirt Implementing malware with virtual machines
Generic Detection and Classification of Polymorphic Malware Using Neural Pattern Recognition
Machinability evaluation in hard turning of AISI 4340 steel with different cutting tools using st
Using Engine Signature to Detect Metamorphic Malware
Detecting self mutating malware using control flow graph matching
System?nter Virtual Machine Manager Scripting Guide
2008 06 Virtual machines [Consumer test]
Morphological Detection of Malware
Normalizing Metamorphic Malware Using Term Rewriting
Physics Papers Lee Smolin (1993), Time, Measurement And Information Loss In Quantum Cosmology
Detecting Internet Worms Using Data Mining Techniques
Detecting metamorphic viruses using profile hidden markov models
Analysis of total propionic acid in feed using headspace sol
Rapid analysis of malathion in blood using head space solid
Cliffsnotes Detective in Fiction
Developmental protective and risk factors in bpd (using aai)
więcej podobnych podstron