
Journal of Chromatography A, 909 (2001) 249–257
www.elsevier.com / locate / chroma
Analysis of nonvolatile species in a complex matrix by headspace
gas chromatography
1
*
X.-S. Chai, Q. Luo , J.Y. Zhu
Institute of Paper Science and Technology
, 500 10th Street N.W., Atlanta, GA 30318, USA
Received 25 August 2000; received in revised form 25 October 2000; accepted 25 October 2000
Abstract
This study developed a phase reaction conversion (PRC) headspace gas chromatographic (HS-GC) technique for the
measurements of nonvolatile species in liquid or solid samples. The technique is demonstrated by the measurements of
carbonate in aqueous carbonate solutions and in kraft pulp mill liquor samples. A very small amount of sulfuric acid (volume
of 0.5 ml, concentration of 2 mol / l) is used to acidify a sample of less than 300 ml in volume and convert the dissolved
carbonate into carbon dioxide (gas) in a sample vial (reactor) that is analyzed by thermal conductivity detection through a
headspace sampler. The carbonate concentrations measured by PRC-HS-GC in seven kraft liquor samples agree very well
with those measured using a coulometric and a titrametric method. Simultaneous analysis of multiple species was also
conducted to demonstrate the versatility of the method. The present method is very simple, rapid, reliable, accurate, and fully
automated. It can be applied to analyze other nonvolatile species in various industrial and environmental samples.
2001
Elsevier Science B.V. All rights reserved.
Keywords
: Headspace analysis; Kraft black liquors; Carbon dioxide; Carbonates; Sulfides
1. Introduction
effect on measurements. Drozd and Novak [7]
developed a standard addition method for HS-GC
Headspace gas chromatography (HS-GC) is a
analysis of solutes in equilibrated gas–liquid sys-
powerful technique for the analysis of volatile
tems. The method is based on material balance under
species in corrosive and complex matrix samples.
standard addition and phase equilibrium in headspace
The basic principle of HS-GC and many useful
so that the solute concentration in the liquid phase
methods can be found in textbooks [1–3] and review
can be derived from two measurements in the vapor
articles [4–6]. Because direct liquid-phase probing is
phase (headspace) before and after standard addition.
not necessary, HS-GC eliminates the sample matrix
Markelov and Guzowski Jr. [8] developed a full
evaporation (FE) technique to eliminate the sample
matrix effect to analyze analytes in aqueous solutions
*Corresponding author. Tel.: 11-404-8945-310; fax: 11-404-
using HS-GC. The FE-HS-GC method is based on
8945-752.
the near-complete transfer of the analyte from the
E-mail address
: junyong.zhu@ipst.edu (J.Y. Zhu).
1
liquid phase to the vapor phase (headspace) by
Permanent address: State Key Laboratory of Pulp and Paper
vaporization when a very small amount of the liquid
Engineering, South China University of Technology, Guangzhou,
China.
sample is dispensed into a heated sample vial.
0021-9673 / 01 / $ – see front matter
2001 Elsevier Science B.V. All rights reserved.
P I I : S 0 0 2 1 - 9 6 7 3 ( 0 0 ) 0 1 0 8 5 - 2

250
X
.-S. Chai et al. / J. Chromatogr. A 909 (2001) 249 –257
Most of the headspace chromatographic tech-
measurements of gas products released during con-
niques, including those by Drozd and Novak [7] and
densed phase conversion reactions by HS-GC. We
Markelov and Guzowski Jr. [8], are only suitable for
call this procedure phase reaction conversion head-
analysis of volatile species and cannot be applied to
space gas chromatography (PRC-HS-GC), which
nonvolatile species. There is a great need for accur-
follows the term of FE-HS-GC used by Markelov
ate analytical techniques to determine nonvolatile
and Guzowski Jr. [8]. We will use carbonate analysis
species in complex matrices. A typical example is
in aqueous sodium carbonate solutions and kraft
the determination of carbonate concentration in spent
black liquors as examples to achieve the objective of
pulping liquors, called weak black liquor because of
the present study. More specifically, dissolved car-
its color. Weak black liquors contain a large amount
bonate (a nonvolatile species) is converted to carbon
of carbonate and various other inorganic salts and
dioxide through the acidification of the samples
organic materials, such as lignin and hemicellulose,
using sulfuric acid in a sample vial (reactor). The
with total dissolved solids (TDSs) of around 15%.
carbon dioxide is then analyzed by GC through a
The analysis of carbonate in black liquors is very
headspace
sampler. We
will
also
demonstrate
important in the preventing of scaling in weak black
simultaneous multiple species analysis using PRC-
liquor concentrators or evaporators, a severe problem
HS-GC through the measurements of carbonate and
that affects pulp and paper production. However, it is
sulfide in kraft liquors. We believe that the PRC-HS-
very difficult to analyze carbonate in black liquors
GC method is simple, rapid, reliable, and accurate
due to its complex sample matrix. Titrametry has
for carbonate analysis in black liquors and also
failed, although it is frequently used for carbonate
suitable for other applications.
analysis in white liquors (regenerated pulping chemi-
cal solution from pulp mill chemical recovery cycle,
containing mainly hydroxide and sulfide and minor
2. Methodology
carbonate called dead load) and green liquors (aque-
ous solution of smelt ash derived from burning of the
organic materials during the combustion of concen-
2.1. The phase reaction conversion technique
trated black liquor). The application of capillary ion
electrophoresis [9] and ion chromatography [10–12]
It is a common practice in analytical chemistry to
for carbonate analysis in black liquors requires
indirectly determine an unknown analyte in a com-
complicated sample pretreatment. The sensitivity and
plex matrix through the measurements of the prod-
repeatability of the measurements are poor. The
ucts of chemical reactions involving the analyte.
time-consuming coulometric technique [13], though
Phase reaction conversion (or gasification) headspace
being adopted in commercial analytical laboratories
gas chromatography is based on a conversion of a
for carbonate analysis in black liquors, presents
fixed percentage (or a constant rate), including
difficulties and measurement uncertainties due to the
complete conversion, of an unknown analyte from a
interference of other volatile species released during
condensed phase in a sample. The sample may be
liquor acidification.
either a liquid or a solid that is converted into the gas
To take advantage of the matrix-independent HS-
phase through chemical reactions. The analyte is
GC analysis, we use chemical reaction to convert (or
then determined through the measurements of the gas
gasify) the nonvolatile species into gaseous products,
products using HS-GC. The term ‘‘fixed percentage’’
so that HS-GC can be applied. From the analysis of
here means that the conversion can be incomplete,
the gaseous products, the concentration of non-
but the final condensed phase conversion rate is a
volatile analyte in the original sample can be de-
constant; therefore, quantitative analysis of the ana-
termined based on chemical reaction equations. The
lyte in a condensed phase can be achieved through
objective of the present study is to develop and
calibration. For simplicity in mathematical derivation
demonstrate an analytical procedure that can provide
of the PRC-HS-GC technique, the following one-step
accurate and reliable measurements of nonvolatile
reaction is assumed for the phase conversion reaction
species in complex matrix samples through the
process:

X
.-S. Chai et al. / J. Chromatogr. A 909 (2001) 249 –257
251
rR 1 bB(condensed)
↔
pP 1 qQ(gas)
(1)
same. In PRC-HS-GC, the unity ratio of dilution is
always only an approximation even when exactly the
where B is the analyte to be determined in a sample.
same sample containing analyte B is used in cali-
It is further assumed that the conversion rate of a
bration. The analyte dilution in the headspace de-
nonvolatile compound B to a gaseous species Q is a
pends on the postreaction headspace volume V 2 V
T
L
( #1) when it reacts with another reactant R (exter-
and the total amount of products Q and P formed (if
nally added, preferably liquid, dissolving in a liquid
P is also a gas), which all vary with the amount of
if it is a solid). The chemical reactions take place in
analyte B contained in a sample. When the cali-
a sample vial, as the reactor, of volume V . The
T
bration sample is not of the same composition as the
initial volume of the unknown sample that contains
testing sample, different products may be produced
analyte B added in the reactor is V . The final total
S
during calibration and testing, further violating the
volume of all the condensed phase species in the
assumption of a unity ratio of dilution. However,
reactor after the completion of the chemical reactions
when a very small sample is used, the unity ratio of
is V . Then the numbers of moles of product gas Q
L
dilution is a valid assumption, as will be demon-
formed at the completion of reaction (1) in the
strated in this study.
reactor (sample vial) can be expressed as:
Because the product gas concentration C
in the
Q
headspace is proportional to the detector signal peak
C V q
B S
]]
n 5 a ?
5 C (V 2V )
(2)
area, e.g., C 5k9A, the concentration of the analyte
Q
Q
T
L
Q
b
B in the sample can be found from Eq. (4):
where C
is the molar concentration of the con-
B
V 2 V
V 2 V
k9A
b
b
densed analyte B in the original sample solution to
T
L
T
L
] ]]] ]
]]] ]
C 5
?
?
5 kA ?
?
(4)
B
be determined. C
is molar concentration of the
a
V
q
V
q
Q
S
S
product gas in the headspace at the completion of the
where k 5k9 /a is the calibration constant. A is the
reaction. V 2 V is the postreaction headspace vol-
T
L
GC system signal peak area. b /q is the stoichio-
ume. From Eq. (2), we have:
metric ratio of analyte B and the gas product Q in
V 2 V
1
b
reaction (1). If the final total volume of the con-
T
L
] ] ]]]
C 5
?
?
? C
(3)
B
Q
densed phase in the reactor at the completion of the
a q
V
S
reaction V is very small compared to the volume of
L
2.2. Calibration
the sample vial, then the postreaction headspace
volume can be approximated to the volume of the
External standards are recommended for calibra-
sample vial. Then Eq. (4) can be written as:
tion in using PRC-HS-GC to avoid unnecessary
V 2 V
V
b
b
complications by potential chemical reactions. Most
T
L
T
]]] ]
] ]
C 5 kA ?
?
¯ kA ?
?
(5)
B
V
q
V
q
commercial HS-GC systems use an inert gas to
S
S
pressurize the sample vial to create a pressure head
or simply:
to sample the gas in the headspace. The pressuriza-
tion by the inert gas dilutes the analyte gas in the
m 5 fA
(6)
B
headspace to be transferred to the sampling loop for
where f 5 k(V 2 V )b /q
¯ kV b /q.
T
L
T
GC analysis, which not only affects measurement
sensitivity, but also creates complications and un-
certainties in calibration, because the dilution ratio
3. Experimental
used in calibration over that used in an actual
individual testing headspace experiment is an un-
known. Therefore, liquid standard calibration is often
3.1. Chemicals and black liquors
preferred, in which the same headspace dilution ratio
(or unity ratio of dilution) can be assumed for both
All chemicals used in the experiment were from
the calibration and individual testing experiment as
commercial sources. A 2 mol / l sulfuric acid solution
long as the initial total volume of the samples is the
was prepared using 95–98% purity commercial

252
X
.-S. Chai et al. / J. Chromatogr. A 909 (2001) 249 –257
sulfuric acid (Aldrich, Milwaukee, WI, USA). A 0.1
the carbonate has been acidified using sulfuric acid.
mol / l standard carbonate solution was prepared for
The following reaction can be used to describe the
the calibration. All black liquor samples were col-
condensed phase (carbonate) conversion reaction
lected from conventional alkaline pulping of both
through acidification:
softwoods and hardwoods in our laboratory.
1
22
2H 1 CO
5 H CO
⇒
CO 1 H O
(7)
3
2
3
2
2
3.2. Apparatus and operation
The intermediate product, hydrogen carbonate
acid, is unstable, and it will be converted to carbon
All measurements were carried out using a HP-
dioxide instantly. We can then apply the developed
7694 automatic headspace sampler and a Model
PRC technique to determine nonvolatile species in
HP-6890 capillary gas chromatograph equipped with
kraft black liquors. The following reactions can be
a thermal conductivity detector (Hewlett-Packard,
used to describe the kraft black liquor acidification
now Agilent Technologies, Palo Alto, CA, USA).
reaction:
GC conditions were: capillary column of 30 m30.53
1
22
mm I.D. (Model GS-Q; J&W Scientific, Folsom,
2H 1 CO
⇒
CO 1 H O
(8a)
3
2
2
CA, USA) at 308C, carrier gas helium flow-rate of
1
22
3.1 ml / min. Headspace sampler operating conditions
2H 1 S
⇒
H S
(8b)
2
were: oven temperature of 608C; 0.5 min strong
1
2
shaking of the sample; vial pressurized by nitrogen
H 1 CH S
⇒
CH SH
(8c)
3
3
and pressurization time of 0.2 min; sample-loop fill
time of 0.2 min; loop equilibration time of 0.05 min;
In this study, we will only demonstrate simulta-
22
vial equilibration time of 0.5 min; and loop fill time
neous analysis of carbonate (CO
) and sulfide
3
22
of 1.0 min.
(S
) in spent pulping liquors with thermal con-
The sample preparation and measurement pro-
ductivity detection.
cedures were as follows: A sample vial of 21.6 ml
was first sealed with a PTFE / butyl molded septum
4.1. Temperature effect
(catalog No. 73822A-20; Kimble Kontes, Vineland,
NJ, USA). The sample vial was then purged by
By acidification, the carbonate can be instantly
nitrogen gas at a flow-rate of 130 ml / s for 2 min to
converted into carbon dioxide that has a very low
25
eliminate the carbon dioxide present in the air in the
solubility (1.6?10
) in water at room temperature.
vial headspace before adding 0.5 ml of 2 mol / l
A higher temperature can accelerate the decomposi-
sulfuric acid. The sealed and nitrogen-purged vial
tion of H CO
into carbon dioxide, as shown in
2
3
was injected 10–1000 ml of sample solution using a
reaction (7), to completely remove the carbon diox-
microsyringe and placed in the headspace sampler
ide in the liquid phase into the vapor phase. Thus the
tray for automatic HS-GC measurements. Most
sensitivity of determination can be improved. The
industrial liquid samples, such as weak and concen-
vapor of an acidic medium is corrosive to the GC
trated black liquors, white liquors, and green liquors,
sampling channel. Therefore, a mild headspace tem-
can be directly injected into the sample vial for
perature (608C) was chosen in the present study. An
analysis without pretreatment. Solid samples, must
excess amount of acid can guarantee a complete
be dissolved in water before analysis.
conversion of carbonate into carbon oxide. However,
using a higher concentration of acid will increase the
risk of the corrosion problem in the headspace
4. Results and discussion
sampler.
To demonstrate the PRC-HS-GC technique, we
4.2. Detector linearity and constant condensed
first demonstrate the measurement of carbonate in
phase conversion rate tests
aqueous sodium carbonate solutions through the
measurements of product-gas carbon dioxide after
One key assumption adopted in the present PRC-

X
.-S. Chai et al. / J. Chromatogr. A 909 (2001) 249 –257
253
HS-GC is that condensed phase conversion rate is a
The variations in headspace gas dilution were
constant at a given set of reaction conditions. It is
achieved through the variations in the initial sample
well known that a GC thermal conductivity detector
size of the two reactants to alter the postreaction
linearly responds to the mass of carbon dioxide in a
headspace volume V 2 V
in the reactor (sample
T
L
sample within the detector linearity range. We can
vial). We conducted two sets of experiments using a
use the detector linearity to verify that a constant rate
fixed volume V 50.5 ml of sulfuric acid (reactant R)
R
of conversion of carbonate to carbon dioxide has
to react with carbonate. The first set of experiments
been achieved in Eqs. (7) and (8a). We conducted a
used nine samples of aqueous sodium carbonate
set of experiments using an aqueous sodium carbon-
solution containing the same amount of carbonate of
ate solution of concentration 0.1 mol / l with different
1.06 mg but with sample sizes ranging from V 5100
S
sample sizes to react with a fixed volume V 50.5 ml
to 350 ml. When the same amount of carbonate is
R
of sulfuric acid (reactant R) of concentration 2 mol / l.
used in experiments, with the approximation of the
It was found that the measured detector signal peak
postreaction headspace volume equal to [V 2 (V 1
T
R
areas are linearly proportional to the masses of
V )], the effect of headspace dilution through the
S
carbonate contained in the samples up to a sample
variation of sample size on the measured GC signals
size of about 100 mmol. Linear least-square fits of
can be calculated. For a sample vial of 21.6 ml, the
the data yield a linear equation of A525.76m
GC signal variation will be less than 5% when the
B
between the detector signal, A, and carbonate mass,
same size V varied from 100 to 1100 ml or (V 1 V )
S
R
S
2
m
(in mmol), with an R 50.9998. These results
varied from 600 to 1600 ml. The present commercial
B
indicate that the rate of conversion from carbonate to
HS-GC system uses a constant pressure head during
carbon dioxide is a constant under the reaction
pressurization, which counterbalances the effect of
temperature of 258C with a ratio of sulfuric acid to
headspace dilution on GC signal induced by the
carbonate of 10. The results also indicate that the
variation of sample size. Table 1 lists the measured
detector response is linear up to a carbon dioxide
GC detector signal peak areas obtained in the first set
mass of 100 mmol. Similar experiments were also
of experiments. The results show that the relative
conducted to demonstrate the constant rate of con-
standard deviation (RSD) of the nine measurements
version of carbonate to carbon dioxide in kraft black
is only 1.3%, indicating the variations in headspace
liquors when acidified, as will be discussed in detail
dilution induced by the variations in initial total
in the next section.
volume of the two reactants (V 1 V ) from 600 to
R
S
850 ml has a negligible effect.
4.3. Effect of the variations in headspace gas
The second set of experiments used 14 samples of
dilution on measurement accuracy
a black liquor derived from kraft pulping of loblolly
pine with TDSs of 17%. The sample sizes varied
In theory, we can calculate the effect on analysis
from V 520 to 300 ml. Because the mass of carbon-
S
accuracy of variations in headspace dilution between
ate is proportional to the sample size for a given
the calibration and the individual testing experiment.
liquor, it is expected that the measured GC detector
However, such a calculation requires knowing the
signals of carbon dioxide in these 14 samples should
volumes of the postreaction headspace in these
be linearly proportional to the sample size V if a
S
experiments and the exact amounts of the products
constant rate of conversion from carbonate to carbon
formed during these phase conversion reactions.
dioxide is achieved. It was found that the GC
Furthermore, it requires to know the amount of inert
detector signal peak areas A fit to a straight line of
2
gas added into the sample vial during the individual
y 50.707x with respect to V very well with R 5
S
pressurization process, an amount which is often not
0.9985, indicating that sample-size variation within a
readily measurable.
total reactant volume (V 1 V ) range of 520–800 ml
S
R
We will use the carbonate examples to study the
does not create significant variations in headspace
effect of variations in headspace gas dilution on the
dilution to affect the measurement accuracy. More
validity of the unity ratio of dilution assumption
importantly, the results indicate that the effect of the
adopted in the present PRC-HS-GC experiments.
variations in headspace dilution due to variations in

254
X
.-S. Chai et al. / J. Chromatogr. A 909 (2001) 249 –257
Table 1
Effect of sample size on measurement accuracy
Sample volume
Concentration of Na CO
Mass of Na CO
Detector signal peak area
Relative error
2
3
2
3
(ml)
(mol / l)
(mg)
(A)
(%)
100
0.1000
1.06
240.5
0.55
120
0.0830
1.06
241.3
0.89
140
0.0714
1.06
240.1
0.39
160
0.0625
1.06
235.2
21.66
180
0.0556
1.06
237.5
20.70
200
0.0500
1.06
245.6
2.69
250
0.0400
1.06
238.2
20.41
300
0.0333
1.06
237.5
20.70
350
0.0286
1.06
236.7
21.04
Mean
239.2
RSD (%)
1.3
headspace total pressure caused by the different
4.5. Measurement precision
amounts of carbon dioxide and other gases produced
in the 14 experiments also does not significantly
Two sets of repeatability tests were conducted to
affect the measurement accuracy. The excellent
study the precision of the present PRC-HS-GC
linearity relationship between detector signal, A, and
technique. A volume of 100 ml aqueous sodium
sample size, V , also verifies that the constant rate of
carbonate solution of concentration 0.1 mol / l was
S
conversion of carbonate to carbon dioxide has been
analyzed five times in the first set of experiments. A
achieved even in a kraft black liquor that has a very
volume of 100 ml kraft black liquor from pulping of
complex sample matrix.
loblolly pine was also analyzed five times in the
second set of experiments. The measured GC detec-
tor signal peak areas in these two sets of experiments
4.4. Effect of carbon dioxide in air
are listed in Table 2. The results show that the RSDs
are only 0.62 and 3.74% for the two sets of tests,
The carbon dioxide concentration in standard air is
respectively, indicating excellent repeatability and
about 15 mmol / l. It is estimated that there are about
precision of the present experiments.
0.3 mmol of carbon dioxide present in the air within
a 21.6-ml sample vial, which is greater than the
4.6. Effect of sample size
sensitivity of the detector of 0.1 mmol and can affect
measurement accuracy in solutions that have low
The effect of the variations in sample size on
carbonate concentrations. In particular, a very small
sample size is recommended in using PRC-HS-GC.
Table 2
Repeatability tests of the present PRC-HS-GC method
To improve measurement accuracy, it is necessary to
eliminate the carbon dioxide contained in the air
Replica
Detector signal peak area (A)
within a sample-vial headspace by purging the
0.1 mol / L Na CO
Kraft black liquor
2
3
sample vials (reactors) with nitrogen before adding
1
238.9
69.8
reactants. The vials were thoroughly purged by
2
242.7
64.0
nitrogen using a 23-gauge needle to reduce the
3
242.2
69.3
carbon dioxide. The results indicate that a 2-min
4
240.5
70.0
5
241.3
69.7
nitrogen purge at a flow-rate of 130 ml / min is
sufficient to reduce carbonate dioxide to a nondetect-
RSD (%)
0.62
3.74
able level.
X
.-S. Chai et al. / J. Chromatogr. A 909 (2001) 249 –257
255
headspace gas dilution and rate of condensed phase
conversion is negligible as long as the total initial
reactant sample size is within 1 ml as we discussed
previously. Because of the postreaction headspace
volume approximation adopted in Eq. (5), there is a
systematic error in using Eq. (5) that overpredicts the
analyte concentration C . In the present study, the
B
sample vial volume V 521.6 ml, the initial volume
T
of sulfuric acid (reactant R) is fixed at V 50.5 ml,
R
the maximum initial volume of the unknown sample
V 5300 ml. The final total volume of the condensed
S
phase at the completion of the phase conversion
reaction can be approximated to V
¯V 1V . Then
L
R
S
Eq. (5) overpredicts carbonate concentration by
about
¯3.7%. If the carbonate concentration is low
in the sample, a larger sample volume must be used
due to the detector sensitivity requirement (the
sensitivity of the present detector is about 0.1 mmol
of CO ). In these applications, the postreaction
2
headspace volume (V 2 V ) can always be measured
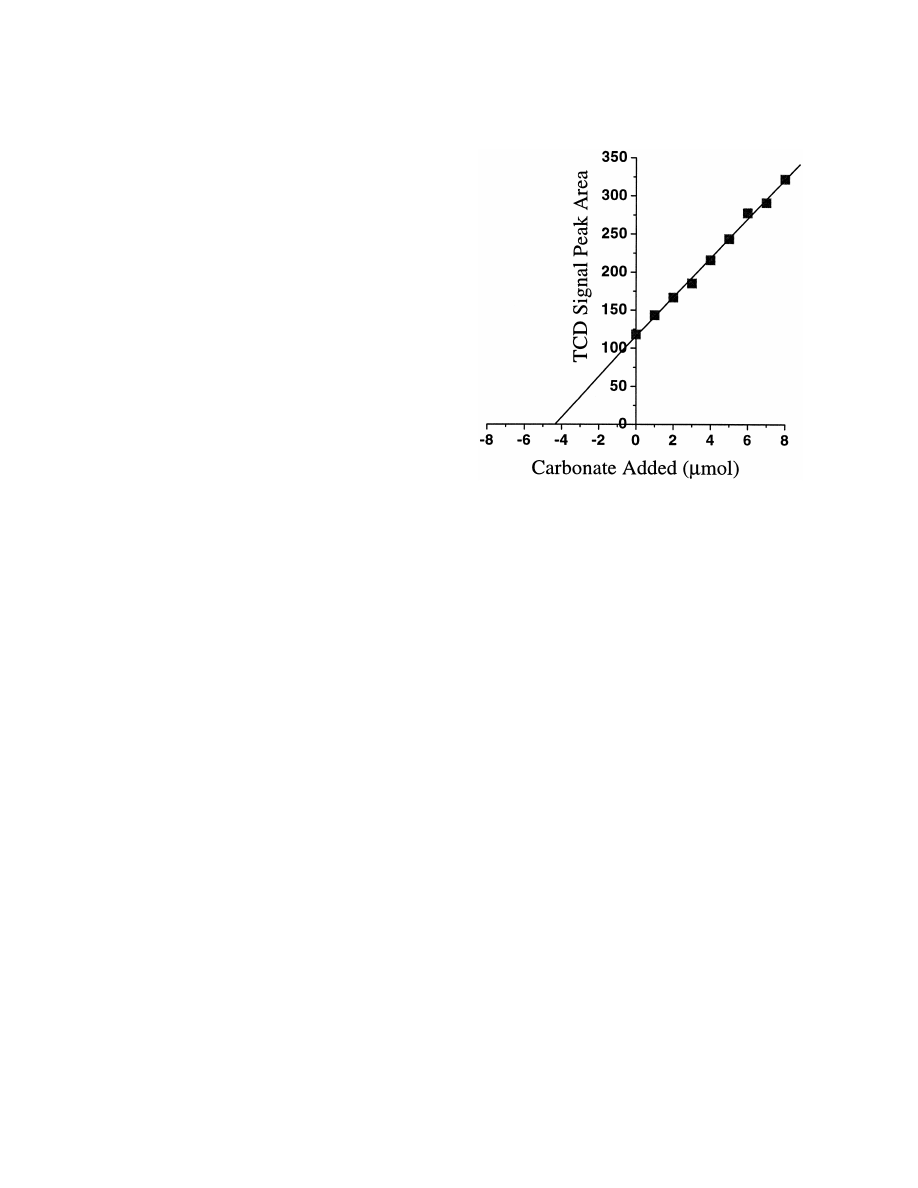
Fig. 1. Validation of measured carbonate in a black liquor sample.
T
L
2
j5Experimental data; ———: y5115.7125.645x, R 50.9963.
and the results should be used if it is not small
TCD5Thermal conductivity detection.
compared to the volume of the sample vial. It is also
recommended that the same initial volumes of the
two reactants V 1 V should be used in the cali-
R
S
bration experiment as well as in the individual
intercept of 4.5 mmol on the x-coordinator of the
sample analysis experiment to reduce the uncertain-
fitted line is the original carbonate contained in the
ties due to headspace gas dilution.
unknown black liquor sample; thus the carbonate
concentration in the black liquor sample is 0.045
4.7. Experimental calibration and method
mol / l. We then calculate the carbonate concentration
validation
in the sample using Eq. (5) to be 0.044 mol / l. The
difference is only 2.2%, indicating the validity of the
Calibration was conducted using aqueous sodium
PRC-HS-GC method.
carbonate solutions for all the carbonate analysis
The measurements of carbonate in three different
conducted in this study. A set of seven sodium
types of kraft mill samples, i.e., white, green, and
carbonate solution samples with a constant sample
black liquor samples, using the present method, were
size of 100 ml was used. The concentrations of
compared with two reference methods: coulometry
sodium carbonate in these samples were varied to
and titrametry. A coulometric method was used by a
achieve the desired mass of sodium carbonate. A
commercial analytical laboratory (Huffman Labs.,
linear calibration equation of m 5fA was obtained
Golden, CO, USA) to measure the carbonate in the
B
2
with an R 50.999 and a calibration constant f 5
five solid black liquor samples, which had been
28
26
3.726?10
or k 51.725?10
to be used in Eq. (5).
concentrated by evaporation and then oven dried
The present PRC-HS-GC method was validated by
under temperature about 1058C. The carbonate in
a standard addition method. We added various known
white and a green liquors was measured using a
amounts of sodium carbonate in an unknown black
titrametric method [14] in our laboratory. The com-
liquor sample of 100 ml. Then we conducted HS-GC
parisons listed in Table 3 indicate that the present
measurements. It was found that the measured
method is in good agreement with the two reference
detector signal peak areas fit to a straight line very
methods. The maximum relative difference is less
well as shown in Fig. 1. The absolute value of the
than 4%.

256
X
.-S. Chai et al. / J. Chromatogr. A 909 (2001) 249 –257
Table 3
Comparisons of measured carbonate in kraft mill liquors by the reference methods and the present PRC-HS-GC method
a
Sample
Carbonate carbon (%, w / w)
Relative difference
(%)
PRC-HS-GC
Coulometry
Black liquor solid 1
1.97
2.05
24.1
Black liquor solid 2
1.78
1.83
22.5
Black liquor solid 3
0.98
0.95
3.0
Black liquor solid 4
1.52
1.51
0.7
Black liquor solid 5
1.61
1.53
5.0
Sodium carbonate (g / l as Na O)
2
PRC-HS-GC
ABC titration
White liquor
24.6
23.8
3.3
Green liquor
45.8
45.5
0.7
a
The 0.4–1.1 g of solid samples were accurately weighed and dissolved in 20 ml of distilled water.
4.8. Simultaneous multiple species measurements
the measurements of nonvolatile species in liquid or
solid samples. The technique is demonstrated by the
Sodium sulfide in black, white, and green liquors
measurements of carbonate in aqueous sodium car-
can be easily determined by titrametry. In this study,
bonate solutions, as well as kraft white, green, and
we demonstrate the versatility of PRC-HS-GC for
black liquor samples. A very small amount of
simultaneous multiple species analysis of carbonate
sulfuric acid (volume of 0.5 ml, concentration of 2
and sulfide through acidification reactions (8a) and
mol / l) is used to acidify the samples (volume less
(8b). A white, green, and weak black liquor were
than 300 ml) to convert the dissolved carbonate
used. Carbonate and sodium sulfide concentrations in
(condensed phase) into carbon dioxide (gas) in a
the white and green liquors were measured by both
sample vial (reactor) that is analyzed by a thermal
titrametry [14] and PRC-HS-GC. Because titrametry
conductivity detector through a headspace sampler.
cannot be applied to black liquors for carbonate
Aqueous sodium carbonate solutions are used to
determination, carbonate was only measured by
calibrate the GC detector signal for carbonate de-
PRC-HS-GC along with sodium sulfide as shown in
termination. The technique is first validated by a
Table 4. Excellent agreement was obtained between
standard addition approach using a kraft black liquor.
the PRC-HS-GC and titrametry.
The measured carbonate concentrations by the pres-
ent PRC-HS-GC in five solid black liquor samples
were compared with those measured using a
5. Conclusions
coulometric method by commercial laboratory. Ex-
cellent agreements were obtained. Similar compari-
We have developed a PRC-HS-GC technique for
sons of the measured carbonate concentrations in
Table 4
Comparisons of measured carbonate and sodium sulfide in white, green and black liquor by the reference methods and the present
PRC-HS-GC method
Sample
Sodium carbonate (g / l as Na O)
Sodium sulfide (g / l)
2
HS-GC
Titrametry
Relative difference (%)
HS-GC
Titrametry
Relative difference (%)
WL
24.6
23.8
3.4
42.9
41.1
2.5
GL
45.8
45.5
0.7
45.8
47.4
23.4
BL
0.6
N /A
N /A
10.2
9.8
4.1

X
.-S. Chai et al. / J. Chromatogr. A 909 (2001) 249 –257
257
[2] B.V. Ioffe, A.G. Vitenbery, Headspace Analysis and Related
kraft white and green liquors were also made be-
Methods in Gas Chromatography, Wiley, New York, 1984.
tween the PRC-HS-GC and a titrametric method
[3] B. Kolb, L.S. Ettre, Static Headspace-Gas Chromatography –
[14], with good agreement. We also conducted
Theory and Practice, Wiley–VCH, New York, 1997.
simultaneous analysis of carbonate and sodium sul-
[4] J. Drozd, J. Novak, J. Chromatogr. 165 (1979) 141.
fide in kraft white, green, and black liquor to
[5] J. Namiesnik, T. Gorecki, M. Biziuk, Anal. Chim. Acta 237
(1990) 1.
demonstrate the versatility of the PRC-HS-GC meth-
[6] B. Kolb, J. Chromatogr. A 842 (1999) 163.
od. It greatly simplified the analysis of carbonate in
[7] J. Drozd, J. Novak, J. Chromatogr. 136 (1977) 27.
kraft black liquors. It is simple, rapid, automatic, and
[8] M. Markelov, J.P. Guzowski Jr., Anal. Chim. Acta 276
accurate. It can be applied to analysis of other
(1993) 235.
nonvolatile species in a wide range of industrial and
[9] J.P. Romano, D.R. Salomom, in: Proceedings of the 1992
Tappi Pulping Conference, 1992, p. 303.
environmental samples.
[10] J. Krishnagopalan, M. Hill, A.L. Fricke, Tappi J. 68 (1985)
108.
[11] D.B. Easy, M.L. Borchardt, A.A. Webb, PaPuu 67 (1985)
Acknowledgements
501.
[12] Tappi Test Method, T 699 om-87, Atlanta, GA, 1987.
[13] D.G. Davis, in: H.H. Bauer, G.D. Christlan, J.E. O’Reilly
This work was supported by the US Department of
(Eds.), Instrumental Analysis, Allyn Bacon, Boston, MA,
Energy (DE-FC07-96ID13438).
1978, p. 102.
[14] R.G. MacDonald (Ed.), Pulp and Paper Manufacture, 2nd
ed., The Pulping of Wood, Vol. 1, McGraw-Hill, New York,
References
1969, p. 563.
[1] H. Hachenberg, A.P. Schmidt, Gas Chromatographic Head-
space Analysis, Heyden, London, 1977.
Wyszukiwarka
Podobne podstrony:
Antigone Analysis of Greek Ideals in the Play
Analysis of Police Corruption In Depth Analysis of the Pro
Imaging of Water Flow in Porous Media by Magnetic Resonance
Chizzola GC analysis of essential oils in the rumen fluid after incubation of Thuja orientalis tw
Foresight analysis of wind power in Turkey
Quantitative dilatometric analysis of intercritical annealing in a low silicon TRIP steel
Solid Phase Microextraction Analyses of Flavor Compounds in
Chizzola GC analysis of essential oils in the rumen fluid after incubation of Thuja orientalis tw
Foresight analysis of wind power in Turkey
Recovery of cichlid species in Lake Victoria 2000 (angol)
An analysis of energy efficiency in the production of oilseed crops
An agro economic analysis of willow cultivation in Poland 2006
Analysis of chlorobenzenes in soils by HS SPME and GC MS
„SAMB” Computer system of static analysis of shear wall structures in tall buildings
Freedom in the United States Analysis of the First Amendme
[2006] Analysis of a Novel Transverse Flux Generator in direct driven wind turbine
Homosexuals in the Military Analysis of the Issue
Intraindividual stability in the organization and patterning of behavior Incorporating psychological
więcej podobnych podstron