
SAMPLE PREPARATION/CONCENTRATION FOR TRACE
ANALYSIS IN GC/MS
(A study of solid phase microextraction and
headspace sampling)
by
Yuwen Wang
Dissertation Submitted to the Faculty of the Virginia Polytechnic Institute and
State University
in partial fulfillment of the requirements for the degree of
DOCTOR OF PHILOSOPHY
in
Chemistry
APPROVED:
Dr. Harold M. McNair, Chairman
Dr. John G. Dillard
Dr. James O. Glanville
Dr. Gary L. Long
Dr. Mark R. Anderson
December 11, 1997
Blacksburg, Virginia
Key words
:
Sample preparation/concentration, Trace Analysis,
GC/MS, SPME, MAE
Copyright 1997, Yuwen Wang.

SAMPLE PREPARATION/CONCENTRATION FOR TRACE ANALYSIS IN
GC/MS
(A study of solid phase microextraction and
headspace sampling)
by
Yuwen Wang
(ABSTRACT)
Solid Phase Microextraction (SPME) associated with Microwave Assisted
Extraction (MAE)
(1-3)
, on-line headspace derivatization
(4-6)
and the selectivity of
different SPME coatings
(7)
were studied. Trace amounts of Veltol
, Veltol Plus
and short chain fatty acids in food samples were analyzed by GC/MS.
Since SPME is not directly applicable to solid samples, SPME associated
with MAE techniques was studied for solids, primarily food samples. The
efficiency of classical solvent extraction and MAE was compared. The
parameters which affect SPME, were optimized for the determination of Veltol
and Veltol Plus
in food products such as potato chips and coffee. The technique
gave a detection limit of 2 ppb for Veltol Plus
which is 200 times more sensitive
than conventional GC technique.
Headspace injection is characterized by simple and easy handling of
complicated solid and solution matrices. Headspace injection, however, is not
suitable for high molecular weight substances or non-volatile compounds. An on-
line derivatization headspace technique was studied for short chain fatty acids.
These samples are difficult to do by classical GC. The developed technique
simplified the conventional derivatization procedures and combined the sample
preparation and GC/MS analysis into one step. The thermostatting temperature,

time, solvent and matrix effects were investigated. Low calorie fat and some
agricultural samples were analyzed. The detection limit for acetic acid is 8 ppb.
SPME is a novel sample introduction technique. The behavior of
di(methylsiloxane), polyacrylate and Carbowax coatings on SPME fibers for
compounds having different functional groups were investigated. The selectivities
of the coating, sample pH and the sample temperature were investigated.

iv
ACKNOWLEDGEMENTS
I would like to express my sincerest gratitude to my adviser, Professor
Harold M. McNair, not only for his support, advise and help during my study in
Virginia Tech, but also for his friendship.
I would also like to thank Dr. John G. Dillard, Dr. James O. Glanville, Dr.
Gary L. Long and Dr. Mark R. Anderson for serving as my research committee
members.
My colleagues and friends also deserve my thanks. They are: Dr. Maha
Khaled, Dr. Marissa Bonilla, Dr. Xiaowei Sun, Stephanye Armstrong, Gail Reed,
and Mark Schneider. Especially Dr. Maha Khaled and Dr. Marissa Bonilla who
gave me a lot of support in supplying the samples and helpful discussions.
With deepest love and appreciation, I would like to thank my father Ji
Wang, mother Guiying Ma, sisters and parents-in-law for their constantly support
and encouragement.
Most importantly, I would like to thank my wife Zengjuan Li and my son Lei
Wang for their love and support.

v
TABLE OF CONTENTS
ABSTRACT
ii
ACKNOWLEDGEMENTS
iv
TABLE OF CONTENTS
v
LIST OF FIGURES
viii
LIST OF TABLES
x
CHAPTER I INTRODUCTION
1
CHAPTER II LITERATURE REVIEW
4
2.1 Solid Phase Microextraction (SPME)
4
2.2 SPME-Headspace
9
2.3 Headspace sampling
12
2.4 Microwave Assisted Extraction (MAE)
18
CHAPTER III SPME ASSOCIATED WITH MAE
21
3.1 Introduction
21
3.2 Experimental
24
3.2.1 SPME-MAE extraction
24
3.2.2 Analysis of food products
25
3.2.2.1 Beverages
25
3.2.2.2 Solid food products
25

vi
3.2.3 GC/MS analysis
25
3.3 Results and discussions
26
3.3.1 Optimization of SPME absorption conditions
26
3.3.1.1 pH
26
3.3.1.2 Ionic strength
26
3.3.1.3 Absorption time
29
3.3.1.4 Fiber conditioning
29
3.3.1.5 GC inlet
31
3.3.2 SPME associated with MAE
31
3.3.2.1 MAE with water as solvent for hydrophobic
sample matrices
32
3.3.2.2 MAE with water as solvent for water
soluble sample matrices
33
3.3.3 Comparison of SPME with conventional syringe
injection
33
3.3.3.1 Detection limits
33
3.3.3.2 Precision
35
3.3.4 Application of SPME in food products
37
3.3.4.1 Beverages
37
3.3.4.2 Chips and corn
37
3.4 Conclusions
44
CHAPTER IV HEADSPACE SAMPLING – ON LINE DERIVATIZATION
45
4.1 Introduction
45
4.2 Experimental
48
4.2.1 Chemicals
48
4.2.2 Instrumentation
48
4.2.3 Sample analysis
48
4.3 Results
50
4.3.1 Optimization of the method
50

vii
4.3.1.1 Derivatization
50
4.3.1.2 Thermostatting temperature and time
50
4.3.1.3 Solvents
58
4.3.1.4 Salt effect
58
4.3.2 Precision
61
4.3.3 Sample matrix effect
61
4.3.4 Calibration
64
4.3.5 Sample analysis
64
4.4 Discussions
71
4.5 Conclusions
72
CHAPTER V BEHAVIOR OF SPME COATINGS
73
5.1 Introduction
73
5.2 Experimental
74
5.2.1 Fiber coatings
74
5.2.2 SPME extraction
76
5.2.3 Temperature study
76
5.2.4 GC/MS
76
5.3 Results and discussion
78
5.3.1 SPME coating
78
5.3.2 Degrees of absorption
78
5.3.3 Modifications of the sample matrices
80
5.3.4 Temperature effect
89
5.4 Conclusion
90
CHAPTER VI GENERAL CONCLUSIONS
94
LITERATURE CITED
96
VITA
104

viii
LIST OF FIGURES
Figure
Description
Page
Fig. 1
Schematic diagram of SPME assembly
6
Fig. 2
Schematic diagram of SPME absorption
7
Fig. 3
Schematic diagram of SPME-headspace
11
Fig. 4
Schematic diagram of headspace vial containing
a liquid sample
13
Fig. 5
Schematic diagram of the automatic balanced
pressure system
14
Fig. 6
Schematic diagram of MAE vessel
19
Fig. 7
Structures of Veltol
and Veltol-Plus
23
Fig. 8
Influence of pH on absorption by SPME fiber
27
Fig. 9
Effect of salt on SPME extraction
28
Fig. 10
Influence of absorption time on extraction
efficiencies of Veltol
and Veltol-Plus
30
Fig. 11
Comparison of SPME injection and direct GC
39
Fig. 12
Chromatograms of coffee by both SPME and
direct GC injection
42
Fig. 13
Chromatograms of potato chips by direct MAE-injection
and MAE-SPME
43
Fig. 14.
Headspace of fatty acid trimethyl esters (10 ppm)
51
Fig. 15
Effect of BSTFA volume
53
Fig. 16
Effect of thermostatting temperature (1)
54
Fig. 17
Effect of thermostatting temperature (2)
55
Fig. 18
Effect of headspace equilibration time on mass
spectrometry peak area (1)
56
Fig. 19
Effect of headspace equilibration time on mass

ix
spectrometry peak area (2)
57
Fig. 20
Effect of solvents
59
Fig. 21
Salt effect
60
Fig. 22
Effect of sample matrix on headspace sampling
63
Fig. 23
Calibration curves of formic, acetic, propionic and
butyric acid trimethylsilyl ester using Salatrim
matrix
66
Fig. 24
Calibration curves of pentanoic, hexanoic,
heptanoic and octanoic acid trimethylsilyl esters
using Salatrim matrix
67
Fig. 25
Typical sample chromatogram of low calorie fat
69
Fig. 26
Typical sample chromatogram of tea
70
Fig. 27
Schematic chemical structures of fiber coatings
79
Fig. 28
pH effect on acid absorption in poly(dimethylsiloxane)
(PDMS) coating
83
Fig. 29
pH effect on amine absorption in PDMS coating
84
Fig. 30
pH effect on acid absorption in polyacrylate
(PA) coating
85
Fig. 31
pH effect on amine absorption in PA coating
86
Fig. 32
pH effect on acid absorption in Carbowax coating
87
Fig. 33
pH effect on amine absorption in Carbowax coating
88

x
LIST OF TABLES
Table
Description
Page
Table 1
Dielectric constant of common solvents
20
Table 2
Effect of injector temperature on peak area
32
Table 3
Comparison of extraction efficiency of solvent with MAE (1) 34
Table 4
Comparison of extraction efficiency of solvent with MAE (2) 36
Table 5
Comparison of detection limits
38
Table 6
Precision of direct and SPME injection
41
Table 7
GC and headspace conditions
49
Table 8
Reproducibility of fatty acid trimethylsilyl esters
in headspace GC/MS
62
Table 9
Regression analysis results
65
Table 10
Content of free acids in commercial products
68
Table 11
Parameters of fiber coatings
75
Table 12
Amount absorbed at different coatings for
compounds having ten carbons
81
Table 13
Amount absorbed at different coatings for
compounds having fourteen carbons
81
Table 14
Temperature effect on PDMS absorption
91
Table 15
Temperature effect on PA absorption
92
Table 16
Temperature effect on Carbowax absorption
93

1
CHAPTER I
GENERAL INTRODUCTION
With the development of advanced analytical techniques, trace and ultra
trace analysis have been a major challenge for analytical chemists. Analytical
chemistry involves the separation, identification, and quantitation of target
compounds in complex samples. In analytical chemistry, chromatography is the
most widely used separation technique. Modern chromatographic techniques
have an excellent separation power. They are versatile and allow the use of a
variety of detection techniques. Sensitive detectors have been well developed
and are commonly applied. However, due to the increasing requirements of
environmental and toxiological regulations, the current detection limits cannot
meet all needs, so sample enrichment is frequently required before introduction
into the chromatographic system. As a result, sample preparation is most time
consuming and costly part of many analyses.
The goal of any sample preparation step is to yield the analytes of interest
in a form and concentration that can be readily analyzed. Extractions using
liquids, such as Soxhlet extraction and liquid-liquid extraction, are routinely used
in laboratories throughout the world. Unfortunately, these methods are generally
time consuming and sometimes require large amounts of toxic and expensive
organic solvents. Supercritical Fluid Extraction (SFE) is an advanced extraction
technique. It is characterized by the use of a non-toxic, easily removed
supercritical fluid such as carbon dioxide. However, the expensive equipment
and the high cost of ultra pure carbon dioxide limits its usage. For a successful
chromatographic analysis, both the sample preparation step and the
chromatographic process should be optimized carefully. The continuous search
for rapid, efficient, cost effective and environment-friendly means of analytical
extractions has prompted the introduction of Solid Phase Microextraction (SPME)
into the field of analytical chemistry. The technique is fast, simple, sensitive and

2
does not require an extracting solvent. During the past five years, the application
of SPME has experienced a rapid advance. Since the preferred matrix for SPME
is water, the technique has been mainly used for trace organics in drinking,
ground and waste water.
In order to expand the technique to solid samples, a headspace-SPME
technique has also been developed. The combination of SPME and headspace
GC combines the advantages of both techniques.
Static headspace sampling is a common technique for gas
chromatography. Headspace sampling is characterized by using a simple
sample preparation procedure for complicated liquid and solid matrices. Since
the sample has to be heated and the analytes passed through a transfer line, it
can only be used for volatile and thermally stable samples.
The primarily goal of this thesis has been to extend the applicability of
trace and ultra trace analysis by using different sampling techniques including
SPME and headspace with some modifications to overcome their natural
limitations.
The thesis consists of six chapters. Chapter I is a general introduction.
Chapter II introduces the techniques used and describes their development
during recent years. The techniques involved include SPME, headspace, SPME-
headspace and microwave assisted extraction (MAE). Chapters III, IV and V deal
with studies of these respective techniques.
In order to efficiently use SPME techniques and explore the use of SPME
for solid samples, Chapter III discusses the association of SPME techniques with
microwave assisted extraction (MAE). Trace amounts of Veltol
and Veltol Plus
(flavor enhancers in food) were concentrated and analyzed by GC/MS.

3
Headspace-GC is not suitable for some polar compounds such as organic
acids and bases due to their limited volatility or thermal stability. The analysis of
these compounds are also difficult in both GC and HPLC because of their strong
adsorption in GC columns and their lack of chromophores for UV detection in
HPLC. Chapter IV discusses an on-line derivatization technique for headspace
GC-MS. The trace analysis of short chain fatty acids was carried out using this
technique.
Chapter V is a fundamental study of the selectivities of SPME fiber
coatings with different functional groups . The purpose of this study was to
attempt to understand the absorption mechanism and develop general guidelines
for the SPME technique.
Chapter VI contains the conclusions for the research.

4
CHAPTER II
LITERATURE REVIEW
2.1 Solid Phase Microextraction(SPME)
SPME is a new sample enrichment technique which can easily transfer
the analytes to the GC inlet. Since the invention of the technique in 1989 by J.
Pawliszyn
(8)
its applications have dramatically increased. It has been used
mainly for environmental water analysis
(9-36)
.
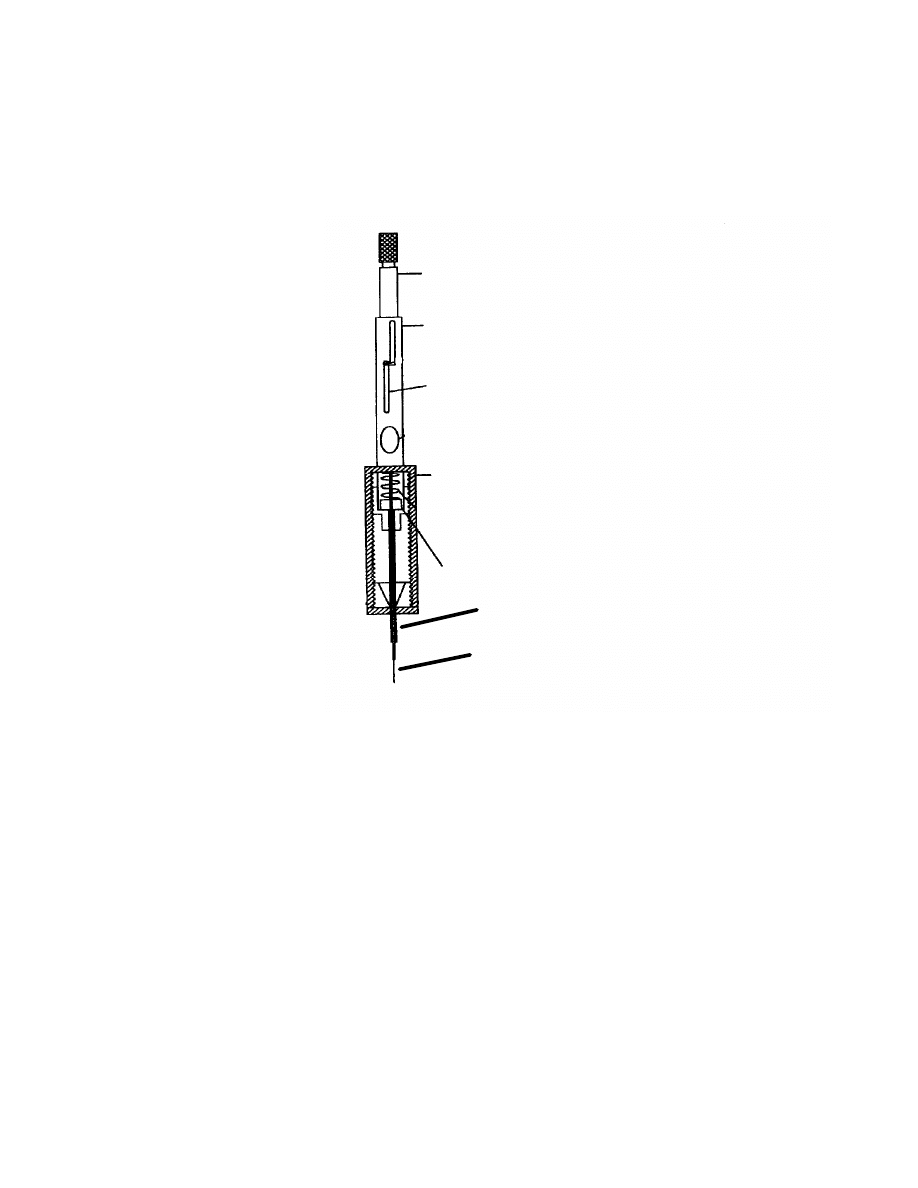
The basic equipment of SPME is simple. As shown in Fig 1, a fused-silica
rod is connected to a stainless steel tube that can be withdrawn inside a syringe
needle, after sampling, for protection and transfer to GC inlets. The fused silica is
coated with a thin film of hydrophoic usually dimethylsiloxane. During SPME
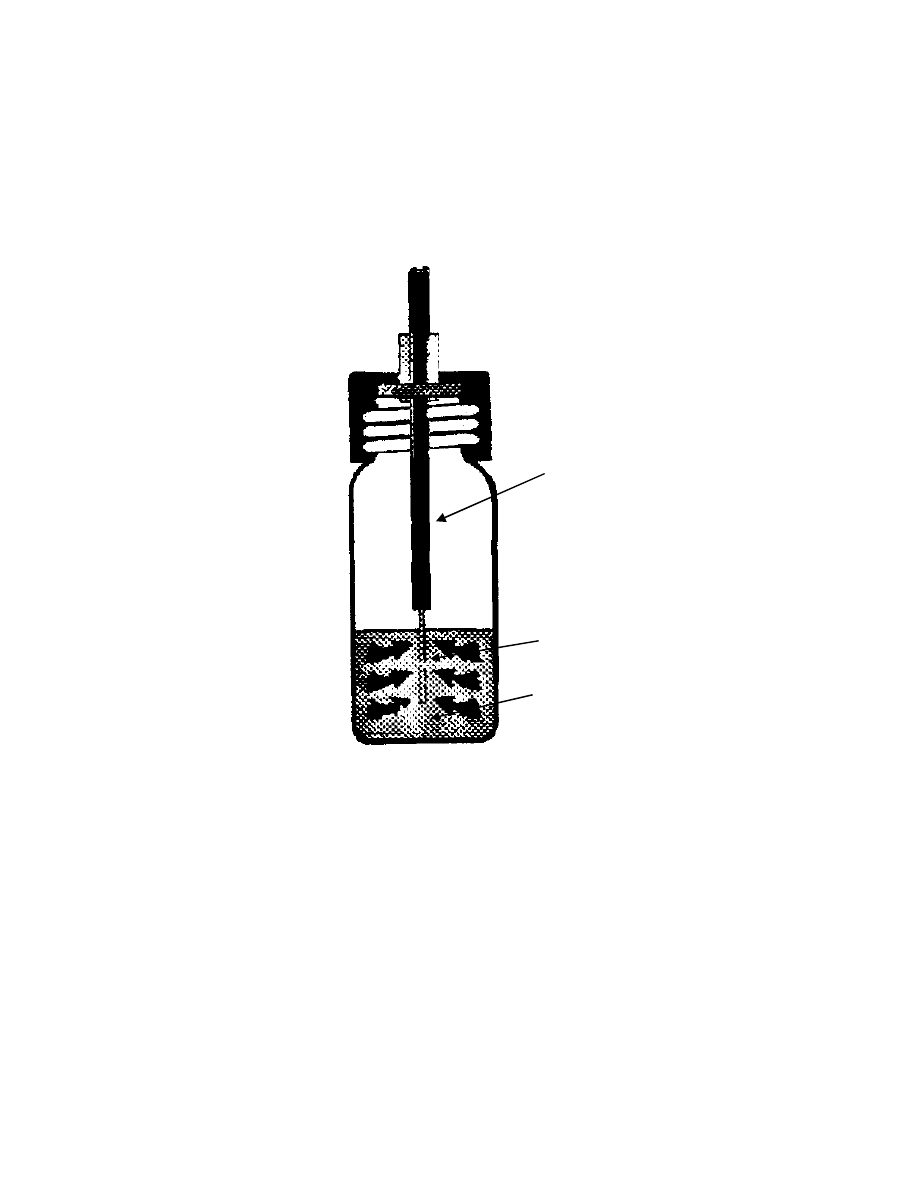
sampling, the fiber is lowered from the syringe needle and inserted into the
aqueous sample solution. The fiber coating is exposed to the stirred sample and
the analytes are absorbed into the fiber coating. When the sampling is complete,
the fiber is first withdrawn into the syringe needle and then transferred to a
heated GC inlet. The analytes are then thermally desorbed and transferred into
the GC column.
SPME preserves all the advantages of Solid Phase Extraction (SPE) such
as simplicity, low cost, easy automation and on-site sampling. It also eliminates
one disadvantages of SPE, the use of organic solvents. No special thermal
desorption equipment is used and no modification of the GC inlet are required.
SPME integrates the sample preparation and GC injection into one step.
Because SPME is a static extraction process, the surface area is not as critical
as in SPE and detection limits as low as ppt are often reported
(37)
.

5
The basic principle of SPME sampling is the partitioning of the analytes
between the fiber coating and the sample matrix. When equilibration of the
analyte between the fiber coating and sample is reached, the partition coefficient
can be defined as:
K
SPME
= C
f
/C
s
(1)
Where K
SPME
is the partition coefficient, C
f
is the concentration of analyte in the
fiber coating and C
s
is the concentration of analyte in the sample. If the mass of
the analyte is used, equation (1) can be rewritten as:
K
SPME
= (n/V
f
)/(C
o
– n/V
s
)
(2)
Where n and V
f
are the mass absorbed by the fiber and the volume of the fiber
coating; C
o
is the original concentration of the analyte in the sample and V
s
is the
volume of the sample. By rearranging equation (2), the equation can be written
as:
n = K
SPME
V
f
C
o
V
s
/(K
SPME
V
f
+ V
s
)
(3)
equation (3) describes the mass absorbed by the polymeric coating after
equilibrium has been reached. Because the volume of the fiber coating is so
small (
∼
0.36-0.66
µ
L) compared with the volume of sample (usually
∼
5 mL),
equation (3) can be simplified as:
n = K
SPME
V
f
C
o
(4)
6
Fig 1. Schematic diagram of SPME assembly
Plunger
Barrel
Z-slot
Adjustable Needle
Sealing Septum
Coated Fused Silica Fiber
Septum Piercing Needle
7
Fig. 2 Schematic diagram of SPME absorption
Syringe
needle
Fiber
Sample
matrix

8
For large sample volumes the amount extracted is directly proportional to the
initial concentration C
o
in the sample. It should be noted that for compounds with
a high K
SPME
value, the sample volume V
s
significantly contributes to the amount
extracted. From equation (4), the sensitivity of the SPME technique is seen to be
also affected by the partition coefficient and the volume of the fiber. Increasing
the volume of the fiber is difficult because of the limited coating technique and
also the fiber has to fit inside a syringe needle for easy injection into a GC. The
best way to increase the sensitivity of the SPME extraction is to increase the
partition coefficient K
SPME
. This can be done by: (1) changing the chemical nature
of the fiber coating; and (2) modifying the sample matrix by adjusting pH and/or
adding salt.

9
2.2 SPME-Headspace
The SPME technique was originally invented for water samples. To
accommodate solid samples, the technique has been developed as SPME-
headspace
(38)
, which combines both headspace and SPME techniques.
Since the introduction of the SPME-Headspace, many applications such
as pharmaceutical, food and environmental samples have been studied
(55-75)
. In
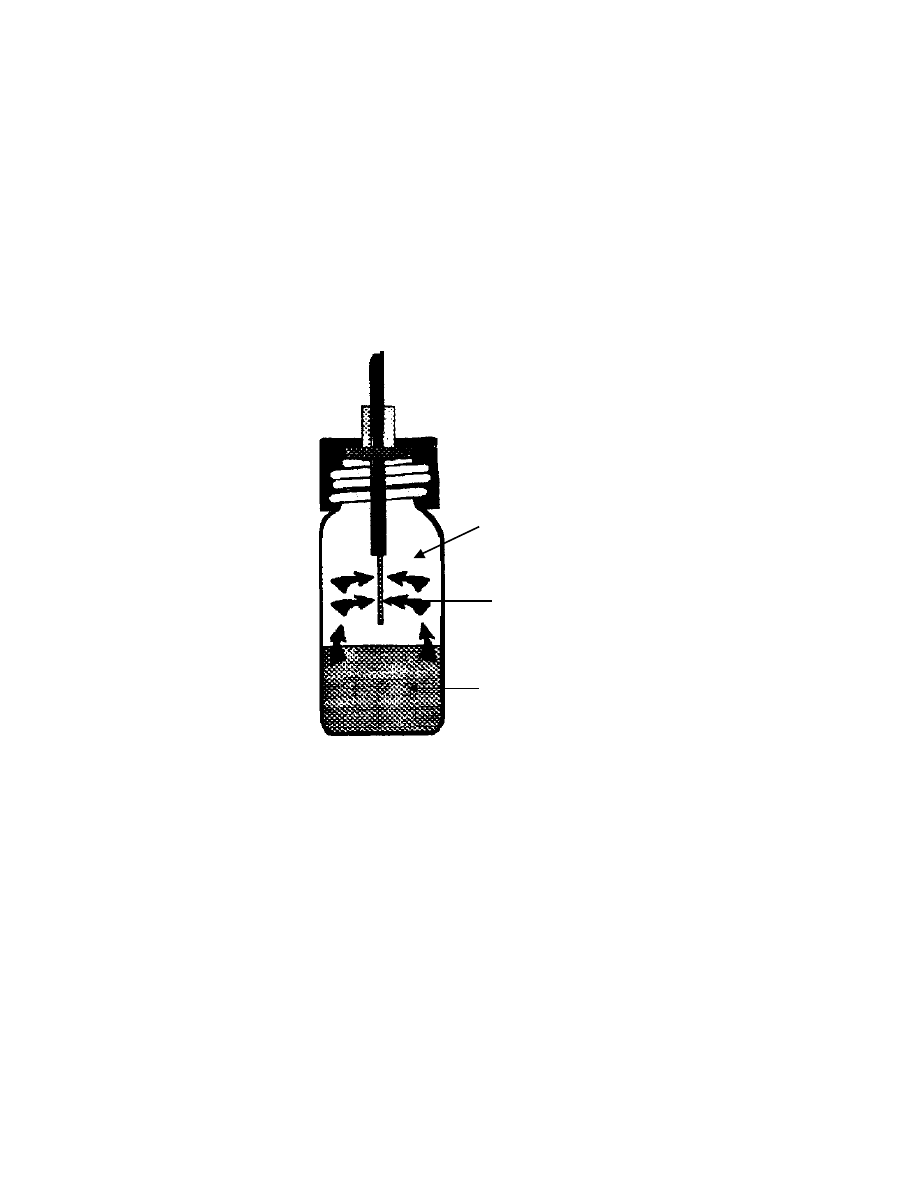
SPME-Headspace, a solid sample is put into a headspace vial and sealed. The
vial is heated to increase the vapor pressure of the target compounds from the
sample. Chemical equilibrium is allowed to establish between the solid sample
and the vapor headspace. A SPME fiber is inserted into the headspace without
contacting the sample. The fiber coating absorbs vapors of analytes from the
headspace (Fig. 3).
In SPME-Headspace, volatile analytes are easily concentrated in
headspace. For semivolatiles, their low volatility may slow the mass transfer from
the matrix to the headspace. In some cases, the kinetically controlled desorption
of volatiles from solid samples can limit the speed of extraction. In these cases,
longer extraction times are required. In the case of solid samples, diffusion is
much slower. This can been seen by comparing the order of magnitude of the
diffusion coefficient D: it is around 10
-6
in liquids and 10
-8
to 10
-11
in solids, while
it is 10
-1
in gases
(76)
.
There are three phases (fiber coating, headspace and sample matrix)
involved in the headspace SPME. The analytes first diffuse to the headspace
from sample matrix and then to the fiber coating. According to Zhang and et. al.
(38)
, the amount absorbed by the coating in SPME-headspace is
n = K
SPME
V
f
C
o
V
s
/(K
SPME
V
f
+ K
HS
V
HS
+ V
s
) (5)

10
where K
HS
is the partition coefficient of the sample between headspace and
sample which is defined as K
HS
= Cs/Cg. V
HS
is the volume of headspace. Other
notations are same as in equation (3). Comparing equation (3) with equation (5),
it is apparent that the amount absorbed by SPME-headspace is affected by the
term K
HS
V
HS
. According to the two equations, the sensitivity of SPME-headspace
can never be higher than that of the corresponding liquid sampling method,
because generally K
HS
V
HS
> 0 . This term inversely influences the amount
absorbed or, in other words, the detection limit obtained. For volatile compounds,
K
HS
is relatively small so the sensitivity is not greatly affected. For semivolatiles,
K
HS
is large and this dramatically decreases the sensitivity of the technique. Thus
the SPME-Headspace technique for solid samples loses both speed and
detection limit when compared to classical SPME.
11
Fig. 3 Schematic diagram of SPME-headspace
Headspace
SPME fiber
Sample matrix

12
2.3 Headspace sampling
Headspace analysis analyzes a gas in contact with a liquid or solid
sample. The first documented combination of GC with headspace sampling was
reported by Bovijn and co-workers at the 1958 Amsterdam Symposium
(39),
on
continuous monitoring of the hydrogen content in the water at power stations. In
1960, W. H. Stahl and co-workers also used headspace sampling for the gas
chromatographic analysis of the gas in sealed cans for oxygen content
(40)
.
Since the commercial introduction of the technique, headspace sampling
has been widely used for analysis for volatile compounds
(41-52)
. Static headspace
analysis which is probably the simplest solvent-free sample preparation
technique, has been used for decades to analyze volatile organic compounds.
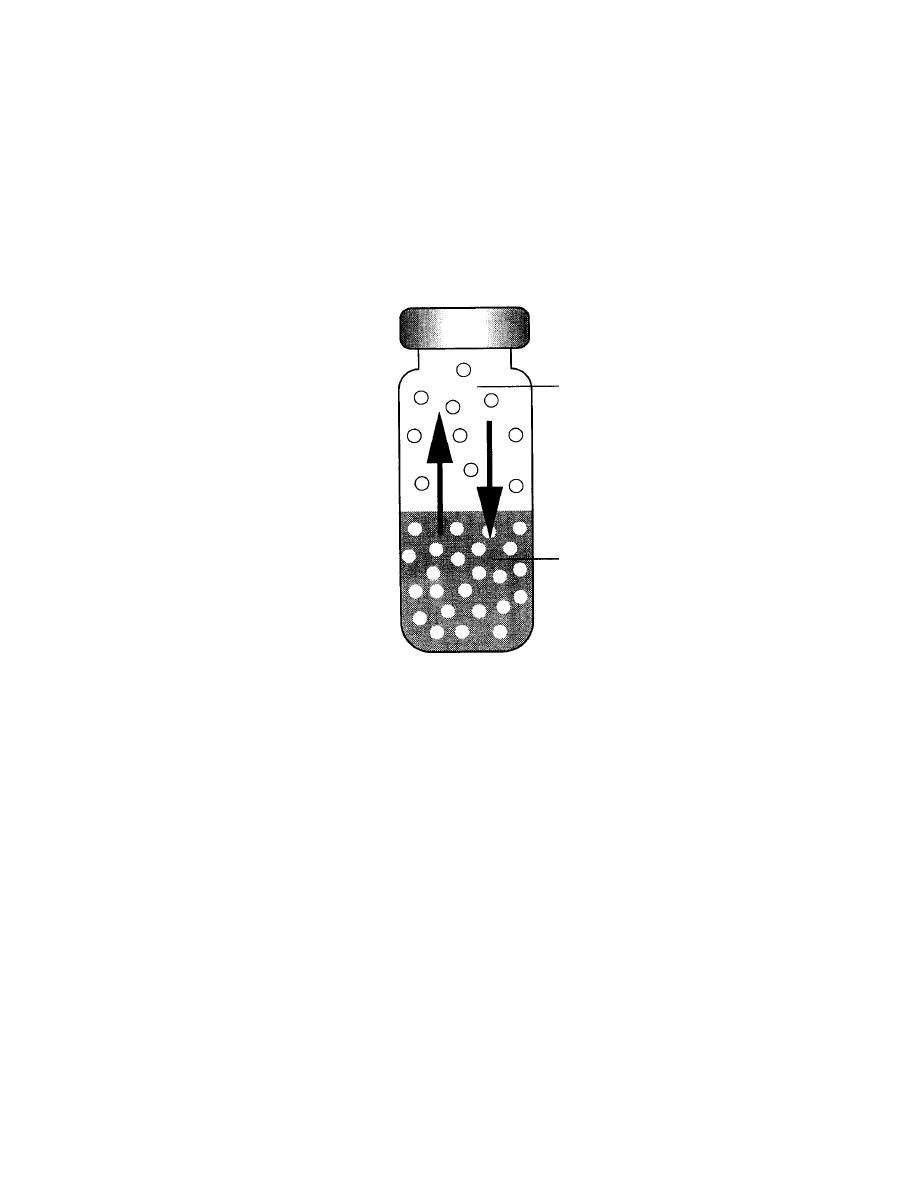
The sample (liquid or solid) is placed in a vial and the vial is sealed. The vial is
then heated and the volatile compounds are driven into the headspace. An
equilibrium between the headspace and the sample matrix is reached (Fig. 4). A
portion of the vapor from the headspace is injected into a GC.
Among the several headspace sampling systems, balanced-pressure
sampling systems is the one of the most popular injection systems. In balanced-
pressure systems, an aliquot of the headspace of the vial is not withdrawn by
suction as the normal syringe injection. Instead, after equilibrium has been
reached, the vial is pressurized by the carrier gas to a pressure which can be
chosen manually. Next the pressurized gas in the vial expands onto the GC
column, resulting in a flow of the mixed headspace gas from the vial to the
column. Since both the pressure that builds up in the vial and the time of transfer
can be set, the transferred volume of the headspace gas can be accurately
controlled. An automated system of balanced-pressure headspace was first
introduced in 1967
(53)
. The schematic diagram of modified balanced pressure
13
Fig. 4 Schematic diagram of headspace vial containing a liquid sample
V
g
= volume of gas phase, V
s
= volume of liquid phase
V
g
V
s
14
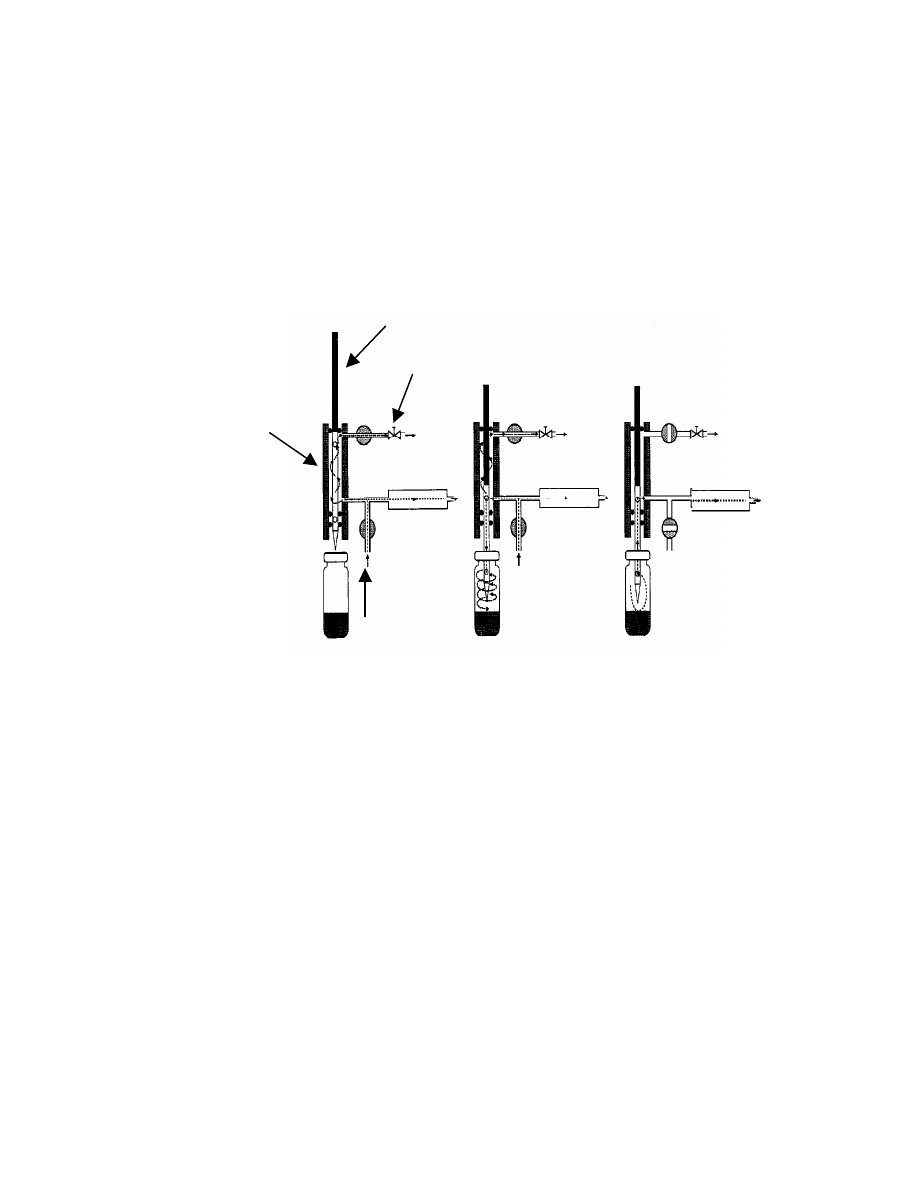
Fig. 5 Schematic diagram of the automatic balanced
pressure system
(54)
. (1)equilibration (stand-by), (2) pressurization, (3)
sample transfer. V = on/off solenoid valves, p
p
= pressurizing
pressure, p
v
= original headspace pressure in the vial.
1
2
3
V
1
V
2
Needle valve
Needle Shaft
Sample Needle
To column
p
p
p
v
Pressurizing
gas in

15
system is show in Fig. 5
(54)
. A heated needle made of either stainless steel or
platinum, which has a hollow part permitting flow in either direction, moves in a
heated shaft that is continuously swept by a small purge gas flow to avoid
contamination. In the stand-by position (Step 1, Fig 5) the needle is sealed
against atmosphere by an O-ring. After the equilibration has been reached, the
needle penetrates the septum of the vial (Step 2, Fig. 5) and part of the carrier
gas flows into the vial to build up the pressure. After a few minutes
(pressurization time) the carrier gas is temporarily disconnected by closing valve
V1 (Step 3, Fig. 5). Since the sample vial is connected to the GC inlet by a
heated transfer line, an aliquot of the gas from the vial is transferred into the GC
injector. The volume of the aliquot is set by controlling the time of transfer.
The basic equation for static headspace analysis can be derived as
follows. When the vapor phase and the sample phase are equilibrated, the
partition coefficient is:
K
HS
= C
s
/C
g
(6)
Where K
HS
is the partition coefficient, C
s
is the concentration of the analyte in the
sample and C
g
is the concentration of the analyte in the vapor.
The total mass of the analyte is the sum of the mass in the sample and vapor
phases:
C
o
V
s
= C
s
V
s
+ C
g
V
g
(7)
where C
o
is the original concentration of the sample, V
s
is the volume of the
sample and V
g
is the volume of the headspace. According to this equation 7 can
be rewritten as:

16
C
o
V
s
= KC
g
V
s
+C
g
V
g
(8)
C
o
= C
g
(K+ V
g
/V
s
)
(9)
where V
g
/V
s
is the phase ratio, defined as:
ββ = V
g
/V
s
(10)
Then, the concentration of the analyte in the sample is:
C
o
= C
g
(K+
ββ)
(11)
Equation (11) is the basic equation for quantitative analysis in headspace
methods. The concentration of the analyte in the original sample is proportional
to its concentration in the vapor phase which is injected into GC for analysis.
For trace analysis, the sensitivity of headspace methods need to be
enhanced. From equation (11), we know that the headspace sensitivity is directly
proportional to C
g
. By rewriting equation (11), we get:
C
g
= C
o
/(K
HS
+
ββ)
(12)
The sensitivity of headspace injection is influenced by the concentration of
the sample, the partition coefficient and the phase ratio. C
o
is directly
proportional to the headspace sensitivity. If it is necessary to increase C
o
to
improve the sensitivity, a larger sample or a further sample enrichment step has

17
to be made before headspace analysis. K
HS
is inversely proportional to the
sensitivity. That means decreasing K
HS
would increase the headspace sensitivity.
K
HS
is a characteristic of the compound analyzed and the type of the sample
matrix. By modifying the functional group of the analyte by derivatization, and/or
by improving the matrix, the sensitivity can also be increased.

18
2.4 Microwave Assisted Extraction (MAE)
MAE is a novel method of extracting soluble products into a fluid from a
wide range of materials using microwave energy. It provides a technique
whereby intact organic compounds can be extracted more rapidly with similar or
better recoveries, when compared to conventional extraction processes
(77)
.
MAE uses the ability of some liquids or solids to transform electromagnetic
energy into heat. The in situ mode of energy conversion has many attractions for
chemists, because its magnitude depends only on the dielectric properties of the
processed material. This allows the selection of target specific molecules and
deposition of the energy into the whole of the sample, without the usual
limitations of heat conduction and convection. The solvent used in MAE is
important since it determines: (1) the speed of heating; and (2) the selectivity of
the extraction. The heating speed is proportional to the dipole rotation or
dielectric constant of the solvent. For most extractions, the solvent is an organic
compound. Many organic compounds have a low dielectric constant (Table 1)
and this could lead to long extraction times. Water has a high dielectric constant
(80.1) and it is easily heated by MAE. Since MAE can be done at both high
temperature and pressure (see Fig. 6), the extraction efficiency must be higher
than traditional Soxhlet and shake-flask extraction methods. This has been
verified by Ganzler and et. al.
(78-79)
.
19
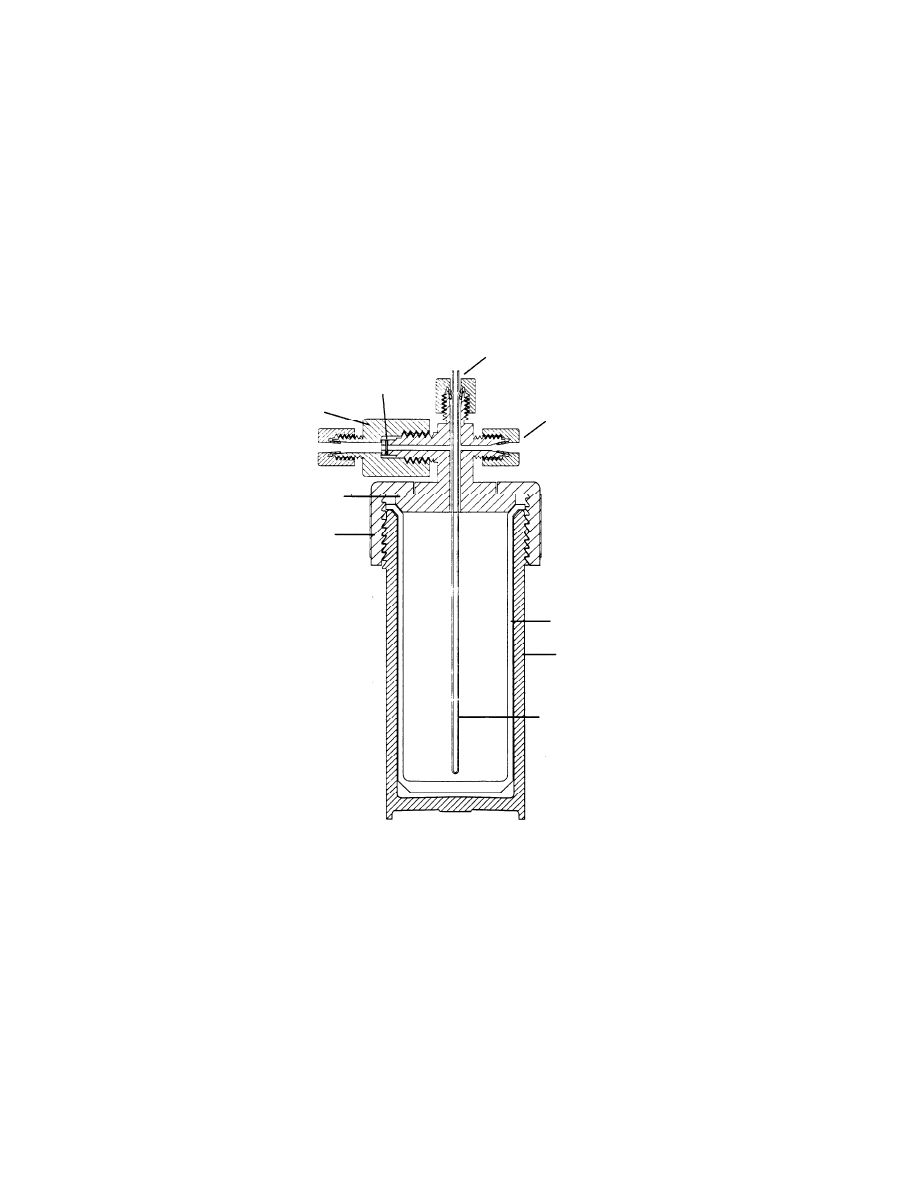
Fig. 6 Schematic diagram of a microwave assisted extraction vessel
Temperature
Pressure port
Rupture
Vent
Cover
Cap
Liner
Vessel body
Teflon
coated
Pyrex

20
Table 1 Dielectric constant of common solvents *
SOLVENTS
Dielectric constant (
ε
)
Water
80.1
Ethanol
25.3
Acetone
21.01
Methylene chloride
8.93
Benzene
2.2825
Chloroform
2.2379
Hexane
1.8865
* From Handbook of Chemistry and Physics (75
th
edition), CRC Press, Inc.,
Cleveland, Ohio, 1994

21
CHAPTER III
SPME ASSOCIATED WITH MICROWAVE ASSISTED EXTRACTION
3.1 Introduction
Sample preparation techniques based on adsorption have been widely
used to pre-concentrate analytes for trace analysis. SPME developed by
Pawliszyn and co-workers
(8)
is a new variation of these adsorption techniques
which has been used mainly for the analysis of pollutants in environmental water
samples
(9, 10)
.
The hydrophobic poly(dimethylsiloxane) fiber coating has limited SPME,
to date, to an aqueous sample matrix. Organic solvents if used would compete
with the target compounds for the sorption sites on the fiber and, probably,
saturate the fiber. This saturation would dramatically decrease the recovery of
target compounds. On the other hand, Microwave Assisted Extraction (MAE) is
an extraction technique which uses polar solvents, such as water, to extract
target compounds primarily from solid matrices. Water absorbs the microwave
energy, and when temperature and pressure are increased, the polar
compounds are more rapidly desorbed from the matrix. The basic mechanism of
this extraction is discussed in reference (77). SPME can then be used to
concentrate these compounds and introduce them into a GC/MS. MAE followed
by SPME is a useful combination which combines extraction speed with sample
concentration. The combined use of the two techniques has not been described
before this work.
Veltol® (3-hydroxy 2-methyl 4-pyrone) and Veltol-Plus® (3-hydroxy 2-
ethyl 4-pyrone) (Fig. 7) are flavor ingredients patented by Cultor Ltd (Ardsley,
NY). Since its first isolation from larch tree bark in 1861, Veltol® has been a

22
useful component in food. It has many functions in food chemistry including: (1)
flavor enhancement, by which flavors especially sweet and fruit flavors are
modified and their strength is increased; (2) sweetness enhancement, by which
the concentration of a high intensity sweetener can be reduced; (3) creaminess
enrichment, in which the creamy taste of many foods will be enhanced; (4)
bitterness reduction, which make products more palatable by masking bitterness;
and (5) acid modification which enhances overall taste by muting or reducing
acidity. Veltol® is found naturally; Veltol Plus® is a synthetic organic compound.
Both synthetic Veltol® and Veltol-Plus® are frequently added to food products.
Because of the importance of Veltol® and Veltol-Plus®, trace analysis of
these compounds is required. To quantify these compounds in food, a solvent
extraction, packed column GC method was developed by Gunner, et. al.
(80)
. The
tedious solvent extraction, low sensitivity and the requirement of derivatization
make this method impractical. A GC/MS method was developed by Wang, et.
al.
(2)
recently. It can determine Veltol-Plus® down to 200 ppb and Veltol® down
to 400 ppb. These detection limits however are not adequate to effectively
monitor the use of these compounds in some food products. For this reason,
SPME for beverages and SPME in combination with MAE for solid food samples
were studied.
23
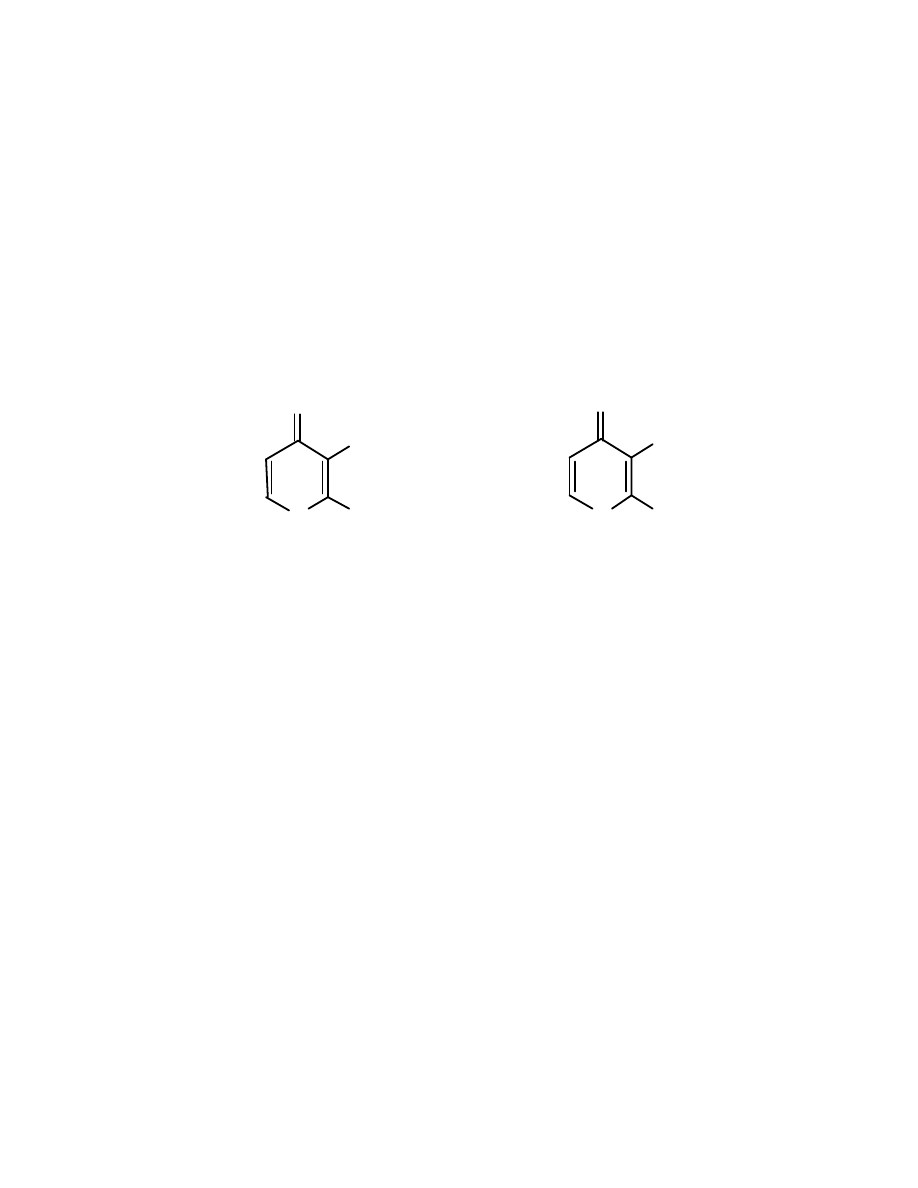
O
O
OH
CH
3
O
O
OH
C
2
H
5
V e lt o l- P lu s
V e l t ol
®
®
Fig. 7 Chemical structures of Veltol® and Veltol-Plus®

24
3.2 Experimental
3.2.1 SPME /MAE extractions
The SPME device was purchased from Supelco Inc. (Bellefonte, PA).
The fibers used were 100 µm poly(dimethylsiloxane) coating. For liquid
sampling, the SPME fiber was inserted directly into a 10 mL vial containing 4 mL
of aqueous sample. The fiber remained inside the sample for 10 minutes with
magnetic stirring of the solution. For solid samples, MAE was performed on a
MES Model 1000 system (CEM, Matthews, NC) before SPME extraction. This
system was equipped with an inboard pressure and fiberoptic temperature
control system for regulating sample extraction conditions via magnetron power
output control. The instrument controlled either pressure or temperature,
depending on which parameter reached its control set point first. Teflon
lined
extraction vessels (110 mL) were used for extractions (Fig 6). The outer body
and cap consisted of microwave-transparent Ultem
poly (ether imide). The
removable inner cover, and the safety rupture membrane were made of Teflon
PFA. Gases could escape through the exhaust port if the vessel were hand
vented by turning the vent fitting. The liner cover of the control vessel had
Teflon
PFA fittings to allow for pressure tubing connections and for the
insertion of a Pyrex
tube that ran through the cap into the vessel and ended
close to the bottom of the vessel. This Pyrex
tube, which housed the fiberoptic
probe, provided a seal in the cap and protected the fiberoptic probe from solvent
attack.
The extraction temperature was set to 100oC and the pressure was 100
psi. After 10 minutes, the vessel was cooled to room temperature and pressure

25
released before it was opened. The extract was filtered under low vacuum
through a GF/A binder-free glass fiber filter (Fisher Scientific, Pittsburgh, PA).
3.2.2 Analysis of food products
3.2.2.1 Beverages
In a 10 mL vial, 1.5 g of Na
2
SO
4
was dissolved in 4 mL of beverage such
as Cola. The pH was adjusted to 2 by adding 0.5 mL of 0.1 M HCl. SPME was
performed at ambient temperature for 10 min. The SPME fiber was then
introduced into GC/MS inlet in the splitless mode.
3.2.2.2 Solid food products
Solid food products such as potato chips were ground before weighing.
One gram of sample and 10 mL of water (HPLC grade, Mallinckrodt Chemical,
Inc., Paris, KY) were placed in a MAE vessel. A 4 mL aliquot from the filtered
MAE extract was placed into a 10 mL SPME vial for SPME concentration.
3.2.3 GC/MS analysis
A HP model 5971 GC/MS system (Hewlett Packard, Palo Alto, CA) was
used. The inlet temperature was set to 260oC. A 30 m, 0.25 mm I.D., 0.5 µm
film thickness Rtx-20 (80% methyl and 20% phenyl polysiloxane) (Restek,
Bellefonte, PA) capillary column was used. The column temperature was held
initially at 70oC for 1 min, increased to 240oC at 15oC/min and held there for 1
min. A 30 m, 0.25 mm i. d., 0.25 µm film Stabilwax (100% bonded polyethylene
glycol) (Restek, Bellefonte, PA) column was also used for some sample
analyses. For this column, the oven temperature was programmed as follows:

26
40oC for 1 min, increased to 230oC at 15oC/min, then 30oC/min to 250oC. For
thermal desorption, the SPME fiber was left in the injector for 1 min at 260
o
C.
For direct injection, 1 µL of the sample solution was injected using a HP Model
7673 auto sampler (Hewlett Packard, Palo Alto, CA). A splitless mode was used
for both the SPME and direct injection with the purge valve closed for 1 min.
Column flow rate was helium at 1 mL/min.
3.3 Results and discussion
3.3.1 Optimization of SPME absorption conditions
The initial step was to optimize the SPME extraction conditions. The
parameters investigated were pH, ionic strength, absorption time, GC inlet
conditions and fiber conditioning.
3.3.1.1 pH
Veltol® and Veltol-Plus® are both weak acids. At pH 7, only a fraction of
the molecules will be ionized. This does not favor their absorption by the
hydrophobic fiber. A series of pH buffer solutions (pH 2, 0.1 M HCl/0.38 M NaCl;
pH 3, 0.1 M H
3
PO
4
/ 0.7 M NaH
2
PO
4
pH 4, 0.1M acetic acid/0.017 M sodium
acetate; pH 6, 0.1 M KH
2
PO
4
/0.01 M NaOH.) were prepared and 1 mL added to
4 mL of a 1.5 ppm Veltol® and Veltol-Plus® solution. SPME extractions were
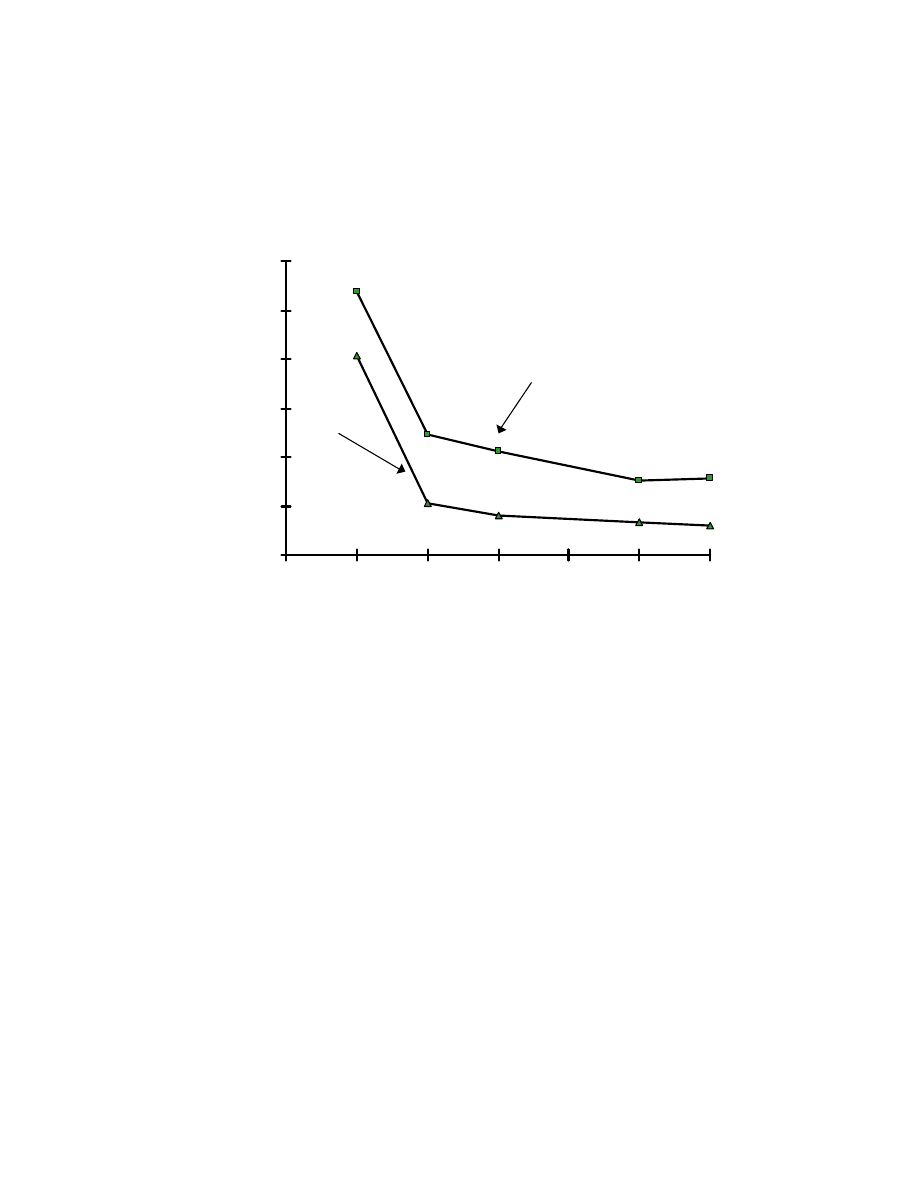
made from each solution. Fig. 8 shows the results. The peak areas increase
with decreasing pH. At pH 2, the absorption efficiency is 4 times that at pH 7.
Veltol-Plus® has a higher absorption efficiency due to the increased
hydrophobicity of the ethyl group relative to the methyl group in Veltol®.
3.3.1.2 Ionic strength
27
Fig. 8 Influence of pH on absorption by SPME fiber. One mL of pH buffer
was added into a 4-mL aqueous sample of 1.5 ppm Veltol
and Veltol
Plus
. The pH buffers used were : pH 2, 0.1 M HCl/0.38 M NaCl; pH 3, 0.1 M
H
3
PO
4
/ 0.7 M NaH
2
PO
4
pH 4, 0.1M acetic acid/0.017 M sodium acetate; pH 6,
0.1 M KH
2
PO
4
/0.01 M NaOH. For pH 7, HPLC water was used as solvent
without adding buffer.
0
2000
4000
6000
8000
10000
12000
1
2
3
4
5
6
7
pH
peak area
V e l to l P l u s ®
V e lto l®
28
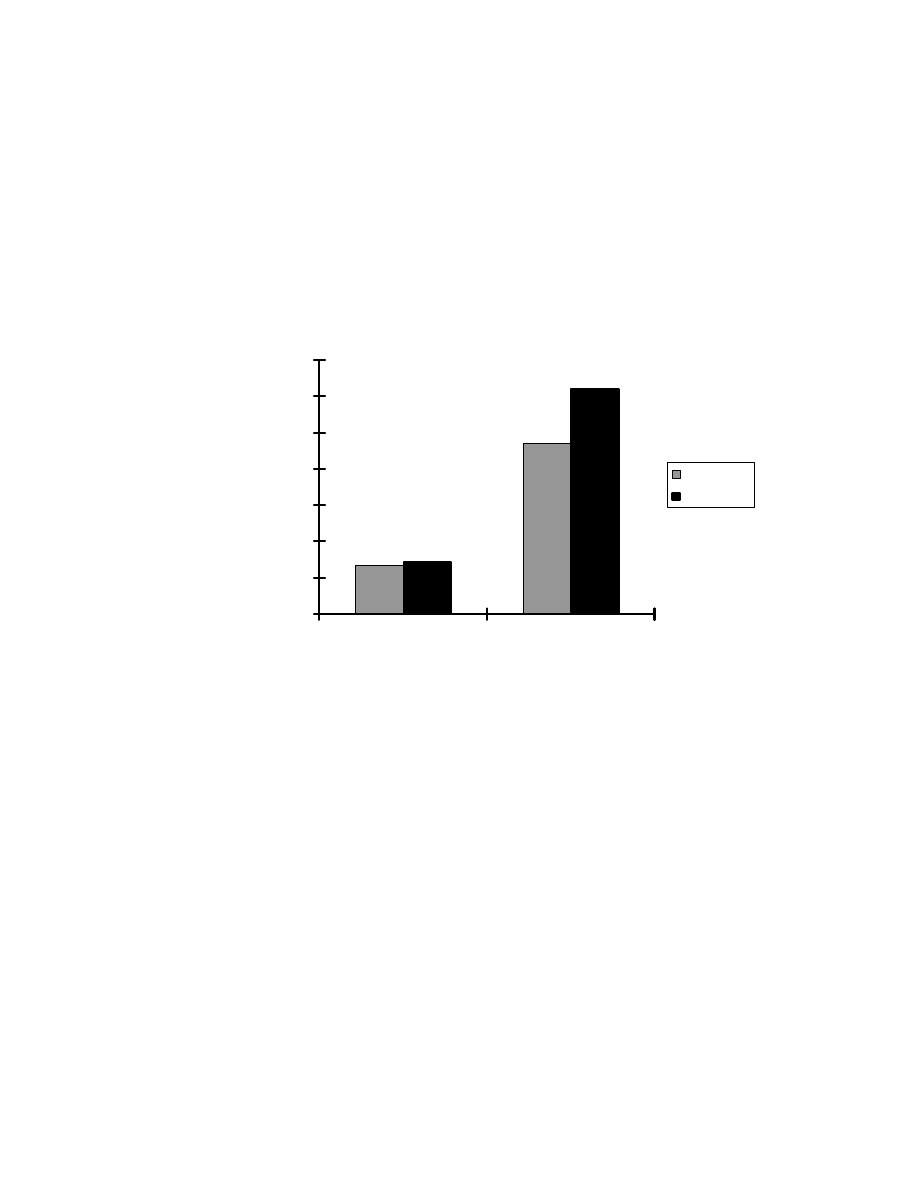
Fig. 9 Effect of salt on SPME extraction. Four mL of 30 ppb Veltol
and
Veltol Plus
aqueous sample was used and 1 mL pH 2 buffer was added.
The solution was saturated with salt in both cases.
0
2000
4000
6000
8000
10000
12000
14000
N a C l
N a 2 S O 4
Salts added
Peak area
Veltol
Veltol-Plus

29
The effect of decreasing solubility of organic compounds with the addition
of salt is known as a “salting out” effect
(81)
. By adding a salt to the aqueous
samples, the ionic strength of water can be increased, thereby increasing the
partitioning of organic compounds (but not ions) into the polymer coating. The
presence of sodium sulfate decreases the solubility of both Veltol® and Veltol-
Plus® in water and enhances their absorption onto the SPME fiber. In this
study, a saturated solution of sodium sulfate was made by adding 1.5 gram of
sodium sulfate to the sample solution with magnetic agitation. The saturation
was ensured by observing that there was still a small amount of sodium sulfate
particle in the solution after ten minute agitation. As can be seen in Table 5, the
detection limit for Veltol at pH 2 without Na2SO4 was 50 ppb while with Na2SO4
a limit of detection of 10 ppb was obtained. A 5 fold decrease in the detection
limit is obtained for Veltol® by adding Na2SO4. For Veltol-Plus®, limits of
detection of 30 and 2 ppb are obtained without and with Na
2
SO4. In this case, a
15 fold increase in sensitivity is obtained for the “salting out” effect. Fast stirring
must accompany the addition of this salt to prevent recrystallization. Because
dissolving of sodium sulfate is an endothermic process, the temperature of the
sample solution decreased. This also may enhance the absorption efficiency of
the fiber. Sodium chloride was also evaluated, but the extraction efficiency was
less than with Na2SO4 (see Fig. 9).
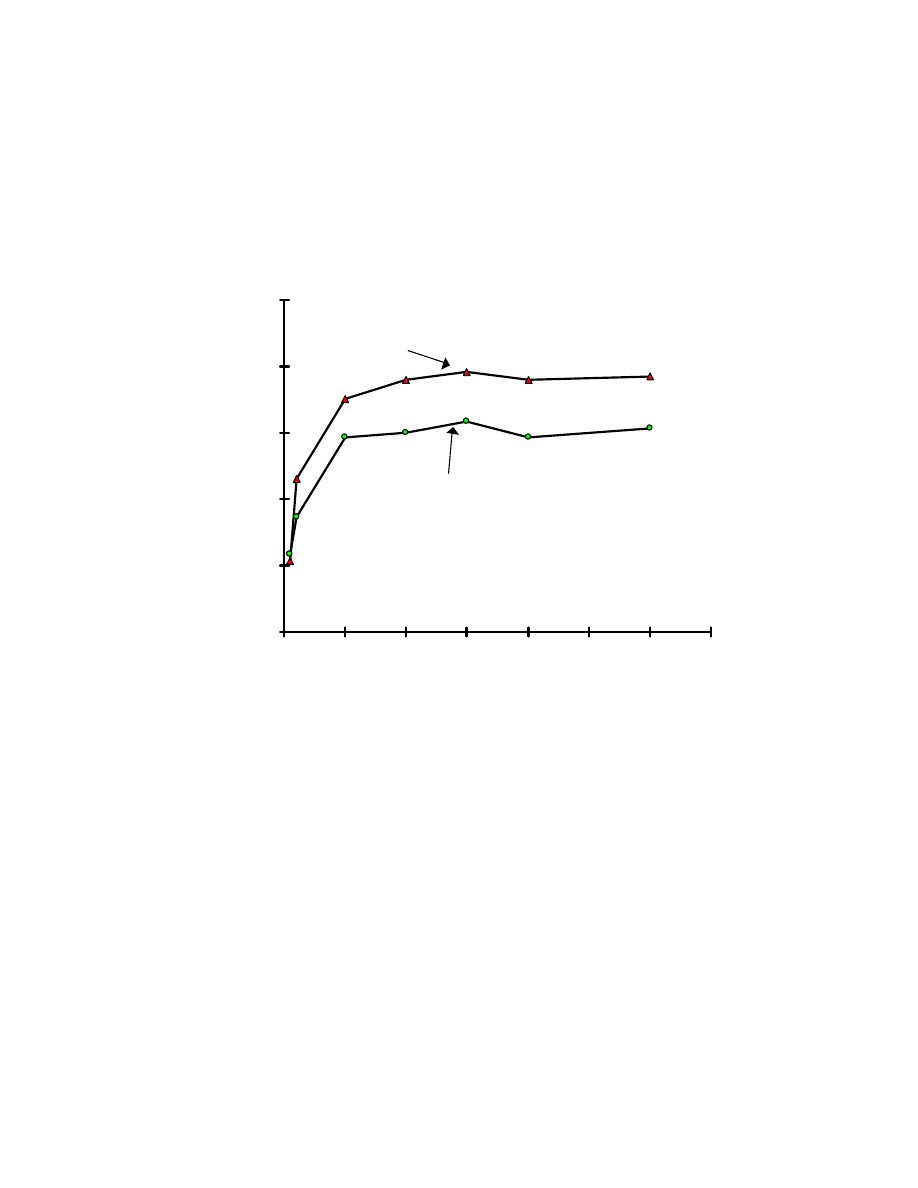
3.3.1.3 Absorption time
SPME extraction is a dynamic partitioning process of the target
compounds between the SPME fiber and the sample solution.
With stirring, diffusion of the target compound to the fiber is increased, and 10
minutes was necessary to reach equilibrium (see Fig. 10).
3.3.1.4 Fiber Conditioning
30
Fig. 10 Influence of absorption time on extraction efficiencies of Veltol
®
and Veltol-Plus
®
. Four mL of 15 ppb of each of Veltol
®
and Veltol-Plus
®
was
used and 1 mL of pH 2 buffer was added. The solution was saturated with
sodium sulfate.
0
500
1000
1500
2000
2500
0
5
10
15
20
25
30
35
T i m e (m in)
peak area
Veltol Plus®
Veltol®

31
Replicate absorption and desorption trials were carried out by
successively absorbing six fresh samples using the same fiber and desorbing in
the GC injector. The results show an increase in peak area with each
consecutive injection; the maximum peak area was reached after the 5th
absorption. This means the fiber needs to be conditioned in the sample matrix
before use. The conditioning can also be achieved by rinsing the fiber in the
sample for 20 to 30 minutes and then thermally desorbing the fiber in the heated
injection port.
3.3.1.5 GC inlet.
A major benefit of SPME for GC/MS is the absence of an extracting
solvent. This advantage eliminates: 1) the peak area variations with solvent type
or inlet temperature; and 2) the solvent delay time necessary for MS. SPME thus
allows detection of early eluting volatile compounds not possible with direct
injection. When the splitless injection mode with a 1 minute purge time off is
used, peak areas decreased dramatically with an increase in the inlet
temperature when conventional syringe injection was employed. This is
probably due to sample loss through the septum purge with a fast solvent
evaporation. The higher the inlet temperature, the greater the volume of the
vaporized analytes, the greater the sample loss through the septum purge.
Using SPME no significant changes in peak areas were observed (see Table 2).
3.3.2 SPME associated with MAE
As discussed in Chapter 2, the present technique, SPME headspace, for
solid samples lost the sensitivity and extraction speed which were originally the
major advantages of SPME. To seek a better technique for solid samples which
can maintain the advantages of SPME, a new technique, SPME combined with
32
MAE was studied. The technique joins the advantages of SPME and MAE, and
was successfully applied to several solid food samples (potato chips, canned
food and chewing gum). This work is the first published combination of SPME
and MAE
(1)
.
3.3.2.1 MAE with water as solvent for hydrophobic sample matrices
With a high dielectric constant (80.1), water is a preferred solvent in MAE.
It is characterized by its high heating rate and high affinity for polar compounds.
MAE can be operated at high temperatures, thus increasing the diffusion rates of
analytes from solid sample into solvent. To investigate the potential of MAE by
using water as solvent, MAE was compared with conventional solvent extraction.
Table 2. Effect of injector temperature on peak area
Direct injection
SPME
Injector
temperature
(oC)
Veltol®
(X105)
Veltol-Plus®
(X105)
Veltol®
(X105)
Veltol-Plus®
(X105)
250
84
78
0.53
1.7
300
64
59
0.55
1.8

33
In this study, one gram of potato chips was used as the sample. The sample
was ground before extraction. For solvent extraction, one gram of sample and 10
mL of ethanol (ethanol is the best solvent for these compounds)
(83)
was put into
a 22 mL vial. The vial was crimped with a Teflon coated septum to avoid
evaporation. The vial was shaken and sonicated for 10 min.
For MAE, the sample was put into a 110 mL MAE vessel and 10 mL of
HPLC grade water (J.T. Baker, Phillipsburg, NJ) was added. The extraction time
was 10 min. A one
µ
L sample of each extraction was injected in the GC. Table 3
shows the results. At 100
o
C, the recovery by MAE is 4 times that of conventional
solvent extraction. At 150
o
C, the recovery is about 4.6 times of that of solvent
extraction. MAE is more efficient than solvent extraction for these solid samples.
3.3.2.2 MAE with water as solvent for water soluble sample matrices
In this study, ground coffee beans were extracted by MAE. The solvent for
solvent extraction was acetone and for MAE was HPLC grade water (acetone is
a better solvent than water for caffeine, so we used acetone as a standard.
Acetone cannot be used for SPME therefore in this case the water had to be
used). The procedure and the extraction conditions were the same as for potato
chips (part 3.3.2.1). The extraction results are shown in Table 4. The efficiency
of the water MAE extraction is higher than the acetone solvent extraction.
3.3.3 Comparison of SPME with conventional GC syringe injection
Evaluation of this SPME technique was conducted by comparing the
detection limits and reproducibility with the conventional syringe injection.
3.3.3.1 Detection limits

34
The detection limits and were calculated as that concentration
corresponding to 3 times the noise level. Duplicate injections were made for
each trial and the average value used. For direct injection, 1 µL of Veltol® and
Table 3. Comparison of extraction efficiency of solvent with MAE (1)*
(Integrator area counts)
Compounds
Solvent extraction
MAE (100oC)
10 min
MAE (150oC)
10 min
Veltol®
3.7 x 10⁵
15 x 105
17 x 105
* For solvent extraction, one gram of sample was extracted with ten mL of
ethanol and 1
µ
L was injected into GC. For MAE extraction, one gram of sample
was extracted with 10 mL of water and 1
µ
L was injected.

35
Veltol-Plus® standard solutions in ethanol were injected into the GC/MS.
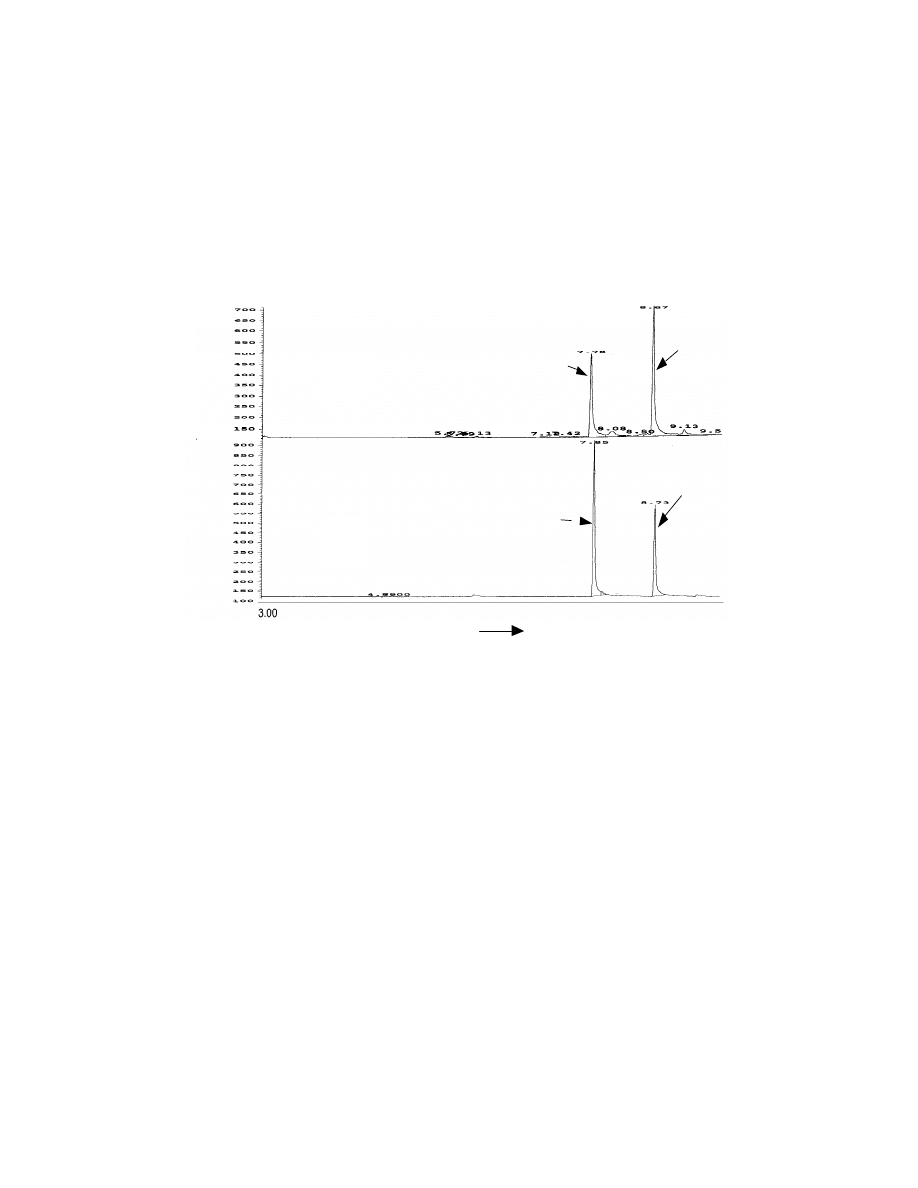
SPME of the original aqueous standard solution is represented by SPME (1)
(see Table 5). SPME (2) is the original solution at pH 2. SPME (3) represents
the original solution at pH 2 and saturated with sodium sulfate. The
combination of salt and lower pH increased the sensitivity of SPME ten fold for
Veltol® and twenty five fold for Veltol-Plus®. This method can be used to
determine trace amounts of Veltol® and Veltol-Plus® in food products, such as
coffee where trace amounts of Veltol® are present. A comparison of the
sensitivity of both direct GC injection and SPME injection is shown in Fig. 11.
Since the same attenuation was used the SPME technique shows abount a fifty
fold increase in signal.
3.3.3.2 Precision
The precision of the method was determined by conducting six replicate
injections for both the SPME and direct GC injection. The relative standard
deviations (%RSDs) from both GC area counts and retention times were
determined for each analyte. For conventional syringe injections, concentrations
of 6 ppm for Veltol® and 5.1 ppm for Veltol-Plus® were investigated. For
SPME, 1.5 ppm of Veltol® and Veltol-Plus® were tested. The %RSD of both the
peak area and retention times are listed in Table 6.
Direct syringe injection has better reproducibility for both peak area and
retention time. Poor precision for SPME peak areas resulted from the variation of
the adsorption and the desorption of the target compounds. It should be kept in
mind that the precision of these results represents the entire method, including
the sampling stage, not only the chromatographic separation itself. Peak area

36
precision by SPME is not as good as direct injection, but it is still reasonable for
trace level analyses. The variation of the retention time makes the identification
Table 4. Comparison of extraction efficiency of solvent with MAE (2)*
(Integrator area counts)
Compounds
Solvent extraction
MAE (100oC)
10 min
MAE (150oC)
10 min
Caffeine
3.7 x 10⁷
9.3 x 10⁷
13 x 107
* For solvent extraction, one gram of sample was extracted with ten mL of
acetone and 1
µ
L was injected into GC. For MAE extraction, one gram of sample
was extracted with 10 mL of water and 1
µ
L was injected.

37
of the target compounds difficult based solely on retention time. Use of a mass
spectrometer is recommended for confirmation.
3.3.4 Application of SPME in food products
These SPME and MAE-SPME techniques were applied to several food
products including coffee, cola drinks, potato chips, canned food and chewing
gum.
3.3.4.1 Beverages
Most of the beverages are in aqueous solutions which make direct SPME
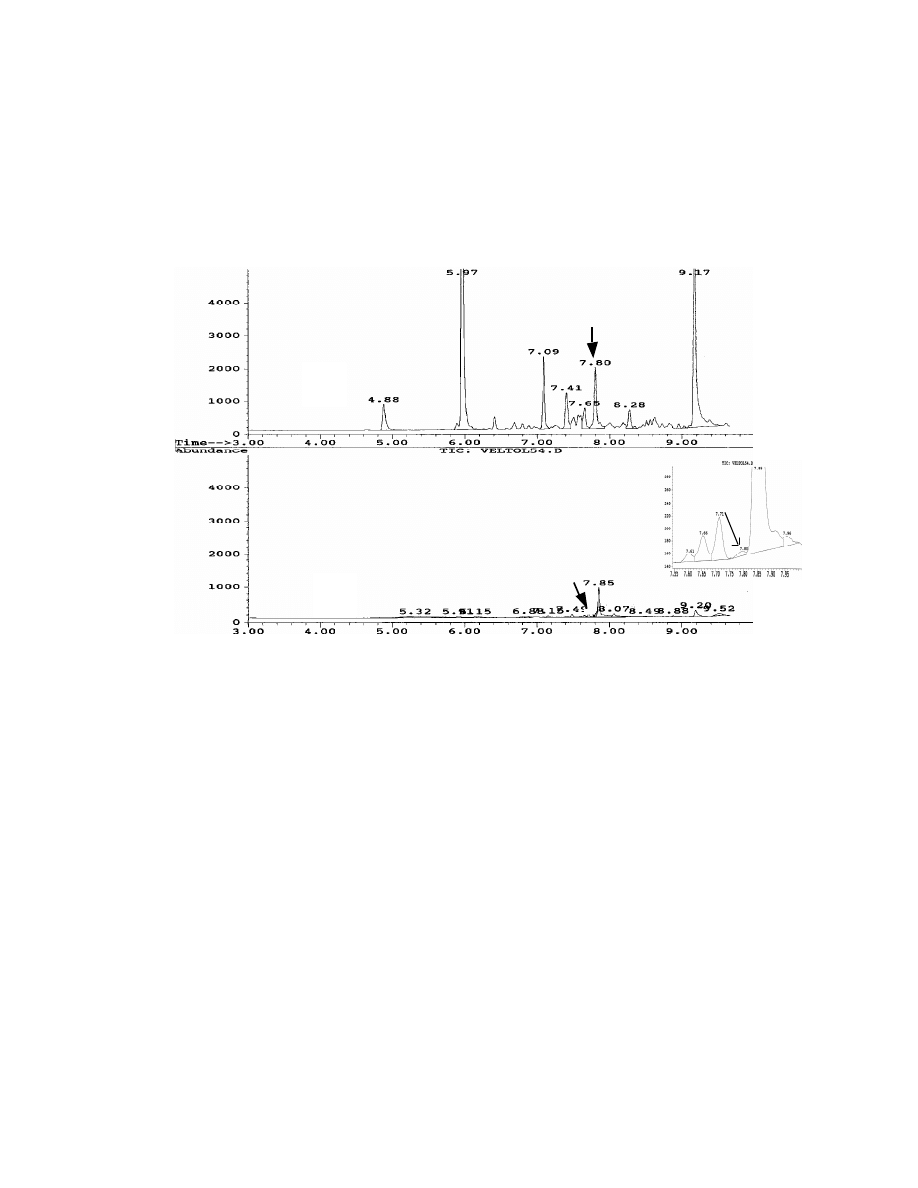
extraction easy. Fig. 12 shows a comparison of gas chromatograms obtained
from Gevalia® coffee by conventional GC direct injection and SPME. As shown,
the SPME method shows higher sensitivity. Direct injection shows no peak for
Veltol®. These results were confirmed by mass spectroscopy. These results
also demonstrate the selectivity of this SPME method. The unidentified peak at
retention time 7.85 min has a peak height of 1000 for direct injection and only
150 for SPME. SPME minimized the interference of this peak with Veltol®, which
has a retention time at 7.80 min. An additional advantage of SPME sampling is
that it prevents water from entering the GC, avoiding possible damage to the GC
column.
3.3.4.2 Chips and corn
Chips and corns are solid samples. Instead of performing headspace
SPME
(82)
, a MAE technique was examined. Water is a good solvent for MAE as
it possesses a high dielectric constant, hence it is characterized by a high ability
to absorb microwave energy. Therefore, MAE is a complementary method to

38
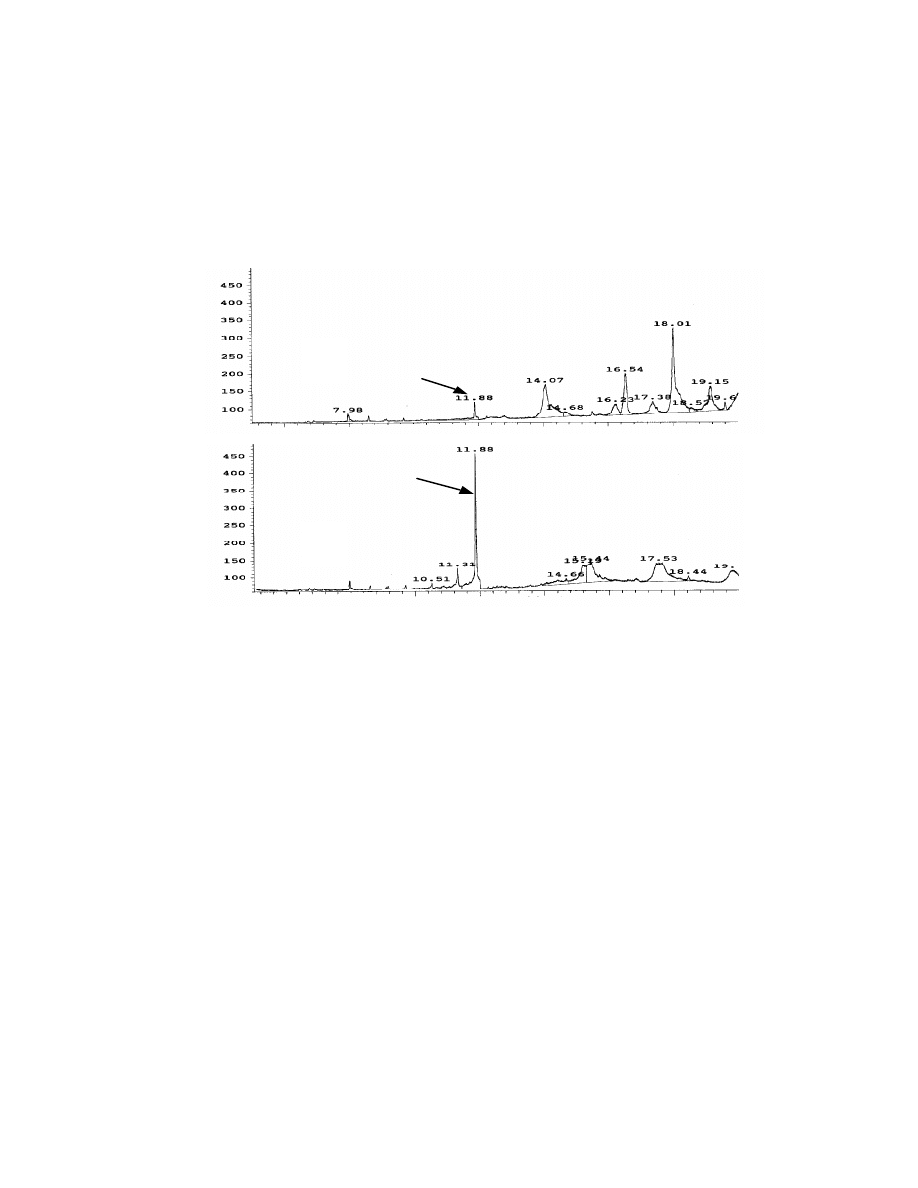
combine with SPME for solid samples. Fig. 13 shows the chromatograms of
potato chips with MAE-direct injection and MAE-SPME injection. Obviously
MAE-SPME exhibits higher sensitivity for Veltol®. The concentration of Veltol®
Table 5. Comparison of the detection limit
Compounds
Direct
injection.
(1
µ
L)
SPME (1)
HPLC water
SPME (2)
pH 2 (0.1 N
HCl/NaCl)
SPME (3) pH 2
(0.1 N
HCl/NaCl) and
saturated with
Na
2
SO
4
Veltol® (ppb)
200
100
50
10
Veltol-Plus®
(ppb)
400
50
30
2
39
Fig. 11 Comparison of SPME injection and direct GC.
A: 30 ppb Veltol
and 30 ppb Veltol Plus
by SPME; B: 1.5 x 10
3
ppb
Veltol
and 1.5 x 10
3
ppb Veltol Plus
by direct injection. A Rtx-20, 30 m x
0.25 mm capillary column was used for the separation. Same attenuation is
used in the chromatograms.
4.00
5.00
6.00
7.00
8.00
9.00
time (min)
Veltol®
Veltol-Plus
®
Veltol®
Veltol-Plus®
A
B

40
in this sample was found 0.3 ppm by using a external standard calibration and
Veltol-Plus® was not detected.
The significant peak height of Veltol® in MAE-SPME compared with other
unidentified components having m/z 126 and 140 in MAE-direct injection shows
the selectivity of this SPME technique. The drawback of the MAE-SPME
technique for solid foods is that the particulate matter in the sample solution
could coat the extraction fiber and interfere with the extraction. Further sample
clean-up prior to extraction may help in these cases.

41
Table 6 Precision of direct GC injection and SPME*
(n=6)
Direct injection (1
µ
L)
SPME
10 min absorption
Compounds
Area
(%RSD)
t
R
(%RSD)
Area
(%RSD)
t
R
(%RSD)
Veltol
®
2
0.005
10
0.1
Veltol-Plus
®
2
0.005
10
0.05
* For direct injection, 6 ppm of Veltol
and 5.1 ppm Veltol-Plus
solution
were used. For SPME, 1.5 ppm of Veltol
and 1.5 ppm Veltol-Plus
solution were used. The solution was adjusted to pH 2 and saturated with
sodium sulfate.
42
Fig. 12 Chromatograms of coffee by both SPME (A) and
direct GC injection (B). Gevalia
@
coffee (0.1 gram) was dissolved in
10 mL hot water. A Rtx-20, 30 m x 0.25 mm x 0.25
µµ
m capillary
column was used for the separation and ions 126 and 140 amu in SIM
mass spectroscopy were used for the detection.
veltol
10 min SPME
1 ul direct injection
veltol
Veltol
®
A
B
43
6
8
12
14
16
18
10
6
8
10
12
14
16
18
Veltol ®
Veltol ®
MAE-direct injection
MAE-SPME
Fig. 13 Chromatograms of potato chips by direct MAE-injection (A)
and MAE-SPME (B). Potato chips (1 gram) were extracted by MAE
with 10 mL water. Four mL of sample with pH at 2 and saturated with
sodium sulfate was used for SPME. One uL of MAE extract was used
for direct injection. A Stabilwax column, 30 x 0.25 mm x 0.25
µµ
m was
used for the separation and ions 126 and 140 amu in SIM mass
spectroscopy were used for the detection.
A
B

44
3.4 Conclusion
SPME is a useful tool for trace analysis of organic compounds like
Veltol® and Veltol-Plus® in food products and can be considered superior to
commonly used methods such as solvent extraction. SPME is simple to perform;
it takes only a few minutes to complete and uses no extracting organic solvent.
It has been applied successfully to the determination of trace amount of Veltol®
and Veltol-Plus® in coffee, Coca, potato chips, canned food and chewing gums.
The combination of MAE and SPME make solid sample SPME possible. It
compensates for the disadvantage of headspace SPME that can only detect
volatile compounds
(84)
.

45
CHAPTER IV
HEADSPACE SAMPLING - ON LINE DERIVATIZATION
4.1 Introduction
Short chain fatty acids are common components in agricultural products.
It is well know that these compounds directly contribute to the aroma and taste of
many consumer products
(85-86)
. Therefore, it is often necessary to determine their
concentrations accurately and at low levels.
Direct determination of short chain fatty acids by GC is often
unsatisfactory due to their high polarity and low vapor pressure. Therefore, a
derivatization step is often carried out to provide the fatty acids with better
chromatographic characteristics. Several derivatization techniques have been
developed for the analysis of short chain fatty acids
(87-95)
. By modifying the
functional groups, most acids can be well separated by GC. Methyl
esterification has been widely used for the GC analysis of fatty acids. However,
due to the high sample volatility
(4, 89,)
, peak broadening and poor recoveries
were obtained. Several other procedures for the preparation of less volatile
derivatives have been used for the analysis of the short chain fatty acids
(91-95)
.
Although the available determination methods provide accurate and
precise data for sample standards, most are not applicable to complex matrices
such as agricultural products. Furthermore, the procedures involved in the
derivatization of fatty acids are usually lengthy. They usually entail a great deal
of sample handling which often leads to errors.
Headspace gas chromatography offers a quick and simple solution to
many of these problems. A short chain fatty acid methyl ester headspace GC

46
technique has been developed by Wang, et. al.
(4)
. The method is simple,
sensitive and reproducible. However, formic and acetic acid, both of which are
important components in many agricultural products cannot be detected due to
their coelution with the methanol which is a component of the derivatizing
reagent.
Because of these problems, this thesis presents a headspace GC
procedure for the determination of free short chain fatty acids by on-line
derivatization with bis(trimethylsilyl)trifluoroacetamide (BSTFA). The entire
process is carried out in the injection vial used in the headspace device. Under
these conditions, a three-fold advantage can be obtained: (1) losses of volatiles
and errors caused by sample preparation are minimized; (2) chromatographic
properties of fatty acids are improved, and formic and acetic acid can be
detected; (3) tedious procedures in conventional derivatization including
derivation, separation, and concentration are eliminated.
BSTFA is the most widely used reagent for trimethylsilylation. The
reagent was first prepared by Stalling et al
(96)
. It is very versatile, reacting with
all the common protic sites present in organic compounds. The reaction with
short chain fatty acids can be expressed as following:
CF
3
C[OSi(CH
3
)
3
]=NSi(CH
3
)
3
+ 2RCOOH
2(CH
3
)
3
SiOOCR + CF
3
CONH
2
BSTFA + Acid = Acid ester + Trifluoroacetamide

47
BSTFA also can react with water:
CF
3
C[OSi(CH
3
)
3
]=NSi(CH
3
)
3
+ H
2
O
(CH
3
)
3
SiOSi(CH
3
)
3
+ CF
3
CONH
2
Large amounts of water should be avoided to minimize the quantity of BSTFA
required.

48
4.2 Experimental
4.2.1 Chemicals
Acetonitrile, benzene and hexane were purchased from Fisher Scientific
(Fair Lawn, NJ), and chloroform and methylene chloride were obtained from EM
Science (Gibbstown, NJ). All solvents were used without further purification.
The following reference standards were purchased from Ultra Scientific (North
Kingstown, RI): acetic, propionic, butyric, pentanoic, hexanoic, heptanoic, and
octanoic acid. BSTFA with 1% trimethylchlorosilane was obtained from Pierce
Chemical Co. (Rockford, IL).
4.2.2 Instrumentation
A Model 5970 GC/MS system (Hewlett Packard, Palo Alto, CA) was used
for the analysis. A PE Model HS-40 static headspace injector ( Perkin Elmer,
Norwalk, CT) was directly connected to the GC system. The column used was a
30 m x 0.25 mm x 1 um HP-5 (Hewlett Packard, Palo Alto, CA). The
chromatographic conditions are listed in Table 7.
4.2.3 Sample analysis
Samples of tea, coffee, cigarette and tobacco (ground to a powder) and
low calorie fat were directly put into 22 mL headspace vials. One mL of
acetonitrile was added to each vial and the vial was sealed immediately. Fifty µL
BSTFA was injected to the vial. The vial was manually shaken before
headspace sampling.

49
Table 7. GC/MS and headspace conditions
Sample thermostatting
80
o
C, 10 min
Needle temperature
120
o
C
Transfer line temperature
120
o
C
Pressurizing time
2 min
Injection time
0.25 min
Head pressure
15 psi
GC oven programming
40
o
C (2 min), 15
o
C/min to
250
o
C (hold for1 min)
Injector temperature
280
o
C
MS mode
SIM 75
Electron Ionization
70 eV
Electron Multiplier
Voltage
2200 V

50
4.3 Results
4.3.1. Optimization of the method
To maximize the sensitivity of the method, the volume of the derivatizing
agent, the headspace thermostatting time and the sample vial temperature, the
solvent and the inorganic salts were investigated.
4.3.1.1 Derivatization
To ensure the separation of the derivatized acids on a HP-5 column, an
acid mixture of formic, acetic propionic, butyric, pentanoic, hexanoic, heptanoic
and octanoic acids was derivatized and headspaced at 80
o
C for 10 minute. The
trimethyl silyl esters of the eight acids were well separated (Fig 14). The amount
of BSTFA used affects the yield of the acid esters. This has been well studied
for the derivatization in solution
(97)
. According to Blau
(97)
, the recommended
molar ratio for driving the reaction to completion is 2:1 for silylating reagent:
acids. To study the effect of the amount of derivatizing reagent on the yield,
different amount of BSTFA with 1 mL of 100 ppm of each acid standard was
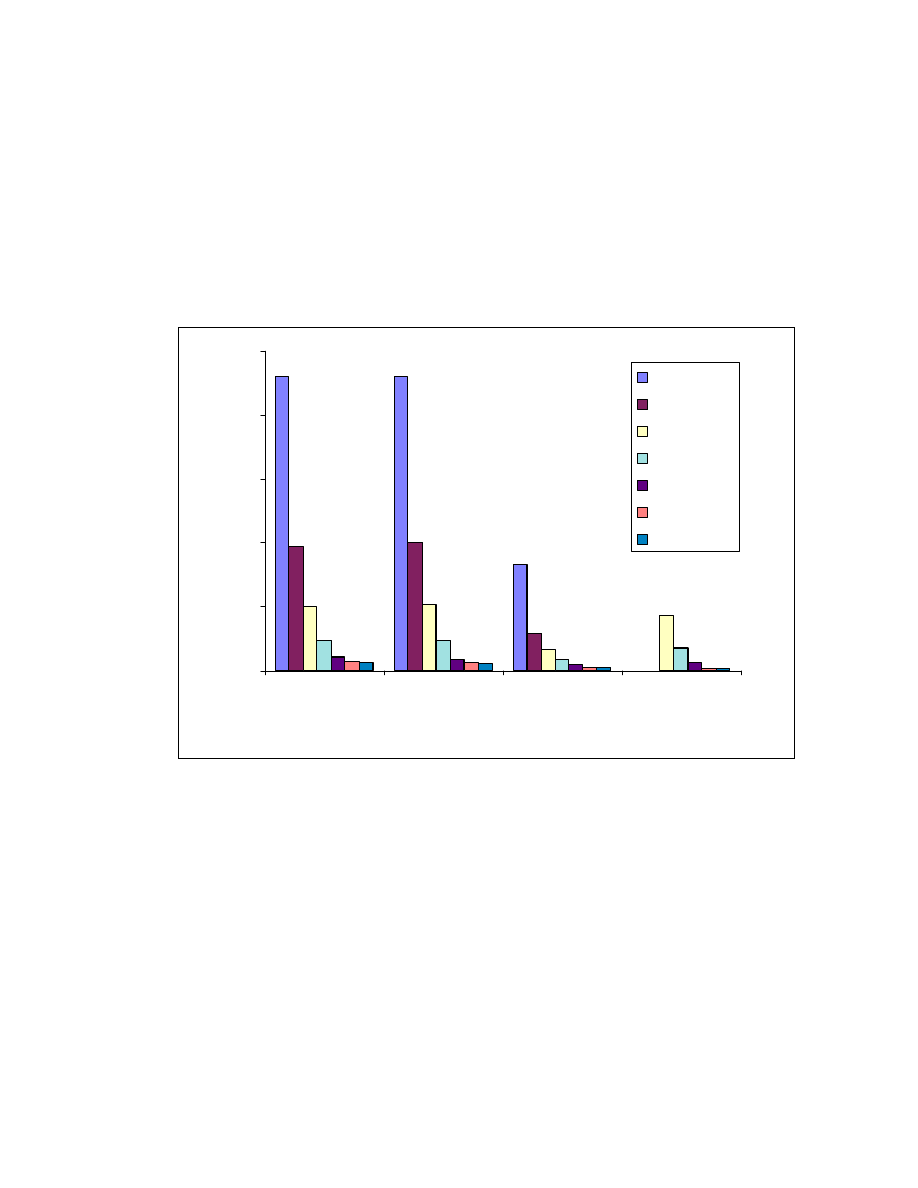
headspaced (see Fig. 15). The maximum response was obtained when 50
µ
L of
BSTFA was added which is six times the amount of acid. The excess amount of
BSTFA could compensate for the trace amount of water already in the sample.
4.3.1.2 Thermostatting temperature and time
The formation of the trimethylsilyl esters depends on both temperature
and time of the reaction, both parameters also affect the equilibrium between
51
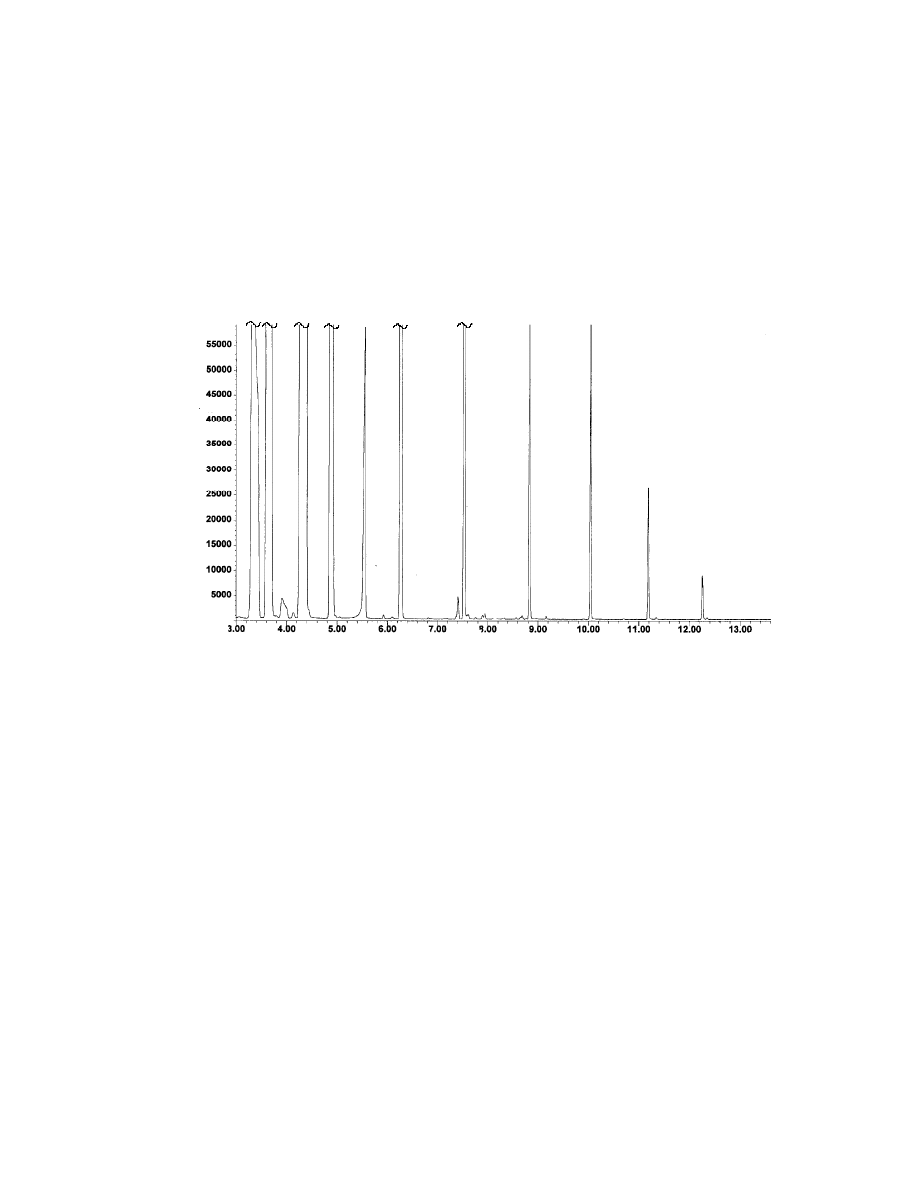
Fig. 14 Headspace of fatty acid trimethylsilyl esters (10 ppm). One mL of a
10 ppm acid mixture was placed in a headspace vial and 50
µµ
L BSTFA was
added. The vial was thermostatted at 80
o
C for 10 minute. GC/MS conditions
are given in Table 7.
Octanoic acid
Heptanoic acid
Hexanoic
acid
Pentanoic
acid
Butyric
acid
Propionic
acid
Acetic
acid
Formic
acid
Abundance
Retention time (min)

52
the liquid and vapor phases in the headspace injection.
The thermostatting temperature affects both the reaction yield and vapor
phase distribution coefficient. In order to isolate the two parameters, a 10 minute
at room temperature reaction was made and a 1
µ
L reaction product was
injected onto a capillary Carbowax column. No free acid peaks were found.
This means the reaction is complete at room temperature and the only effect of
higher temperature on the headspace peak area is the vapor phase distribution.
The effect of temperature on headspace vapor phase distribution is
shown in Fig. 16 and 17. The peak area, which corresponds to the vapor phase
distribution, increases with the increase of thermostatting temperature. At 80
o
C,
the peak area of acetic acid is about 10 times as that at 30
o
C. In order to avoid
the destruction of the glass vial at high temperatures. Higher temperatures were
not possible with the experimental set-up.
Essentially the time needed for headspace equilibration depends on the
diffusion of the volatile sample components into and from the sample matrix. In
this case, the equilibration time depends on both the reaction rate and the
diffusion rate of the derivatized product. To ensure the maximum derivatization
and the vapor equilibrium of the fatty acids, the thermostatting time was varied
from 1 to 25 minutes. The peak area became constant after 5 min at 80
o
C (Fig.
18 and 19). This suggests that ten minutes were adequate for all of the fatty
acids studied here.
53
Fig. 15 Effect of volume of BSTFA. One mL of 100 ppm acid mixture was
placed into a headspace vial and thermostatted at 80
o
C for 10 minute.
Peak areas are for ion 75 AMU in the SIM mode of GC/MS (see Table 7 for
more details).
0
100
200
300
400
500
600
700
800
900
0
100
200
300
400
500
Volume of BSTFA (uL)
Peak area (x10
5
)
formic
acetic
propionic
butyric
pentanoic
hexanoic
heptanoic
octanoic
54
Fig. 16 Effect of thermostatting temperature (1). One mL of 50 ppm acid
mixture was used and thermostatting time was 10 minute. GC/MS
conditions are same as in Fig. 15.
0
10
20
30
40
30
40
50
60
70
80
Thermostatting temperature (
o
C)
Peak area (x10
6
)
Acetic
Propionic
Butyric
55
Fig. 17 Effect of thermostatting temperature (2). One mL of 50 ppm acid
mixture was used and thermostatting time was 10 minute. GC/MS
conditions as in Fig. 15.
0
1
2
3
4
5
6
7
8
30
40
50
60
70
80
Thermostatting temperature (
o
C)
Peak area (x10
6
)
Pentanoic
Hexanoic
Heptanoic
Octanoic
56
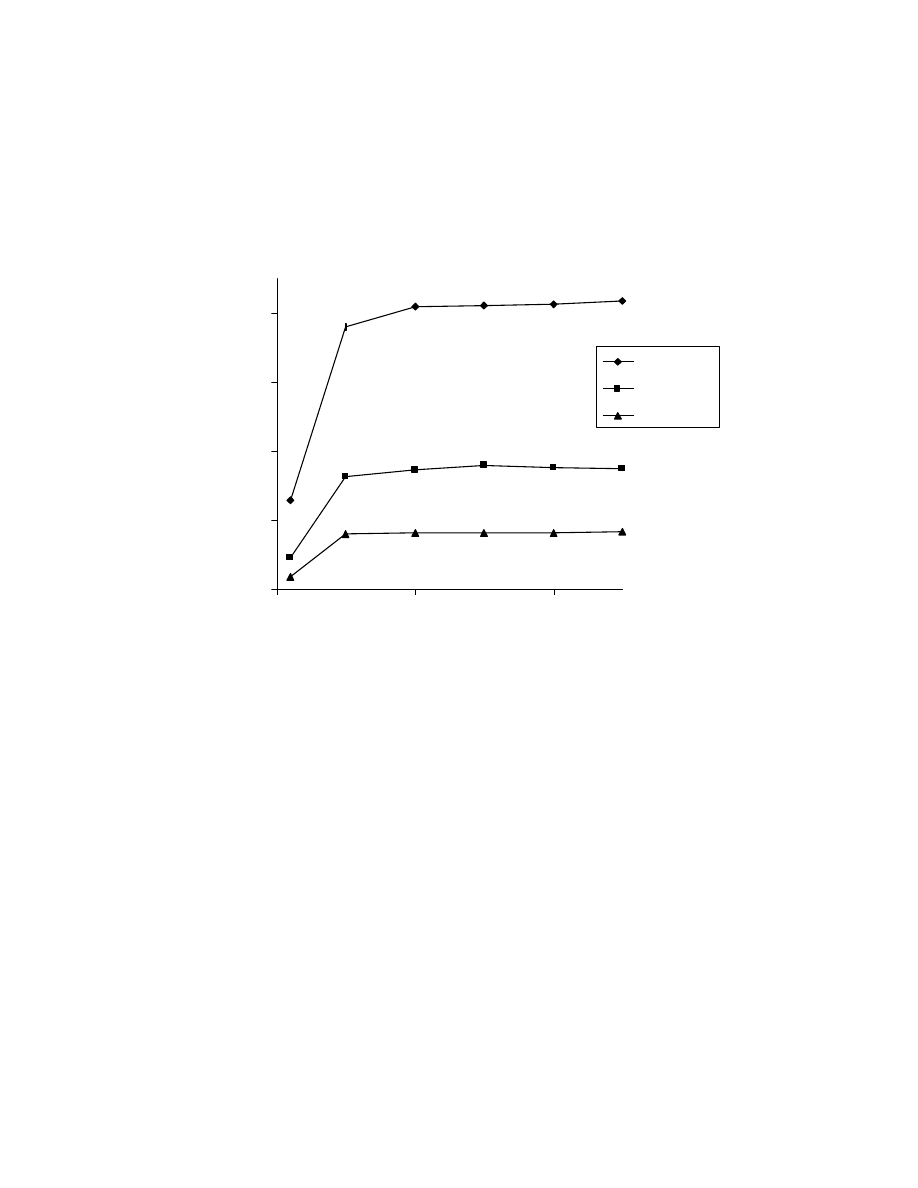
Fig. 18 Effect of headspace equilibration time on mass spectrometry peak
area (1). One mL of 50 ppm acid mixture was used and thermostatting
temperature was 80
o
C.
0
10
20
30
40
0
10
20
Thermostatting time (min)
Peak area (10
6
)
Acetic
Propionic
Butyric

57
Fig. 19 Effect of thermostatting temperature on mass spectrometry peak
area (2). One mL of 50 ppm acid mixture was used and thermostatting
temperature was 80
o
C.
0
1
2
3
4
5
0
10
20
Thermostatting time (min)
Peak area (10
6
)
Pentanoic
Hexanoic
Heptanoic
Octanoic

58
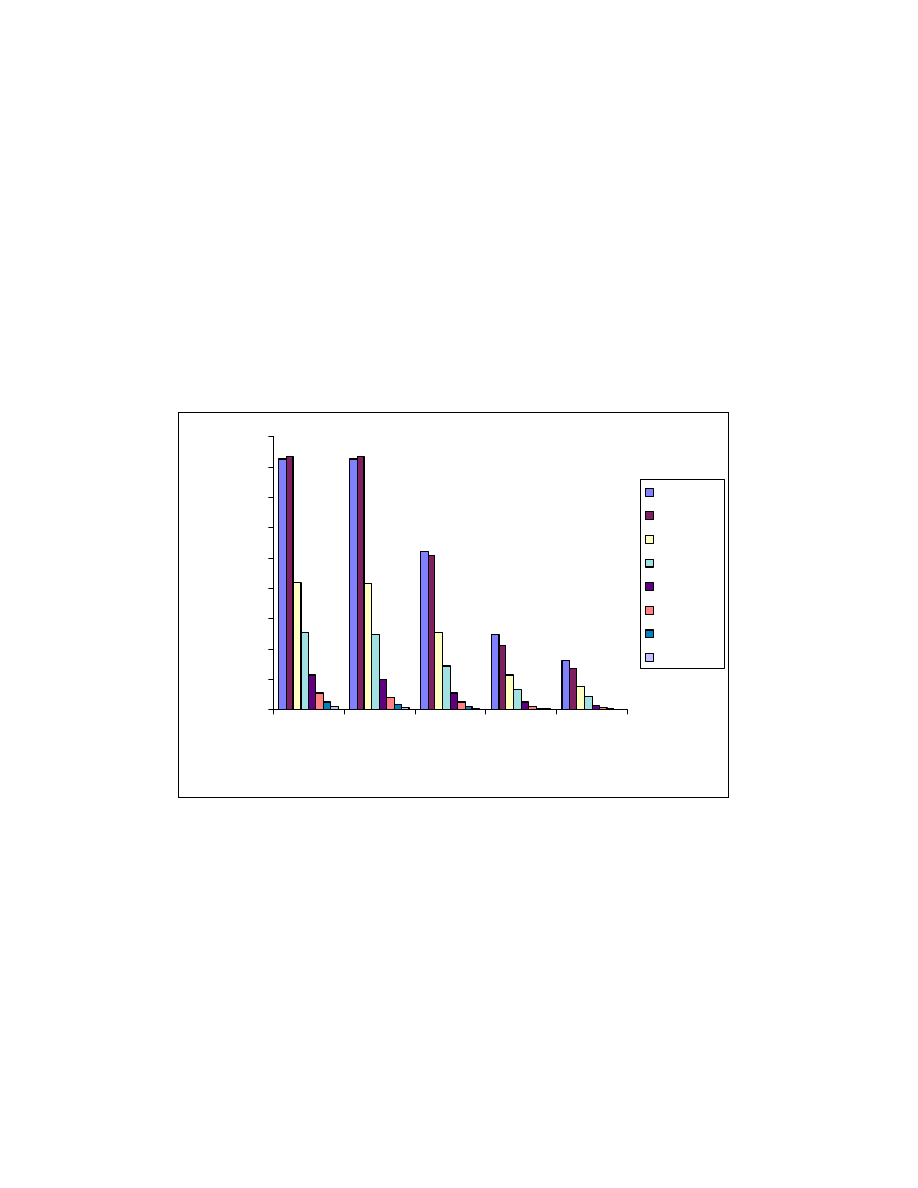
4.3.1.3 Solvents
Hexane, acetonitrile, chloroform and toluene were investigated as
solvents to optimize the yield and vapor equilibration (see Fig. 20). The solvents
had a significant influence on the headspace peak area (see Fig 20). The
reaction yield was determined by direct syringe injections (not headspace) of the
products. The reaction yields did not show significant differences. However, the
headspace results shown a dramatic peak area change as a function of reaction
solvent. The peaks produced by hexane and acetonitrile are about 2.5 times
that produced by chloroform and toluene. Acetonitrile was used for all future
studies.
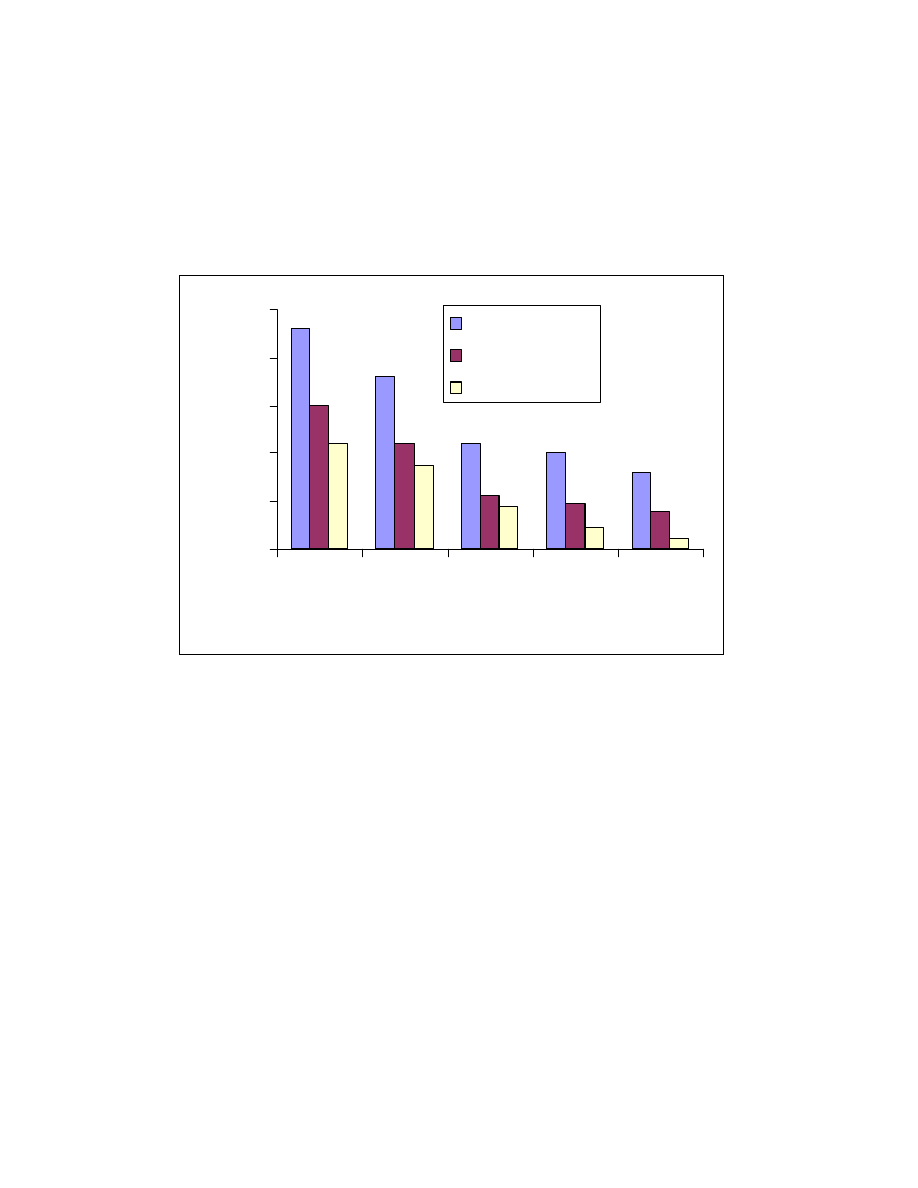
4.3.1.4 Salt effect
The effect of salts in aqueous extractions has been well studied
(76)
. Even
though the salt has a limited solubility in acetonitrile, it still influences the
distribution of acid esters between the liquid and vapor phases. This was
studied by saturating the solution with salts including NaCl, KCl, Na
2
SO
4
and
MgSO
4
. The salts did not increase the vapor phase distribution as indicated by
peak areas (Fig. 21). A salt free solution was the best choice and used in all
future studies.
59
Fig. 20 Effect of solvents. One mL acid mixture was on-line derivatized and
headspaced at 80
o
C for 10 minute. GC/MS conditions same as Fig. 15.
0
5
10
15
20
25
Hexane
Acetonitrile
Chloroform
Toluene
Solvent
Peak area (X10
6
)
Acetic
Propionic
Butyric
Pentanoic
Hexanoic
Heptanoic
Octanoic
60
Fig. 21 Salt effects. One mL acid mixture was on-line derivatized and
headspaced at 80
o
C for 10 minute. GC/MS conditions same as Fig. 15.
0
100
200
300
400
500
600
700
800
900
No salt
NaCl
KCl
Na2SO4
MgSO4
Salt
Peak area (X10
5
)
formic
acetic
propionic
butyric
pentanoic
hexanoic
heptanoic
octanoic

61
4.3.2 Precision
The precision was evaluated by a series of replicate analysis (n=6) of
standard acid sample with a concentration of 20 ppm. Table 8 shows the
results. The relative standard deviations range between 4 and 7%.
4.3.3 Sample matrix effect
The described headspace derivatization sampling involves two or three
phase equilibration ( for low calorie fat, there are two phases: sample solution
and headspace; for tobacco, there are three phases: solid tobacco matrix,
solution and headspace.) To investigate the matrix effect, the target
compounds in the sample were removed using the following procedure: 0.2 gram
of sample ( low calorie fat or tobacco) was placed into a headspace vial. One mL
of acetonitrile was added and the vial was sonicated for 2 min. Then 50
µ
L
BSTFA was added and the vial was sonicated for another 2 min. Finally, the vial
was put in a 80
o
C oven with the the vial open to evaporate the solvent and the
formed acid trimethylsilyl esters. To ensure that the matrix does not have a
detectable amount of short chain acids and their derivatized trimethylsilyl esters,
it was analyzed following the procedure described in 4.2.3. No acid ester was
found. One mL of 1 ppm acid standard was spiked onto the matrix and the
results of analysis are shown in Fig. 22. A significant peak area change was
found. The effect of the tobacco matrix is bigger than that of low calorie fat. For
example the butyric acid peak area was reduced about 50% when tobacco
matrix was present and only 34% when low calorie fat matrix was used. This
study indicates that a standard external calibration using pure solvent as matrix
is not feasible in this case.
62
Table 8. Reproducibility of fatty acid trimethylsilyl esters in headspace GC/MS
Sample: one mL of 20 ppm acid mixture (n=6)
Acids
%RSD
(peak area)
Formic acid
4
Acetic acid
4
Propionic acid
4
Butyric acid
6
Pentanoic acid
4
Hexanoic acid
5
Heptanoic acid
5
Octanoic acid
7
63
Fig. 22 Effect of sample matrix on headspace sampling. One mL of 1 ppm
acid mixture was spiked into the matrix and headspaced at 80
o
C for 10
minute. Trimethylsilyl esters of A. butyric acid, B. pentanoic acid, C.
hexanoic acid, D. heptanoic acid and E. octanoic acid.
0
5
10
15
20
25
A
B
C
D
E
Acids
Peak area (x10
4
)
Solvent
Low calorie fat
Tobacco

64
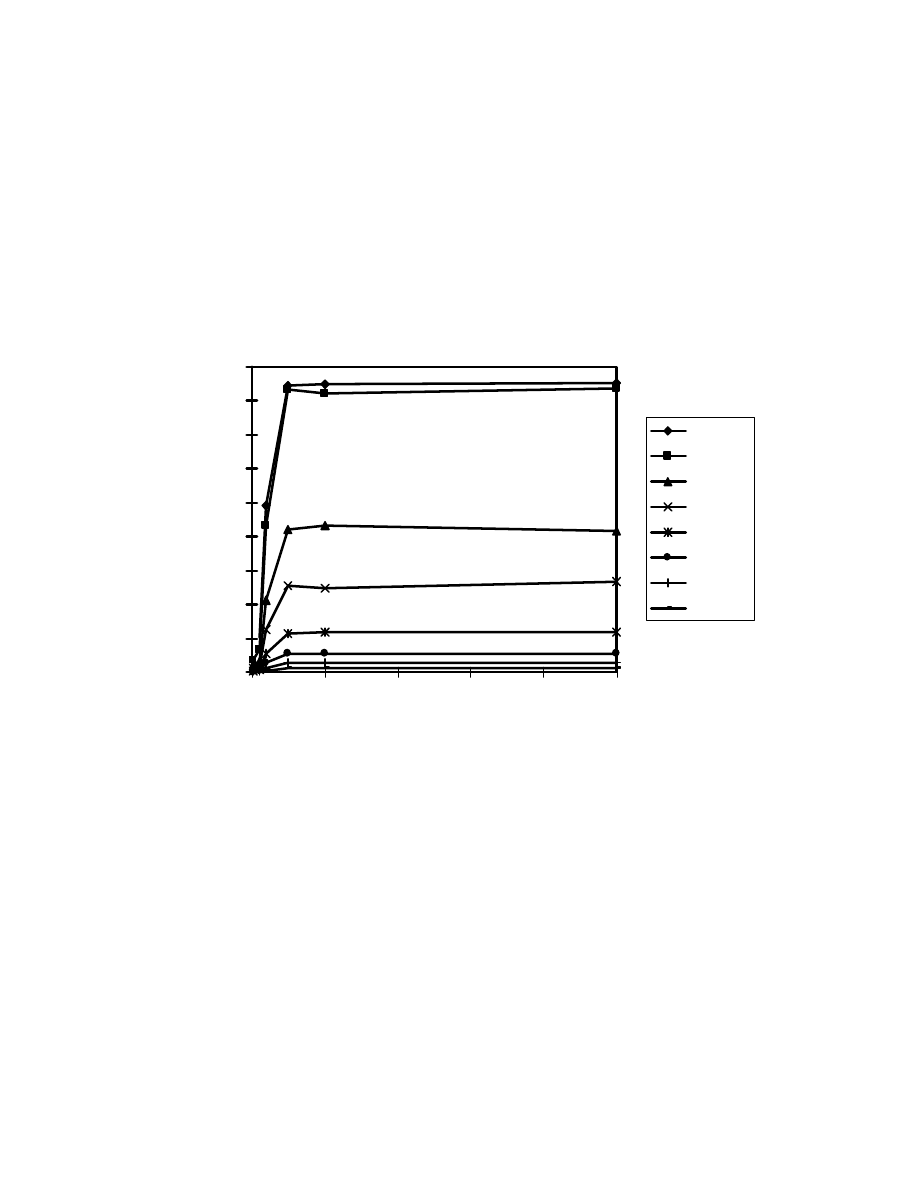
4.3.4 Calibration
Concerning the matrix effect, all the calibrations were carried out using
the matrix described in 4.3.3. Standard solutions of different concentrations of
the fatty acids were spiked on to the matrix. Each standard was analyzed three
times. The data were plotted by regression analysis using a linear model (Table
9). Detection and quantitation limits were evaluated for signal/noise (S/N) ratios
of 3 and 10 respectively. Figures 23 and 24 show the calibration curves by using
low calorie fat matrix.
4.3.5 Sample analyses
To demonstrate the feasibility of this technique, different food and
consumer products including low calorie fat, coffee, tea, and tobacco were
analyzed. Table 10 shows the results. Free fatty acids were found in all six
samples. The concentration ranges from 0.45-38 ppm. Tobacco contains all the
eight acids investigated at a low level. Coffee contains significant levels of
acetic acid (38 ppm). Two typical chromatograms are shown in Figures 25 and
26.

65
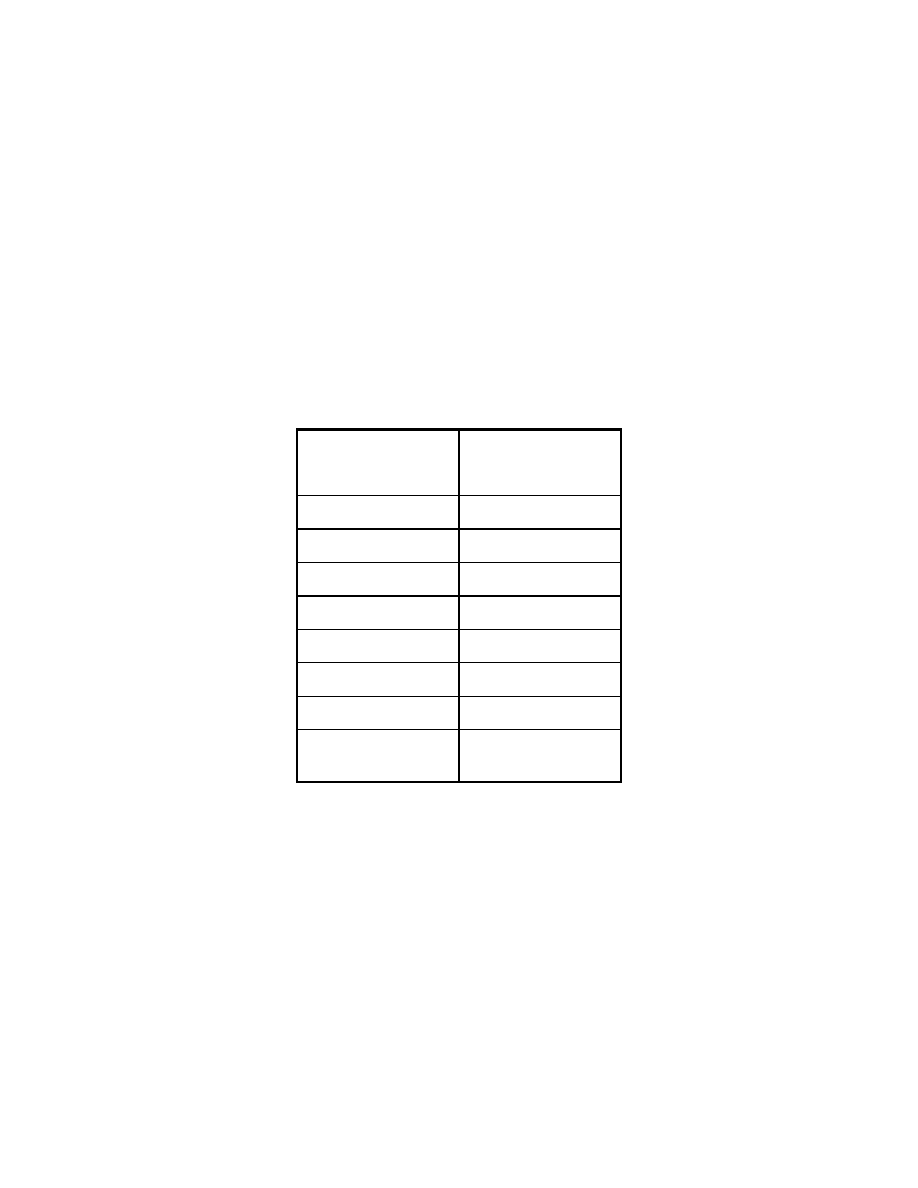
Table 9 Results of regression analysis
Acids
Acetic
Propionic
Butyric
Pentanoic
Calibration
range (ppm)
0.1-10
0.1-10
0.1-10
0.1-10
Correlation
coefficient
0.9993
1.0000
0.9993
0.9998
Detection limit
(ppm)*
0.008
0.01
0.05
0.1
Quantification
limit (ppm)*
0.027
0.033
0.17
0.33
•
Maria P. Llompart-Vizoso, et. al., J. High Resol. Chromatogr., 19, 209(1996).
The detection limit was evaluated for signal/noise ratio (S/N) of 3. By
injecting low concentrations of standards, the detection limits were
corresponding to the concentration of three times noise level and the
quantification limits were ten times noise level.
66
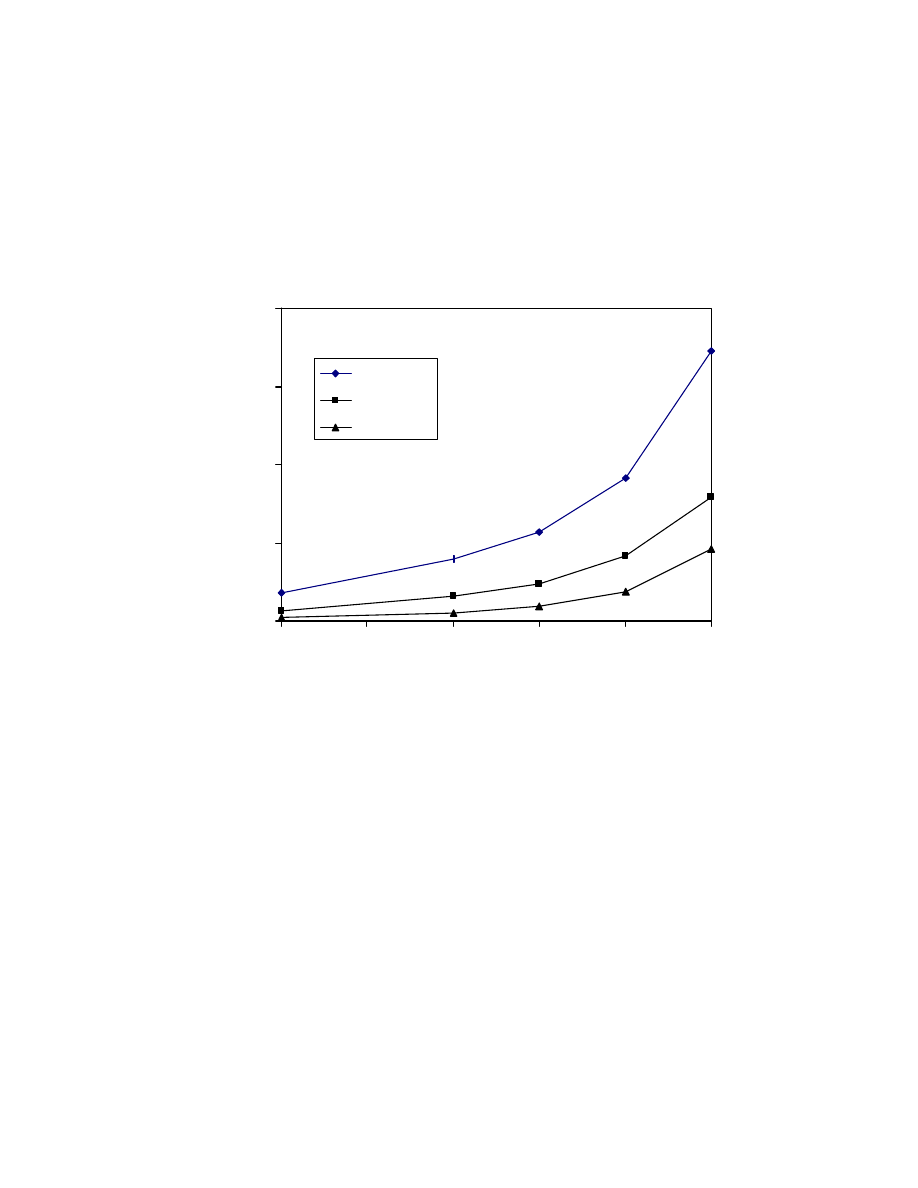
Fig. 23 Calibration curves of formic, acetic, propionic, and butyric acid
trimethylsilyl esters using low calorie fat matrix. GC/MS conditions are
same as in Fig. 15.
0
20
40
60
80
100
120
140
0
2
4
6
8
10
Concentration (ppm)
Peak area (x10
5
)
Formic acid
Acetic acid
Propionic acid
Butyric acid
67
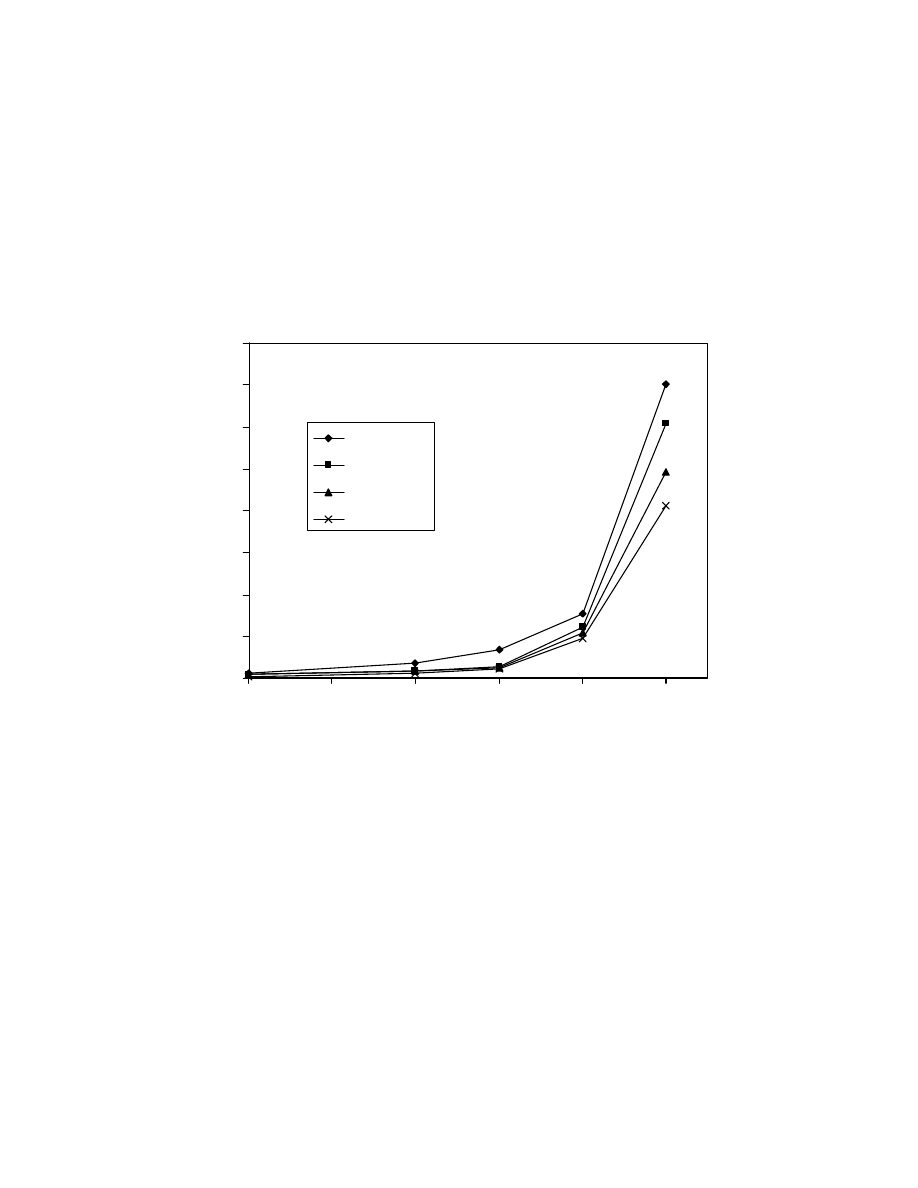
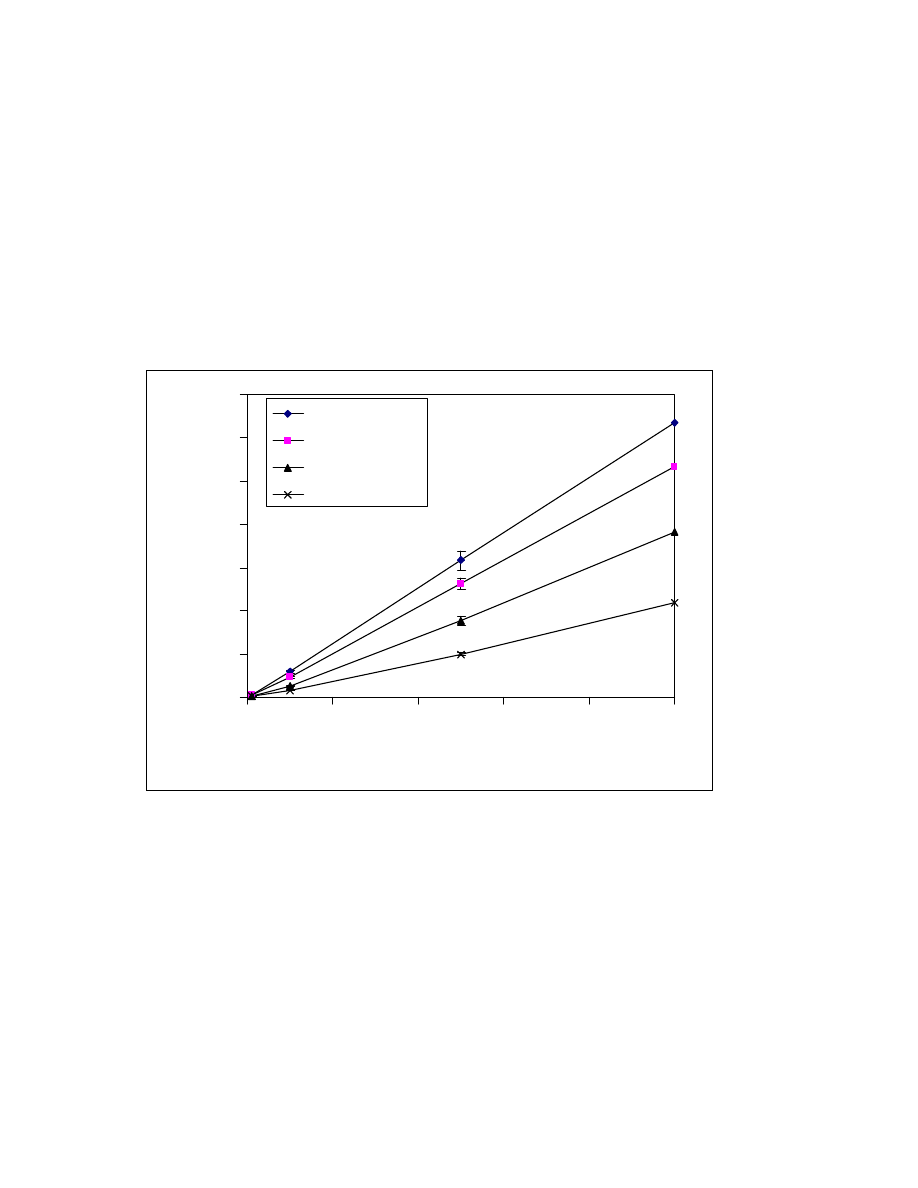
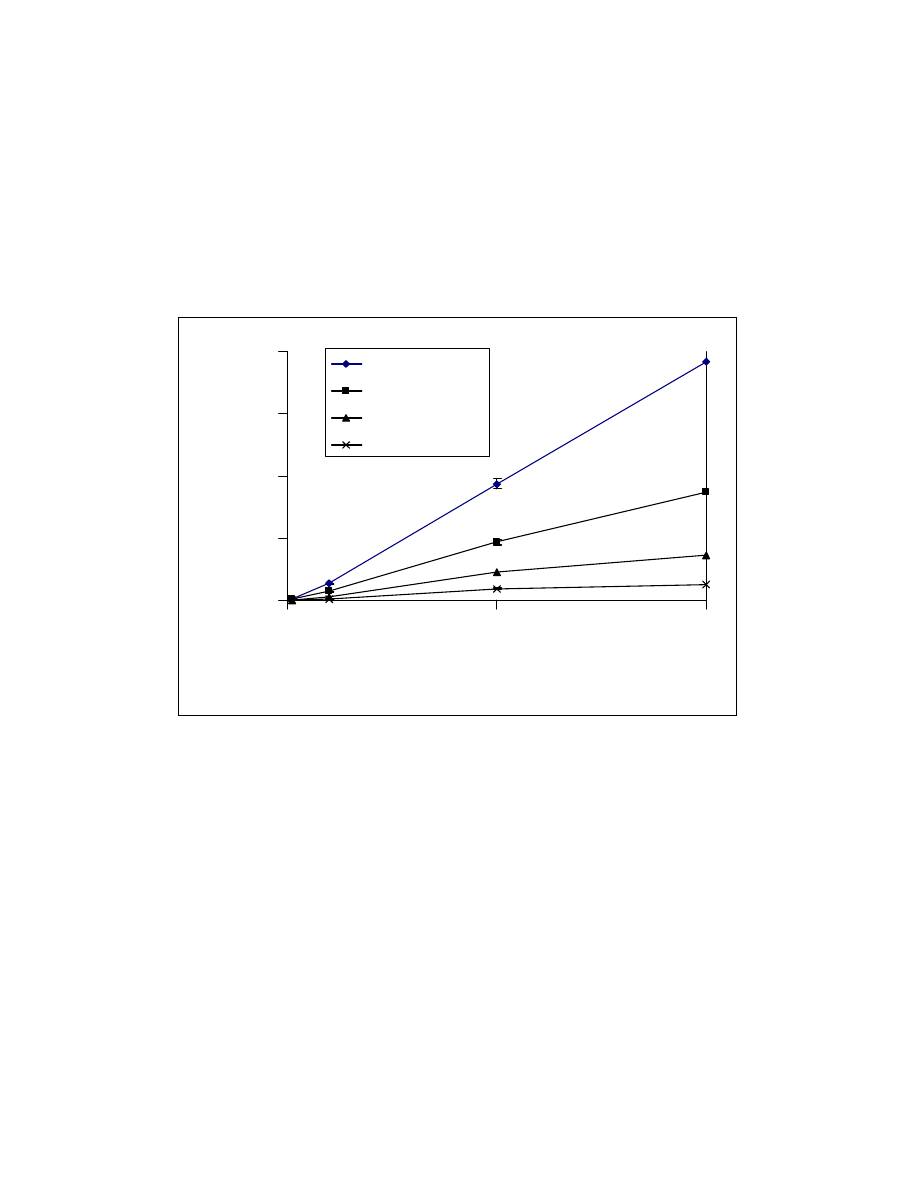
Fig. 24 Calibration curves of pentanoic, hexanoic, heptanoic and octanoic
acid trimethylsilyl esters using low calorie fat matrix. GC/MS conditions
are same as in Fig. 15.
0
5
10
15
20
0
5
10
Concentration (ppm)
Peak area (x10
-5
)
Pentanoic acid
Hexanoic acid
Heptanoic
Octanoic acid

68
Table 10 Content of free acids in commercial products*
Acids
Low calorie fat
µg/g
Tea 1
µg/g
Tea 2
µg/g
Coffee
µg/g
Cigarette
µg/g
Tobacoo
µg/g
Formic
0.62
2.8
2.0
5.9
0.62
1.2
Acetic
1.9
0.45
2.7
38
1.1
4.3
Propionic
0.96
ND
0.89
3.3
ND
0.99
Butyric
1.2
ND
1.3
1.5
1.6
1.5
Pentanoic
ND
ND
1.5
1.6
1.7
1.7
Hexanoic
1.1
ND
2.4
1.4
1.4
5.2
Heptanoic
ND
ND
ND
ND
3.7
14
Octanoic
ND
ND
ND
ND
2.6
7.4
*ND: not detected. Average values were used (n=3)
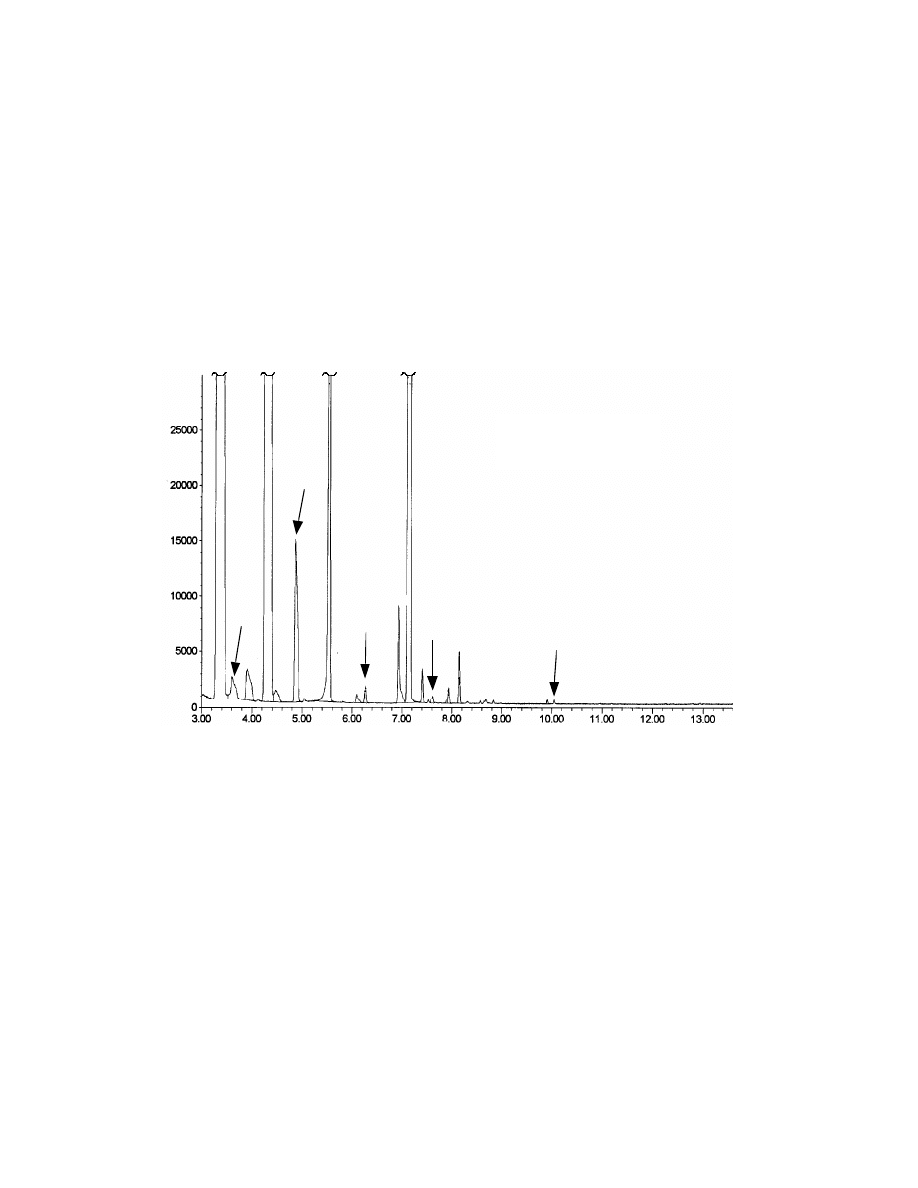
69
Fig. 25 Typical sample chromatogram of low calorie fat. Peak 1.
Trifluoroacetamide; 2. bis(trimethylsilyl) ether; 3.
mono(trimethylsilyl)trifluroacetamide, 4. BSTFA. Sample was on-line
derivatized and thermostatted at 80
o
C for 10 minute and detected by
SIM GC/MS at 75 amu.
Formic
acid
Acetic acid
Hexanoic acid
Propionic
acid
Butyric acid
Abundance
Retention time (min)
1
2
3
4
Low calorie fat
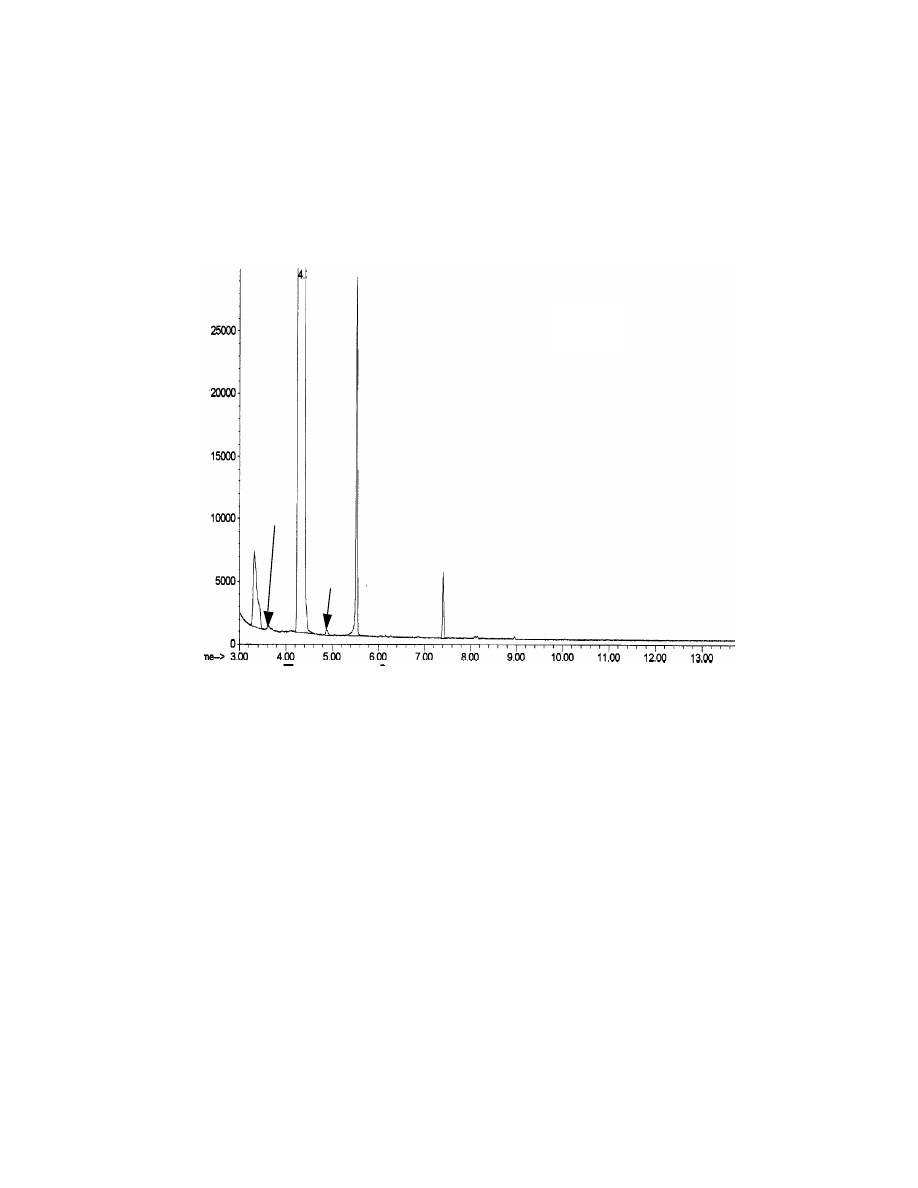
70
Formic
acid
Acetic
acid
Abundanc
e
Fig. 26 Typical sample chromatogram of tea. Sample was on-line
derivatized and thermostatted at 80
o
C for 10 minute and detected by
SIM GC/MS at 75 amu.
Tea

71
4.4 Discussion
Reliable quantitative analysis of short chain free acids is needed in the
food industry, especially in the production of low calorie fat in which acetic,
propionic and butyric acid are important. Although these acids have been
determined by GC, most methods use a solvent extraction procedure followed by
GC. Extraction with organic solvents usually results in errors from the loss of
volatile acids such as formic and acetic acid. With in line derivatized headspace
analysis described here, little sample manipulation is required and losses are
minimized. Errors associated with vapor sampling and injection into the GC are
reduced, and batch analysis is possible. Since vapor equilibration occurs above
an organic solution, partition into the vapor phase is not enhanced by the addition
of salts (no salting out effect). Direct headspace of short chain fatty acids has
been studied
(98)
. However, the introduction of serious ghosting peaks and peak
tailing, due to adsorption on the headspace transfer line and the GC inlet liner,
make this technique complicated. Formic acid cannot be detected with direct
headspace analyses
(98)
. With BSTFA on-line derivatization, all eight acids can be
detected and no system deactivation is needed. The derivatized acids can be
detected by using a routine headspace GC or GC/MS.
All the acid trimethylsilyl esters investigated have a base ion at m/z 75.
Therefore, using single ion monitoring (SIM 75), sensitivity and selectivity are
enhanced. The derivatizing reagent (BSTFA) and its by-products (e.g.
mono(trimethylsilyl)trifluoroacetamide and trifluoroacetamide) do not have a
strong ion at m/z 75 so they show only minor interference. Only
trimethylchlorosilane has a relatively strong ion at m/z 75, but fortunately it has a
retention time of 3.32 min and elutes before any of the acids.
On-line derivatization of low calorie fat, tobacco, tea, coffee and
cigarette with BSTFA provided an excellent method for extraction and conversion

72
of fatty acids to their volatile trimethylsilyl esters. Therefore this technique could
be used to evaluate the freshness and the taste of these products.
4.5 Conclusions
In summary, on-line silylation of short chain acids with BSTFA followed by
GC/MS provide an excellent substitute to the existing techniques for the analysis
of free short chain acids. This technique is rapid, simple, quantitative and
requires only limited sample preparation. It can be applied to samples with
complicated matrices such as low calorie fat, tobacco, tea and coffee.

73
CHAPTER V
BEHAVIOR OF SPME FIBER COATINGS
5.1 Introduction
Solid Phase Microextraction (SPME) is a new sample enrichment
technique. It is a fast, simple, sensitive and solventless technique which can be
used for analysis in a variety of fields including water
(9-36)
, air
( 99-102),
soil
( 103-105 )
,
human fluids
(106-111)
and food
(1, 112-118).
In SPME, a fused silica fiber coated with
a thin hydrophobic stationary phase is immersed in a stirred aqueous solution.
The organic analytes partition from the water into the stationary phase. Then, the
fiber is removed from the solution and inserted into a gas chromatograph (GC)
inlet. The analytes are thermally desorbed in the hot GC inlet and transferred to
the column. The most commonly used stationary phase for the SPME fiber is
poly(dimethylsiloxane). There is a linear relationship between the amount
absorbed by the fiber and the concentration in solution
(49,113)
. The SPME
technique is used for quantitative trace analysis. The technique is extremely
sensitive and ppt levels can be achieved in some cases
(120)
.
Several SPME fiber coatings which have different chemical properties
have been investigated. These include poly(dimethysiloxane), polyacrylate and
Carbowax. Among the advantages of the SPME technique, fiber selectivity for a
target compound is an important parameter. By choosing a proper fiber, the
sensitivity can be enhanced and the resolution required for a specific sample
separation can be increased. Until now, a systematic study of the selectivities of
the fiber coatings has not been published.
In this study, a study of the selectivity of fiber coatings has been carried
out. The behavior of test compounds which represent five different functional
groups with three SPME fibers. The effect of temperature on the absorption and
the modification of the matrix were also investigated.

74
5.2 Experimental
5.2.1 Fiber coatings
The SPME fibers used in this study were purchased from Supelco Inc.
(Bellefonte, PA). They were fused silica fiber, 110 um diameter and 1 cm length,
coated with poly(dimethylsiloxane), polyacrylate and Carbowax. The fibers used
and their calculated coating volumes are listed in Table11.
Ten chemicals which represent different functional groups were used.
Decane was obtained from Fisher Scientific Company (Fair Lawn, NJ).
Naphthalene, anthracene and tetradecane were from Aldrich Chemicals
(Milwaukee, WI). Decylamine, tetradecylamine, decyl alcohol, tetradecanol,
decanoic acid, and tetradecanoic acid were from Chem Service Chemicals (West
Chester, PA). They were used without further purification. A stock solution of 100
ppm of each of the 10 chemicals was prepared by dissolving 10 mg of each in a
small amount of ethanol and diluting to 100 mL with water. For the experiments
studying selectivities and the temperature influence, a 1 mL stock solution was
diluted to 100 mL with deionized water. The concentration of the working solution
was 1
µ
g/mL. The concentration of the compounds for the investigation of pH
was 0.9
µ
g/mL. The pH was adjusted with HCl/NaCl (pH 2) and sodium
tetraborate/HCl (pH 9.2) Sodium chloride and sodium tetraborate were
purchased from Fisher Scientific Company (Fair Lawn, NJ).

75
Table 11 Parameters of fiber coating
Trade name
Coating
Coating
thickness (um)
Calculated coating
volume (mL)
PDMS
Poly(dimethylsilox
ane)
100
6.6 x 10
-4
PA
Polyacrylate
85
5.2 x 10
-4
Carbowax
Polyethylene
Glycol-
divinylbenzene
65
3.6 x 10
-4

76
5.2.2 SPME extraction
Four milliliters of the test solution was placed in a 10 mL vial. The vial was
capped with a Teflon
coated septum. The solution was agitated with a Thermix
Model 120 MR magnetic stirrer (Fisher Scientific, Springfield, NJ) at the spinning
rate of 6 (division). The SPME needle pierced the septum and the fiber was
directly inserted into the aqueous solution. The absorption time was 20 minutes.
After each sampling, the aqueous solution was replaced with a fresh one.
5.2.3 Temperature study
For the temperature studies, the temperature was controlled with a water
bath. For the temperatures lower than room temperature, the water bath was
filled with salted ice water. For the temperatures higher than room temperature, a
PC-351 Hot Plate Stirrer was used (Corning, Inc. Coring, NY). A thermometer
was inserted to the water bath to monitor the temperature changes. The variation
of the temperature was
±
2
o
C. The pH was adjusted with 0.1N HCl/NaCl and 0.1
N sodium tetraborate/HCl.
5.2.4 GC/MS
A GC/MS was used as the detection device. A HP Model 5890 Gas
Chromatography was interfaced with a HP Model 5970 Mass Selective Detector
(Hewlett-Packard, Palo Alto, CA). A 30 m x 0.25 mm with 0.25
µ
m film HP-5
column (Hewlett Packard, Little Falls, PA ) was used as the analytical column.
The injection port temperature which was also the desorption temperature for the
SPME fiber was 250
o
C, and the desorption time was 4 min. The GC split valve
was set to open after the 4 min desorption time. The GC injector liner was a
quartz liner with an internal diameter of 0.75 mm (Supelco Inc. Bellefonte, PA).

77
The GC column temperature program was 40
o
C (hold for 4 min), 15
o
C/min to
250
o
C (hold for 1 min). A mass scan from 35 to 250 amu was acquired in the
electron impact ionization mode (70 ev). The amount that was thermally
desorbed from the fibers during injection was calibrated using standards.

78
5.3 Results and discussion
5.3.1 SPME coatings
The early work of the SPME technique was carried out by Hawthorne and
et al
(8)
using an uncoated silica fiber to determine caffeine in beverage samples.
However, much effort has been directed toward searching for more capable
adsorbents that can improve the performance of SPME
(8)
. SPME is a single
batch method, and the surface available for adsorption is very limited (typically
less than 10 mm
2
). Therefore, trace compounds in a sample must have large
distribution coefficients in order to be first highly enriched on the fiber surface and
then later successfully analyzed by subsequent separation and detection
methods. This situation means that a useful SPME fiber must have a efficient
coating. So far, the most frequently used fiber coatings have been
poly(dimethylsiloxane) with a thickness of 100 um, polyacrylate with 85 um
thickness and Carbowax/PDV with a film thickness of 65 um. Fig. 27 shows the
structures of these three polymers. The methyl groups of poly(dimethylsiloxane)
make this fiber coating relatively apolar, whereas polyacrylate and carbowax are
more polar because of the carboxyl and hydroxy groups respectively.
Poly(dimethylsiloxane) is used as a stationary phase in apolar GC columns.
Polyacrylate is used to make Amberlite XAD resins such as XAD-7 and XAD–8.
Carbowax is a polyethylene glycol used as a GC stationary phase for polar
compounds. The use of these polymer to enrich compounds should be selective
depending on their chemical properties.
5.3.2 Degrees of absorption on SPME coatings
In a standard aqueous solution containing 1 ppm each of the ten
investigated compounds, the amount absorbed by the three coatings is shown in

79
Fig. 27 Schematic chemical structures of fiber coatings
Si
O
CH
3
CH
3
Si
CH
3
CH
3
C
R
C
O
O
R
HO
(
C
H
2
C
H
2
O
)
n
Poly(dimethylsiloxane)
H
Polyacrylate
Carbowax
PDMS
PA

80
Tables 12 and 13. For the ten-carbon compounds (Table 12), the PDMS coating
shows good selectivity for decane and naphthalene and a fair selectivity for
decanol. Both decane and naphthalene are nonpolar and volatile compared with
the other three compounds. Since polyacrylate is polar, it shows high selectivity
for both decanol and decanoic acid but not decylamine. Interestingly, Carbowax
shows low selectivity for all five test compounds. It does show more selectivity for
decylamine than either PDMS or polyacrylate. In this case, SPME is not efficient
for direct extraction of short chain amines. A modification of the solution or
derivatization step may be required for short chain amines
(60)
.
For longer carbon chain compounds (Table 13), all three coatings show
better selectivity compared to the ten carbon compounds. This is expected since
all three coatings have a hydrophobic moiety. For the longer chain carbon
compounds, the hydrophobic moiety dominates the absorption. For
tetradecylamine, the PDMS coating is the best of the three coatings.
5.3.3 Modifications of the sample matrices
In an aqueous solution, different forms of weak acids or bases may
coexist. Because the dissociation of weak acids or bases is pH dependent,
the distribution coefficients will be greatly influenced by pH. The ionic form of an
acid or a base is too hydrophilic (large hydration enthalpy) to be adsorbed by the
hydrophobic surface of the fiber. By adjusting the solution pH and suppressing
the ionization, the absorption efficiency can be increased. Fig. 28 shows the
effect of pH on absorption of two acids on a PDMS coating. By adjusting the pH
to 2, a eleven-fold increase of the amount of decanoic acid and a 15% increase
for the amount of tetradecanoic acid. Lower pH significantly improved the
absorption efficiency for decanoic acid.

81
Table 12. Amount absorbed (ng) by different fiber coatings for compounds
having ten carbons
n=3
Fibers
Decane
Naphtha-
lene
Decanol
Decanoic
acid
Decyl
amine
PDMS
220
310
440
36
0.29
PA
21
280
460
550
1.1
CW
17
66
55
30
7.3
Table 13. Amount absorbed (ng) by different fiber coatings for compounds
having fourteen carbons
n=3
Fibers
Tetra-
decane
Anthracene Tetra-
decanol
Tetra-
decanoic
acid
Tetradecyl
amine
PDMS
380
610
640
450
630
PA
260
710
760
870
370
CW
59
590
290
450
160

82
For amines (Fig. 29), increasing the pH to nine, a 1000 fold increase of the
amount of decylamine absorbed was obtained. It was almost impossible to
determine decylamine at pH 7. The pK
a
of decylamine is 10.64 (25
o
C)
(121)
, a
higher pH is preferred to suppress the ionization. However, due to the
deterioration of the fiber at high pH, pHs higher than 9 were not investigated.
Compared to PDMS and Carbowax coatings, PA is the best coating for
acids. By adjusting the sample pH, the amounts absorbed for both decanoic acid
and tetradecanoic acid are increased (see Fig. 30). The amount of decanoic acid
absorbed by PA is 2.8 folds of that absorbed by PDMS and 5.3 folds of that
absorbed by Carbowax fiber. For amines (see Fig. 31), as expected, the amount
absorbed increased by increasing pH but it is not as significant as the case of
PDMS coating.
The pH effect on acids on the Carbowax coating is shown in Fig. 32. The
amount absorbed increased as the pH was adjusted to 2. However, this coating
is not as good as PDMS or PA coating for decanoic acid. For decylamine (Fig.
33) at pH nine, the amount absorbed is less than that of PDMS coating, but more
than that of the PA coating.
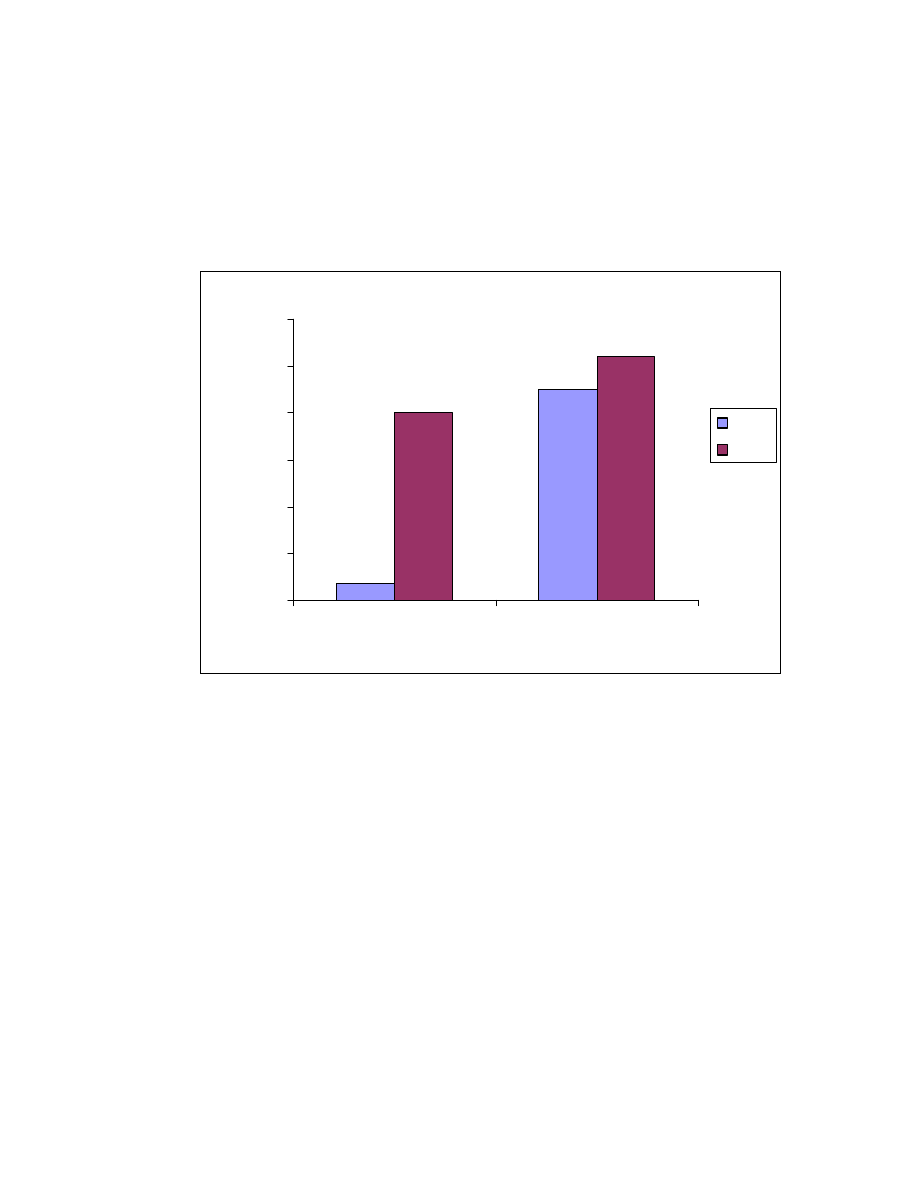
83
Fig. 28 pH effect on acid absorption in PDMS coating. Four mL of 1 ppm
sample mixture was extracted by PDMS at different pH for 20 minute.
36
450
520
400
0
100
200
300
400
500
600
decanoic acid
tetradecanoic acid
Acid
Amount absorbed (ng)
pH 7
pH 2
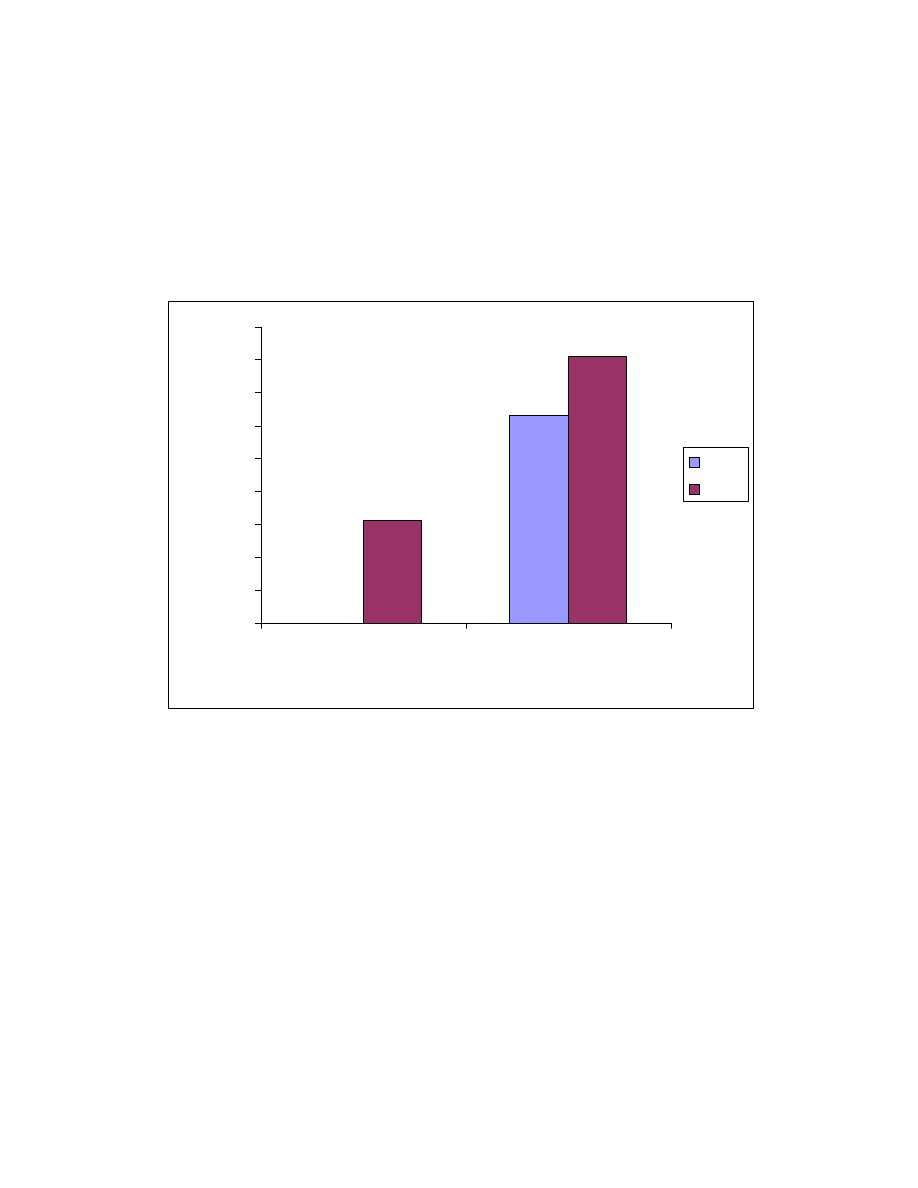
84
Fig. 29 pH effect on amine absorption in PDMS coating. Four mL of 1 ppm
sample mixture was extracted by PDMS at different pH for 20 minute.
0.29
630
310
810
0
100
200
300
400
500
600
700
800
900
Decyl amine
Tetradecylamine
Amine
Amount absorbed (ng)
pH 7
pH 9
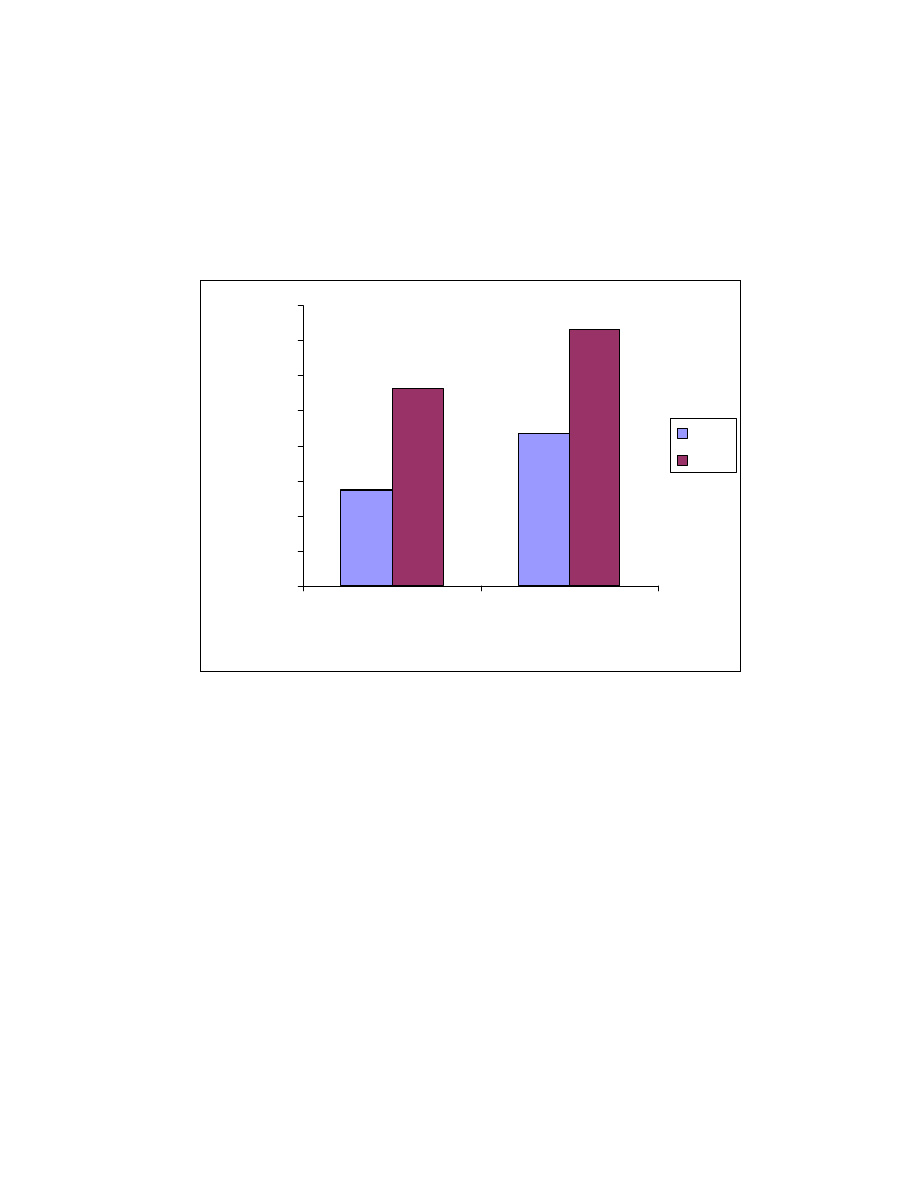
85
Fig. 30 pH effect on acid absorption in PA coating. Four mL of 1 ppm
sample mixture was extracted by PA at different pH for 20 minute.
1125
1466
547
866
0
200
400
600
800
1000
1200
1400
1600
Decanoic acid
Tetradecanoic acid
Acid
Amount absorbed (ng)
pH 7
pH 2
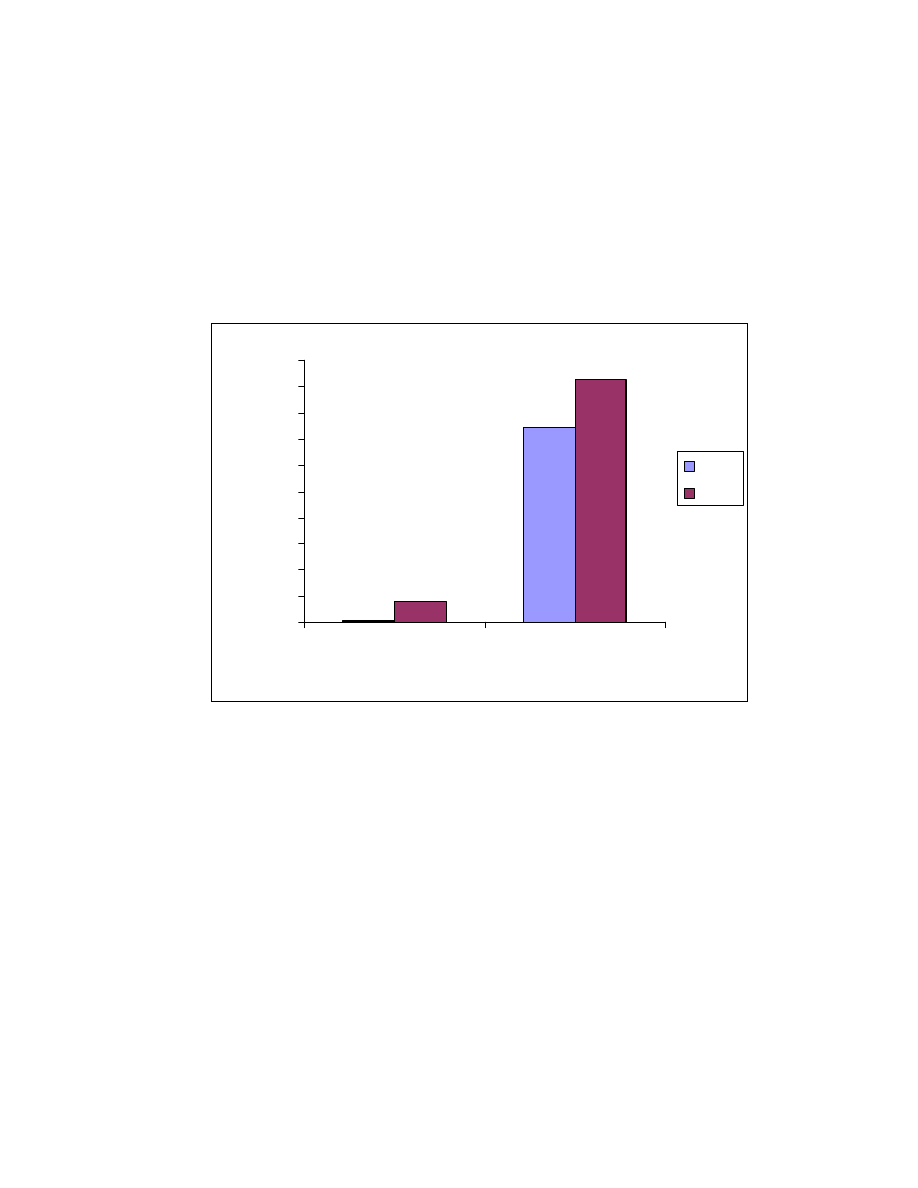
86
Fig. 31 pH effect on amine absorption in PA coating. Four mL of 1 ppm
sample mixture was extracted by PA at different pH for 20 minute.
1.1
372
39
463
0
50
100
150
200
250
300
350
400
450
500
Decylamine
Tetradecylamine
Amine
Amount absorbed (ng)
pH 7
pH 9
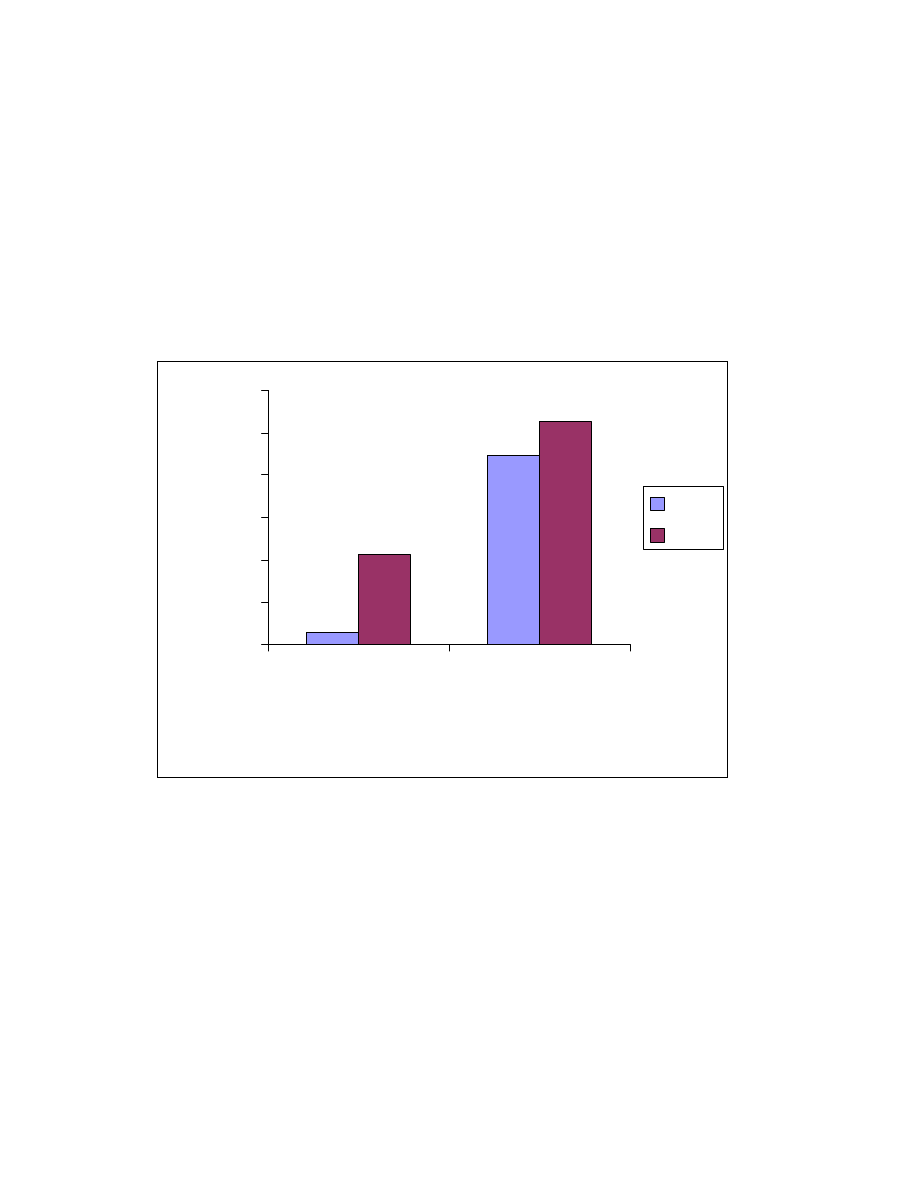
87
Fig. 32 pH effect on acid absorption on Carbowax coating. Four mL of 1
ppm sample mixture was extracted by Carbowax at different pH for 20
minute.
30
447
212
526
0
100
200
300
400
500
600
Decanoic acid
Tetradecanoic
acid
Acid
Amount absorbed (ng)
pH 7
pH 2
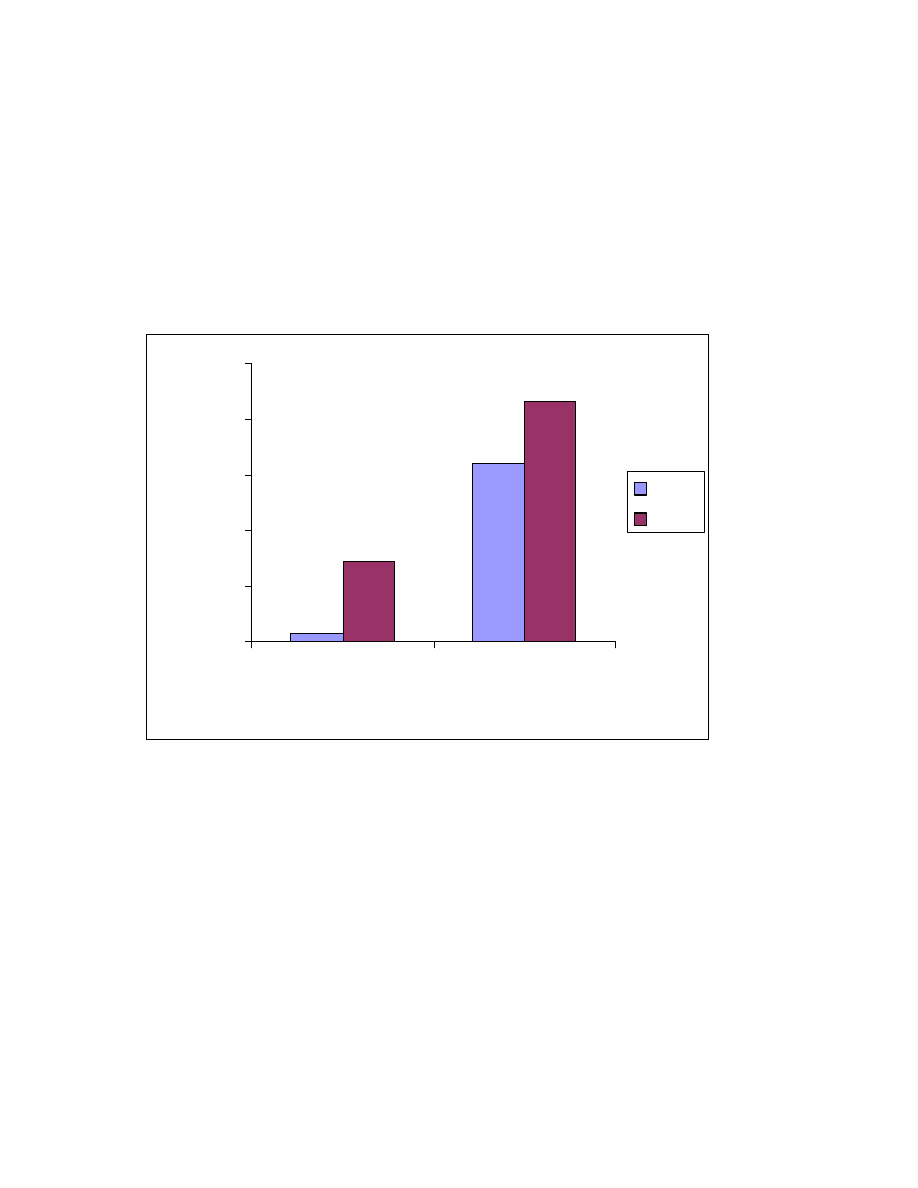
88
Fig. 33 pH effect on amine absorption in Carbowax coating. Four mL of 1
ppm sample mixture was extracted by Carbowax at different pH for 20
minute.
7.3
160
72
216
0
50
100
150
200
250
Decylamine
Tetradecylamine
Amine
Amount absorbed (ng)
pH 7
pH 9

89
5.3.4 Temperature effect
Diffusion coefficients of analytes can be increased by increasing the
sample temperature. Even though magnetic stirring was applied to the solution,
for some compounds, diffusion rate still a limiting parameter for SPME
extraction
(119)
. To investigate the influence of sample temperature, the ten
compounds were extracted at 4, 15, 25, 40, 52, and 72
o
C for 20 minutes. The
results are listed in Table 14 for the PDMS coating, Table 15 for the PA coating
and Table 16 for the Carbowax coating. The highest temperature investigated
was 72
o
C and the lowest temperature was 4
o
C.
It can be seen from Table 14 that the effect of temperature on SPME
extraction of the ten compounds is complicated. For some compounds such as
amines, the extraction recovery increases slowly with temperature. This result
suggests that the diffusion of those compounds dominates the extraction. For
other compounds the extraction recovery initially increased with temperature, but
later decreased with temperature. The maximum efficiency was obtained at 25
o
C
in most cases, but 15
o
C for decanoic acid; 52
o
C for anthracene; 40
o
C for
tetradecanol and 52
o
C for tetradecylamine. Apparently, at low temperature the
rate limiting parameter is diffusion of analytes in the sample solution and the
polymer coating. At higher temperatures, diffusion will be enhanced. However, at
same time, the distribution coefficient will decrease. Above a certain temperature,
diffusion of the analytes in the solution and coating are relatively fast while at the
same time the distribution coefficient is low. Now the solubility of the compounds
in the fiber becomes the rate limiting parameter. Solute molecules diffusing to the
fiber surface can no longer be absorbed because of a less favorable distribution
coefficient.
In PA coating (Table 15), the amount absorbed increases with the
increase of the solution temperature. This indicates that a 20 min absorption is

90
not enough for equilibrium. Increasing the solution temperature speeds up the
diffusion of the compounds, so more sample can be absorbed to the coating at a
constant absorption time. As described by Ai
(119)
, some compounds (e.g. 2, 4-
dimethyl phenol) did not reach equilibrium after one hour absorption with
magnetic stirring in a PA coating. In this case, increasing solution temperature
can increase the amount absorbed and increase the sensitivity.
Carbowax coating shows the similar trend as PDMS coating except for the
low absorption efficiency for ten carbon compounds (Table 16).
5.4 Conclusion
In summary, the PDMS coating is the most selective for volatile nonpolar
compounds; polyacrylate is good for polar compounds and Carbowax shows a
slight but better selectivity for short chain amines than the other two fibers. Matrix
pH has a significant effect on the absorption of weak acids and bases on SPME
coatings. By suppressing the ionization of acids and bases, the sensitivity of the
SPME technique can be greatly increased. For some compounds, diffusion in the
sample solution and the fiber coating is slow. Especially for polyacrylate coating,
a twenty minute extraction time is not adequate for the investigated compounds
at room temperature. In some cases, by increasing the temperature of the
solution, the extraction speed and efficiency can be increased.

91
Table 14 Temperature effect on PDMS absorption*
(n=3)
Temperature
(
o
C)
Decane
Naphthalene Decanol
Decanoic
acid
Decylamine
4
11
200
230
30
0
15
170
280
420
42
1
25
220
310
440
36
0
40
200
160
440
19
4
52
160
140
330
12
4
72
110
140
250
10
4
Temperature
(
o
C)
Tetradecane Anthracene Tetra-
decanol
Tetra-
decanoic
acid
Tetradecyl
amine
4
170
290
310
180
330
15
370
430
570
250
580
25
380
610
640
450
630
40
370
610
800
440
660
52
180
670
700
430
890
72
100
490
560
380
820
*Represented by amount absorbed (ng)

92
Table 15 Temperature effect on PA absorption*
(n=3)
Temperature
(
o
C)
Decane
Naphthalene Decanol
Decanoic
acid
Decylamine
4
6
160
170
63
0
15
19
280
370
200
0
25
21
280
460
550
1
40
24
290
640
320
1
52
96
290
680
220
1
72
85
340
710
170
1
Temperature
(
o
C)
Tetradecane Anthracene Tetradeca-
nol
Tetra-
decanoic
acid
Tetradecyl
amine
4
86
300
290
260
260
15
190
520
560
390
560
25
260
710
760
870
370
40
270
930
760
950
300
52
330
960
890
990
270
72
383
1054
1100
1000
260
*Represented by amount absorbed (ng)

93
Table 16 Temperature effect on Carbowax absorption*
(n=3)
Temperature
(
o
C)
Decane
Naphthalene Dodecanol
Decanoic
acid
Decylamine
4
1
45
32
33
1
15
13
42
33
30
4
25
17
66
55
30
7
40
22
84
84
33
8
52
29
86
80
32
13
72
32
81
54
24
13
Temperature
(
o
C)
Tetradecane Anthracene Tetra-
decanol
Tetra-
decanoic
acid
Tetradecyl
amine
4
27
230
140
220
39
15
48
270
120
340
56
25
59
590
290
450
160
40
70
720
320
500
360
52
76
960
410
880
870
72
88
940
360
880
810
*Represented by amount absorbed (ng)

94
CHAPTER VI
GENERAL CONCLUSIONS
The application of SPME for trace organic analysis has experienced
exciting developments during the past 5 years and the interest continues to grow.
Compared to conventional extraction methods, SPME has many advantages,
such as minimized usage of toxic organic solvents, high concentrating efficiency,
no transfer of organic solvents to chromatographic systems, low cost and the
ability for easy on-line combination with GC.
The extension of SPME to solid samples by combining SPME and MAE
has been demonstrated for the first time in this work. The parameters (salt
content, pH, and extraction time) which affect extraction efficiency, have to be
optimized. Both the temperature of the GC inlet, injection mode (split or splitless)
affect the desorption and the transfer of the compounds from fiber to the GC
column. Veltol
and Veltol Plus
from food products were successfully analyzed
by MAE/SPME and the detection limit was decreased 200 fold compared to
conventional solvent extraction for Veltol Plus
.
Headspace analysis is an excellent GC technique for volatile compounds
and can be used for “dirty” matrices (both liquids and solids). The technique is
characterized by simple sample preparation, and analytes can be transferred
directly to a GC. The limitations of the technique are: (1) not suitable for polar
compounds because of adsorption on the long transfer line; and (2) low
sensitivity for semivolatiles because of their low vapor pressure. Short chain fatty
acids are typical examples for samples with high polarity and low volatility. Trace
levels of these acids in foods and agricultural products usually affect the taste
and odor of these products. The method developed in this work (on-line silylation
followed headspace GC/MS analysis) reduces the tedious sample preparation
procedures, such as derivatization, separation and concentration for trace
analysis. Since all the sample processing occurs in an enclosed vial, sample loss

95
is minimized. All the fatty acid trimethyl esters have a base ion at 75 amu which
makes the detection by GC/MS both simple and sensitive. Low ppb levels of
formic to octanoic acids were obtained in this work.
The selectivity and capacity of the fiber coating used in SPME are
important in matching fibers with analyte type. Poly(dimethylsiloxane) is a good
fiber coating for non-polar and semipolar volatile compounds. It also shows
selectivity for different chain lengths. It is not good, however, for short chain acids
or amines. The Polyacrylate coating shows high affinity for semipolar and polar
compounds, but low affinity for decane and short chain amines. Polyacrylate
would be good for decanol, decanoic acid, anthracene, tetradecanol and
tetradecanoic acid. Carbowax does not show good selectivity for any short chain
compounds, but does show a good recovery for long chain alcohols and acids.
The sample pH has a significant effect on both acid and amine recoveries.
By adjusting the pH to suppress ionization, the sensitivity can be increased as
the analytes partition better into the hydrophobic fiber. Solution temperature
affects both the distribution coefficient into the fiber and the diffusion coefficient
of the analytes in solution. At low temperatures, the dominating factor is the
molecular diffusion. At a constant extraction time, low temperature results in a
low recovery. At higher temperatures, the distribution coefficient of the
compounds between the fiber coating and the sample solution dominates the
SPME recovery. At even higher temperatures, the distribution coefficient is small
which results in a low recovery. For real samples, the chosen solution
temperature is a compromise between the diffusion coefficient and the
distribution coefficient.

96
LITERATURE CITED
Abstract
1 Wang, Y., Khaled, M., Bonilla, M. and McNair, H. M., J. High Resol.
Chromatogr. , 20, 213 (1997).
2 Wang, Y., Khaled, M. and McNair, H. M., 34
th
Eastern Analytical
Symposium and Exhibition, Sommerset, NJ, Nov. 12-17, 1995.
3 Wang, Y., Khaled, M., Bonilla, M. and McNair, H. M., 18
th
International
Symposium on Capillary Chromatography, Riva del Garda, Italy, May 20-
24, 1996.
4 Wang, Y., Khaled, M. and McNair, H. M., 35
th
Eastern Analytical
Symposium and Exhibition, Sommerset, NJ, Nov. 17-22, 1996.
5 Wang, Y., Khaled, M. and McNair, H. M, The Pittsburgh Conference,
Atlanta, Georgia, March 16-21, 1996.
6 Wang, Y., Khaled, M. and McNair, H. M., 19
th
International Symposium on
Capillary Chromatography, Wintergreen, VA, May 18-22, 1997.
7
Wang, Y. and McNair, M. H., submitted to The Pittsburgh Conference
New Orleans, Louisiana, March 1-6, 1998.
Chapter II
8
Arthur, C.L., and . Pawliszyn, J. Anal. Chem., 62, 2145 (1990).
9
Arthur,C. L., Killam, M., . Motlagh, S., Lim, M., Potter, D. W. and
Pawliszyn, J., Environ. Sci. Technol. 26, 979 (1992).
10
Arthur, C. L., Potter, D. W., . Buchholz, K. D., Motlagh, S. and Pawliszyn,
J., LC-GC, 10, 656 (1992).
11
Arthur, C.L., Pawliszyn, J., Anal. Chem., 62, 2145 (1990).
12
Louch, D., Motlagh, S., Pawliszyn, J. Anal. Chem., 64, 1187 (1992).
13
Arthur, C. L., Killam, L., Motlagh, S., Lim, M, Potter, D., Pawliszyn, J. J.
Environ. Sci. Technol., 26, 979 (1992).
14
Hawthorne, S., Miller, D. J., Pawliszyn, J., Arthur, C. L., J. Chromatogr.,
603, 185 (1992).

97
15
Arthur, C. L., Killam, L. M., Buchholtz, K. D., Pawliszyn, J., Burg, J. R.,
Anal. Chem., 64, 1960 (1992).
16
Potter, D. W., Pawliszyn, J., J. Chromatogr., 625, 247 (1992).
17
Arthur, C. L., Potter, D. W., Buchholz, K. D., Motlagh, S., Pawliszyn, J. LC-
GC, 10, 656 (1992).
18
Hassan, A. A. M., Benfenati, E., Facchini, G. and Fanelli, R., Toxicol.
Environ. Chem., 55, 73 (1996).
19
Huang, S., Yi Ting, C, Lin, C., J. Chromatogr., 769, 239 (1997).
20
Huang, S., Cheng, C., Sung, Y., Anal. Chim. Acta, 343, 101 (1997).
21
Valor, I., Molto, J.C., Apraiz, D., Font, G., J. Chromatogr., A, 767, 195
(1997).
22
Saraullo, A, Martos, P. A., Pawliszyn, J., Anal. Chem., 69, 1992 (1997).
23
Lakso, H., Ng, W.F., Anal. Chem., 69, 1866 (1997).
24
Wittkamp, B.L., Hawthorne, S. B., Tilotta, D.C., Anal. Chem., 69, 1197
(1997).
25
Sng, M.T., Lee, F.K., Laks, H.A., J. Chromatogr., A, 759, 225 (1997).
26
Johansen, S. S., Pawliszyn, J., J. High Resolut. Chromatogr., 19, 627
(1996).
27
Valor, I., Cortada, C., Molto, J. C., J. High Resolut. Chromatogr., 19, 472
(1996).
28
Santos, F.J., Galceran, M.T., Fraisse, D., J. Chromatogr., A, 742, 181
(1996).
29
Choudhury, T. K., Gerhardt, K. O., Mawhinney, T. P., Environ. Sci.
Technol., 30, 3259 (1996).
30
Boyd-Boland, A. A., Magdic, S., Pawliszyn, J., Analyst, 121, 929 (1996).
31
Young, R., Lopez-Avila, V., Beckert, W. F., J. High Resolut. Chromatogr.,
19, 247 (1996).
32
Eisert, R., Levsen, K., J. Chromatogr., A, 733, 143 (1996).

98
33
Nilsson, T., Pelusio, F., Montanarella, L., Larsen, B., Facchetti, S.,
Madsen, J. O., J. High Resolut. Chromatogr., 18, 617 (1995).
34
Langenfeld, J. J., Hawthorne, S. B., Miller, D. J., Anal. Chem., 68, 144
(1996).
35
Wittkamp, b. L., Tilotta, D. C., Anal. Chem., 67, 600 (1995).
36
Sarna, L. P., Webster, G. R. B., Friesen-Fisher, M. R., Ranjan, R. S., J.
Chromatogr., A, 677, 201 (1994).
37 Potter, D. W. And Pawliszyn, J., Environ. Sci. Technol.28, 298 (1994).
38 Zhang, Z. and Pawliszyn, J., Anal. Chem., 65, 1843 (1993).
39 Bovijn, L., Pirotte, J. And Berger, A., in Desty, D. H. (editor), Gas
Chromatography 1958 (Amsterdam Symposium), Butterworths, London,
1958; p 310-320.
40 Stahl, W. H., Voelker, W. A., and Sullivan, J. H., Food Technol., 14, 14
(1960).
41
Vitenberg, A. G., Novikaite, N.V., Kostkina, M.I., Chromatographia, 35,
661 (1993).
42
Seto, Y., Tsunoda, N., Ohta, H., Shinohara, T., Anal. Chim. Acta, 276, 247
(1993).
43
Leblanc., Y., Gilbert, R., Duval, M., Hubert, J., J. Chromatogr., 633, 185
(1993).
44
Zhang, A. Q., Mitchell, S. C., Ayesh, R., Smith, R. L., J. Chromatogr.,
Biomed. Appl., 584, 141 (1992).
45
Rizzolo, A., Polesello, A., Polesello, S., J. High Resolut. Chromatogr., 15,
472 (1992).
46
Gangrade, N., Price, J. C., J. Pharm. Sci., 81, 201 (1992).
47
Barcarolo, R., Casson, P., Tutta, C., J. High Resolut. Chromatogr., 15,
307 (1992).
48 Pavlostathis, S. G., Mathavan, G. N., Environ. Technol., 13, 23 (1992).

99
49 Lansens, P., Casais Laino, C., Meuleman, C., Baeyens, W., J.
Chromatogr., 586, 329 (1991).
50
Kintz, P., Baccino, E., Tracqui, A., Mangin, O., Forensic Sci. Int., 82, 171
(1996).
51 Pinnel, V., Vandegans, J., J. High Resolut. Chromatogr., 19, 263 (1996).
52 Kolb, Bruno, LC-GC, 14, 44 (1996).
53
Jentzsch, D., Kruger, H., Lebrecht, G., Dencks, G. and Gut, J., Fresenius
Z. Anal. Chem., 236, 96 (1968).
54
Closta,W., Klemm, H., Pospisil, P., Riegger, R., Siess, G., and Kolb, B.,
Chromatogr. Newslt. 11, 13 (1983).
55
Ai, Jiu, Anal. Chem. 69, 3260 (1997).
56
Struppe, C., Schafer, B., Engewald, W., Chromatographia, 45, 138 (1997).
57
Gandini, N., Riguzzi, R., J. Agric. Food Chem. 45, 3092 (1997).
58
Schafer, B., Hennig, P., Engewald, W., J. High Resol. Chromatogr., 20,
217 (1997).
59
Nishikawa, M., Seno, H., Ishii, A., Suzuki, O., Kumazawa, T.,
Watanabe, K., and Hattori, H., J. Chromatogr. Sci. 35, 275 (1997).
60
Okeyo, P., Rentz, S. M., and Snow, N. H., J. High Resol. Chromatogr.,
20, 171 (1997).
61
Ishii, A.; Seno, H.; Kumazawa, T.; Watanabe, K.; Hattori, H.; Suzuki, O.
Chromatographia, 43, 331 (1996).
62
Furton, Kenneth G.; Almirall, Jose R.; Bruna, Juan C., J. Forensic Sci. 41,
12 (1996).
63
Field, J. A., Nickerson, G., James, D. D., and Heider, C., J. Agric. Food
Chem. 44, 1768 (1996).
64
Page, B. D., and Lacroix, G., J. Chromatogr. 648, 199 (1993).
65
Santos, F. J., Sarrion, M.N., Galceran, M.T., J. Chromatogr., 771, 181
(1997).
66
Centini, F., Masti, A., Comparini, I. Barni, Forensic Sci. Int., 83, 161(1996).

100
67
Fromberg, A., Nilsson, T., Larsen, B. R., J. Chromatogr., 746, 71(1996).
68
Nilsson, T., Larsen, T. O., Montanarella, L., Madsen, J. Oe. J. Microbiol.
Methods, 25, 245, (1996).
69
Steffen, A., Pawliszyn, J., J. Agric. Food Chem., 44, 2187, (1996).
70
Steffen, A., Pawliszyn, J. Anal. Commun., 33, 129 (1996).
71
Lee, X.-P., Kumazawa, T., Sato, K., Suzuki, O., Chromatographia, 42,
135, (1996).
72
Pelusio, Fabio, Nilsson, T., Montanarella, L., Tillo, R., Larsen, B.,
Facchetti, S., Madsen, J., J. Agric. Food Chem., 43, 2138 (1995).
73
MacGillivray, B., Pawlizyn, J., Fowlie, P., Sagara, C., J. Chromatogr. Sci.,
32, 317 (1994).
74
Zhang, Z., Pawlizyn, J. J. High Resolut. Chromatogr. 16, 689 (1993).
75
Page, B. D., Lacroix, G., J. Chromatogr., 648, 199 (1993).
76
Kolb, Bruno and Ettre, Leslie S., eds., Static Headspace-Gas
Chromatography. Theory and Practice, p. 31 Wiley-VCH, Inc., New York,
NY (1997).
77
Pare, J.R. Jocelyn and Belanger, Jacqueline M.R. , Trends in Analytical
Chemistry, 13, 176 (1994).
78
Ganzler, K., Salgo, A. And Valko, K., J. Chromatogr. 371, 299 (1986).
79
Ganzler, K., Szinai, I. And Salgo, A, J. Chromatogr. 520, 257 (1990).
CHAPTER III
80
Gunner, S.W., Haxd, B. and Sahasrabudhe, M., J. Assoc. Off. Anal.
Chem., 51, 959 (1968)
81
Fessenden, R. and Fessenden, J. (eds), “Organic Laboratory
Techniques”, Brooks/Cole Publishing, Monterey, CA, (1984).
82
Zhang, Z. and Pawliszyn, J., Anal. Chem., 65, 1843 (1993).
83
Internal Document. Not be published.

101
84
Pelusio, F., Nilsson, T., Montanarella, L., Tilio, R. , . Larsen, B.,
Facchetti, S. and Madsen, J., J. Agric. Food Chem., 43, 2138 (1995).
CHAPTER IV
85
Smith, E. R., Finley, W. J. and Leveille, A. G., J. Agric. Food Chem., 42,
432-434 (1994).
86
Leffingwell, J. C., Tob. Sci. 18, 55 (1974)
87
Mccalley, D.V., Thomas, C.W. and Leveson, L.L., Chromatographia 18,
309 (1984).
88
Burke, D.G. and Halpern,. B. Anal. Chem. 55, 822-26 (1983).
89
Moffat, C.F., McGill, A.S. and Anderson, R.S., J. High Resol.
Chromatogr. Chromatogr. Commun. 14, 322-26 (1991).
90
Mulligan, K.J., J. Microcolumn Separations 7, 567-73 (1995).
91
Sjow, C.A.R. and Bickling, M.K.L., Chromatographia, 21, 157-60 (1986).
92
Chauhan, J. and Darbre, A., J. Chromatogr. 240, 107-115 (1982).
93
Bahre, F. and Maier,. H.G., Fresenius J. Anal.Chem. 355, 190-93 (1996).
94
Kim, K., Zlatkis, A. E., Horning, C. and Middleditch, B.S., J. High Resol.
Chromatogr. Chromatogr. Commun., 10, 522-23 (1987).
95
Molnar-Perl, I. and Szakacs-Pinter, M., Chromatographia , 17, 493-96
(1986).
96
Stalling, D. L., Gehrke, C.W. and Zumwalt, R.W., Biochem. Biophys.
Res. Commun., 31, 616 (1968)
97
Blau, K. and Halket, J. Meds. , Handbook of Derivatives for
Chromatography (2nd ed.), John Wiley & Sons (1993).
98
Stansbridge, E.M., Mills, G. A., and Walker, V. , Journal of
Chromatography, 621, 7 (1993).
CHAPTER V
99
Pan, L., Chong, J. M., Pawliszyn, J., J. Chromatogr., A, 773, 249 (1997).
100
Martos, P. A., Pawliszyn, J., Anal. Chem., 69, 206 (1997).

102
101
Robacker, D. C., Bartelt, R. J., J. Agric. Food Chem., 44, 3554 (1996).
102
Czerwinski, J., Zygmunt, B., Namiesnik, J., Fresenius Environ. Bull., 5, 55
(1996).
103
Santos, F. J., Sarrion, M. N., Galceran, M. T., J. Chromatogr., 771, 181
(1997).
104
James, K. J., Stack, M. A., J. High Resolut. Chromatogr., 19, 515, (1996).
105
Fromberg, A., Nilsson, T., Larsen, B. R., J. Chromatogr., 746, 71 (1996).
106
Chiarotti, M., Strano-Rossi, S., Marsili, R., J. Microcolumn Sep., 9, 249
(1997).
107
Nishikawa, M., Seno, H., Ishii, A., Suzuki, O., Kumazawa, T., Watanabe,
K. and Hattori, H., J. Chromatogr. Sci., 35, 275 (1997).
108
Okeyo, P., Rentz, S. M. and Snow, N. H., J. High Resolut. Chromatogr.,
20, 171 (1997).
109
Penton, Z., J. –Can. Soc. Forensic Sci., 30, 7 (1997).
110
Seno, H., Kumazawa, T., Ishii, A., Watanabe, K., Hattori, H. and Suzuki,
O., Jpn. J. Forensic Toxicol., 15, 16 (1997).
111
Centini, F., Masti, A., Comparni, I. B., Forensic Sci. Int., 83, 161 (1996).
112
Gandini, N. and Riguzzi, R., J. Agric. Food Chem., 45, 3092 (1997).
113
Fischer, C. Fischer, U., J. Agric. Food Chem., 45, 1995 (1997).
114
Harmon, A. D., Food Sci. Technol. (N.Y.) 79, 81 (1997).
115
Steffen, A. and Pawliszyn, J., J. Agric. Food Chem., 44, 2187 (1996).
116
Ferreira, V., Sharman, M, Cacho, J. F. and Dennis, J., J. Chromatogr.,
731, 247 (1996).
117
Ng, L., Hupe, M., Harnois, J. and Moccia, D., J. Sci. Food Agric. 70, 380
(1996).
118
Yang, X. and Peppard, T., J. Agric. Food Chem., 42, 1925 (1994).
119
Ai, Jiu, Anal. Chem., 69, 1230 (1997).

103
120
Karen D. Buchhoiz and Janusz Pawliszyn, Anal. Chem., 66, 160 (1994).
121
Lide, R.D, Editor-in-Chief, Handbook of Chemistry and Physics (75
th
edition), CRC Press, Inc., Cleveland, Ohio, 1994

104
VITA
Yuwen Wang was born in Hebei Province, China. He received his Masters
degree in 1985 in Chemistry from Hebei University in Baoding, China. He has
worked for Hebei Academy of Sciences as Assistant, and then Associate
Research Fellow since his graduations. He entered the graduate program at
Virginia Polytechnic Institute and State University in August, 1993 and studied
Chemistry under the direction of Professor Harold M. McNair.
Wyszukiwarka
Podobne podstrony:
Confirmation of volatiles by SPME and GC MS in the investiga
Determination of acrolein by HS SPME and GC MS
Analysis of chlorobenzenes in soils by HS SPME and GC MS
Analysis of virgin olive oil VOC by HS SPME coupled to GC MS
Sampling and sample preparation strategies
alergeny w perfumach GC MS
Preparing for Death and Helping the Dying Sangye Khadro
USŁUGI, World exports of commercial services by region and selected economy, 1994-04
Summary of an artice 'What is meant by style and stylistics'
Crusades seen by Byzantium and Islam
Analiza GC MS 1,2,3 trimethoxypropane i?ME
GC MS Analysis
Awakened Imagination the Search by Neville and Neville Goddard (2)
Analiza GC MS 1,2,3 trimethoxypropane
final nasz by patricko and arri
09 Sample Excerpt from Checklist and Audit Guide Rev 1 1 03
Analiza GC i GC MS eterów z biopaliw
ENHANCEMENT OF HIV 1 REPLICATION BY OPIATES AND COCAINE THE CYTOKINE CONNECIOION
alergeny w perfumach GC MS
więcej podobnych podstron