
1
How to Win the Stock Market Game
Developing Short-Term Stock Trading Strategies
by Vladimir Daragan
PART 1
Table of Contents
1. Introduction
2. Comparison of trading strategies
3. Return per trade
4. Average return per trade
5. More about average return
6. Growth coefficient
7. Distribution of returns
8. Risk of trading
9. More about risk of trading
10. Correlation coefficient
11. Efficient trading portfolio
Introduction
This publication is for short-term traders, i.e. for traders who hold stocks for one to eight
days. Short-term trading assumes buying and selling stocks often. After two to four months a
trader will have good statistics and he or she can start an analysis of trading results. What are
the main questions, which should be answered from this analysis?
- Is my trading strategy profitable?
- Is my trading strategy safe?
- How can I increase the profitability of my strategy and decrease the risk of trading?
No doubt it is better to ask these questions before using any trading strategy. We will
consider methods of estimating profitability and risk of trading strategies, optimally dividing
trading capital, using stop and limit orders and many other problems related to stock trading.
Comparison of Trading Strategies
Consider two hypothetical trading strategies. Suppose you use half of your trading
capital to buy stocks selected by your secret system and sell them on the next day. The other
half of your capital you use to sell short some specific stocks and close positions on the next
day.
2
In the course of one month you make 20 trades using the first method (let us call it
strategy #1) and 20 trades using the second method (strategy #2). You decide to analyze your
trading results and make a table, which shows the returns (in %) for every trade you made.
#
Return per trade in %
Strategy 1
Return per trade in %
Strategy 2
1
2
3
4
5
6
7
8
9
10
11
12
13
14
15
16
17
18
19
20
+3
+2
+3
-5
+6
+8
-9
+5
+6
+9
+1
-5
-2
+0
-3
+4
+7
+2
-4
+3
+4
-5
+6
+9
-16
+15
+4
-19
+14
+2
+9
-10
+8
+15
-16
+8
-9
+8
+16
-5
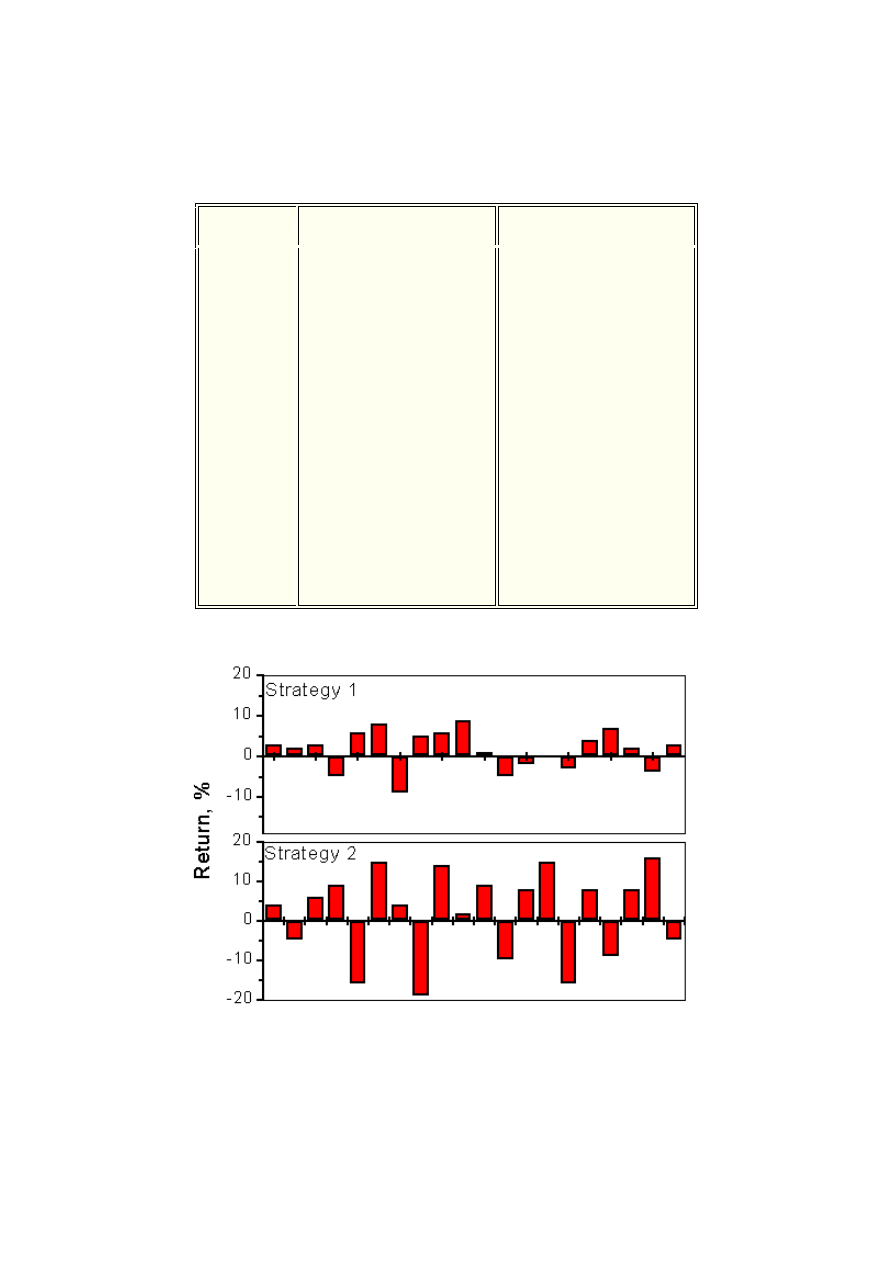
The next figure graphically presents the results of trading for these strategies.
Returns per trades for two hypothetical trading strategies
Which strategy is better and how can the trading capital be divided between these
strategies in order to obtain the maximal profit with minimal risk? These are typical trader's
questions and we will outline methods of solving them and similar problems.

3
The first thing you would probably do is calculate of the average return per trade.
Adding up the numbers from the columns and dividing the results by 20 (the number of trades)
you obtain the average returns per trade for these strategies
Rav1 = 1.55%
Rav2 = 1.9%
Does this mean that the second strategy is better? No, it does not! The answer is clear
if you calculate the total return for this time period. A definition of the total return for any given
time period is very simple. If your starting capital is equal to C0 and after some period of time
it becomes C1 then the total return for this period is equal to
Total Return = (C1 - C0)/C0 * 100%
Surprisingly, you can discover that the total returns for the described results are equal
to
Total Return1 = 33%
Total Return2 = 29.3%
What happened? The average return per trade for the first strategy is smaller but the
total return is larger! Many questions immediately arise after this "analysis":
- Can we use the average return per trade to characterize a trading strategy?
- Should we switch to the first strategy?
- How should we divide the trading capital between these strategies?
- How should we use these strategies to obtain the maximum profit with minimal risk?
To answer these questions let us introduce some basic definitions of trading statistics
and then outline the solution to these problems.
Return per Trade
Suppose you bought N shares of a stock at the price P0 and sold them at the price P1.
Brokerage commissions are equal to COM. When you buy, you paid a cost price
Cost = P0*N + COM
When you sell you receive a sale price
Sale = P1*N - COM
Your return R for the trade (in %) is equal to
R = (Sale - Cost)/Cost *100%
Average Return per Trade
Suppose you made n trades with returns R1, R2, R3, ..., Rn. One can define an
average return per trade Rav
Rav = (R1 + R2 + R3 + ... + Rn) / n

4
This calculations can be easily performed using any spreadsheet such as MS Excel,
Origin, ... .
More about average return
You can easily check that the described definition of the average return is not perfect.
Let us consider a simple case.
Suppose you made two trades. In the first trade you have gained 50% and in the second
trade you have lost 50%. Using described definition you can find that the average return is
equal to zero. In practice you have lost 25%! Let us consider this contradiction in details.
Suppose your starting capital is equal to $100. After the first trade you made 50% and
your capital became
$100 * 1.5 = $150
After the second trade when you lost 50% your capital became
$150 * 0.5 = $75
So you have lost $25, which is equal to -25%. It seems that the average return is equal
to -25%, not 0%.
This contradiction reflects the fact that you used all your money for every trade. If after
the first trade you had withdrawn $50 (your profit) and used $100 (not $150) for the second
trade you would have lost $50 (not $75) and the average return would have been zero.
In the case when you start trading with a loss ($50) and you add $50 to your trading
account and you gain 50% in the second trade the average return will be equal to zero. To use
this trading method you should have some cash reserve so as to an spend equal amount of
money in every trade to buy stocks. It is a good idea to use a part of your margin for this
reserve.
However, very few traders use this system for trading. What can we do when a trader
uses all his trading capital to buy stocks every day? How can we estimate the average return
per trade?
In this case one needs to consider the concept of growth coefficients.
Growth Coefficient
Suppose a trader made n trades. For trade #1
K1 =
Sale1 / Cost1
where Sale1 and Cost1 represent the sale and cost of trade #1. This ratio we call the growth
coefficient. If the growth coefficient is larger than one you are a winner. If the growth
coefficient is less than one you are a loser in the given trade.
If K1, K2, ... are the growth coefficients for trade #1, trade #2, ... then the total
growth coefficient can be written as a product
K = K1*K2*K3*...
In our previous example the growth coefficient for the first trade K1 = 1.5 and for the
second trade K2 = 0.5. The total growth coefficient, which reflects the change of your trading
capital is equal to
K = 1.5 * 0.5 = 0.75

5
which correctly corresponds to the real change of the trading capital. For n trades you can
calculate the average growth coefficient Kav per trade as
Kav = (K1*K2*K3*...) ^ (1/n)
These calculations can be easily performed by using any scientific calculator. The total
growth coefficient for n trades can be calculated as
K = Kav ^ n
In our example Kav = (1.5 * 0.5) ^ 1/2 = 0.866, which is less than 1. It is easily to
check that
0.866 ^ 2 = 0.866*0.866 = 0.75
However, the average returns per trade Rav can be used to characterize the trading
strategies. Why? Because for small profits and losses the results of using the growth
coefficients and the average returns are close to each other. As an example let us consider a
set of trades with returns
R1 = -5%
R2 = +7%
R3 = -1%
R4 = +2%
R5 = -3%
R6 = +5%
R7 = +0%
R8 = +2%
R9 = -10%
R10 = +11%
R11 = -2%
R12 = 5%
R13 = +3%
R14 = -1%
R15 = 2%
The average return is equal to
Rav = (-5+7-1+2-3+5+0+2-10+11-2+5+3-1+2)/15 = +1%
The average growth coefficient is equal to
Kav=(0.95*1.07*0.99*1.02*0.97*1.05*1*1.02*0.9*1.11*0.98*1.05*1.03*0.99*1.02)^(1/15) = 1.009
which corresponds to 0.9%. This is very close to the calculated value of the average return =
1%. So, one can use the average return per trade if the return per trades are small.
Let us return to the analysis of two trading strategies described previously. Using the
definition of the average growth coefficient one can obtain that for these strategies
Kav1 = 1.014
Kav2 = 1.013
So, the average growth coefficient is less for the second strategy and this is the reason
why the total return using this strategy is less.
6
Distribution of returns
If the number of trades is large it is a good idea to analyze the trading performance by
using a histogram. Histogram (or bar diagram) shows the number of trades falling in a given
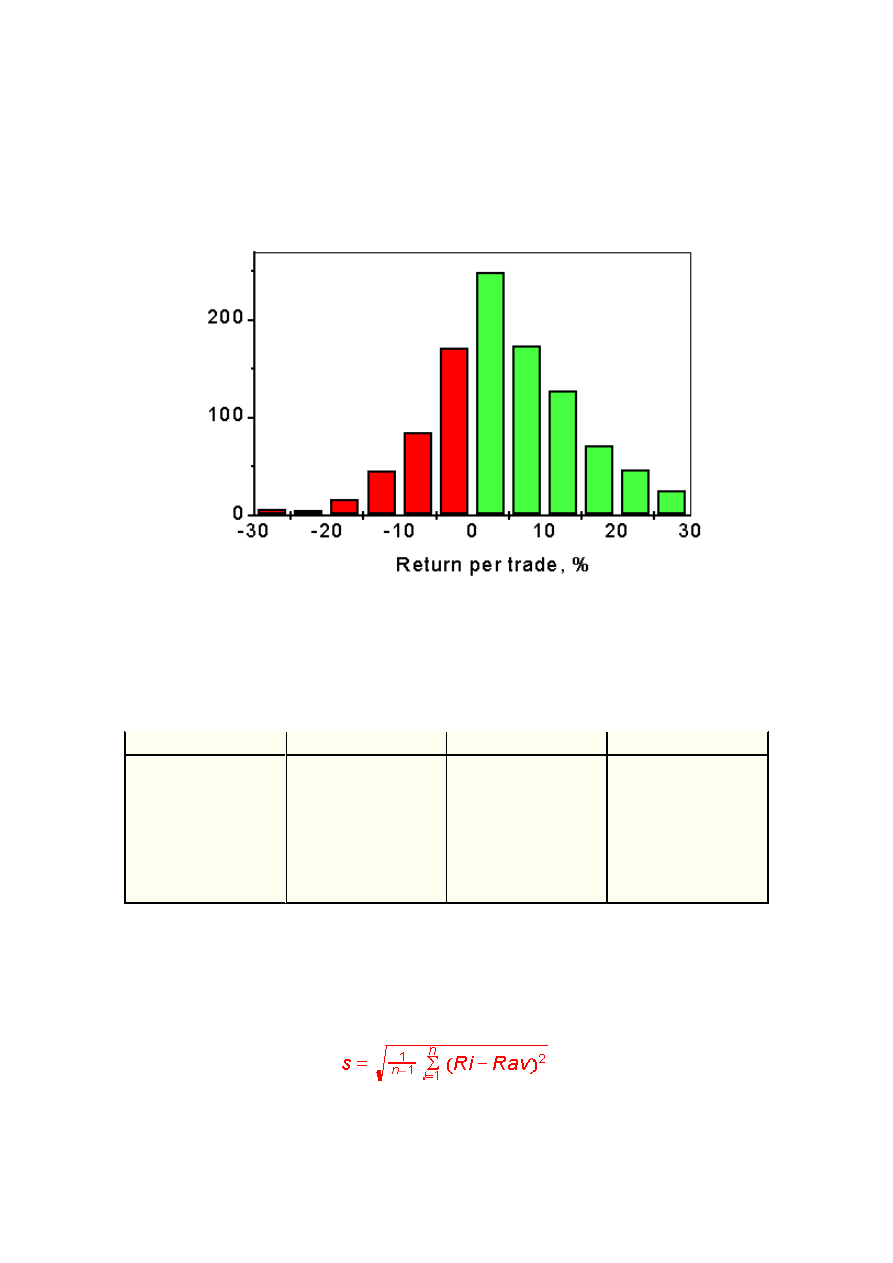
interval of returns. A histogram for returns per trade for one of our trading strategies is shown
in the next figure
Histogram of returns per trades for the Low Risk Trading Strategy
As an example, we have considered distribution of returns for our Low Risk Trading
Strategy (see more details in http://www.stta-consulting.com) from January 1996 to April
2000. The bars represent the number of trades for given interval of returns. The largest bar
represents the number of trades with returns between 0 and 5%. Other numbers are shown in
the Table.
Return Range, %
Number of Stocks
Return Range, %
Number of Stocks
0 < R< 5
5 < R< 10
10 < R< 15
15 < R< 20
20 < R< 25
25 < R< 30
30 < R< 35
35 < R< 40
249
174
127
72
47
25
17
4
-5 < R< 0
-10 < R< -5
-15 < R< -10
-20 < R< -15
-25 < R< -20
-30 < R< -25
-35 < R< -30
-40 < R< -35
171
85
46
17
5
6
1
3
For this distribution
the average return per trade is 4.76%.
The width of histogram is
related to a very important statistical characteristic: the standard deviation or risk.
Risk of trading
To calculate the standard deviation one can use the equation
7
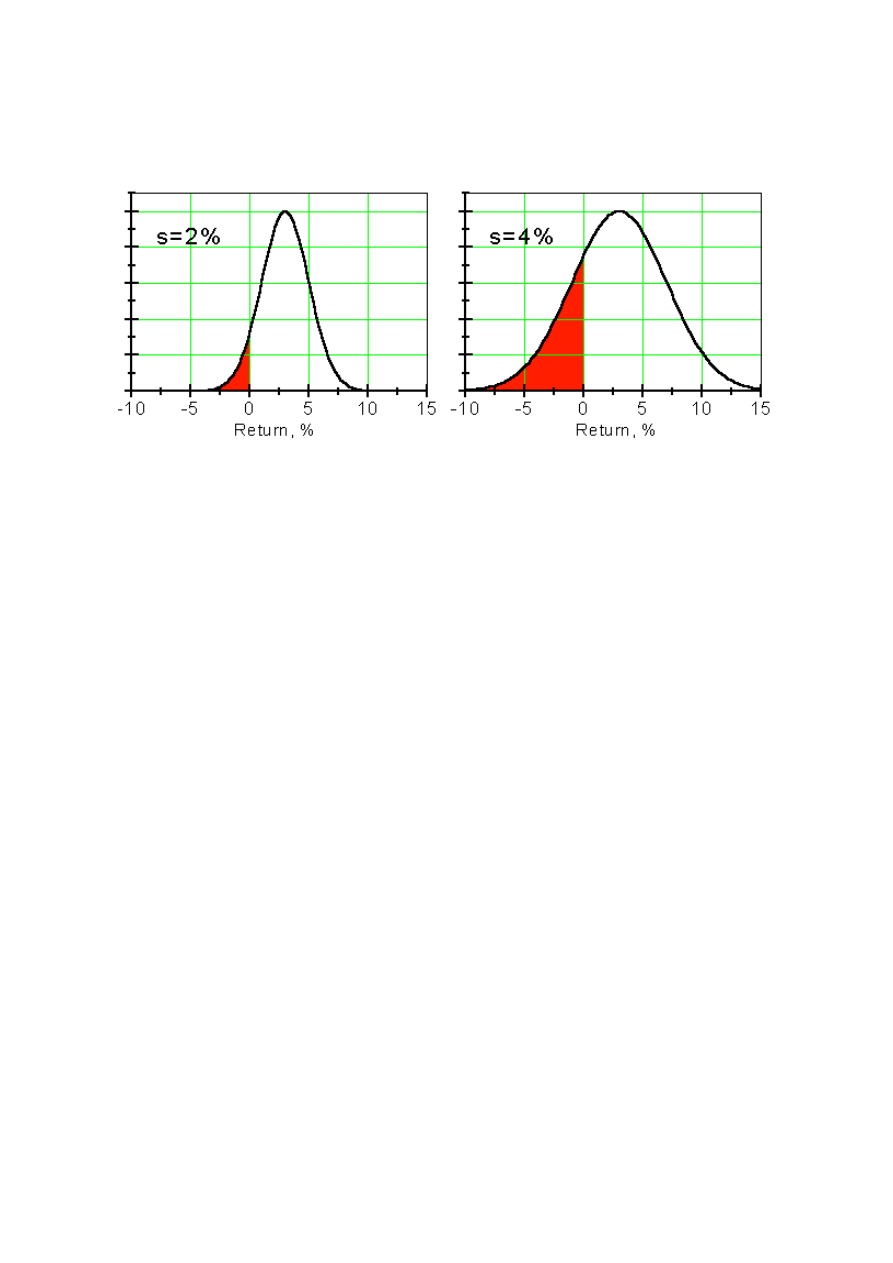
The larger the standard deviation, the wider the distribution of returns. A wider
distribution increases the probability of negative returns, as shown in the next figure.
Distributions of returns per trade for Rav = 3% and for different standard deviations
Therefore, one can conclude that a wider distribution is related to a higher risk of
trading. This is why the standard distribution of returns is called the risk of trading. One can
also say that risk is a characteristic of volatility of returns.
An important characteristic of any trading strategy is
Risk-to-Return Ratio = s/Rav
The smaller the risk-to-return ratio, the better the trading strategy. If this ratio is less
than 3 one can say that a trading strategy is very good. We would avoid any trading strategy
for which the risk-to-return ration is larger than 5. For distribution in Fig. 1.2 the risk-to-return
ratio is equal to 2.6, which indicates low level of risk for the considered strategy.
Returning back to our hypothetical trading strategies one can estimate the risk to return
ratios for these strategies. For the first strategy this ratio is equal to 3.2. For the second
strategy it is equal to 5.9. It is clear that the second strategy is extremely risky, and the
portion of trading capital for using this strategy should be very small.
How small? This question will be answered when we will consider the theory of trading
portfolio.
More about risk of trading
The definition of risk introduced in the previous section is the simplest possible. It was
based on using the average return per trade. This method is straightforward and for many
cases it is sufficient for comparing different trading strategies.
However, we have mentioned that this method can give false results if returns per trade
have a high volatility (risk). One can easily see that the larger the risk, the larger the difference
between estimated total returns using average returns per trade or the average growth
coefficients. Therefore, for highly volatile trading strategies one should use the growth
coefficients K.
Using the growth coefficients is simple when traders buy and sell stocks every day.
Some strategies assume specific stock selections and there are many days when traders wait
for opportunities by just watching the market. The number of stocks that should be bought is
not constant.
8
In this case comparison of the average returns per trade contains very little information
because the number of trades for the strategies is different and the annual returns will be also
different even for equal average returns per trade.
One of the solutions to this problem is considering returns for a longer period of time.
One month, for example. The only disadvantage of this method is the longer period of time
required to collect good statistics.
Another problem is defining the risk when using the growth coefficients. Mathematical
calculation become very complicated and it is beyond the topic of this publication. If you feel
strong in math you can write us (service@stta-consulting.com) and we will recommend you
some reading about this topic. Here, we will use a tried and true definition of risk via standard
deviations of returns per trade in %. In most cases this approach is sufficient for comparing
trading strategies. If we feel that some calculations require the growth coefficients we will use
them and we will insert some comments about estimation of risk.
The main goal of this section to remind you that using average return per trade can
slightly overestimate the total returns and this overestimation is larger for more volatile trading
strategies.
Correlation Coefficient
Before starting a description of how to build an efficient trading portfolio we need to
introduce a new parameter: correlation coefficient. Let us start with a simple example.
Suppose you trade stocks using the following strategy. You buy stocks every week on
Monday using your secret selection system and sell them on Friday. During a week the stock
market (SP 500 Index) can go up or down. After 3 month of trading you find that your result
are strongly correlated with the market performance. You have excellent returns for week when
the market is up and you are a loser when market goes down. You decide to describe this
correlation mathematically. How to do this?
You need to place your weekly returns in a spreadsheet together with the change of SP
500 during this week. You can get something like this:
Weekly Return, %
Change of SP 500, %
13
1
-5
-3
16
1
4
3.2
20
5
21
5.6
-9
-3
-8
-1.2
2
-1
8
6
7
-2
26
3
9
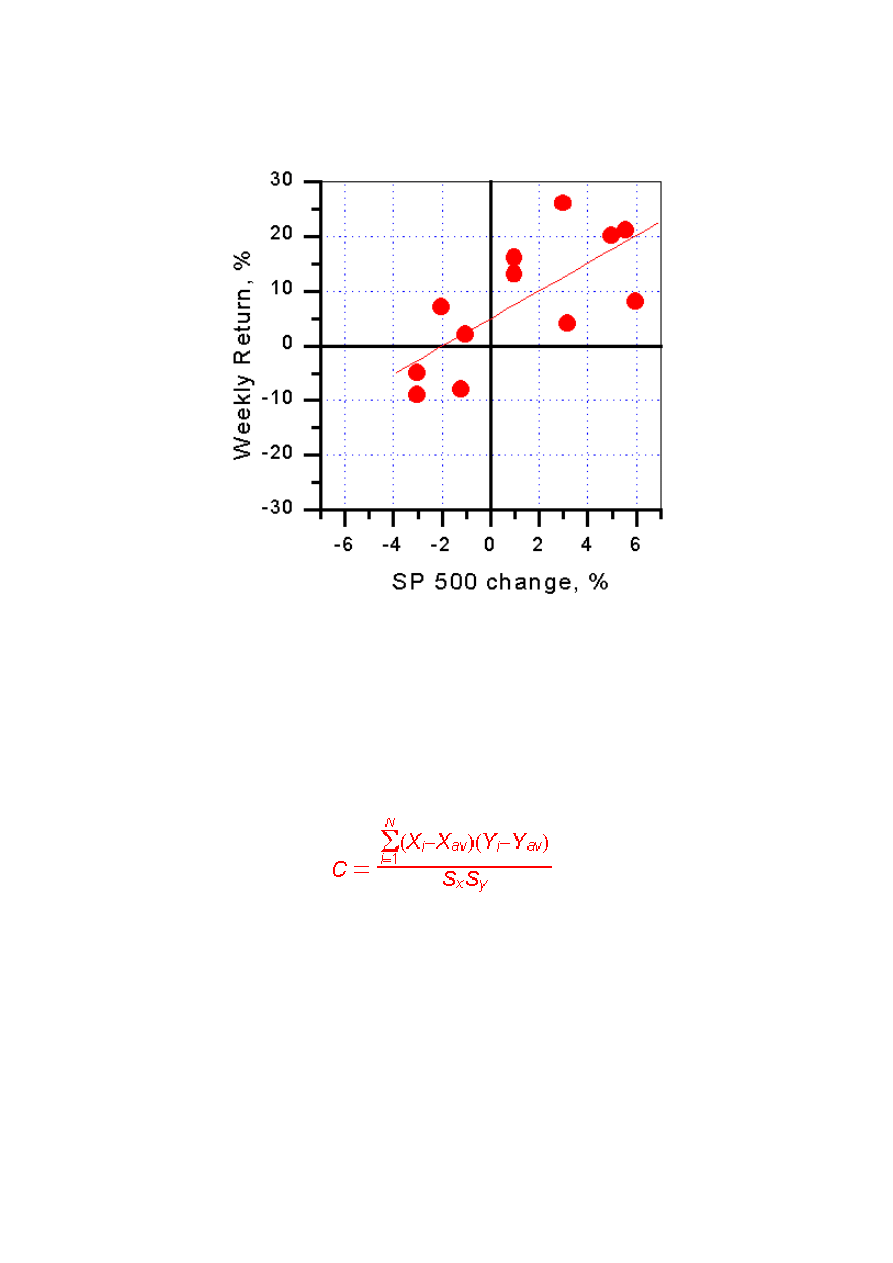
These data can be presented graphically.
Dependence of weekly returns on the SP 500 change for hypothetical strategy
Using any graphical program you can plot the dependence of weekly returns on the SP
500 change and using a linear fitting program draw the fitting line as in shown in Figure. The
correlation coefficient c is the parameter for quantitative description of deviations of data points
from the fitting line. The range of change of c is from -1 to +1. The larger the scattering of the
points about the fitting curve the smaller the correlation coefficient.
The correlation coefficient is positive when positive change of some parameter (SP 500
change in our example) corresponds to positive change of the other parameter (weekly returns
in our case).
The equation for calculating the correlation coefficient can be written as
where X and Y are some random variable (returns as an example); S are the standard
deviations of the corresponding set of returns; N is the number of points in the data set.
For our example the correlation coefficient is equal to 0.71. This correlation is very high.
Usually the correlation coefficients are falling in the range (-0.1, 0.2).
We have to note that to correctly calculate the correlation coefficients of trading returns
one needs to compare X and Y for the same period of time. If a trader buys and sells stocks
every day he can compare daily returns (calculated for the same days) for different strategies.
If a trader buys stocks and sells them in 2-3 days he can consider weekly or monthly returns.
Correlation coefficients are very important for the market analysis. Many stocks have
very high correlations. As an example let us present the correlation between one days price
changes of MSFT and INTC.
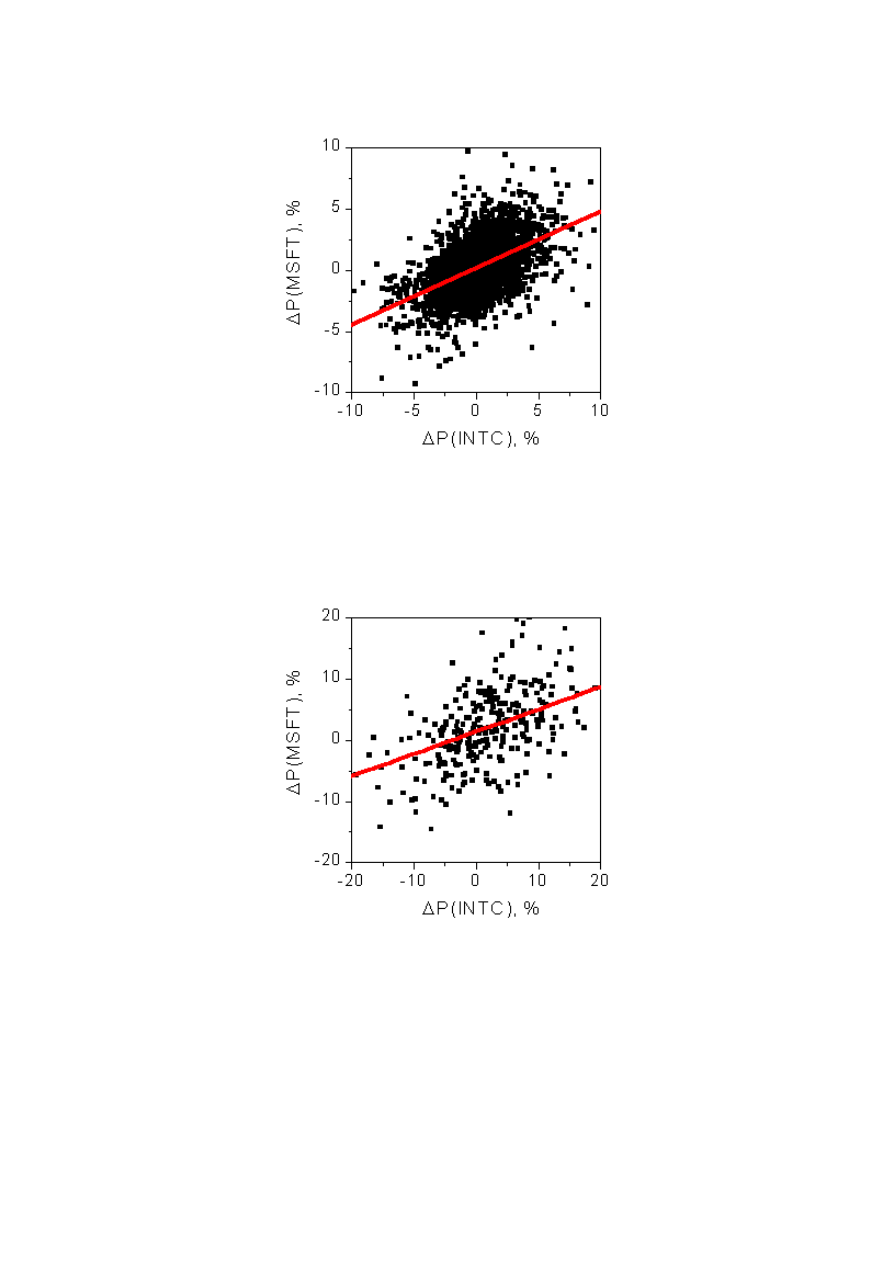
10
Correlation between one days price change of INTC and MSFT
The presented data are gathered from the 1988 to 1999 year period. The correlation
coefficient c = 0.361, which is very high for one day price change correlation. It reflects
simultaneous buying and selling these stocks by mutual fund traders.
Note that correlation depends on time frame. The next Figure shows the correlation
between ten days (two weeks) price changes of MSFT and INTC.
Correlation between ten day price change of INTC and MSFT
The ten day price change correlation is slightly weaker than the one day price change
correlation. The calculation correlation coefficient is equal to 0.327.
11
Efficient Trading Portfolio
The theory of efficient portfolio was developed by Harry Markowitz in 1952.
(H.M.Markowitz, "Portfolio Selection," Journal of Finance, 7, 77 - 91, 1952.) Markowitz
considered portfolio diversification and showed how an investor can reduce the risk of
investment by intelligently dividing investment capital.
Let us outline the main ideas of Markowitz's theory and tray to apply this theory to
trading portfolio. Consider a simple example. Suppose, you use two trading strategies. The
average daily returns of these strategies are equal to R1 and R2. The standard deviations of
these returns (risks) are s1 and s2. Let q1 and q2 be parts of your capital using these
strategies.
q1 + q2 = 1
Problem:
Find q1 and q2 to minimize risk of trading.
Solution:
Using the theory of probabilities one can show that the average daily return for this
portfolio is equal to
R = q1*R1 + q2*R2
The squared standard deviation (variance) of the average return can be calculated from
the equation
s
2
= (q1*s1)
2
+ (q2*s2)
2
+ 2*c*q1*s1*q2*s2
where c is the correlation coefficient for the returns R1 and R2.
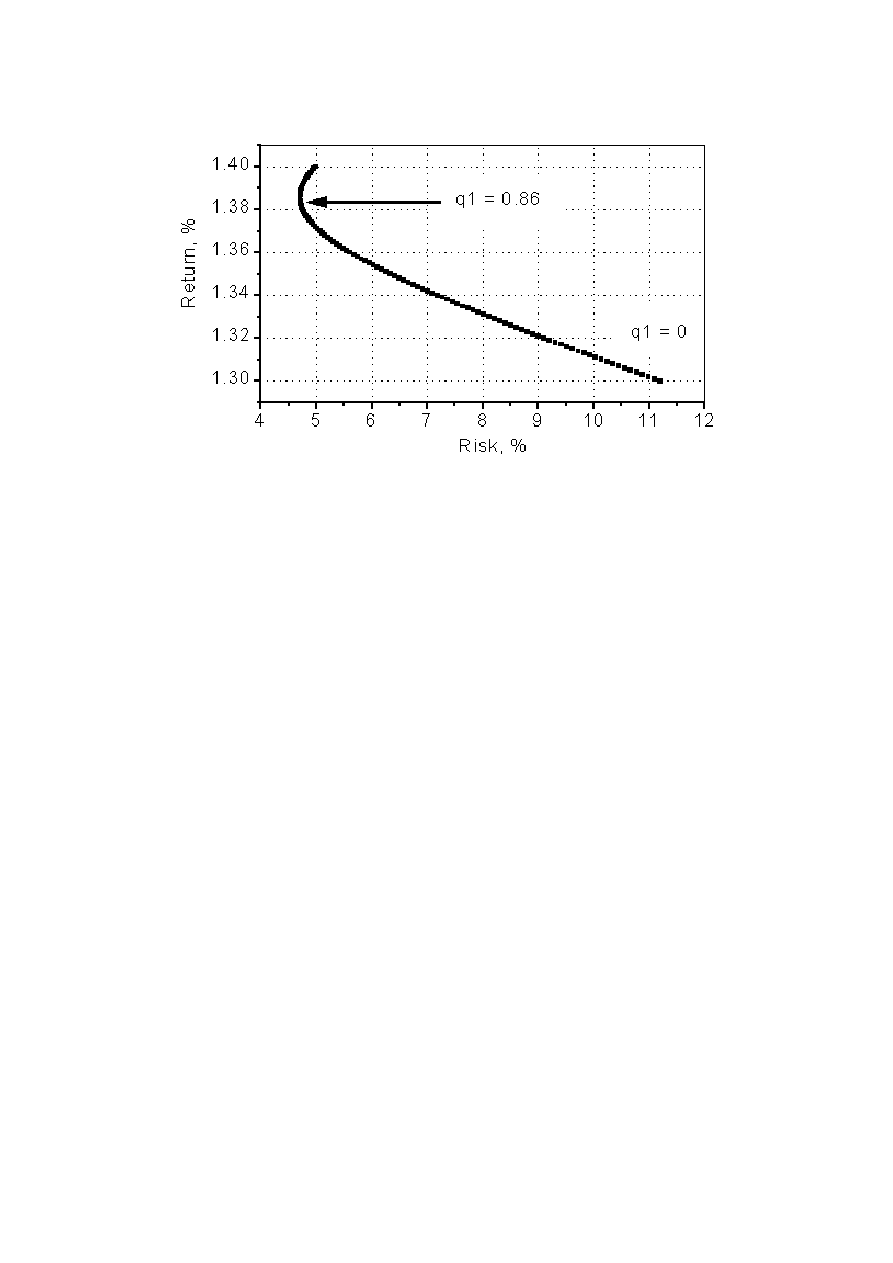
To solve this problem it is good idea to draw the graph R, s for different values of q1. As
an example consider the two strategies described in Section 2. The daily returns (calculated
from the growth coefficients) and risks for these strategies are equal to
R1 = 1.4% s1 = 5.0%
R2 = 1.3% s2 = 11.2 %
The correlation coefficient for these returns is equal to
c = 0.09
The next figure shows the return-risk plot for different values of q1.
12
Return-Risk plot for the trading portfolio described in the text
This plot shows the answer to the problem. The risk is minimal if the part of trading
capital used to buy the first stock from the list is equal to 0.86. The risk is equal to 4.7, which is
less than for the strategy when the whole capital is employed using the first trading strategy
only.
So, the trading portfolio, which provides the minimal risk, should be divided between the
two strategies. 86% of the capital should be used for the first strategy and the 14% of the
capital must be used for the second strategy. The expected return for this portfolio is smaller
than maximal expected value, and the trader can adjust his holdings depending on how much
risk he can afford. People, who like getting rich quickly, can use the first strategy only. If you
want a more peaceful life you can use q1= 0.86 and q2 = 0.14, i.e. about 1/6 of your trading
capital should be used for the second strategy.
This is the main idea of building portfolio depending on risk. If you trade more securities
the Return-Risk plot becomes more complicated. It is not a single line but a complicated figure.
Special computer methods of analysis of such plots have been developed. In our publication, we
consider some simple cases only to demonstrate the general ideas.
We have to note that the absolute value of risk is not a good characteristic of trading
strategy. It is more important to study the risk to return ratios. Minimal value of this ratio is the
main criterion of the best strategy. In this example the minimum of the risk to return ratio is
also the value q1= 0.86. But this is not always true. The next example is an illustration of this
statement.
Let us consider a case when a trader uses two strategies (#1 and #2) with returns and
risks, which are equal to
R1 = 3.55 % s1 = 11.6 %
R2 = 2.94 % s2 = 9.9 %
The correlation coefficient for the returns is equal to
c = 0.165
This is a practical example related to using our Basic Trading Strategy (look for details
at http://www.stta-consulting.com).
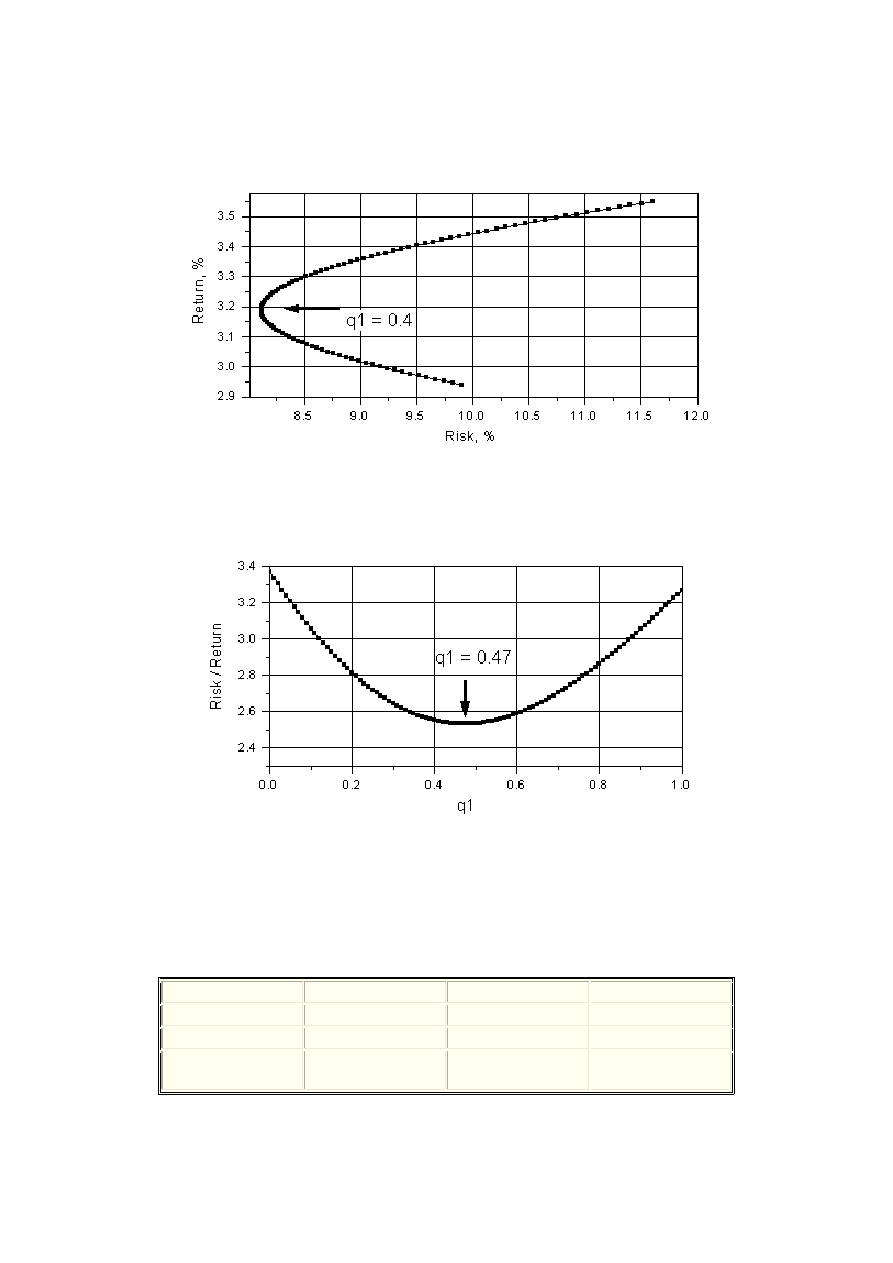
13
We calculated return R and standard deviation s (risk) for various values of q1 - part of
the capital employed for purchase using the first strategy. The next figure shows the return -
risk plot for various values of q1.
Return - risk plot for various values of q1 for strategy described in the text
You can see that minimal risk is observed when q1 = 0.4, i.e. 40% of trading capital
should be spend for strategy #1.
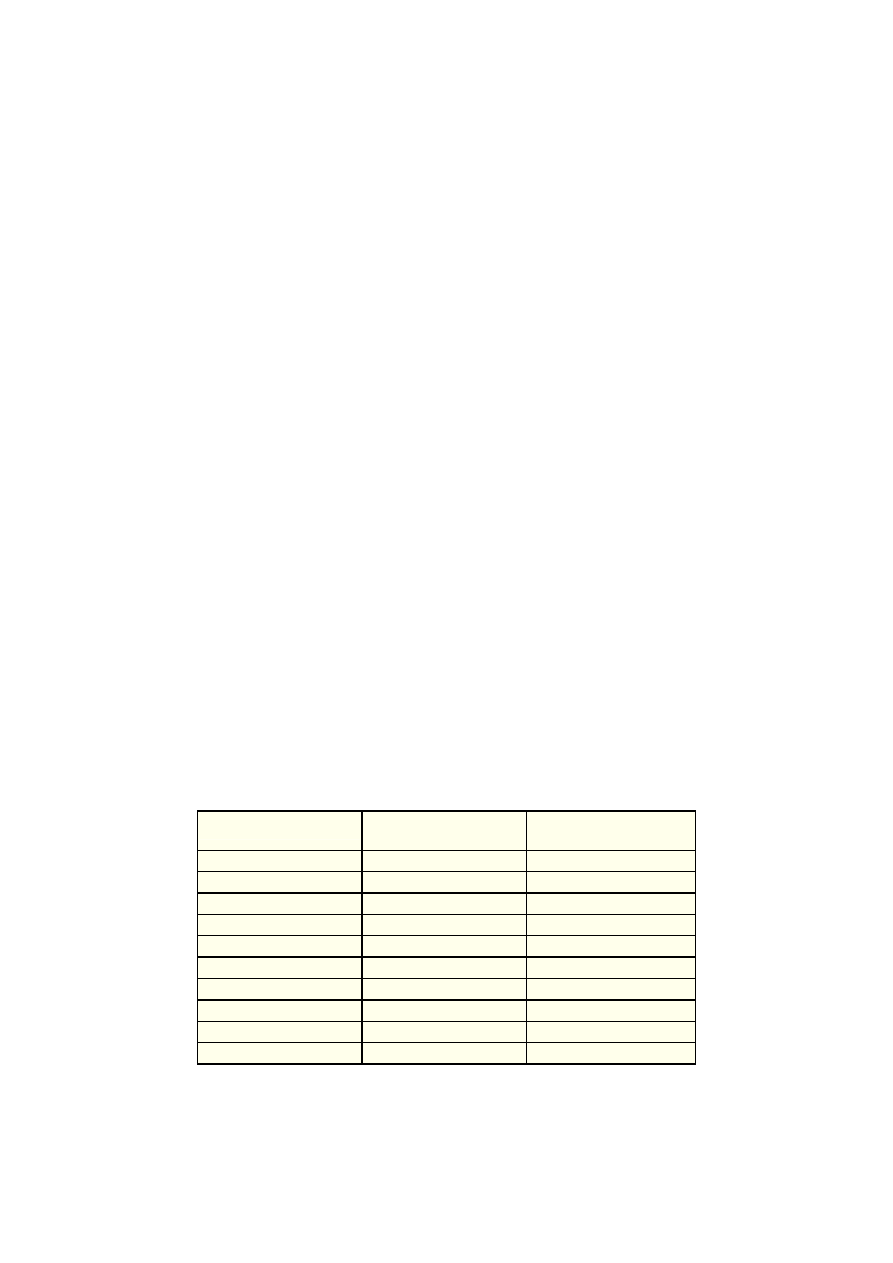
Let us plot the risk to return ratio as a function of q1.
The risk to return ratio as a function of q1 for strategy described in the text
You can see that the minimum of the risk to return ratio one can observe when q1 =
0.47, not 0.4. At this value of q1 the risk to return ratio is almost 40% less than the ratio in the
case where the whole capital is employed using only one strategy. In our opinion, this is the
optimal distribution of the trading capital between these two strategies. In the table we show
the returns, risks and risk to return ratios for strategy #1, #2 and for efficient trading portfolio
with minimal risk to return ratio.
Average return, %
Risk, %
Risk/Return
Strategy #1
3.55
11.6
3.27
Strategy #2
2.94
9.9
3.37
Efficient Portfolio
q1 = 47%
3.2
8.2
2.5

14
One can see that using the optimal distribution of the trading capital slightly reduces the
average returns and substantially reduces the risk to return ratio.
Sometimes a trader encounters the problem of estimating the correlation coefficient for
two strategies. It happens when a trader buys stocks randomly. It is not possible to construct a
table of returns with exact correspondence of returns of the first and the second strategy. One
day he buys stocks following the first strategy and does not buy stocks following the second
strategy. In this case the correlation coefficient cannot be calculated using the equation shown
above. This definition is only true for simultaneous stock purchasing. What can we do in this
case? One solution is to consider a longer period of time, as we mentioned before. However, a
simple estimation can be performed even for a short period of time. This problem will be
considered in the next section.
15
PART 2
Table of Contents
1. Efficient portfolio and correlation coefficient
2. Probability of 50% capital drop
3. Influence of commissions
4. Distribution of annual returns
5. When to give up
6. Cash reserve
7. Is you strategy profitable?
8. Using trading strategy and psychology of trading
9. Trading period and annual return
10. Theory of diversification
Efficient portfolio and the correlation coefficient.
It is relatively easily to calculate the average returns and the risk for any strategy when
a trader has made 40 and more trades. If a trader uses two strategies he might be interested in
calculating optimal distribution of the capital between these strategies. We have mentioned that
to correctly use the theory of efficient portfolio one needs to know the average returns, risks
(standard deviations) and the correlation coefficient. We also mentioned that calculating the
correlation coefficient can be difficult and sometimes impossible when a trader uses a strategy
that allows buying and selling of stocks randomly, i.e. the purchases and sales can be made on
different days.
The next table shows an example of such strategies. It is supposed that the trader buys
and sells the stocks in the course of one day.
Date
Return per purchase
for Strategy #1
Return per purchase
for Strategy #2
Jan 3
+5.5%
-3.5%
Jan 4
+2.5%
Jan 5
-5%
Jan 6
-3.2%
Jan 7
Jan 10
+1.1%
+8%
Jan 11
9.5%
Jan 12
+15.0%
Jan 13
-7.6%
Jan 14
-5.4%
16
In this example there are only two returns (Jan 3, Jan 10), which can be compared and
be used for calculating the correlation coefficient.
Here we will consider the influence of correlation coefficients on the calculation of the
efficient portfolio. As an example, consider two trading strategies (#1 and #2) with returns and
risks:
R1 = 3.55 % s1 = 11.6 %
R2 = 2.94 % s2 = 9.9 %
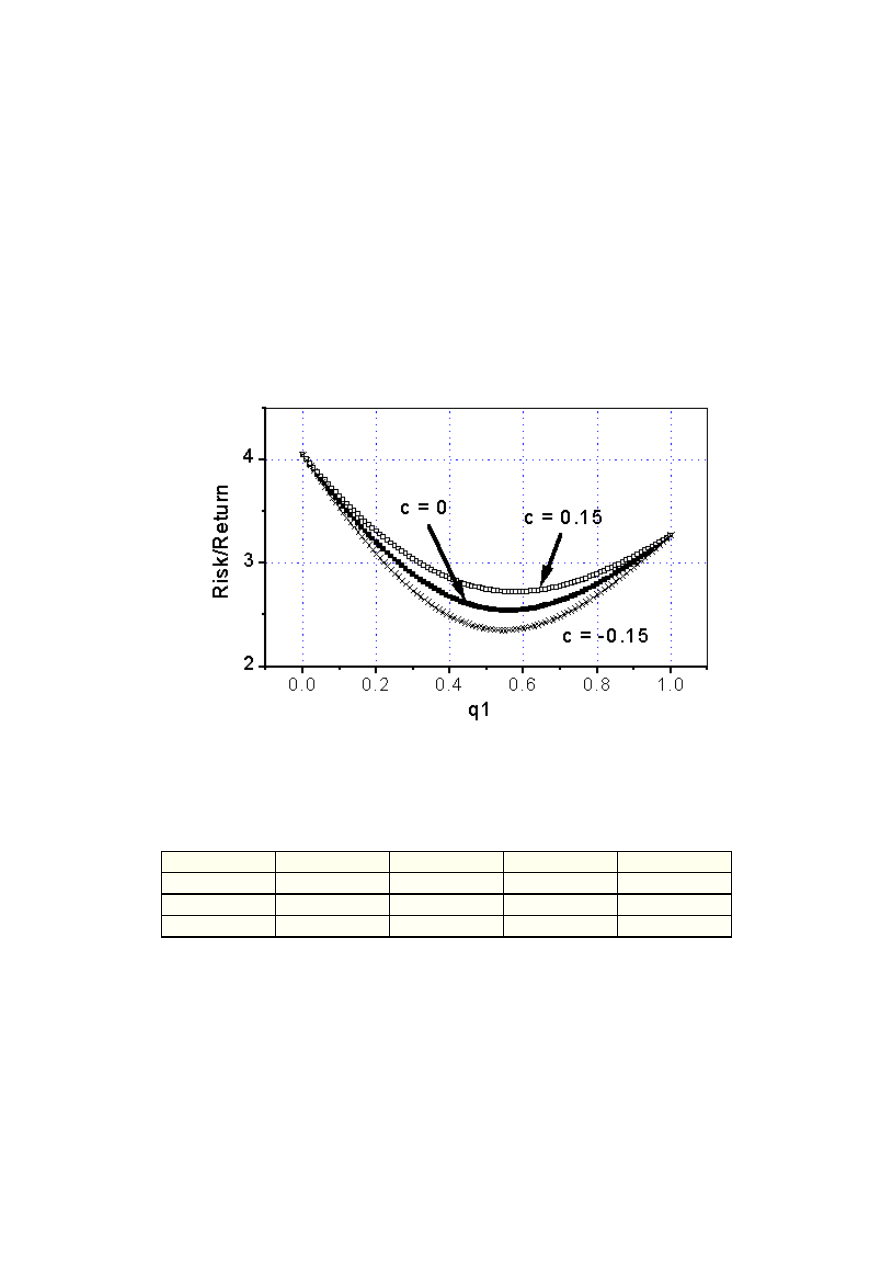
Suppose that the correlation coefficient is unknown. Our practice shows that the
correlation coefficients are usually small and their absolute values are less than 0.15.
Let us consider three cases with c = -0.15, c = 0 and c = 0.15. We calculated returns R
and standard deviations S (risk) for various values of q1 - part of the capital used for purchase
of the first strategy. The next figure shows the risk/return plot as a function of q1 for various
values of the correlation coefficient.
Return - risk plot for various values of q1 and the correlation coefficients for the
strategies described in the text.
One can see that the minimum of the graphs are very close to each other. The next
table shows the results.
c
q1
R
S
S/R
-0.15
0.55
3.28
7.69
2.35
0
0.56
3.28
8.34
2.57
0.15
0.58
3.29
8.96
2.72
As one might expect, the values of "efficient" returns R are also close to each other, but
the risks S depend on the correlation coefficient substantially. One can observe the lowest risk
for negative values of the correlation coefficient.
17
Conclusion:
The composition of the efficient portfolio does not substantially depend on the
correlation coefficients if they are small. Negative correlation coefficients yield less risk than
positive ones.
One can obtain negative correlation coefficients using, for example, two "opposite
strategies": buying long and selling short. If a trader has a good stock selection system for
these strategies he can obtain a good average return with smaller risk.
Probability of 50% capital drop
How safe is stock trading? Can you lose more than 50% of your trading capital trading
stocks? Is it possible to find a strategy with low probability of such disaster?
Unfortunately, a trader can lose 50 and more percent using any authentic trading
strategy. The general rule is quite simple: the larger your average profit per trade, the large
the probability of losing a large part of your trading capital. We will try to develop some
methods, which allow you to reduce the probability of large losses, but there is no way to make
this probability equal to zero.
If a trader loses 50% of his capital it can be a real disaster. If he or she starts spending
a small amount of money for buying stocks, the brokerage commissions can play a very
significant role. As the percentage allotted to commissions increases, the total return suffers. It
can be quite difficult for the trader to return to his initial level of trading capital.
Let us start by analyzing the simplest possible strategy.
Problem:
Suppose a trader buys one stock every day and his daily average return is equal to R.
The standard deviation of these returns (risk) is equal to s. What is the probability of losing 50
or more percent of the initial trading capital in the course of one year?
Solution:
Suppose that during one given year a trader makes about 250 trades. Suppose also that the
distribution of return can be described by gaussian curve. (Generally this is not true. For a good
strategy the distribution is not symmetric and the right wing of the distribution curve is higher than
the left wing. However this approximation is good enough for purposes of comparing different
trading strategies and estimating the probabilities of the large losses.)
We will not present the equation that allows these calculations to be performed. It is a
standard problem from game theory. As always you can write us to find out more about this
problem. Here we will present the result of the calculations. One thing we do have to note: we
use the growth coefficients to calculate the annual return and the probability of large drops in
the trading capital.
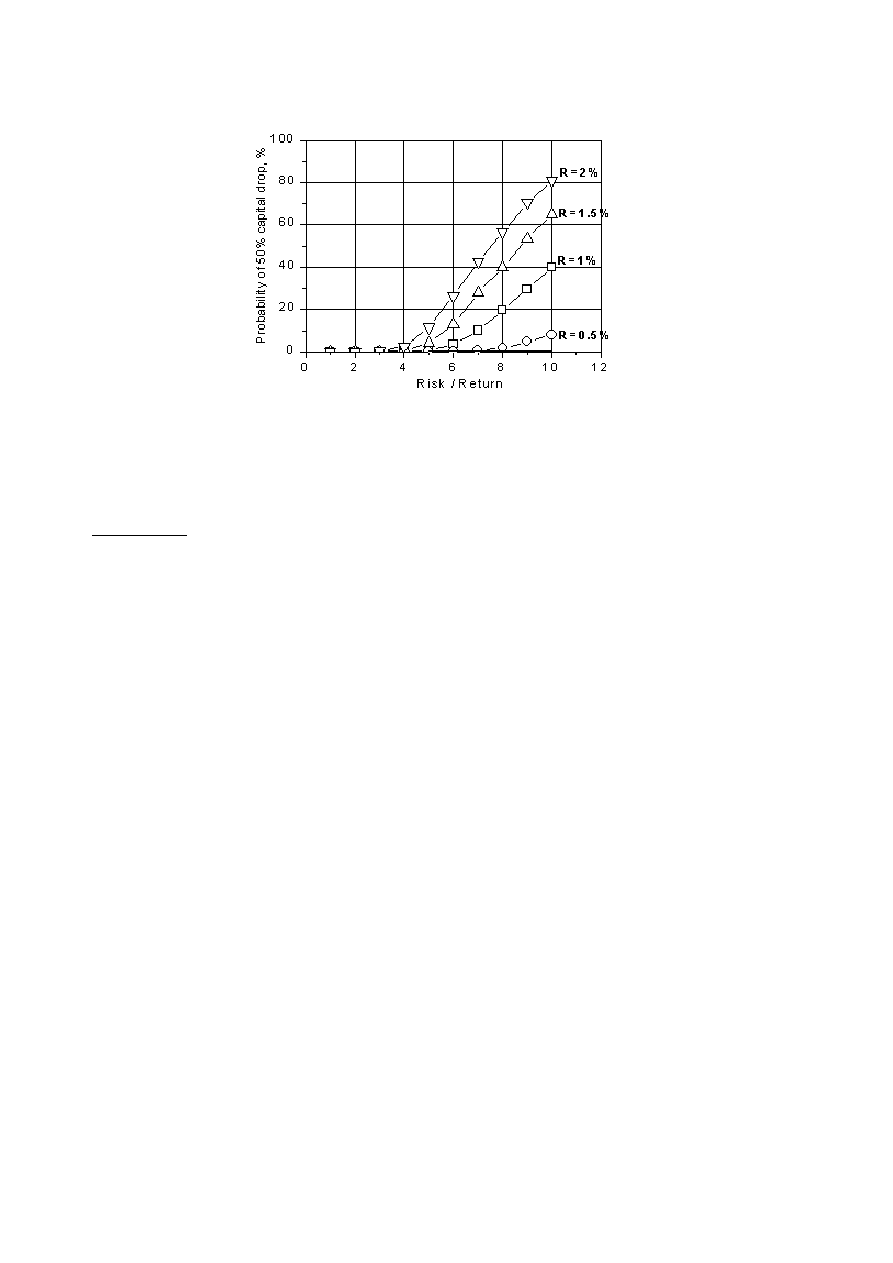
The next figure shows the results of calculating these probabilities (in %) for different
values of the average returns and risk-to-return ratios.
18
The probabilities (in %) of 50% drops in the trading capital for different values of
average returns and risk-to-return ratios
One can see that for risk to return ratios less than 4 the probability of losing 50% of the
trading capital is very small. For risk/return > 5 this probability is high. The probability is higher
for the larger values of the average returns.
Conclusion:
A trader should avoid strategies with large values of average returns if the risk to return
ratios for these strategies are larger than 5.
Influence of Commissions
We have mentioned that when a trader is losing his capital the situation becomes worse
and worse because the influence of the brokerage commissions becomes larger.
As an example consider a trading method, which yields 2% return per day and
commissions are equal to 1% of initial trading capital. If the capital drops as much as 50% then
commissions become 2% and the trading system stops working because the average return per
day becomes 0%.
We have calculated the probabilities of a 50% capital drop for this case for different
values of risk to return ratios. To compare the data obtained we have also calculated the
probabilities of 50% capital drop for an average daily return = 1% (no commissions have been
considered).
For initial trading capital the returns of these strategies are equal but the first strategy
becomes worse when the capital becomes smaller than its initial value and becomes better
when the capital becomes larger than the initial capital. Mathematically the return can be
written as
R = Ro - commissions/capital * 100%
where R is a real return and Ro is a return without commissions. The next figure shows the
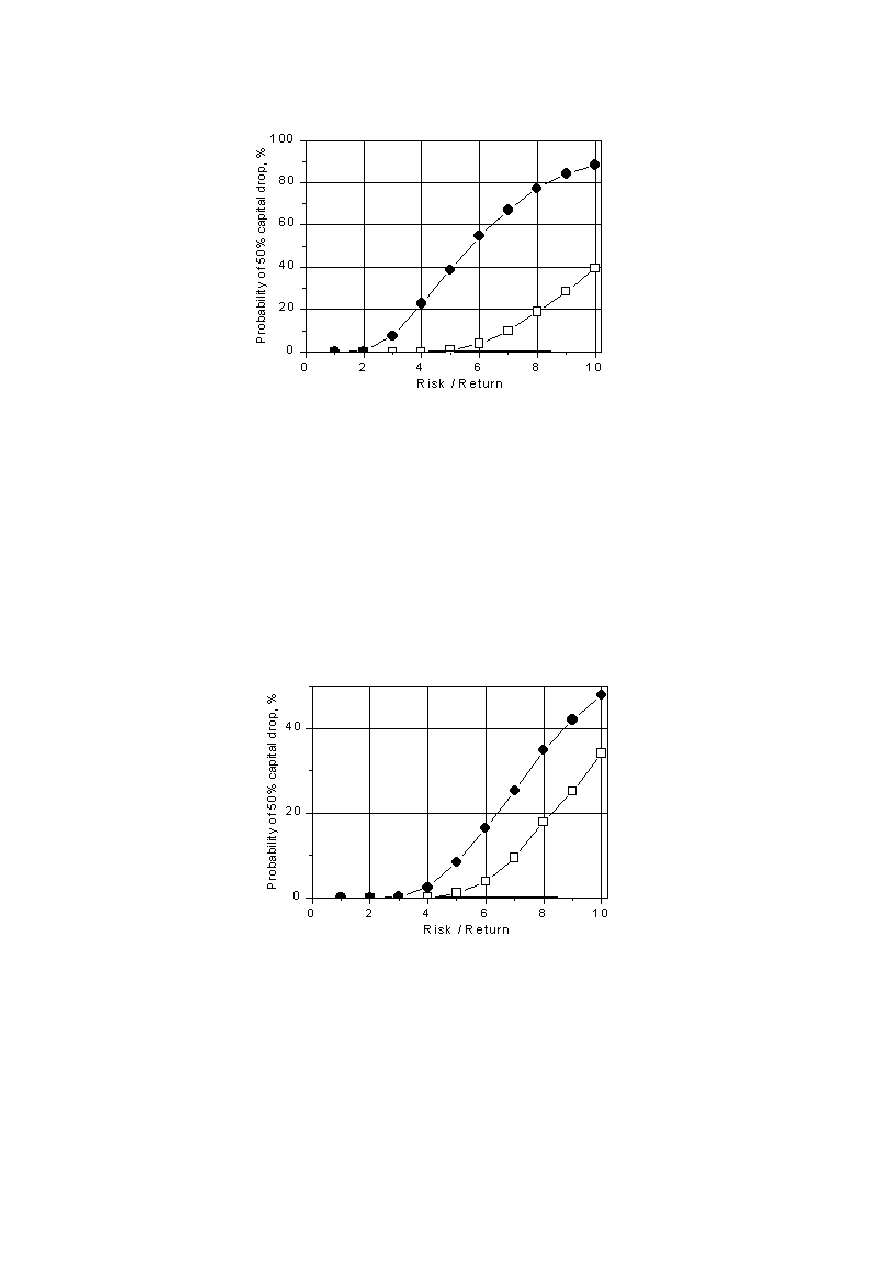
results of calculations.
19
The probabilities (in %) of 50% drops in the trading capital for different values of the
average returns and risk-to-return ratios. Filled symbols show the case when
commissions/(initial capital) = 1% and Ro = 2%. Open symbols show the case when Ro =
1% and commissions = 0.
One can see from this figure that taking into account the brokerage commissions
substantially increases the probability of a 50% capital drop. For considered case the strategy
even with risk to return ratio = 4 is very dangerous. The probability of losing 50% of the
trading capital is larger than 20% when the risk of return ratios are more than 4.
Let us consider a more realistic case. Suppose one trader has $10,000 for trading and a
second trader has $5,000. The round trip commissions are equal to $20. This is 0.2% of the
initial capital for the first trader and 0.4% for the second trader. Both traders use a strategy
with the average daily return = 0.7%. What are the probabilities of losing 50% of the trading
capital for these traders depending on the risk to return ratios?
The answer is illustrated in the next figure.
The probabilities (in %) of 50% drops in the trading capital for different values of the
average returns and risk-to-return ratios. Open symbols represent the first trader ($10,000
trading capital). Filled symbols represent the second trader ($5,000 trading capital). See details
in the text.
From the figure one can see the increase in the probabilities of losing 50% of the trading
capital for smaller capital. For risk to return ratios greater than 5 these probabilities become
very large for small trading capitals.
Once again: avoid trading strategies with risk to return ratios > 5.
20
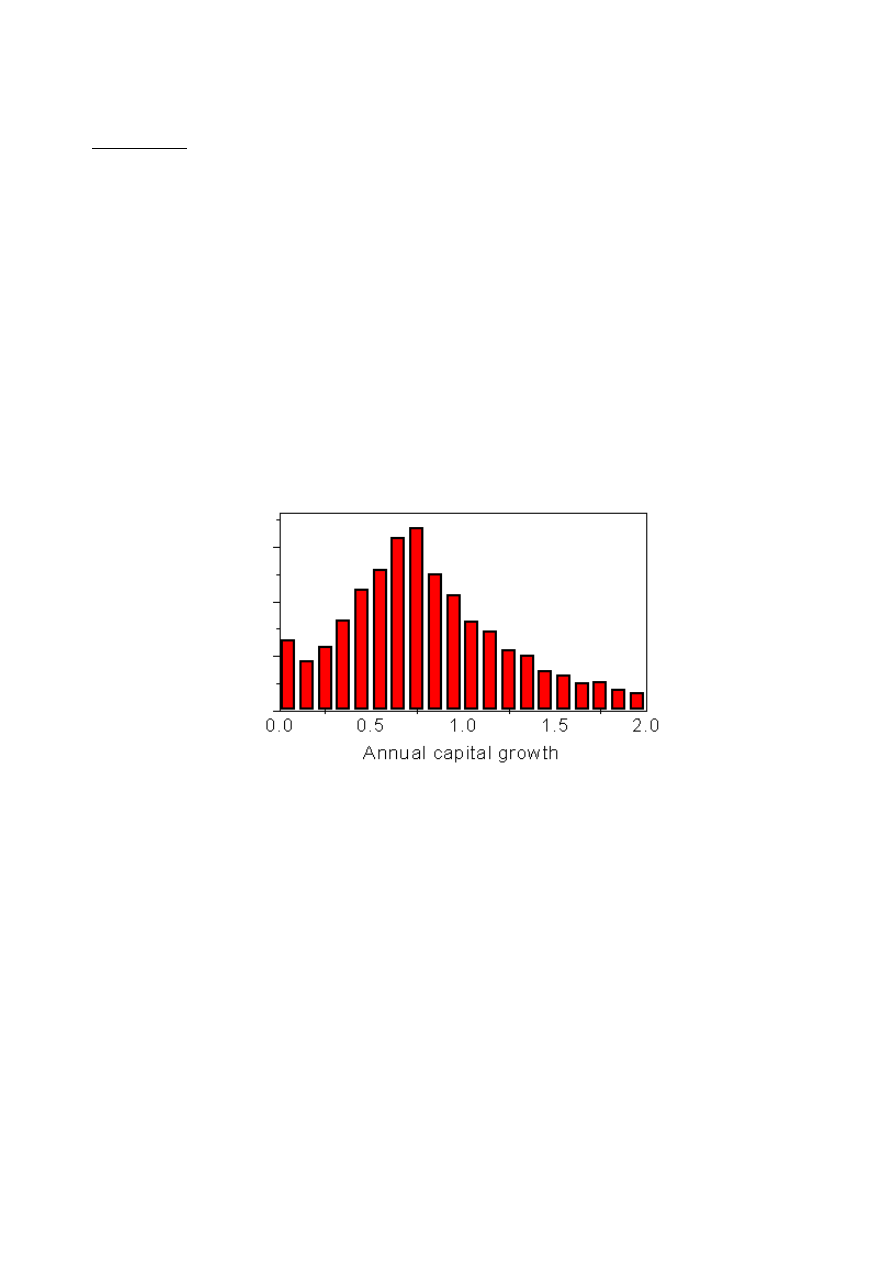
Distributions of Annual Returns
Is everything truly bad if the risk to return ratio is large? No, it is not. For large values of
risk to return ratios a trader has a chance to be a lucky winner. The larger the risk to return
ratio, the broader the distribution of annual returns or annual capital growth.
Annual capital growth = (Capital after 1 year) / (Initial Capital)
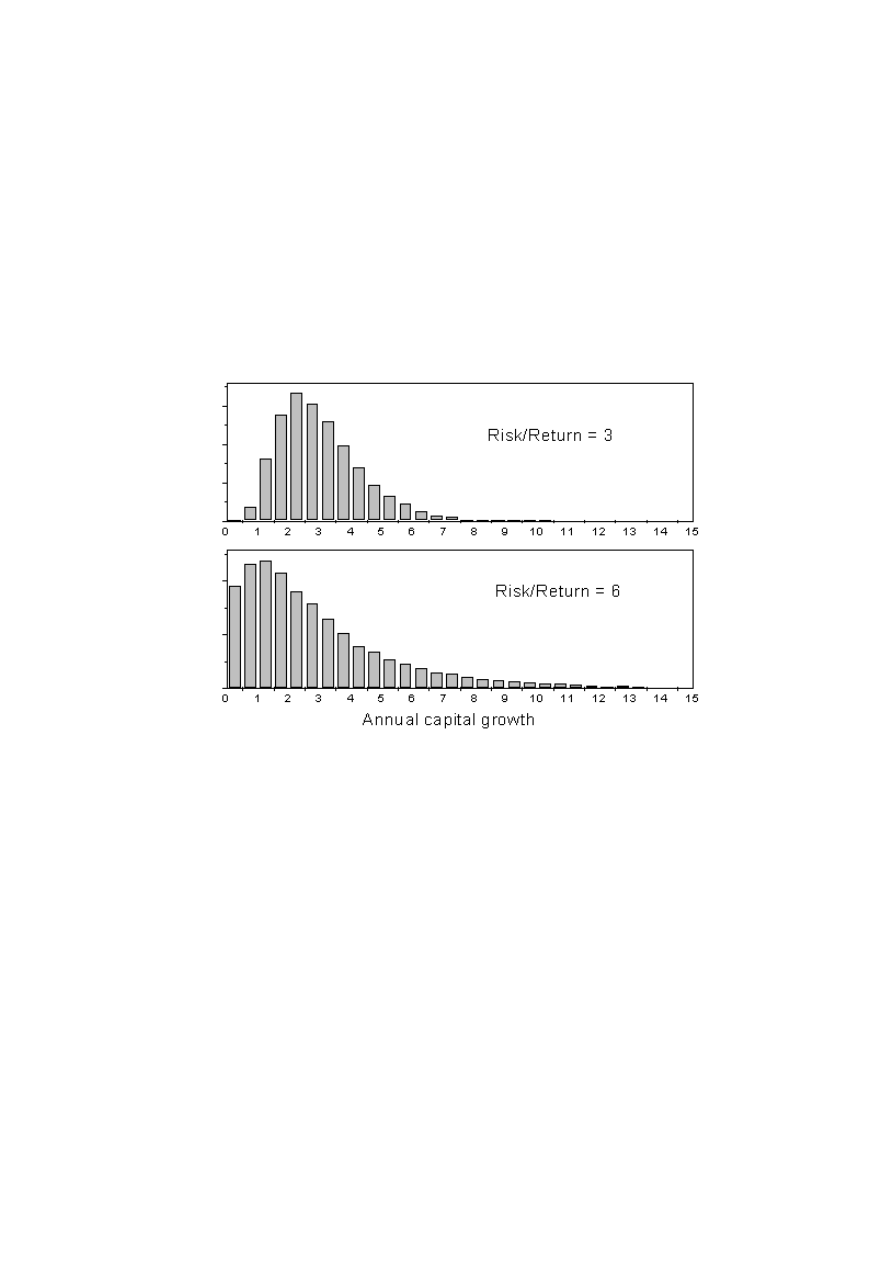
We calculated the distribution of the annual capital growths for the strategy with the
average daily return = 0.7% and the brokerage commissions = $20. The initial trading capital
was supposed = $5,000. The results of calculations are shown in the next figure for two values
of the risk to return ratios.
Distributions of annual capital growths for the strategy described in the text
The average annual capital growths are equal in both cases (3.0 or 200%) but the
distributions are very different. One can see that for a risk to return ratio = 6 the chance of a
large loss of capital is much larger than for the risk to return ratio = 3. However, the chance of
annual gain larger than 10 (> 900%) is much greater. This strategy is good for traders who like
risk and can afford losing the whole capital to have a chance to be a big winner. It is like a
lottery with a much larger probability of being a winner.
When to give up
In the previous section we calculated the annual capital growth and supposed that the
trader did not stop trading even when his capital had become less than 50%. This makes sense
only in the case when the influence of brokerage commissions is small even for reduced capital
and the trading strategy is still working well. Let us analyze the strategy of the previous section
in detail.
The brokerage commissions were supposed = $20, which is 0.4% for the capital =
$5,000 and 0.8% for the capital = $2,500.
21
So, after a 50% drop the strategy for a small capital becomes unprofitable because the
average return is equal to 0.7%. For a risk to return ratio = 6 the probability of touching the
50% level is equal to 16.5%. After touching the 50% level a trader should give up, switch to
more profitable strategy, or add money for trading. The chance of winning with the amount of
capital = $2,500 is very small.
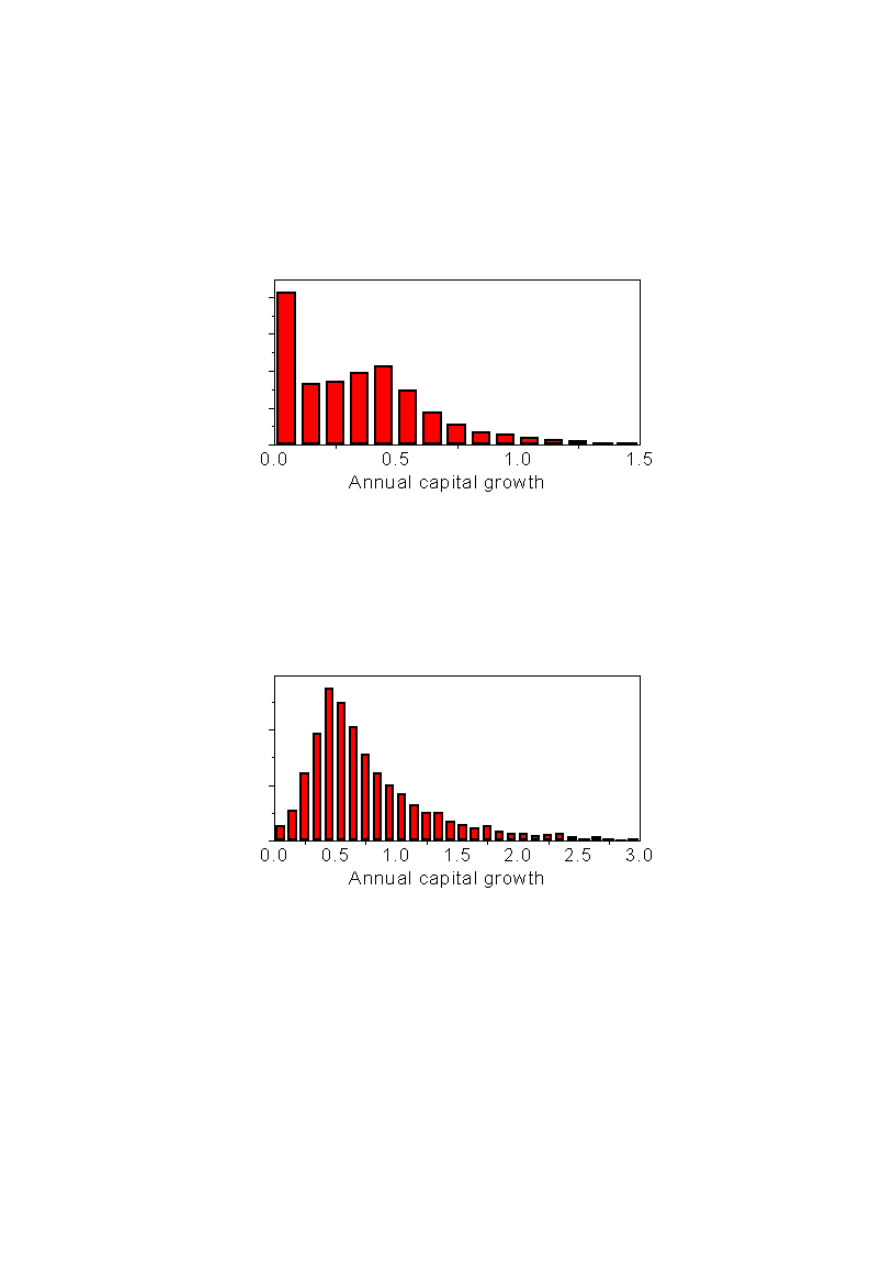
The next figure shows the distribution of the annual capital growths after touching the
50% level.
Distribution of the annual capital growths after touching the 50% level. Initial capital
= $5,000; commissions = $20; risk/return ratio = 6; average daily return = 0.7%
One can see that the chance of losing the entire capital is quite high. The average
annual capital growth after touching the 50% level ($2,500) is equal to 0.39 or $1950.
Therefore, after touching the 50% level the trader will lose more money by the end of the year.
The situation is completely different when the trader started with $10,000. The next
figure shows the distribution of the annual capital growths after touching the 50% level in this
more favorable case.
Distribution of the annual capital growths after touching the 50% level. Initial capital
= $10,000; commissions = $20; risk/return ratio = 6; average daily return = 0.7%
One can see that there is a good chance of finishing the year with a zero or even
positive result. At least the chance of retaining more than 50% of the original trading capital is
much larger than the chance of losing the rest of money by the end of the year. The average
annual capital growth after touching the 50% level is equal to 0.83. Therefore, after touching
the 50% level the trader will compensate for some losses by the end of the year.
22
Conclusion:
Do not give up after losing a large portion of your trading capital if your strategy is still
profitable.
Cash Reserve
We have mentioned that after a large capital drop a trader can start thinking about
using his of her reserve capital. This makes sense when the strategy is profitable and adding
reserve capital can help to fight the larger contribution of the brokerage commissions. As an
example we consider the situation described in the previous section. Let us write again some
parameters:
Initial trading capital = $5,000
Average daily return = 0.7% (without commissions)
Brokerage commissions = $20 (roundtrip)
Risk/Return = 3
Reserve capital = $2,500 will be added if the main trading capital drops more than 50%.
The next figure shows the distribution of the annual capital growths for this trading
method.
Distribution of the annual capital growths after touching the 50% level. Initial capital
= $5,000; commissions = $20; risk/return ratio = 6; average daily return = 0.7%.
Reserve capital of $2,500 has been used after the 50% drop of the initial capital
The average annual capital growth after touching the 50% level for this trading method
is equal to 1.63 or $8,150, which is larger than $7,500 ($5,000 + $2,500). Therefore, using
reserve trading capital can help to compensate some losses after a 50% capital drop.
Let's consider a important practical problem. We were talking about using reserve capital
($2,500) only in the case when the main capital ($5,000) drops more than 50%. What will
happen if we use the reserve from the very beginning, i.e. we will use $7,500 for trading
without any cash reserve? Will the average annual return be larger in this case?
Yes, it will. Let us show the results of calculations.
If a trader uses $5,000 as his main capital and adds $2,500 if the capital drops more
than 50% then in one year he will have on average $15,100.
If a trader used $7,500 from the beginning this figure will be transformed to $29,340,
which is almost two times larger than for the first method of trading.
If commissions do not play any role the difference between these two methods is
smaller.
23
As an example consider the described methods in the case of zero commissions.
Suppose that the average daily return is equal to 0.7%. In this case using $5,000 and $2,500
as a reserve yields an average of $28,000. Using the entire $7,500 yields $43,000. This is
about a 30% difference.
Therefore, if a trader has a winning strategy it is better to use all capital for trading than
to keep some cash for reserve. This becomes even more important when brokerage
commissions play a substantial role.
You can say that this conclusion is in contradiction to our previous statement, where we
said how good it is to have a cash reserve to add to the trading capital when the latter drops to
some critical level.
The answer is simple. If a trader is sure that a strategy is profitable then it is better to
use the entire trading capital to buy stocks utilizing this strategy.
However, there are many situations when a trader is not sure about the profitability of a
given strategy. He might start trading using a new strategy and after some time he decides to
put more money into playing this game.
This is a typical case when cash reserve can be very useful for increasing trading capital,
particularly when the trading capital drops to a critical level as the brokerage commissions start
playing a substantial role.
The reader might ask us again: if the trading capital drops why should we put more
money into playing losing game? You can find the answer to this question in the next section.
Is your strategy profitable?
Suppose a trader makes 20 trades using some strategy and loses 5% of his capital.
Does it mean that the strategy is bad? No, not necessarily. This problem is related to the
determination of the average return per trade. Let us consider an important example.
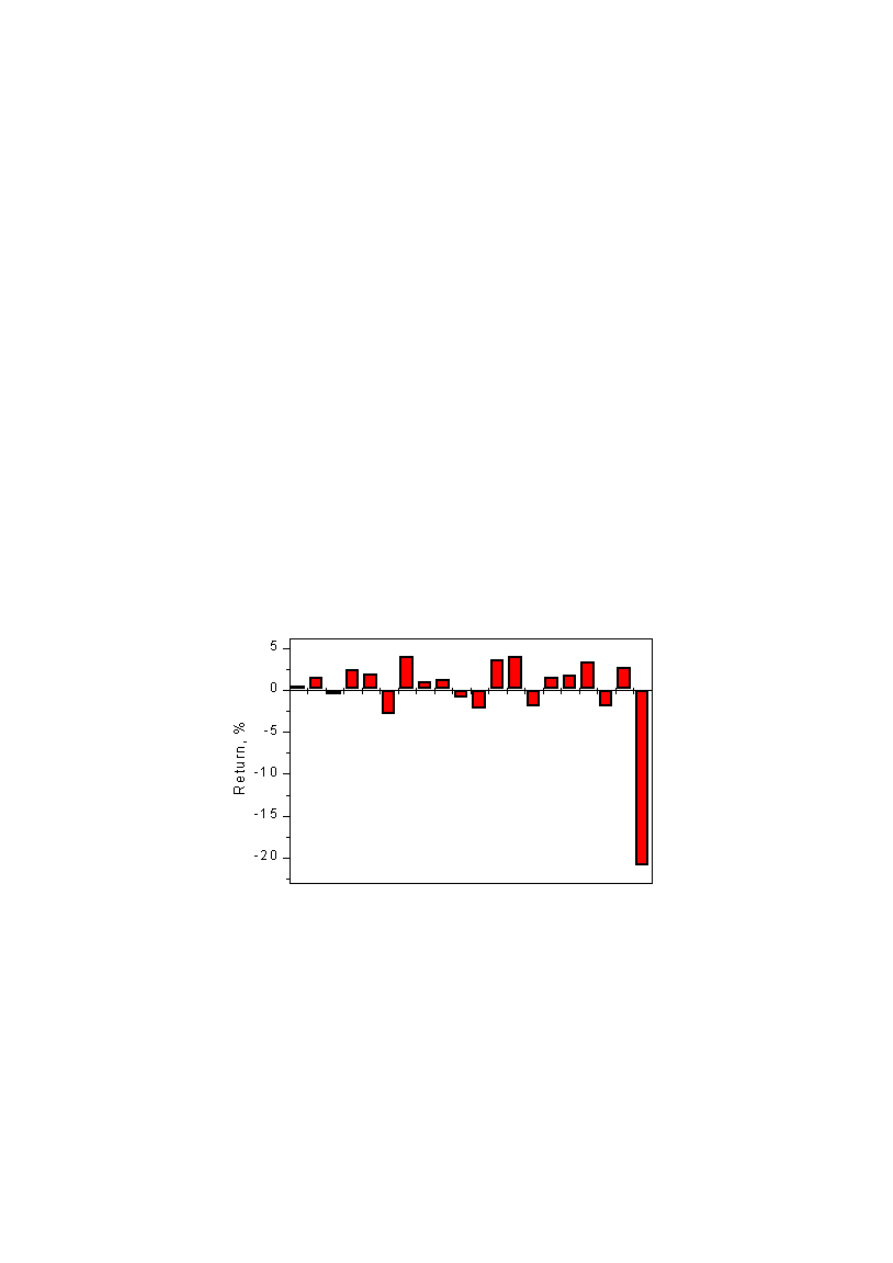
The next figure represents the returns on 20 hypothetical trades.
Bar graph of the 20 returns per trade described in the text
Using growth coefficients we calculated the total return, which is determined by
total return = (current capital - initial capital) / (initial capital) * 100%
For the considered case the total return is negative and is equal to -5%. We have
calculated this number using the growth coefficients. The calculated average return per trade is
24
also negative, and it is equal to -0.1% with the standard deviation (risk) = 5.4%. The average
growth coefficient is less than 1, which also indicates the average loss per trade.
Should the trader abandon this strategy?
The answer is no. The strategy seems to be profitable and a trader should continue
using it. Using the equations presented in part 1 of this publication gives the wrong answer and
can lead to the wrong conclusion. To understand this statement let us consider the distribution
of the returns per trade.
Usually this distribution is asymmetric. The right wing of the distribution is higher than
the left one. This is related to natural limit of losses: you cannot lose more than 100%.
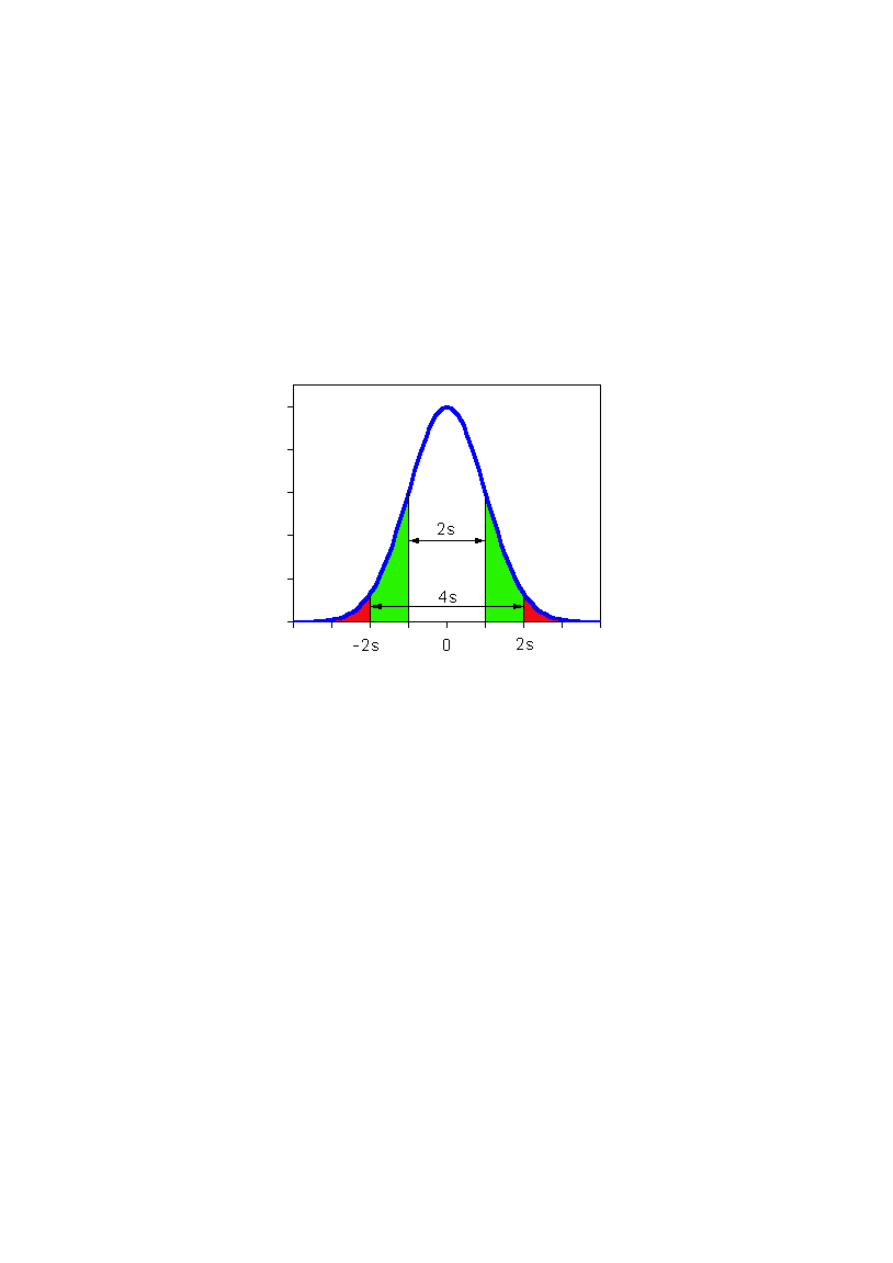
However, let us for simplicity consider the symmetry distribution, which can be described by
the gaussian curve. This distribution is also called a normal distribution and it is presented in
the next figure.
Normal distribution. s is the standard deviation
The standard deviation s of this distribution (risk) characterizes the width of the curve.
If one cuts the central part of the normal distribution with the width 2s then the probability of
finding an event (return per trade in our case) within these limits is equal to 67%. The
probability of finding a return per trade within the 4s limits is equal to 95%.
Therefore, the probability to find the trades with positive or negative returns, which are
out of 4s limits is equal to 5%.
Lower limit = average return - 2s
Upper limit = average return - 2s
The return on the last trade of our example is equal to -20%. It is out of 2s and even 4s
limits. The probability of such losses is very low and considering -20% loss in the same way as
other returns would be a mistake.
What can be done? Completely neglecting this negative return would also be a mistake.
This trade should be considered separately.
There are many ways to recalculate the average return for given strategy. Consider a
simplest case, one where the large negative return has occurred on a day when the market
drop is more than 5%. Such events are very rare. One can find such drops one or two times per
year. We can assume that the probability of such drops is about 1/100, not 1/20 as for other
returns. In this case the average return can be calculated as
Rav = 0.99 R1 + 0.01 R2
25
where R1 is the average return calculated for the first 19 trades and R2 = -20% is the return
for the last trade related to the large market drop. In our example R1 = 1% and Rav = 0.79%.
The standard deviation can be left equal to 5.4%.
This method of calculating the average returns is not mathematically perfect but it
reflects real situations in the market and can be used for crude estimations of average returns.
Therefore, one can consider this strategy as profitable and despite loss of some money it
is worth continuing trading utilizing this strategy. After the trader has made more trades it
would be a good idea to recalculate the average return and make the final conclusion based on
more statistical data.
We should also note that this complication is related exclusively to small statistics. If a
trader makes 50 and more trades he must take into account all trades without any special
considerations.
Using Trading Strategies and Trading Psychology
This short section is very important. We wrote this section after analysis of our own
mistakes and we hope a reader will learn from our experience how to avoid some typical
mistakes.
Suppose a trader performs a computer analysis and develops a good strategy, which
requires holding stocks for 5 days after purchase. The strategy has an excellent historical return
and behaves well during bull and bear markets. However, when the trader starts using the
strategy he discovers that the average return for real trading is much worse. Should the trader
switch to another strategy?
Before making such a decision the trader should analyze why he or she is losing money.
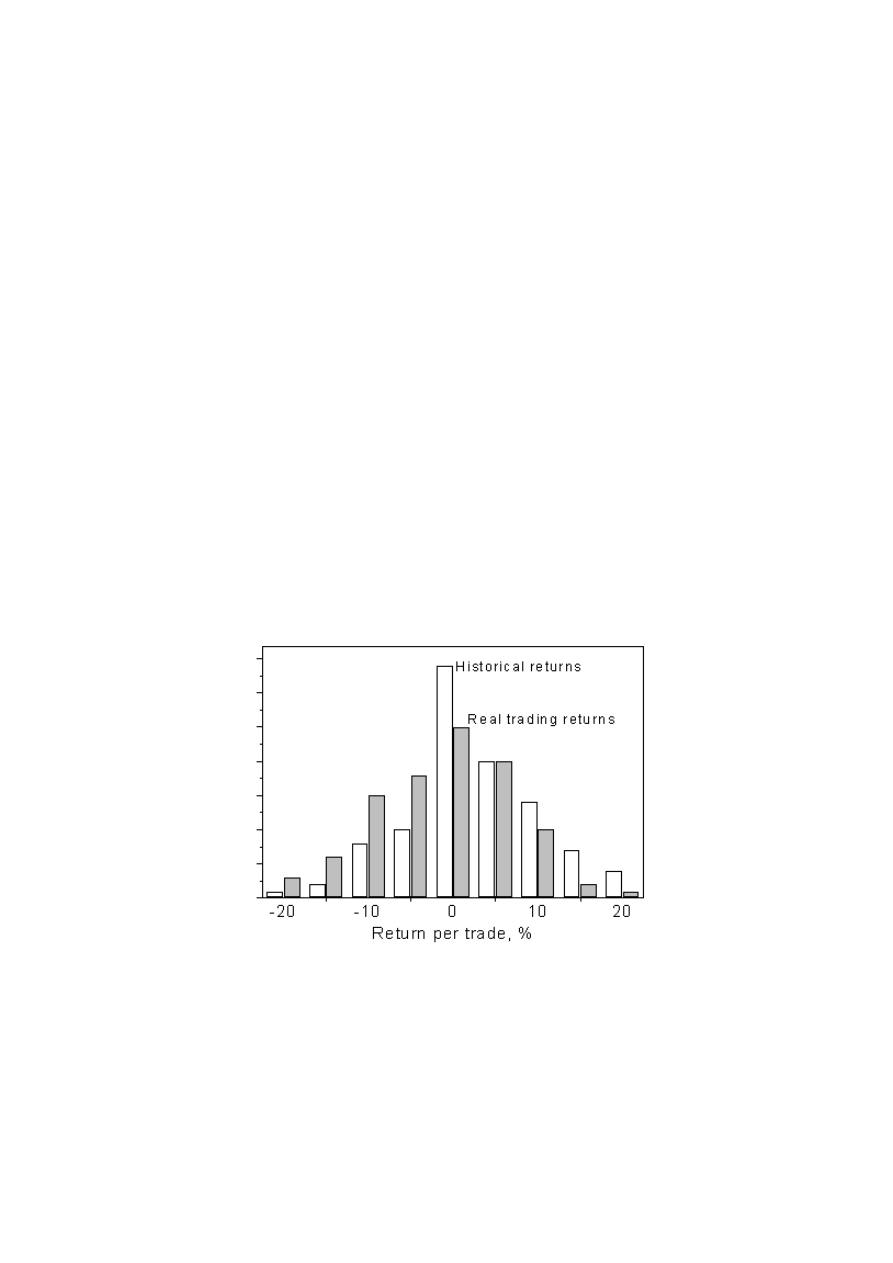
Let us consider a typical situation. Consider hypothetical distributions of historical returns and
real returns. They are shown in the next figure.
Hypothetical distributions of the historical and real trading returns
This figure shows a typical trader's mistake. One can see that large positive returns (>
10%) are much more probable than large negative returns. However, in real trading the
probability of large returns is quite low.
Does this mean that the strategy stops working as soon as a trader starts using it?
Usually, this is not true. In of most cases traders do not follow strategy. If they see a profit
26
10% they try to sell stocks or use stop orders to lock in a profit. Usually the stop orders are
executed and the trader never has returns more than 10 - 15%.
On the other hand if traders see a loss of about 10% they try to hold a stock longer in
hope of a recovery and the loss can become even larger. This is why the distribution of returns
shifts to the left side and the average return is much smaller than historical return.
Conclusion:
If you find a profitable strategy - follow it and constantly analyze your mistakes.
Trading Period and Annual Return
To calculate the average annual return one needs to use the average daily growth
coefficient calculated for the whole trading capital. Let us remind the reader that this coefficient
should be calculated as an average ratio
Ki = <C (i)/C (i-1)>
where C(i) is the value of the capital at the end of i-th trading day. The average growth
coefficient must be calculated as the geometric average, i.e. for n trading days
Kav - the average daily growth coefficient
Kav = (K1*K2* ... *Kn) ^ (1/n)
How should one calculate the average daily growth coefficient if a trader holds the
stocks for 2 days, spending the entire capital to buy stocks? This method of trading can be
presented graphically as
BUY
HOLD
SELL BUY
HOLD
SELL
BUY
Suppose that the average growth coefficient per trade (not per day!) is equal to k. This
can be interpreted as the average growth coefficient per two days. In this case the average
growth coefficient per day Kav can be calculated as the square root of k
Kav = k ^ (1/2)
The number of days stocks are held we will call the trading period. If a trader holds
stocks for N days then the average return per day can be written as
Kav - the average daily growth coefficient
k - the average growth coefficient per trade
N - holding (trading) period
Kav = k ^ (1/N)
The average annual capital growth Kannual (the ratio of capital at the end of the year
to the initial capital) can be calculated as
Kannual = k ^ (250/N)
We supposed that the number of trading days per year is equal to 250. One can see that
annual return is larger for a larger value of k and it is smaller for a larger number of N. In other
27
words, for a given value of return per trade the annual return will suffer if the stock holding
period is large.
Which is better: holding stocks for a shorter period of time to have more trades per year
or holding stocks for a longer time to have a larger return per trade k?
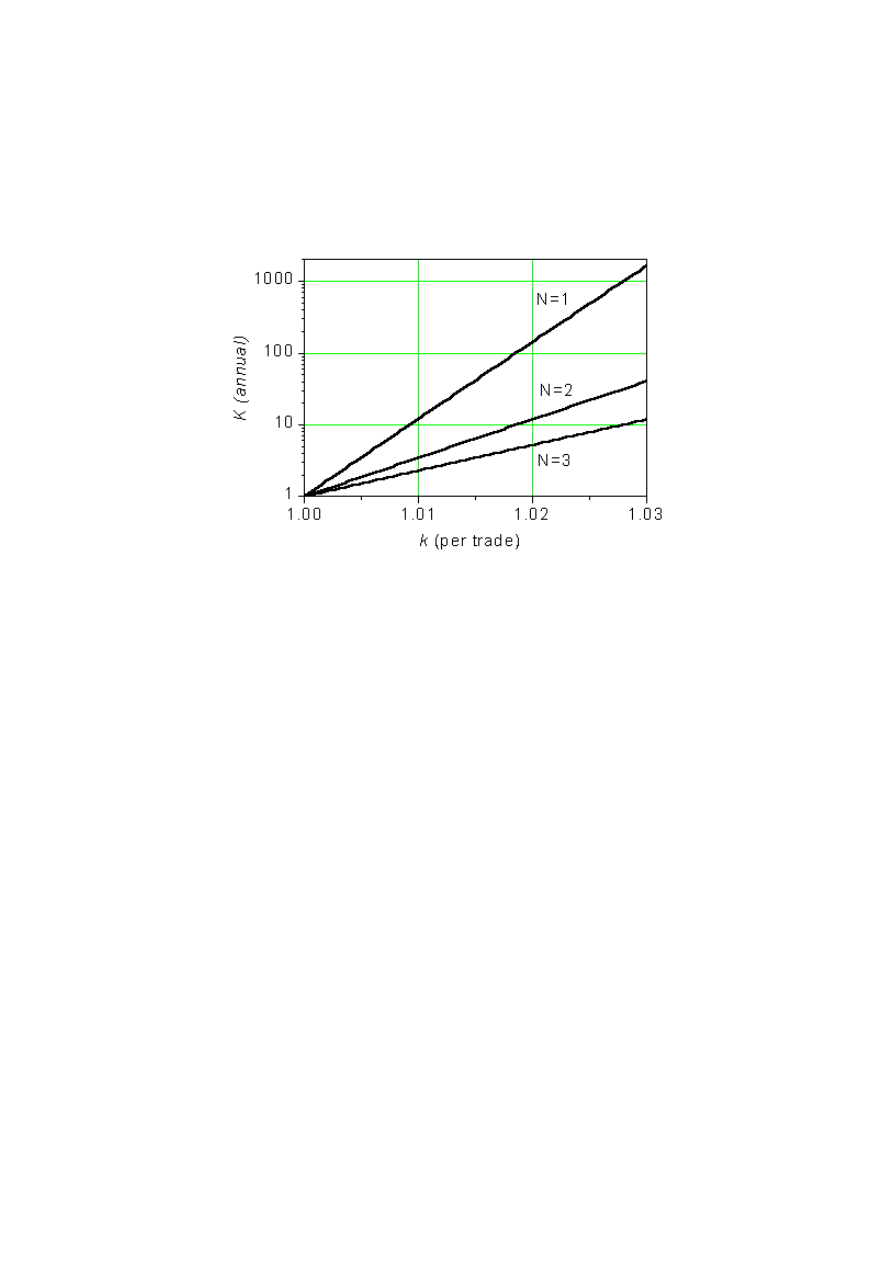
The next graph illustrates the dependence of the annual growth coefficient on k and N.
The annual capital growth K(annual) as a function of the average growth coefficient
per trade k for various stock holding periods N
Using this graph one can conclude that to have an annual capital growth equal to about
10 (900% annual return) one should use any of following strategies:
N = 1 and k = 1.01
N = 2 and k = 1.02
N = 3 and k = 1.03
In the first case one should trade stocks every day, which substantially increases the
total brokerage commissions. Let us consider this important problem in detail.
Suppose that the round trip brokerage commissions and bid-ask spread equal (on
average) 1.5% of the capital used to buy a stock. In this case the first strategy becomes
unprofitable and profits from other two strategies are sharply reduced. One needs to have
much larger profit per trade to have a large annual return. For annual capital growth about 10
the strategies with N = 1, 2, 3 should have growth coefficients per trade k as large as
N = 1 and k = 1.025
N = 2 and k = 1.035
N = 3 and k = 1.045
If a trader uses a strategy with a trading period of two and more days he can divide his
trading capital to buy stocks every day. In this case the risk of trading will be much lower. This
important problem will be considered in the next section.
28
Theory of Diversification
Suppose that a trader uses a strategy with the holding period N = 2. He buys stocks and
sells them on the day after tomorrow. For this strategy there is an opportunity to divide the
trading capital in half and buy stocks every day, as shown in the next table
First half of
capital
BUY
HOLD
SELL BUY
HOLD
SELL
BUY
HOLD
SELL
BUY
Second half
of capital
BUY
HOLD
SELL BUY HOLD SELL
BUY
HOLD
Every half of the capital will have the average annual growth coefficient
Kannual (1/2) = k ^ (250/2)
and it is easily to calculate the annual growth coefficient (annual capital growth) for the entire
capital Kannual.
Kannual = (Capital after 1 year) / (Initial Capital)
Let CAP (0) denotes the initial capital and CAP (250) the capital after 1 year trading.
One can write
Kannual = CAP (250)/CAP (0) = Kannual (1/2) = k ^ (250/2)
Correspondingly for N = 3 one can write
Kannual = CAP (250)/CAP (0) = k ^ (250/3)
and so on. One can see that the formula for annual capital growth does not depend on
capital division. The only difference is the larger influence of brokerage commissions.
However, if we consider the risk of trading when the capital is divided we can conclude
that this method of trading has a great advantage!
To calculate the risk for the strategy with N = 2 (as an example) one can use an
equation
S = SQRT (1/4 * s^2 + 1/4 * s^2) = s * SQRT (1/2)
where SQRT is a notation for the square root function and s is the risk of a trade. It was
supposed that the trader buys one stock per day. For any N one can obtain
S = s / SQRT (N)
The larger N is, the smaller the risk of trading. This is related to dividing capital -
diversification. However, the more you divide your capital, the more you need to pay
commissions.
Mathematically, this problem is identical to the problem of buying more stocks every
day. The risk will be smaller, but the trader has to pay more commissions and the total return
can be smaller. What is the optimal capital division for obtaining the minimal risk to return
ratio? Let us consider an example, which can help to understand how to investigate this
problem.
29
Problem:
Suppose, a trader has $5,000 to buy stocks and he does not use margin. The brokerage
round trip commissions are equal to $20. The average return per trade (after taking into
account the bid-ask spread) is equal to R (%). The returns have distribution with the standard
deviation (risk) s. What is the optimal number of stocks N a trader should buy to minimize the
risk to return ratio?
Solution:
To buy one stock a trader can spend (5000 / N - 10) dollars. The average return R1 per
one stock will be equal to
R1 = 100% * [(5000 / N - 10) R/100 - 10] / (5000 / N) = 100% * [(5000 - 10N) R/100 - 10N] / 5000
This is also equal to the average return Rav of the entire capital because we consider
return in %.
Rav = R1
One can see that increasing N reduces the average return and this reduction is larger for
a larger value of brokerage commissions. The total risk S is decreased by 1/SQRT (N) as we
discussed previously.
S = s/SQRT (N)
The risk to return ratio can be written as
S/R = 5000*s/{SQRT (N)*100% * [(5000 - 10N) R/100 - 10N]}
The problem is reduced to the problem of finding the minimum of the function S/R. The
value of s does not shift the position of the maximum and for simplicity we can take s = 1. The
function S/R is not simple and we will plot the dependence of the ratio S/R for different values
of N and R.
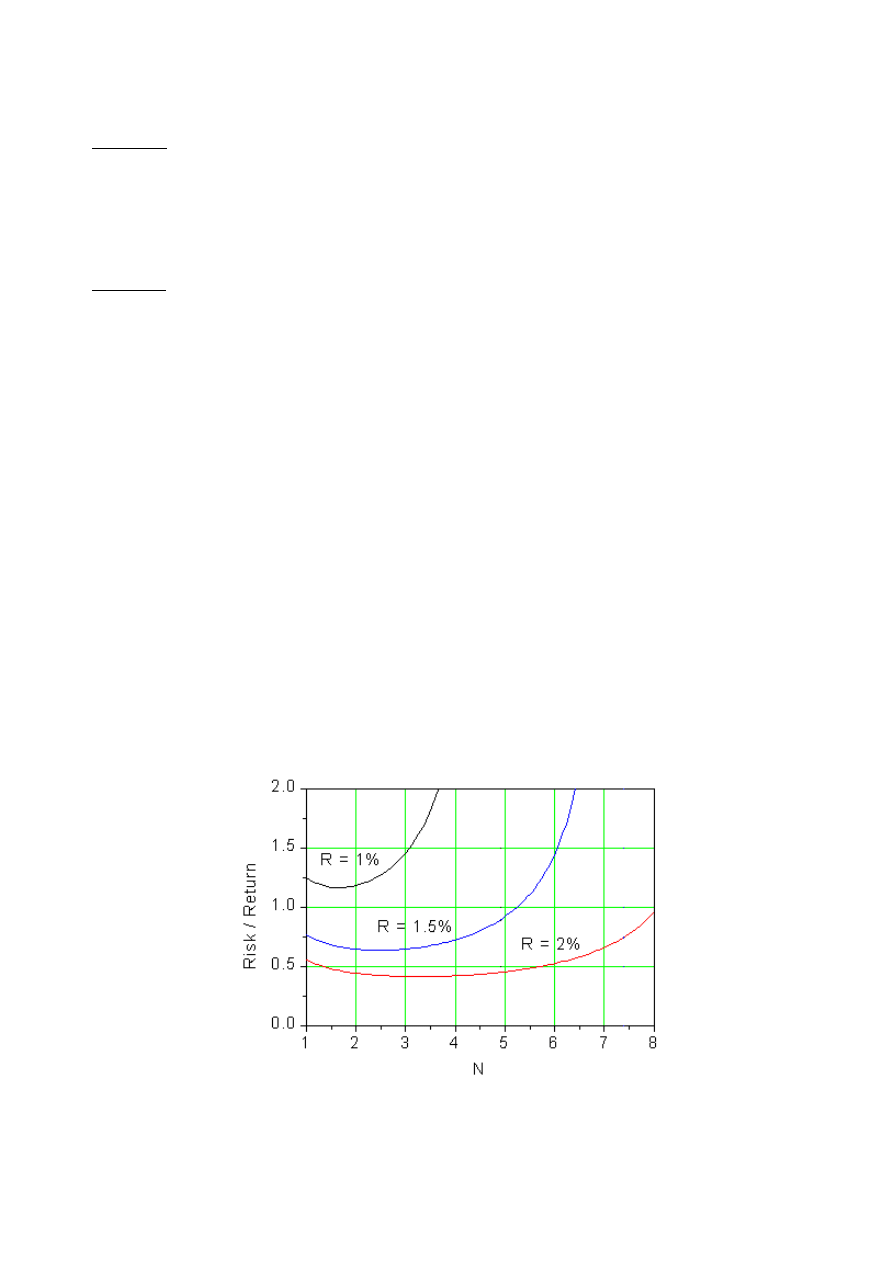
The risk to return ratio as a function of number of stocks
30
One can see that for the average return per trade R = 1% and for the $5000 capital the
optimal number of stocks when the risk to return ratio is minimal is equal to 1.5. Therefore, a
trader should buy 1 stock one day, 2 stocks another day, ... For R = 1.5% the optimal number
of stocks is equal to 2.5. If R = 2% then N = 3.5. The problem is solved.
Let us consider the "value of payment" for lower risk to return ratio.
Case 1. R = 1%
If a trader buys one stock he or she would pay $20 in commissions and the average
profit is equal to
(5000 - 10) * 0.01 - 10 = $39.9
In this case the optimal number of stocks to buy is equal to N = 1.5. The average round
trip commissions are equal to
$20 * 1.5 = $30
The average profit can be calculated as
(5000 - 15) *0.01 - 15 = $34.85
Therefore, a trader is losing about $5 per day when he buys 1.5 stocks. This is equal to
13% of the profit. This is the payment for lower risk.
Case 2. R = 1.5%
If a trader buys one stock he or she would pay $20 in commissions and the average
profit is equal to
(5000 - 10) * 0.015 - 10 = $64.85
In this case the optimal number of stocks to buy is equal to N = 2.5. The average round
trip commissions are equal to
$20 * 2.5 = $50
The average profit can be calculated as
(5000 - 25) *0.015 - 25 = $49.63
Therefore, the trader pays about $15 for lower risk. This is equal to 23% of the profit.
Case 3. R = 2%
If a trader buys one stock the average profit is equal to
(5000 - 10) * 0.02 - 10 = $89.8
In this case N = 3.5. The average round trip commissions are equal to
$20 * 3.5 = $70
The average profit is equal to
(5000 - 35) *0.02 - 35 = $64.3
Therefore, the trader pays about $25 for lower risk. This is equal to 28% of the profit.
You can ask why we should lose so much in profit to have lower risk? The answer is
simple. This is the only way to survive in the market with a small initial trading capital. After a
couple of months of successful trading your capital will be larger and the influence of
commissions will be much smaller.

31
PART 3
Table of Contents
1. Random walk and stop-limit strategy
2. Non-random walk and stop-limit strategy
3. How to make a profit in the non-random market
4. What can be wrong
5. Stops and real trading
Random walk and stop-limit strategy
One of the most popular stock market theories is the random walk model. It is assumed
that for short periods of time stock prices change randomly. So, probabilities of growth and
decline are equal. One of the most important theorems of the random walk model can be
formulated for the stock market as:
For any initial stock price and for any limit price the probability of hitting the limit price
is equal to 1.
From the first point of view making profit is very easy: buy stock, place the limit order
to sell above the stock price and wait. Sooner or later the limit will be touched and you can
make a profit.
This is wrong! There is no chance of making any profit in the random market. You
should remember that the stock price can also touch the level = 0 (or very low price) and the
game is over. To show how to analyze the trading strategies in the random market consider
stop-limit strategy. The stop level can be equal to zero, which corresponds to a game without
any stop.
S L
_______________|_________|___________|_________________
stop current limit
price
On the diagram, S and L are the differences between the current stock price and the
stop and limit order levels. The simplest strategy is to buy some stock and wait until the stock
price touches the stop or limit levels (prices). If the stop level is touched first - you are a loser.
If the stock price touches the limit level - you sell the stock with a profit and you are a
winner.
It can be shown that for this model the probability of touching the stop level can be
written as
P (S) = L / (S + L)
One can find the derivation of this equation in William Feller's book Introduction to
Probability Theory and Its Application. The probability of touching the limit level is equal to
P (L) = S / (S + L)
One can check that P (L) = 1 – P (S). The average return per trade can be written as
R = L*P (L) - S*P (S) = 0

32
This strategy gives zero average return in the case of zero commissions. It can be
shown that the variance of the returns (the squared standard deviation or "squared risk") is
equal to
s
2
= S * L
So, the larger the deviations of the stop or limit order levels from the current stock
price, the larger the risk of this trading strategy.
You can consider many other trading strategies but it can be shown that for random
walk price changes the average returns are always equal to zero for zero transaction costs. In
real life you will be a loser because of brokerage commissions and bid-ask spreads.
Non-random walk and stop-limit strategy
The situation changes when the probability of growth is larger than the probability of
decline. In this case the probability of touching the limit level can be higher than the probability
of touching the stop level and your average return is positive.
Consider a simple case. Suppose that the stock price is equal to $100 and the price is
changing by one dollar steps. As in the previous section let L and S be the deviations of the
limit and stop orders from the stock price. Denote by p the probability of stock price gain and
by q the probability of stock price decline. The sum of these probabilities is equal to 1.
p + q = 1
The probability of touching the stop level can be written as
P (S) = [1 - (p/q)^L] / [1 - (p/q)^(S+L)]
The probability of touching the limit level can be calculated from
P (L) = 1 – P (S)
The average return can be calculated from the equation
R = L*P (L) - S*P (S)
What are the optimal limit and stop orders in the case when p is not equal to q? The
next figure shows the results of calculation of the average returns per trade for various values
of the stop and limit orders.
33
Average return per trade for stop-limit strategy for two values of the growth
probability p. S is the deviation of the stop level from the current stock price in %
From this figure one can draw two very important conclusions:
- if a trader selects stocks with a growth probability larger than 50% then the average return is
positive and the stop levels must be far away from the current stock price to obtain the
maximal return.
- if a trader select stocks with a growth probability smaller than 50% then the average return is
negative and the stop levels must be as close as possible to the current stock price to minimize
losses.
There is an important theorem for the non-random walk model: if the limit level is equal
to infinity (no limit) then the probability of touching the stop level is equal to:
P = 1 if p <= q
P = (q/p)^S if p > q
Therefore, if p > q (bullish stock) there is a chance that the stop level will never be
touched. This probability is larger for larger S and smaller ratio q/p.
How to make a profit in the non-random market
It is hard to imagine that all stocks have a probability of growth exactly equal to 50%.
Many stocks have a growth probability of 55%, 60% and more. However, the stock market
does not grow with a high probability and this means there many stocks with low growth
probabilities 45%, 40% and less. The probabilities depend on technically overbought or
oversold conditions, good or bad fundamentals, interest from traders, etc. How can we apply
stop-limit strategy for this market to obtain a profit?
34
To answer this question, consider a simple case. Suppose that the "market" consists of
two stocks. One stock has the growth probability p1 = 0.55 and the second stock has the
growth probability p2 = 0.45. We buy the two stocks using equal amounts of money for each
stock. We also place stop loss orders and place mental limit orders to sell if we see some profit.
Denote by S and L the differences between the current stock price and the stop and
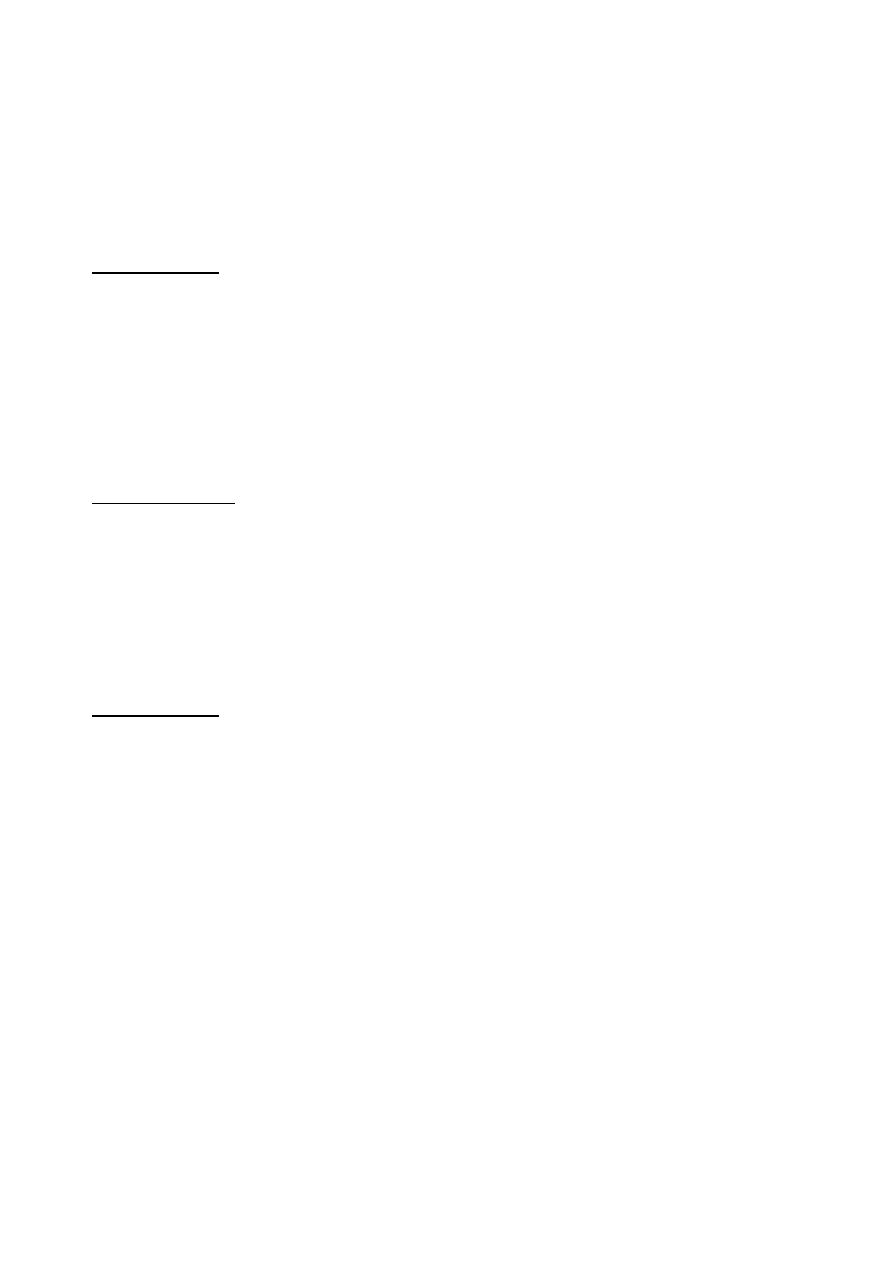
limit order levels. The next figure shows the average returns per trade for this strategy
depending on the levels of stop and limit orders.
The average return as a function of the levels of limit order for various stop loss order
levels. Details of this trading strategy are described in the text
It is important to note that using stop loss orders which are far away from the current
stock price together with close limit orders provide negative returns. The winning strategy is
using "tight" stops and large limit targets.
What can be wrong
From the previous section one can conclude that making money in the stock market is
quite easy. All you need is to have enough money to buy a dozen of stocks, place stops and
limits and wait for a nice profit. However, the majority of traders are losing money. What is
wrong?
In the previous section we supposed that stocks have growth probabilities, which are
stable. So, if p = 0.55 at the moment of purchase it will be equal to 0.55 even after sharp price
growth. This is wrong. One can find a stock with p = 0.55 and even larger but after a couple of
days this probability usually becomes close to 0.5 or even becomes less then 0.5, which is the
reason for price fluctuations.
The waiting time when your limit order will be executed can be very long. Many times
you will sell stocks early with smaller profit.
If you select stocks randomly, you will mostly select stocks with growth probabilities close to
50%. If we consider the model described in the previous section with p1 = 0.49 and p2 = 0.51
then this scheme will not work. Brokerage commissions and bid-ask spreads will eat up your
profit.
What can be done? You need to select stocks with high probabilities of growth and
optimize the stop order levels. In the next section we present the results of computer analysis
of the real market to show methods for developing a winning trading strategy.
35
Stops and real trading
Suppose you randomly select a stock, buy it and want to place a stop loss order to
prevent your trading capital from a large loss. What is the probability of touching your stop
order level? How does it depend on the stock volatility? How will the probability of touching stop
change in two days? Five days?
To answer these questions we have performed a computer analysis of the 11 years
history of 300 randomly selected actively traded stocks.
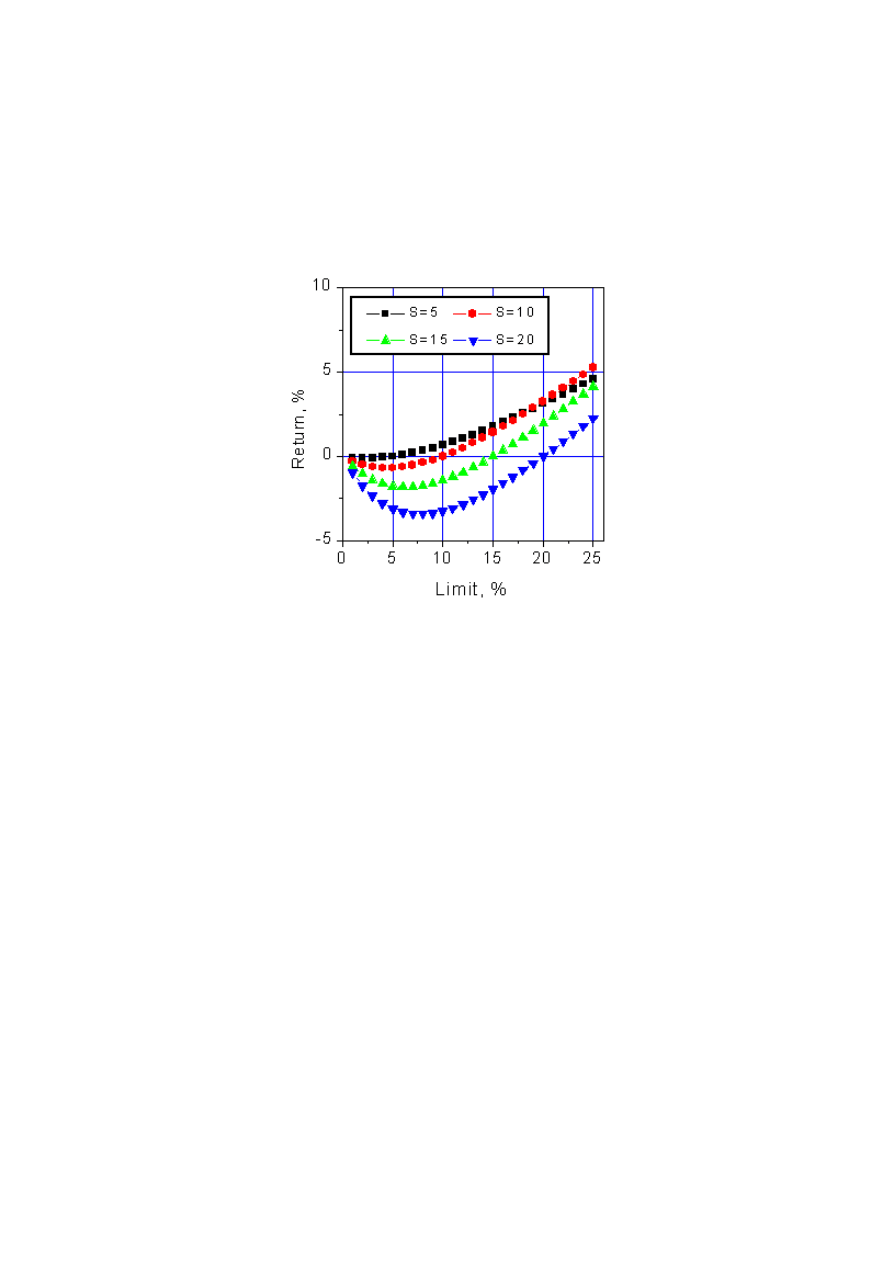
The stop order will be executed during a designated time period if the minimal stock
price for this period is lower than your stop order level. Suppose you bought a stock at the
market closing at the price CLO. Denote by MIN the minimal stock price during a certain period
of time. We will study the distribution of the difference
x = MIN - CLO
which characterizes the maximum of your possible loss on the trade for the considered period
of time. The next figure illustrates this statement.
The difference MIN - CLO characterizes the maximal loss from the trade during 11
trading days after the stock purchase
The average value of MIN - CLO depends on the stock's volatility. There are many ways
of defining the volatility. We will consider the average amplitudes of daily price change
A = <MAX - MIN> / 2
where the averaging has been performed for a one-month period. It is obvious that the average
value of <MIN - CLO> must depend on the amplitude A. We have shown that <MIN - CLO> is
approximately equal to negative value of A, i.e.
<MIN - CLO> = -A
where MIN is the minimal stock price during the next day after purchase. The correlation
coefficient of this linear dependence is equal to 0.5. For a longer period of time the value of
<MIN - CLO> can be much less than -A.
36
You cannot expect that placing a stop order at a level, which is slightly less than -A will
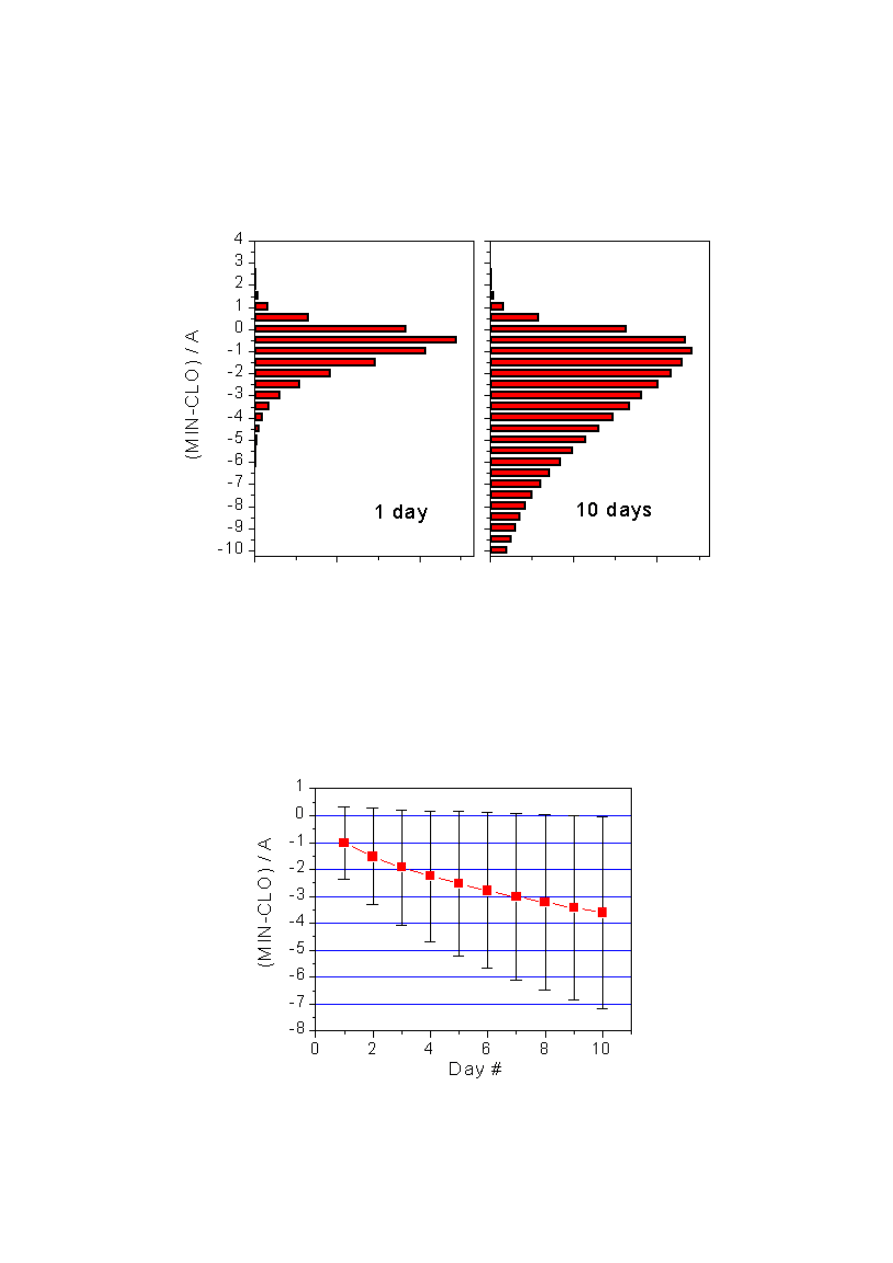
be safe enough to avoid selling the stock due to daily stock price fluctuations. The distribution
of x = MIN - CLO is rather broad. The next figure shows these distributions for one and ten
days after stock purchase.
Distribution of (MIN - CLO) / A for randomly selected stocks
One can see that the distributions of MIN - CLO are rather broad and non-symmetrical.
There is a little chance that the minimal stock price will always be higher than the purchase
price CLO. The distribution become broader for longer stock holding periods. The average
(mean of the distribution) becomes more and more negative. The next figure shows the time
dependence of the average values <(MIN - CLO) / A> and the standard deviations of the
distribution of this value.
37
Time dependence of the average values <(MIN - CLO) / A> and the standard
deviations of the distribution of this ratio
One can see a strong increase in the width of distribution with time.
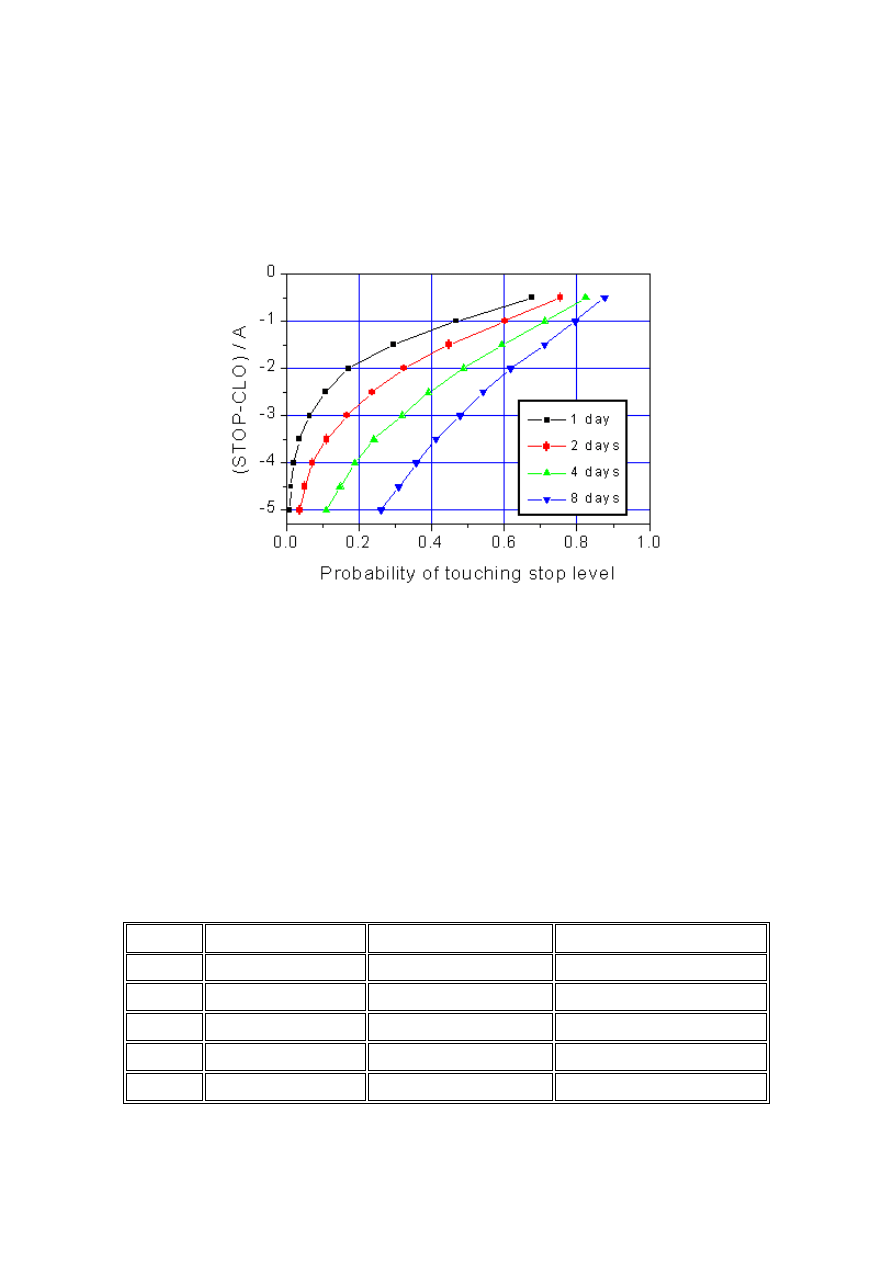
The crucial question is the probability of touching the stop levels. We performed the
calculations of these probabilities for various stop levels. The next figure presents the results.
Probabilities of touching stop levels during 1, 2, 4 and 8 days for randomly selected
stocks. A is the daily price amplitude defined in the text.
One can see that if the stop loss order is placed at -A level then the probability of
execution of the stop order during the next day after the purchase is equal to 45%. The
probability becomes equal to 60% if you hold the stock for two days.
If you hold the stock for 8 days then the probability of executing the stop order becomes
80%! If you place the stop at the -3A level than the probability of stop order execution remains
less than 50% even if you hold the stock for 8 days.
Using this plot you can calculate the average loss per trade. Let us offer you an
example.
Suppose you bought a stock at $100. The daily price amplitude is equal to $3. Suppose
you hold the stock for 4 days. To calculate the average loss due to execution of the stop order
you need to multiply the difference CLO - STOP by the probability of touching the stop level.
AVERAGE LOSS = (CLO - STOP) * PROBABILITY
Here is a table that can help you to select the optimal stop loss level.
STOP
CLO - STOP
PROBABILITY
AVERAGE LOSS
97 3
0.71
2.13
94 6
0.49
2.94
91 9
0.32
2.88
88 12
0.19
2.28
85 15
0.11
1.65
38
It is interesting that the worst decision you can make for this trade is placing the stop at
the $94 level (-6%). Your average loss is maximal at this point!
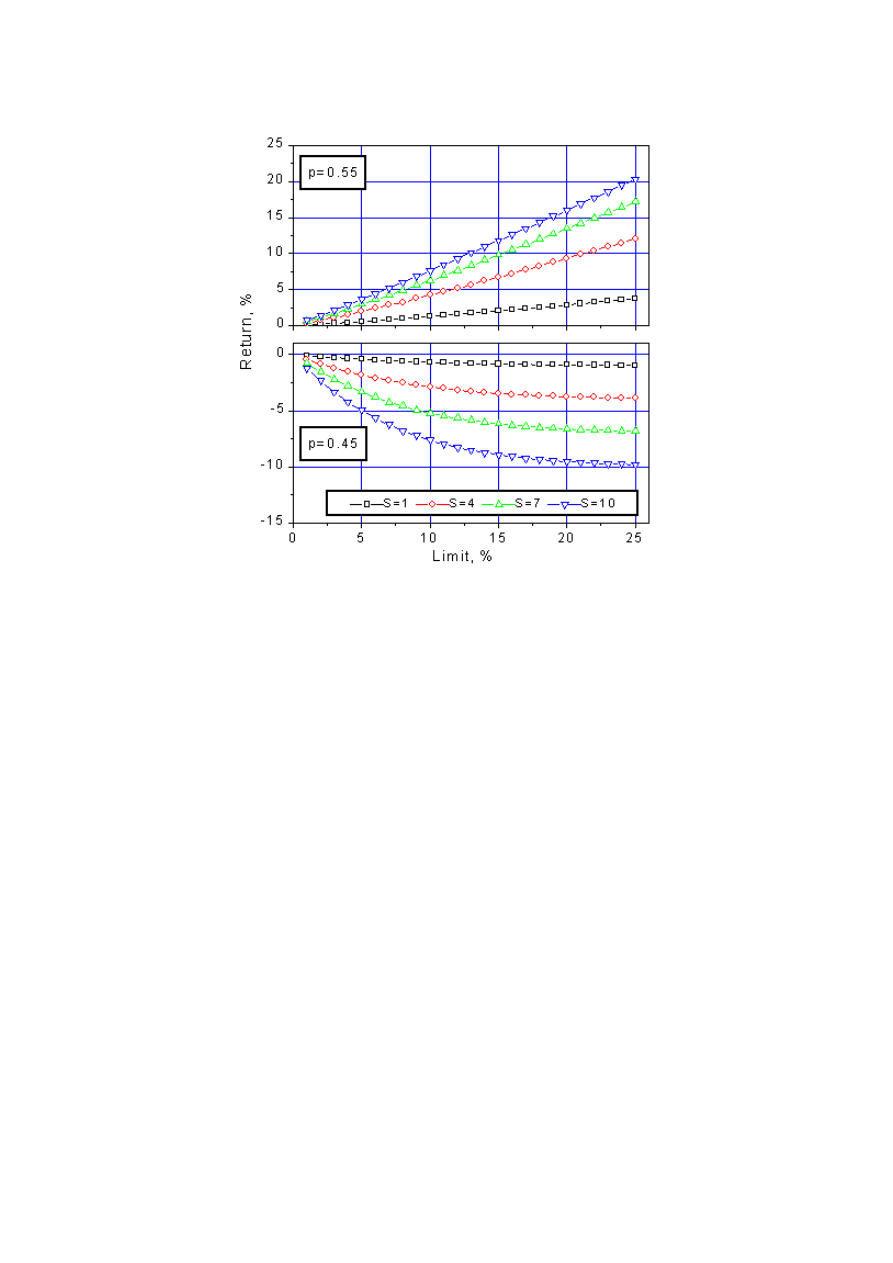
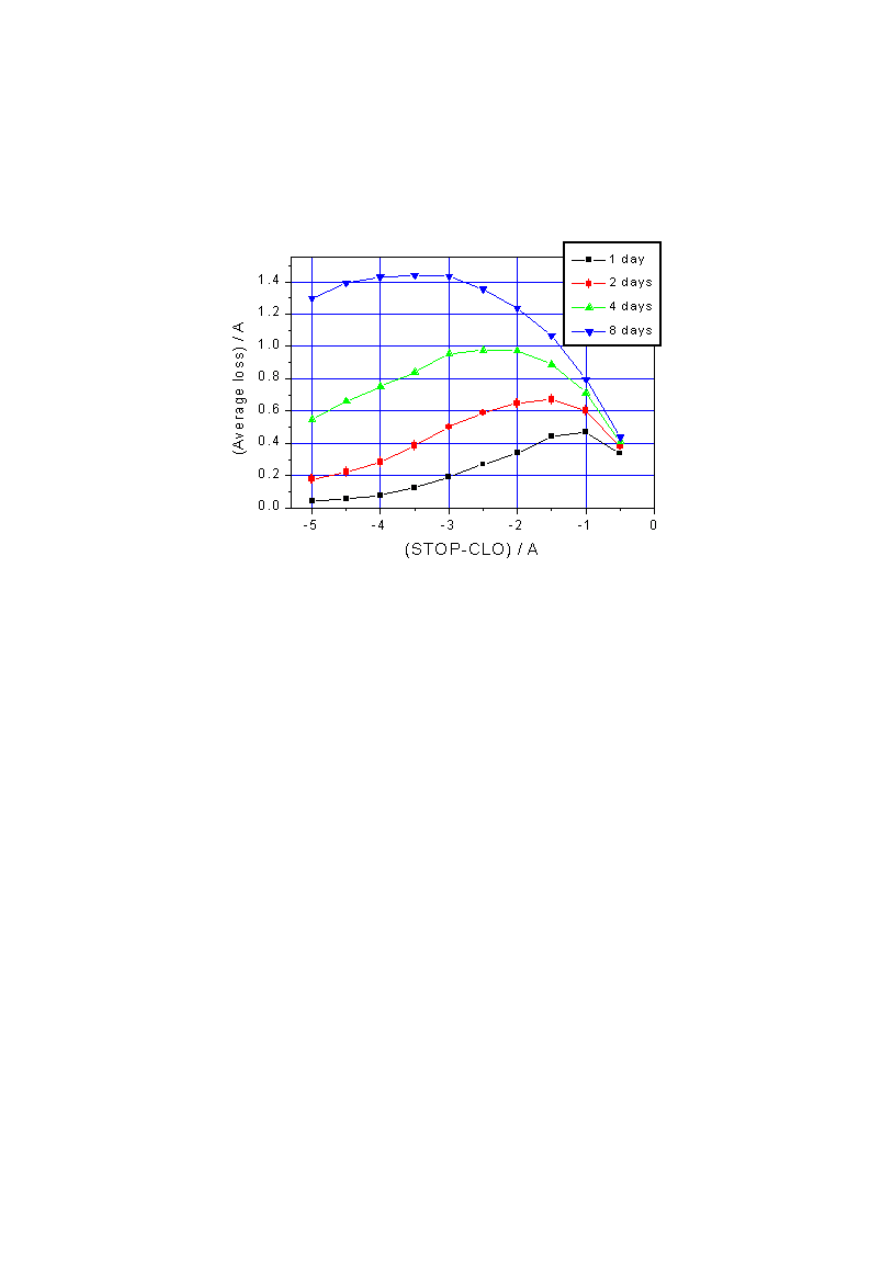
For practical purposes we publish the figure, which shows dependence of average loss
on the stop order level in A units. 1, 2, 4, and 8 days of holding stock are considered.
Dependence of the average loss on the stop order level in A units for 1, 2, 4, and 8
days stock holding
From this figure one can conclude that to minimize the average loss from the stop
orders you need to place stops either very close or very far away to the current price. Your
decision should be based on the number of days you are going to hold the stock.
One again: all calculations have been made for randomly selected stocks. For these
stocks the average growth probabilities are close to 50%. What will happen if we consider
specifically selected stocks when the growth probability is not equal to 50%?
Before starting to look at this important question we need to consider some technical
parameters, which are very helpful in stock selection. They allow to select stocks with the
highest growth probabilities and develop very profitable trading strategies. These parameters
have been introduced in our book Short-Term Trading Analysis. (See link to Text Level-2 on the
page http://www.stta-consulting.com). In the next sections we repeat these definitions.
39
PART 4
Table of Contents
1. Stock price trends
2. Deviation parameters
3. Returns of overbought and oversold stocks
4. Optimal stops for oversold stocks
5. Stop strategy for inexperienced traders
6. Stop strategy for an average trader
7. Stock volatility
8. Trading strategy using limit orders
9. Limits, stops and risk
10. Increasing average return
Stock price trends
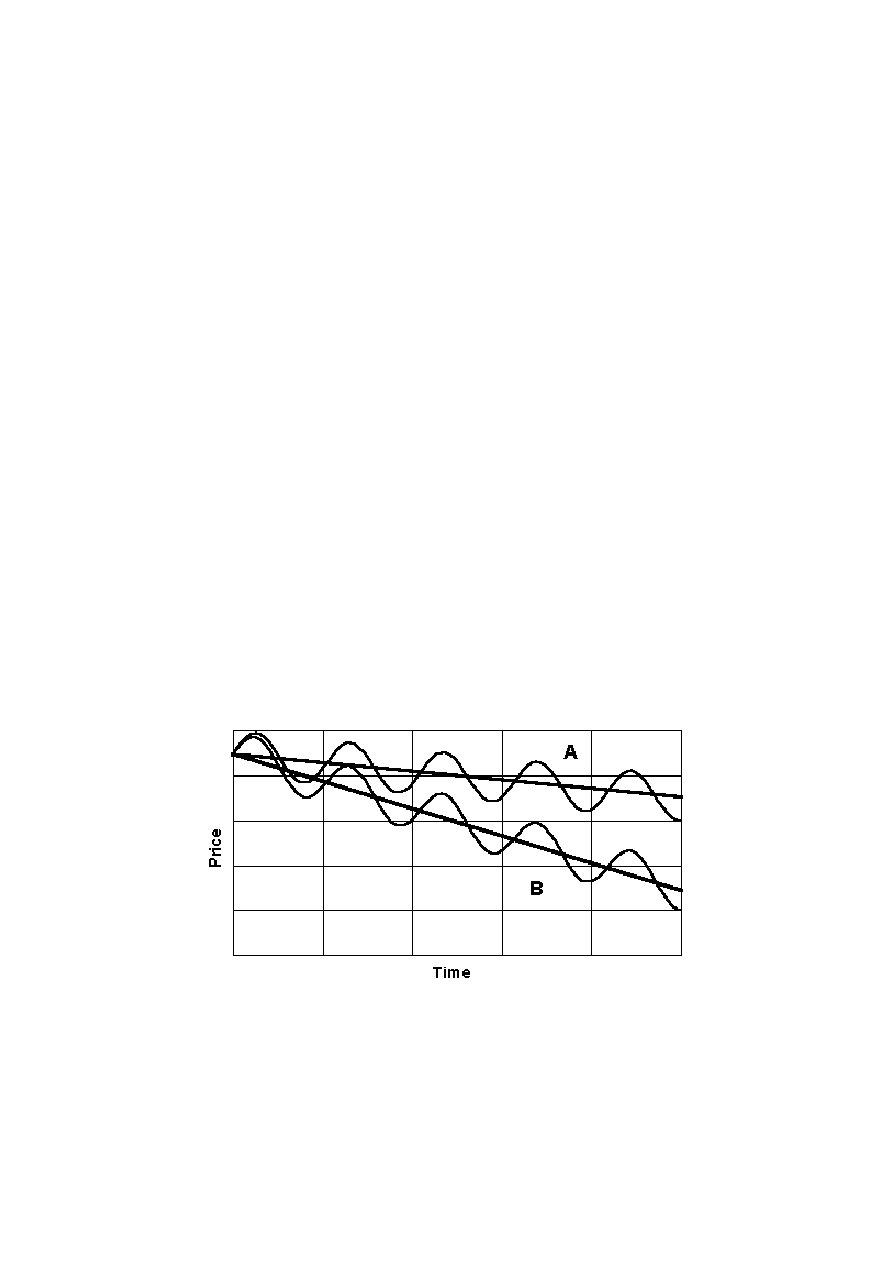
Trend is a simple intuitive term. If a stock price is increasing one can say the trend of
this stock is positive. If a stock is declining - the trend is negative. You can also say: a stock
has momentum. This is standard terminology. In many books on technical analysis of the stock
market you can read about momentum investments: buy stocks with the highest growth rates.
We need to define trends mathematically. The simplest method is using the linear fit of
stock price-time dependence.
Different trends
Consider N trading days and draw the fitting line L (i) through the points P
i
, where P
i
is
the closing stock price on the i-th day.
40
1 2 3 ... N
|___|___|___|___|___|___|___|___|___|___|___|___|___|___|___|___|
P
1
P
2
P
3
... P
N
The N-th day is the day of interest, the day of the analysis.
L (i) = A + Bi i= 1, 2, ..., N
The coefficient B is the slope of the fitting line. The slope can be considered as the price
trend of the stock. It characterizes the average daily price change (in dollars) during one day.
However, this value is not perfect when comparing trends of different stocks.
We will define a trend as the average price change in % during one trading day.
Mathematically this can be written as
Trend = T = <
∆
P/P> * 100%
This definition has one disadvantage. What price P should be used in this equation?
Using the current stock price is not a good idea. In this case, trend will be very volatile. It is
better to use a more stable price characteristic: the value of the linear fitting line on day #N -
the day of the analysis
P = A + B*N
The final equation for trend looks like
T = B/(A + B*N) * 100%
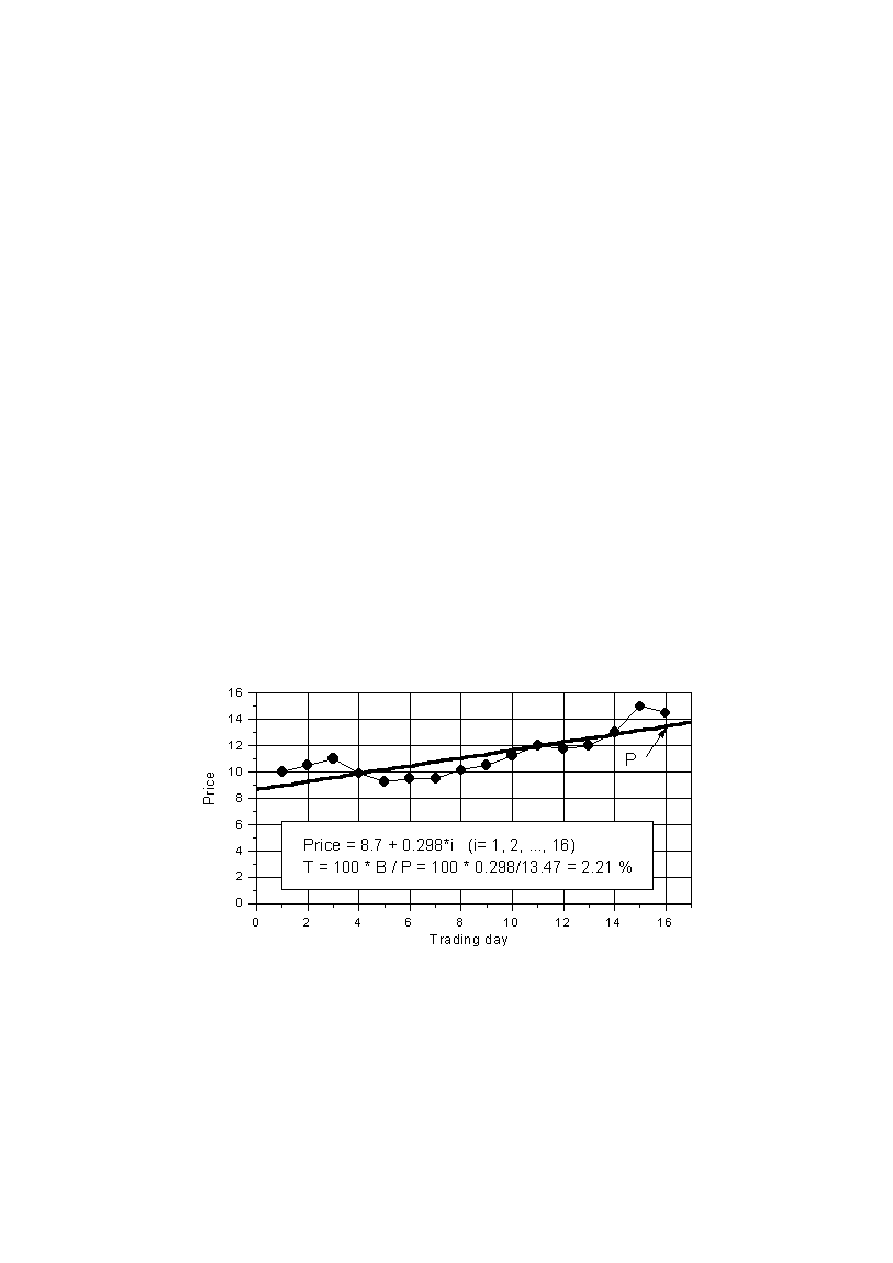
This equation we used in our computer analysis of the stock market. Such a definition of
trend substantially reduces the influence of price fluctuations during the final days. The next
figure shows an example of trend calculations for a 16 days time frame.
Example of stock trend calculations for a 16 days time frame
Another way to define the trend is by using logarithmic scaling. This is a good idea if you
study a stock's long history of price change, for example, from 1 to 100 dollars. For short-term
trading this change is unrealistic and we will keep things as simple as possible. So, we will use
simple linear fits, and trends are related to the slope of the fitting lines.
41
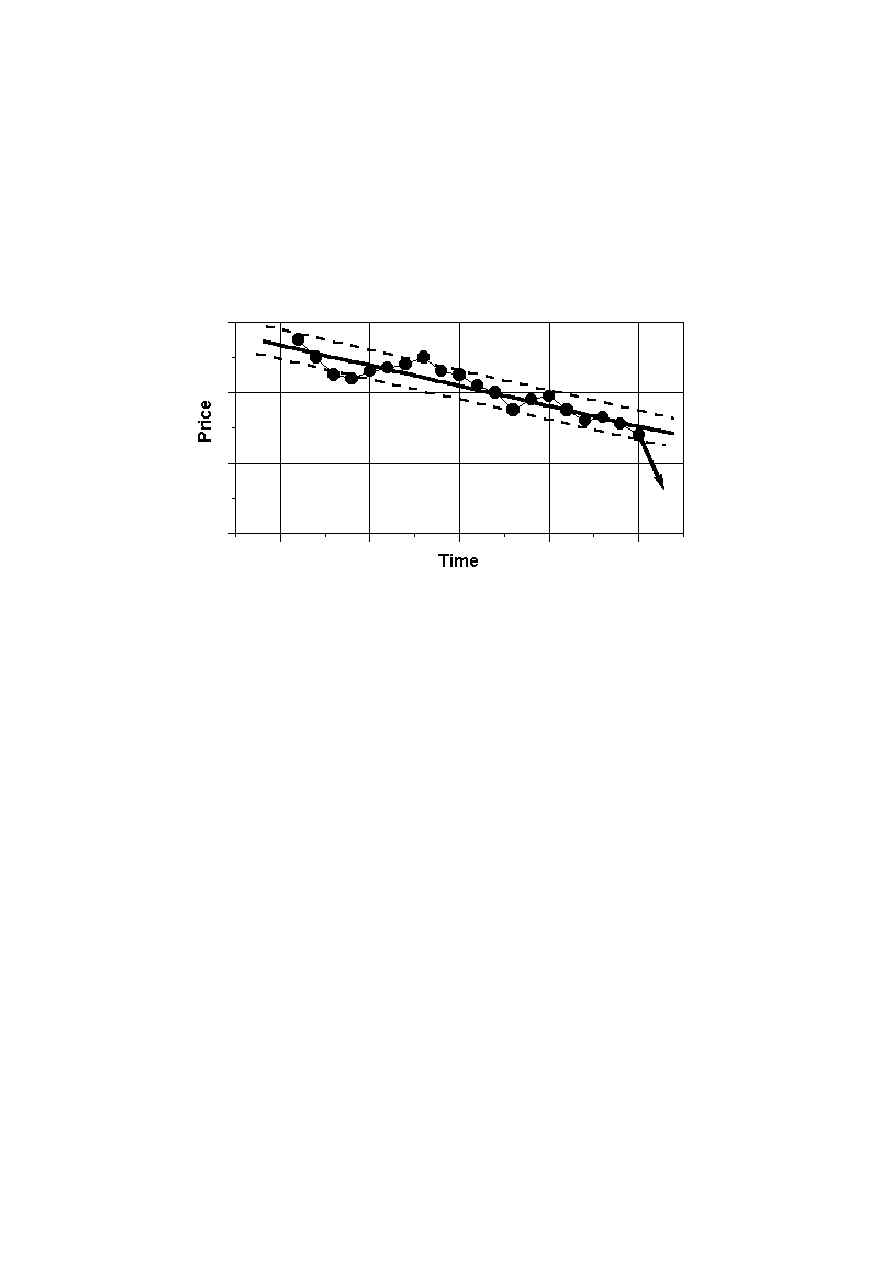
Deviation parameters (D-parameters)
The deviation or D-parameter, which will be defined here, is crucial for short-term stock
trading. Briefly, this is a characteristic of deviation of the current stock price from the fitting
line. This characteristic is important for the definition of oversold or overbought stocks.
A simplest idea of the definition of overbought and oversold stocks is the location of the
stock closing price relative to the trading range. We assume that when the stock price is in the
trading range, the stock performance is normal. If the price is out of this range, the stock may
be oversold or overbought.
Illustration for the definition of D-parameter
We define trading range as a channel between support and resistance lines. Usually,
these lines are determined intuitively from the stock price charts. This is not a good way if you
use the computer to analyze stock price performance. The line drawing depends on the trader's
skill and this method can be used only for representation of stock performance in the past.
Some traders use minimal and maximal prices to draw the support and resistance lines, others
like closing prices. There is a problem of what to do with points, which are far away from the
trading channel, etc.
We suggest using the standard deviation
σ
(
σ
2
=
<(
P
i
- A - Bi)^2
>
) for the definition
of the support and resistance lines. Mathematically this can be written as
Support line = A + Bi-
σ
Resistance line = A + Bi +
σ
where A + Bi is the equation of the linear fitting stock price time dependence; i is the day
number.
One should notice that the definition of the support and resistance lines depends on the
number of trading days being considered. You should always indicate what time frame has been
used.
To characterize the deviation of the stock closing price from the fitting line we have
introduced a new stock price characteristic: deviation, or D-parameter.
D = (P
N
- A - BN)/
σ
where
N
is the number of days which were used for linear fitting, P
N
is the closing
stock price on day #N (the day of the analysis), A and B are the linear fitting
parameters, and σ is the standard deviation of closing prices from the fitting line.
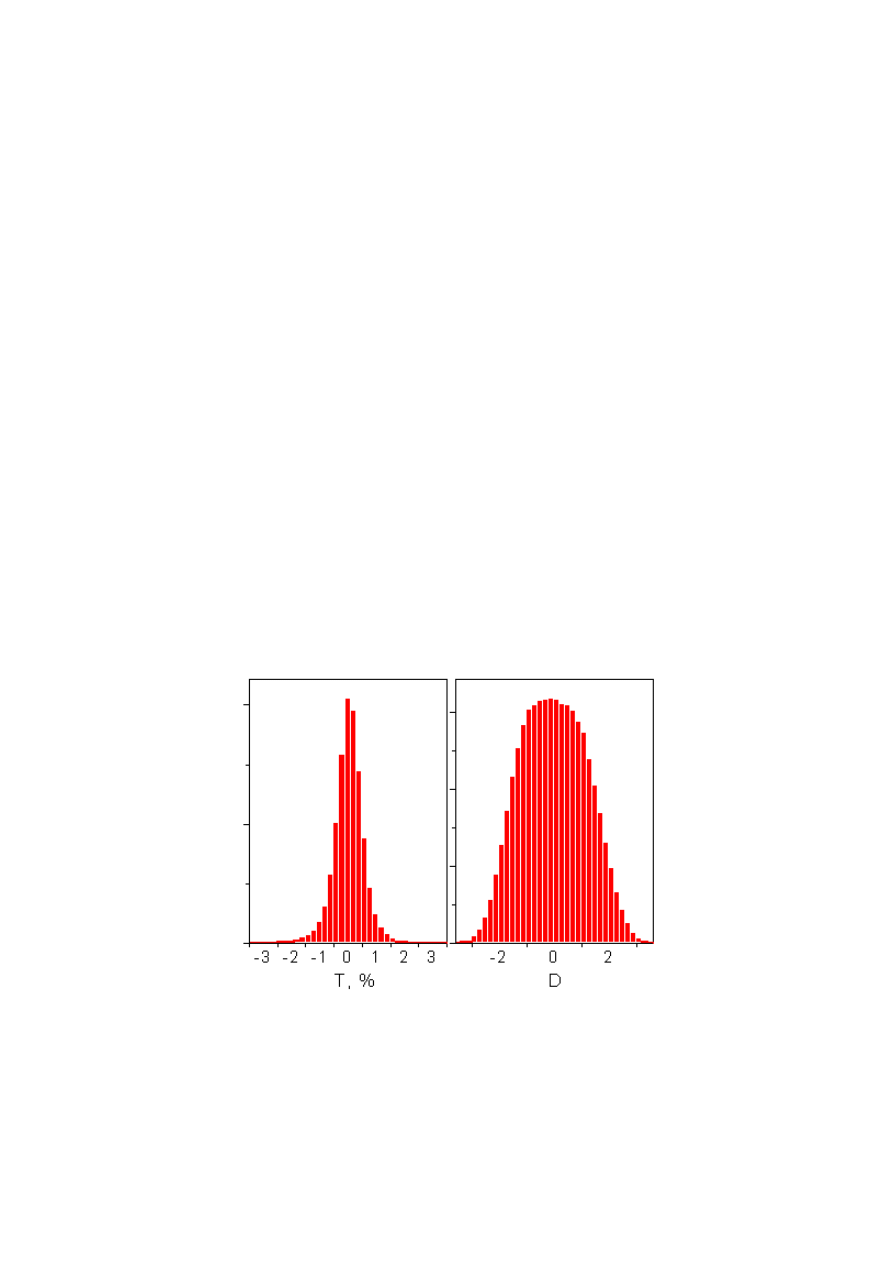
42
Let us explain the meaning of this equation. The difference (P
N
- A - BN) is the
deviation of the current stock price from the fitting line. D-parameter shows the value
of this deviation in σ units.
D < -1 the stock may be oversold
D > +1 the stock may be overbought
One can say the words "oversold" and "overbought" should be used together with the number
of trading days considered. So it more precise to say: the stock is oversold in the 30 days time
frame.
Here we have to note that comparison D with +1 or -1 is not optimal and depends on
the time frame. In the next section we will consider an approach, which allows us to calculate
the values of the D and T parameters so as to optimize the selection of oversold and
overbought stocks.
Returns of overbought and oversold stocks
To check the hypothesis about our criteria of overbought and oversold conditions one
needs to calculate the average returns for stocks for which the D parameter is negative or
positive. Here we have to note that oversold and overbought conditions become more
pronounced if one also considers the trends T. It is obvious (and this has been checked by
computer analysis) that if the trend is negative and D is also negative the oversold condition
becomes stronger.
How can we determine the range of the D and T parameters for oversold stocks? Let us
start with an analysis of distributions of these parameters. 16 days stock price history will be
considered in this section, i.e. for calculation of D and T one needs to download stocks prices
for the last 16 trading days. On the next figure the distributions of T (16) and D (16) are
shown. Later we will drop the (16) notation, but one needs to remember that for other
historical time frames the distributions have substantially different shapes.
Distribution of the deviations (D) and trends (T) calculated for a 16 days stock price history.
From the first point of view we need to consider stocks with very low values of T and D
to be sure that these stocks are oversold. Yes, theoretically this is true. Computer analysis
shows that the smaller T and D, the larger the probability of positive returns. Returns of stocks
with T < -1% and D < -1.5 are very large.

43
In practice, selecting stocks with such extreme values of deviations and trends yields
smaller annual returns. The number of these stocks is small a trader is able to find such stocks
only one or two times a month. As we analyzed in the previous sections, the annual return will
be very small.
It is more effective to select stocks with softer conditions but the probability of finding
such stocks is higher. We suggest defining oversold stocks as stocks for which
T < Tav - (Standard Deviation of T distribution)
D < Dav - (Standard Deviation of D distribution)
Correspondingly the overbought stocks are the stocks for which
T > Tav + (Standard Deviation of T distribution)
D > Dav + (Standard Deviation of D distribution)
We will study the average returns
Return = [CLO (N) - CLO] / CLO * 100%
where CLO is the closing stock price on the day of the analysis and CLO(N) is the closing stock
price on day #N after the day of the analysis. The next scheme illustrates our definitions.
|__|__|__|__|__|__|__|__|__|__|__|__|__|__|__|__a....|....|....|....|....|....|....|....|.
...|....|
16 day history for D and T calculations N=1 2 3 4 5 6 7 8 9
Here, a denotes the day of the analysis (N = 0). The distributions of the D and T
parameters are shown on the next figure.
The standard deviation of distribution of the D-parameters is equal to 1.185. For the T
parameter the standard deviation is equal to 0.558. Therefore, we will define oversold and
overbought stocks within 16 days frame as
Oversold stocks: T < -0.5581 and D < -1.185
Overbought stocks: T > 0.5581 and D > 1.185
The next figure shows the average returns of the oversold and overbought stocks as a
function of number N of days following the day of the analysis. For comparison we present the
average returns of randomly selected stocks
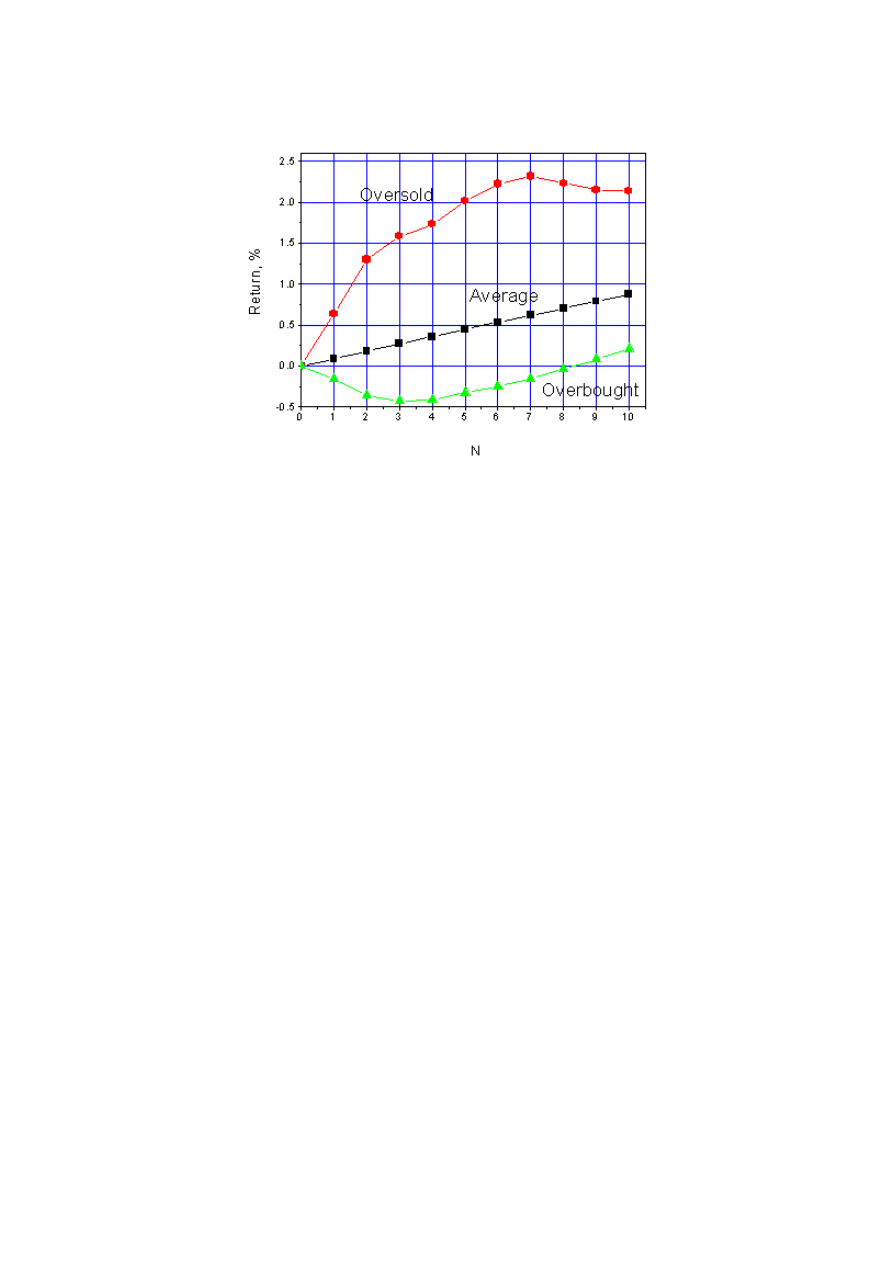
44
The average returns (CLO (N) - CLO) / CLO * 100% of the oversold and overbought
stocks as a function of number N of days following the day of the analysis. The
average returns of randomly selected stocks (black squares) are presented for
comparison.
Let us formulate some conclusions from this plot.
- The average return of randomly selected stocks is a linear function of time with a positive
slope. This is related to the bull market of the 90's, when the stock price history was studied.
- The average returns of the oversold stocks is much larger than the average returns of the
overbought stocks. This effect is more pronounced for short periods of stock holding.
- If a trader buys oversold stocks or sells short overbought stocks he(she) should not hold
these stocks for a long time. It is better to close position in three to five days and switch to
other stocks with higher potential short-term returns.
Optimal stops for oversold stocks
Now we are ready to consider an analysis of optimal stop levels for specifically selected
stocks. As an example we will consider oversold and overbought stocks within 16 day time
frame. Let us study the correlation of deviation (D) and trend (T) parameters with the minimal
stock price during N following days after the day of analysis.
The next figure presents the average values of (MIN - CLO) / A in the same way as we did
previously. Here, A is the average daily stock price change as we defined before. The open
squares show results for randomly selected stocks to compare these data with our previous
analysis.
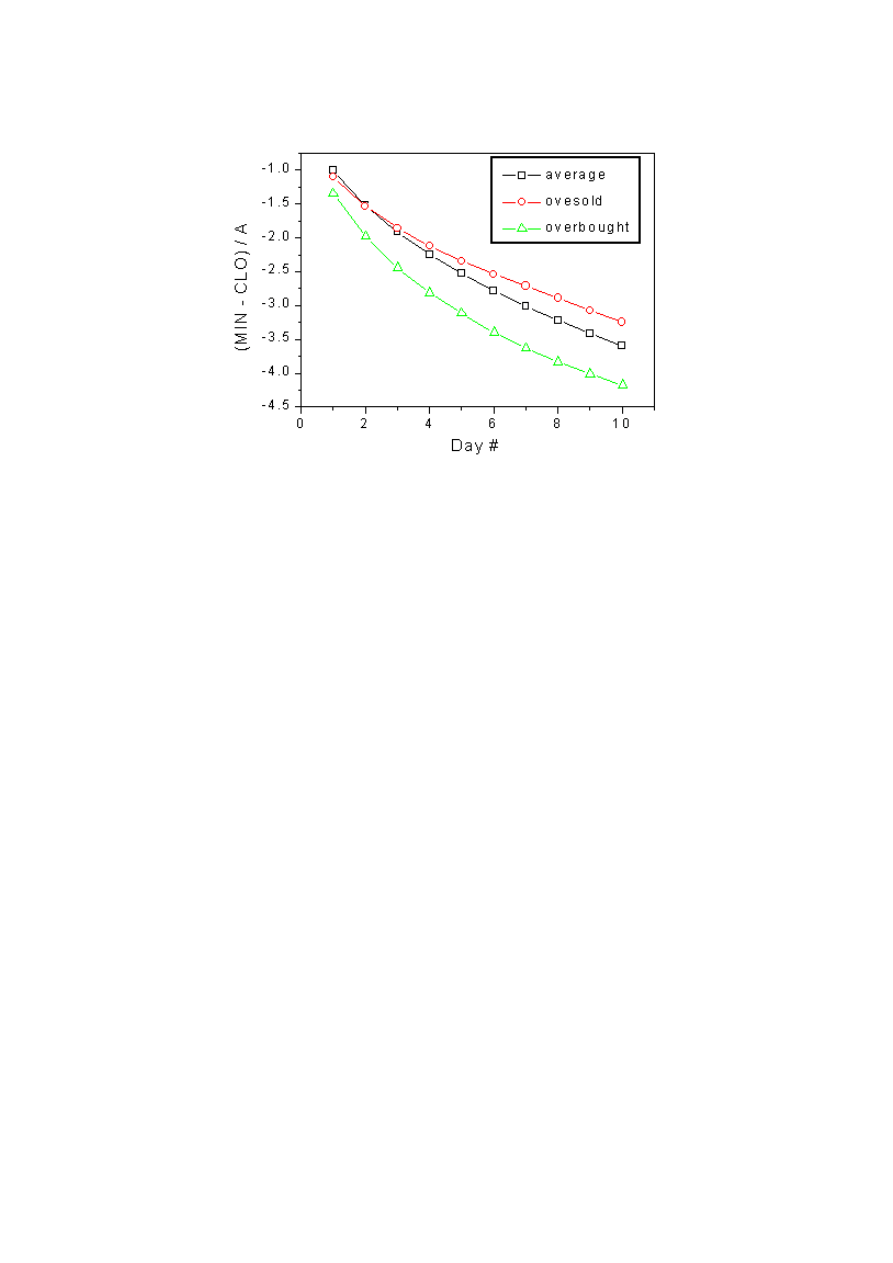
45
The average values of (MIN - CLO) / A for oversold and overbought stocks
within 16 days time frame. Open squares show results for randomly selected stocks
It is interesting to note that for oversold stocks the minimal prices for the first four days
after the day of the analysis are very close to the minimal prices of randomly selected stocks.
This is despite the large positive move of the closing price of these stocks.
This phenomenon is related to the higher volatility of oversold stocks during the first
days of trading after large drops in the stock price. Many people get upset over these stocks
and continue selling. On the other hand, bottom fishers buy these stocks, and in the end the
bulls win this game.
A trader should be prepared to overcome the difficulty of observing drops in stock price
during the competition between bulls and bears. One needs to have patience and wait for a
positive price move to sell the stock with a profit. Statistically such an approach is a winning
game, but one should remember that statistics always assume a distribution of return and
possible losses are likely.
Let us consider very important question: how can we place an optimal stop loss order to
minimize losses and to obtain a good average return? The next figure presents the results of
calculation of the average returns (they were defined previously) as a function of number of
stock holding days at various levels of stops. The parameter S is defined as
S = STOP - CLO
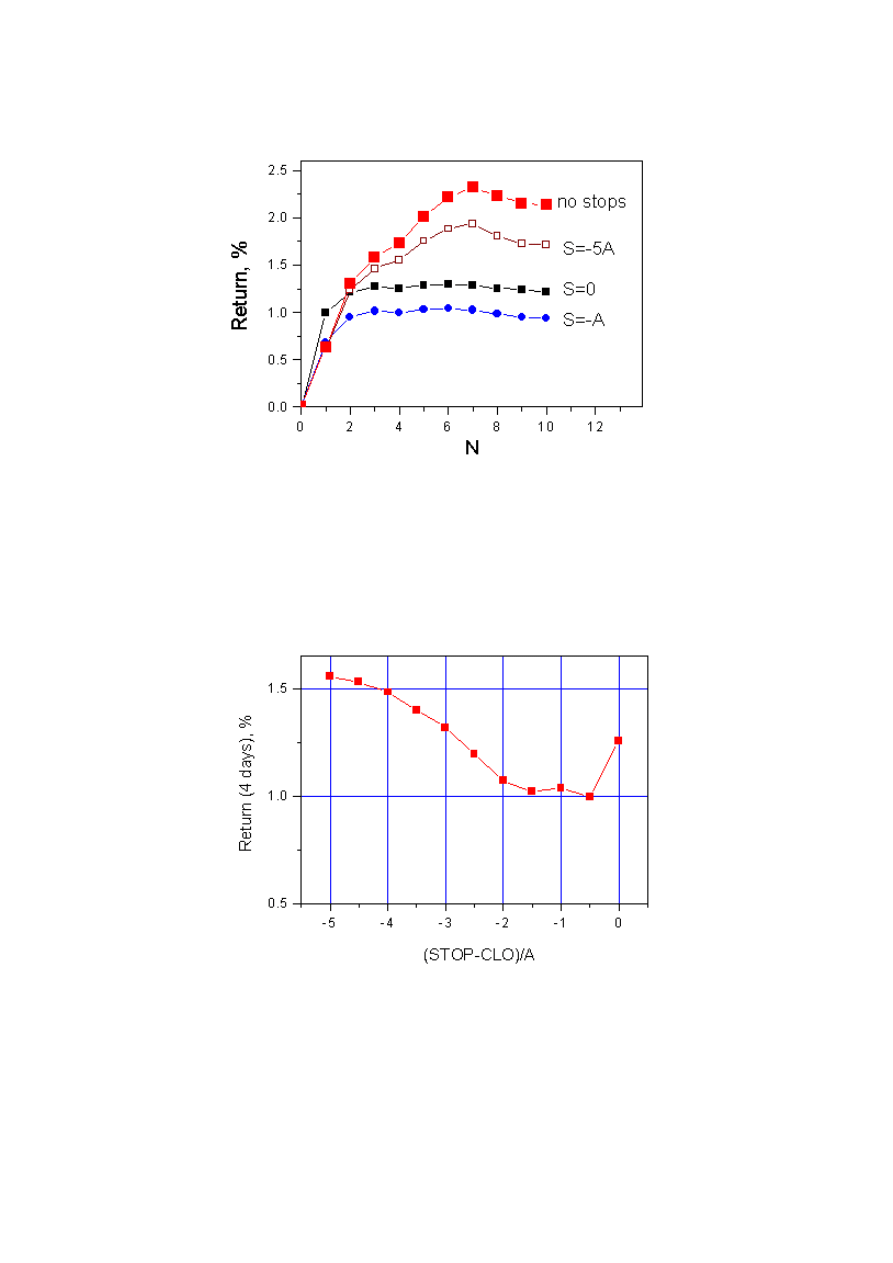
46
Average returns as a function of number of stock holding days at various levels of
stops. Oversold stocks are considered.
From this figure one can conclude that for oversold stocks using any stops decreases the
average return. The worst thing what a trader can do is place stops close to the -A level. If a
trader holds stocks for a period less than 4 days it is worth considering stops, which are placed
very close to the CLO price. The change of the average return is not so significant. The next
figure presents the average returns as a function of levels of stops for a four days stock holding
period.
Average returns as a function of levels of stops for a four days stock holding period
One can see that the best returns are obtained when a trader uses stops, which are
located very far away from the purchase price or trades stocks without any stops.
This contradicts the popular opinion that profitable trading without stops is impossible.
How one can handle trading without stops? It is possible only in one case: the trading capital
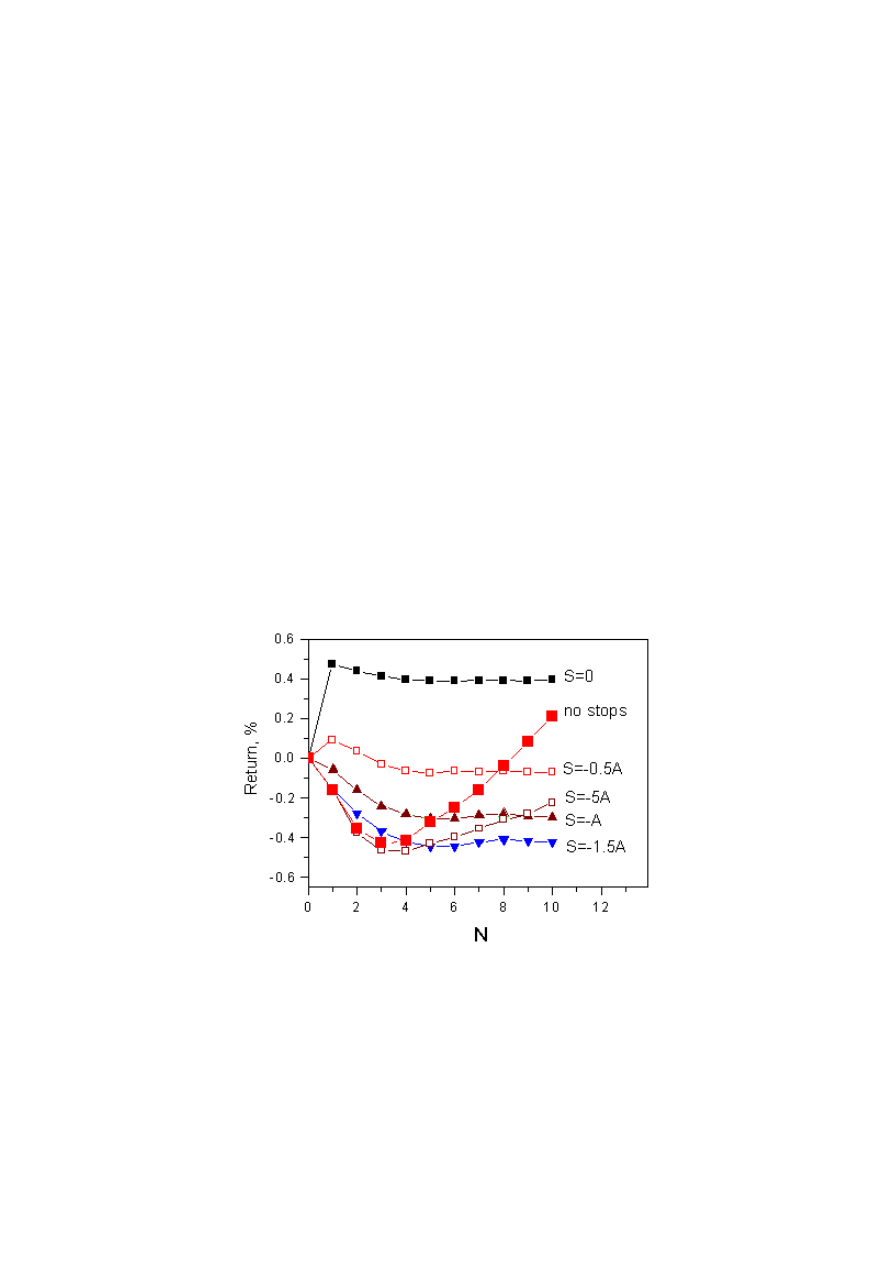
47
must be large enough to be able to buy many stocks. In this case, even a 50% price drop
of one or two stocks will not kill a trader. Otherwise, trading without stops is financial suicide.
For a small capital - one which allows holding two to four stocks in the portfolio it is
better to use stops and place them either very close to the purchase price or lower than -5A
level. The average return will be less, but the trader will survive.
Let us repeat once again: trading stocks without stops is possible only for experienced
traders, who are very sure about their stock selection. They must use well-tested strategy and
buy many stocks so as to minimize the risk of a sharp drop in their trading capital.
What happens if a trader make mistakes and buys stock with very low growth potential?
This can happen due to a bear market, choosing a wrong industry, or just bad luck. This
problem will be considered in the next section.
Stop strategy for inexperienced traders
Let us suppose that a trader is a novice in the stock market. He is trying to beat the
market by using a trading strategy, which seems to be profitable because it allows him to trade
like many other traders. This is a typical mistake. The majority of traders are losing money and
any strategy, which is similar to other people's strategies, will not be very profitable.
The problem is how to survive in the stock market game while testing a new strategy?
Suppose that our novice uses popular momentum strategy: he buys stocks with the
highest price rise during the last days of the rise. We can simulate such a strategy by
consideration of overbought stocks. As in the previous sections we will consider a 16 days
history period for calculation of the D and T parameters.
The simplest way to survive in the stock market is by using stop loss orders. The next
figure shows average returns as a function of number of stock holding days at various levels of
stops. The no-stop-loss-orders strategy is shown for comparison.
Average returns as a function of number of stock holding days at various levels of
stops. Overbought stocks are considered
Let us list the conclusions that can be drawn from analysis of this figure.
- For very short periods of stock holding (one to four days) using stops does not earn returns
worse than the returns from the no-stop-loss-orders strategy.
- The best results are obtained using very tight stops.
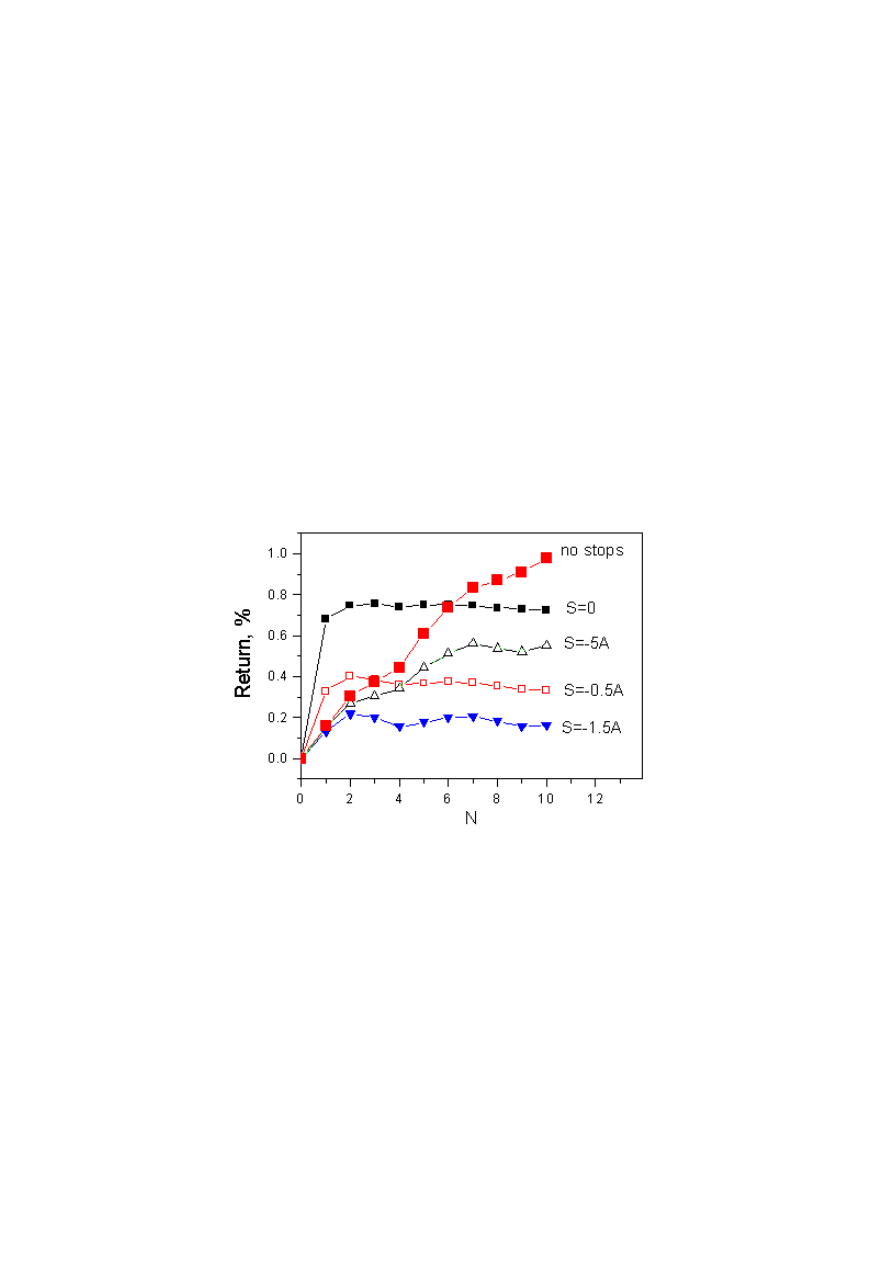
48
- For longer periods of stock holding closer stops (about 1 - 2 A) earn returns worse than those
of the no-stop-loss-orders strategy.
- If you do not like tight stops and you are going to hold stocks for a long period of time then it
is better to use stops which are lower than -5A.
Let us suppose that our novice has got some experience, has understood that his strategy was
bad, and now his understanding allows him to choose stocks with about 50% probability of
growth. This case will be considered in the next section.
Stop strategy for an average trader
The case, which we are going to consider, is close to the stop-limit strategy for a
mixture of stocks with both high and low probabilities of growth. This problem was theoretically
considered in one of the previous sections. How can we apply this strategy in practice?
It is hard to place simultaneously the limit and stop orders for one stock. So, we will
consider a strategy, which assumes selling stocks after N days of holding. The problem is the
determination of the optimal stops to cut stocks with low probabilities of growth. Consider the
average returns of the strategy as a function of stop levels. We will assume that 50% of
selected stocks are oversold and 50% of the stocks are overbought. This is a good model for
the average stock selection.
Average returns as a function of number of stock holding days at various levels of
stops. A mixture of oversold and overbought stocks is considered
The figure is very similar to the figure in the previous section. The largest return can be
obtained if the trader uses very tight stops. The results in this case will be much better than the
return without using any stops. Stop orders that are far away from the purchase price produce
better returns than stops around the -A level.
Stock volatility
All previous results have been presented via the daily stock price amplitudes A, which
can be a characteristic of stock volatility. You probably know many other definitions of this
parameter. In this section we will consider methods of calculations of stock volatility and will
show that stock volatility is a function of the T and D parameters.
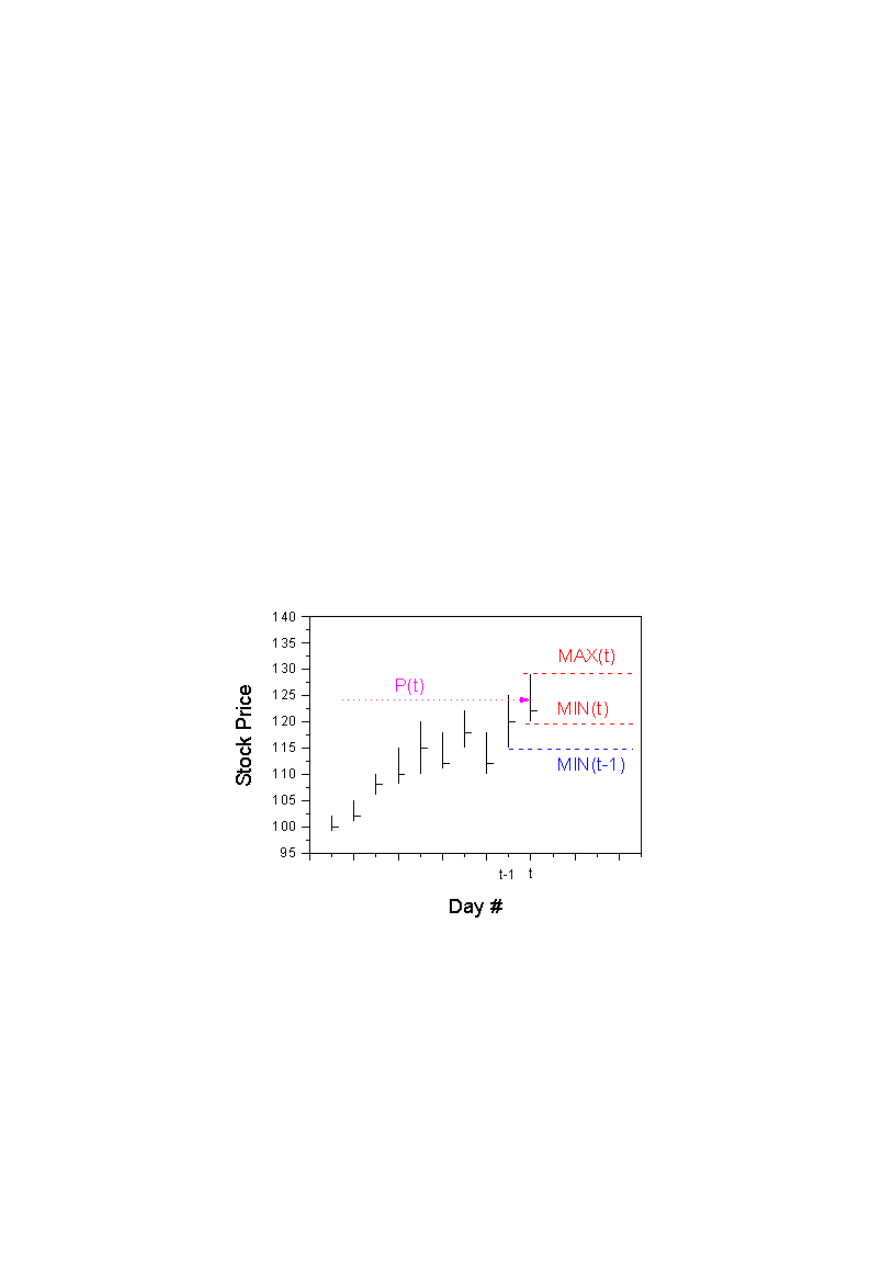
49
There are hundreds methods of defining the stock volatility. The amplitude A is
measured in dollars, and it is better to introduce a new parameter to compare one stock to
another. Let us define the stock volatility in two different ways
V1 (t) = (MAX (t) – MIN (t))/(MAX (t) + MIN (t)) * 100%
V2 (t) = <(MAX (t) – MIN (t-1))/(MAX (t) + MIN (t)) * 100%>
where V1(t) and V2(t) are stock volatilities referring to day t. V1(t) describes relative
volatility during the day t and V2(t) describes relative volatility during days t and t-1. After
averaging one can write
V1 = <V1 (t)>
V2 = <V2 (t)>
where the angular brackets <...> denote the averaging over some period of time. In this work
we perform one month averaging. The first parameter V1 (t) can be also written via the daily
amplitude A (t).
V1 (t) = A (t) / P (t) * 100%
where P (t) is the average price during trading day t
P (t) = (MAX (t) + MIN (t)) / 2
The next figure illustrates these definitions.
Illustration for the definitions of stock volatilities
The values of V1 and V2 are very close to each other. The next figure shows V1 and V2
for 250 stocks.
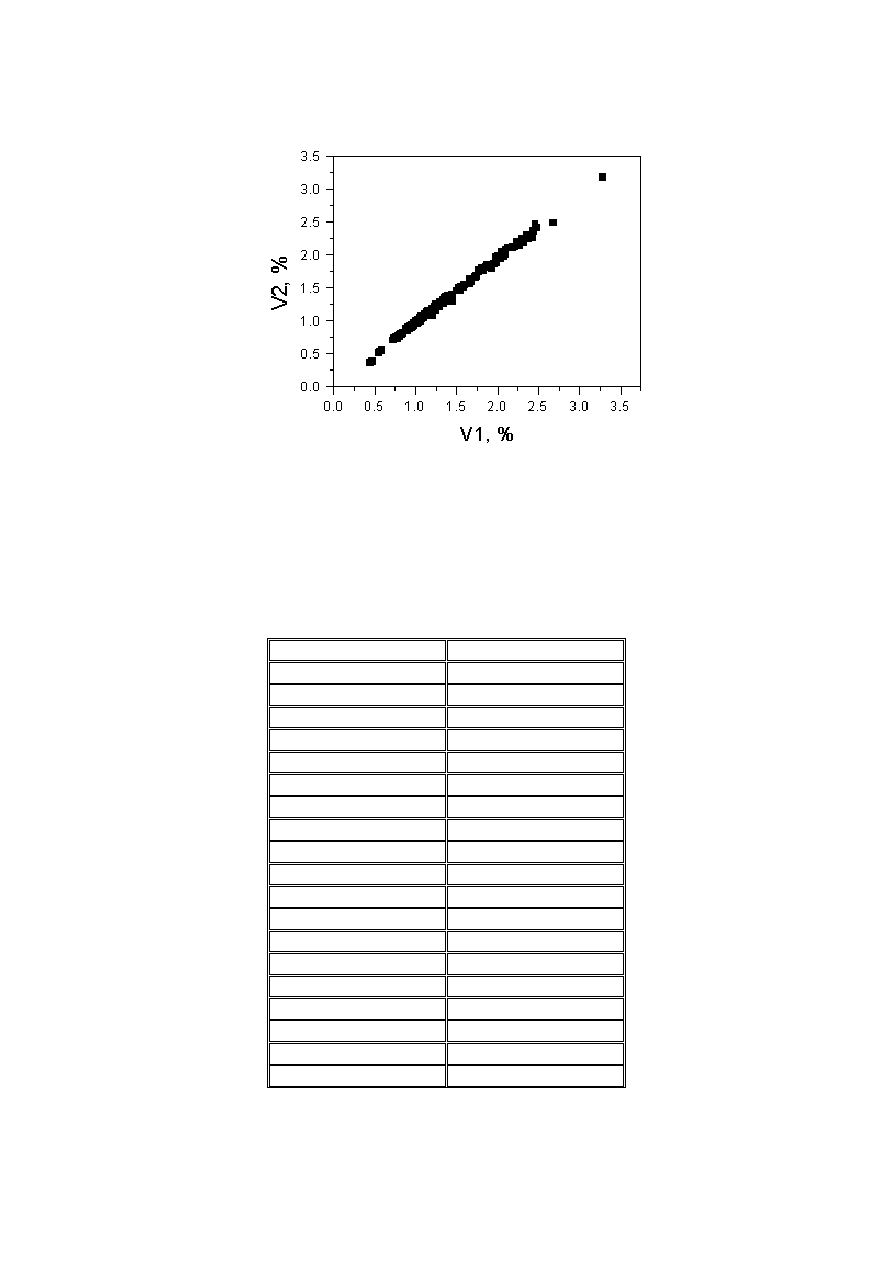
50
Illustration of similarity of V1 and V2
One can conclude that the daily amplitude A, or the relative volatility V1 which is related
to this value, is a good characteristic of the short-term stock volatility. There many other
definitions of stock volatilities related to the closing prices only. However, for our purposes, for
which we need to study stop orders, it is necessary to consider minimal and maximal daily
prices.
To give you some idea about the values of the daily amplitudes we will show the values
of V1 for some active stocks. The next table shows stocks with large V1 values.
Ticker
V1, %
VTSS 3.27
ASND 2.67
QCOM 2.48
DIGI 2.47
KLAC 2.46
LSI 2.46
XLNX 2.43
AOL 2.43
PSFT 2.37
MU 2.33
DELL 2.32
QNTM 2.30
EMC 2.27
PMTC 2.26
NXTL 2.23
AMAT 2.20
ORCL 2.18
COMS 2.18
CHRS 2.09
51
BGEN 2.08
BBBY 2.08
AMD 2.07
SUNW 2.05
INGR 2.04
LLTC 2.03
NOVL 2.02
The next table shows stocks with small V1 values.
Ticker
V1, %
DOW 0.88
SBC 0.88
AIG 0.88
CHV 0.85
DOV 0.84
AIT 0.83
GIS 0.82
AN 0.82
XOM 0.82
GSX 0.80
MHP 0.80
CLX 0.79
MMM 0.79
TX 0.79
SBH 0.77
GRN 0.77
MMC 0.76
VO 0.76
SPC 0.75
ED 0.74
BTI 0.72
RD 0.58
BBV 0.57
BP 0.56
SC 0.54
AEG 0.44
To use this table to estimate the daily amplitude A one needs to multiply the V1 value
by the current price and divide the result by 100.
However, using average values of V1 can be dangerous if a trader is going to buy
oversold or overbought stocks. The volatilities of these stocks are higher. The next figure shows
the average values of the relative volatilities V1 calculated for randomly selected stocks and for
overbought and oversold stocks.
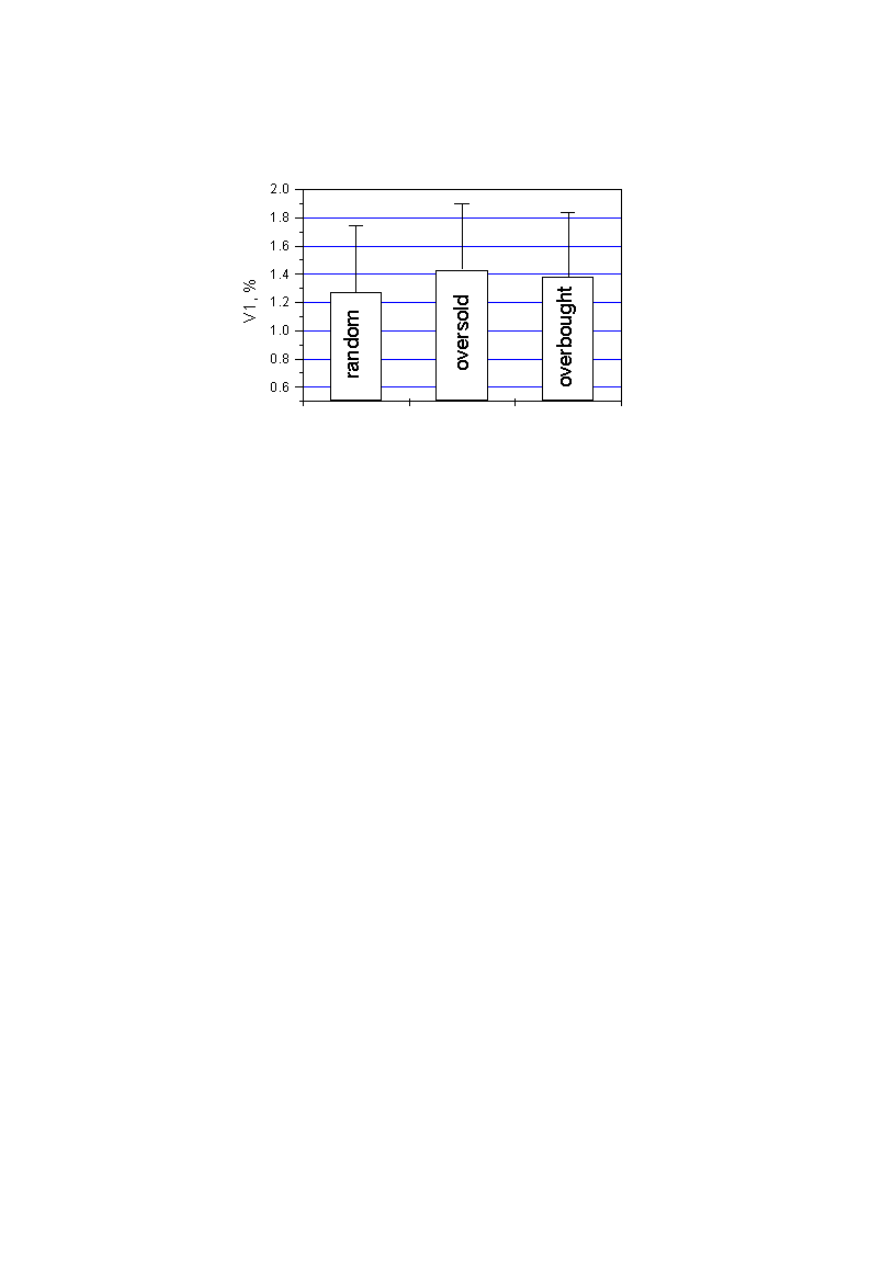
52
The average values of the relative volatilities V1 calculated for randomly selected
stocks and for overbought and oversold stocks. Vertical bars show the standard
deviations of the distributions of V1
One can see than the maximal relative volatilities V1 are observed for oversold stocks.
Trading strategy using limit orders
Using limit orders to sell is very popular among novices. They buy stocks, place the sell
limit order and wait for the stocks to touch this limit. Unfortunately, this is a not a good
strategy. There is a non-zero probability of complete disaster. The wait for the limit to be
touched can be very long and during this time the stock price can go to very low levels. Using
the non-random walk model it can be shown that the limit order will never be executed with
probability P
P = (p/q)^L if q > p
Let us remind the reader that p is the growth probability and q = 1 - p is the probability
of decline. L is the difference between the limit order level and the current stock price. Details
of this model have been considered previously.
Using limits can reduce the average returns per trade even in the case of buying oversold
stocks. The next figure shows the results of calculating the dependencies of average returns on
the number of stock holding days for different levels of limits L.
L = LIM – CLO
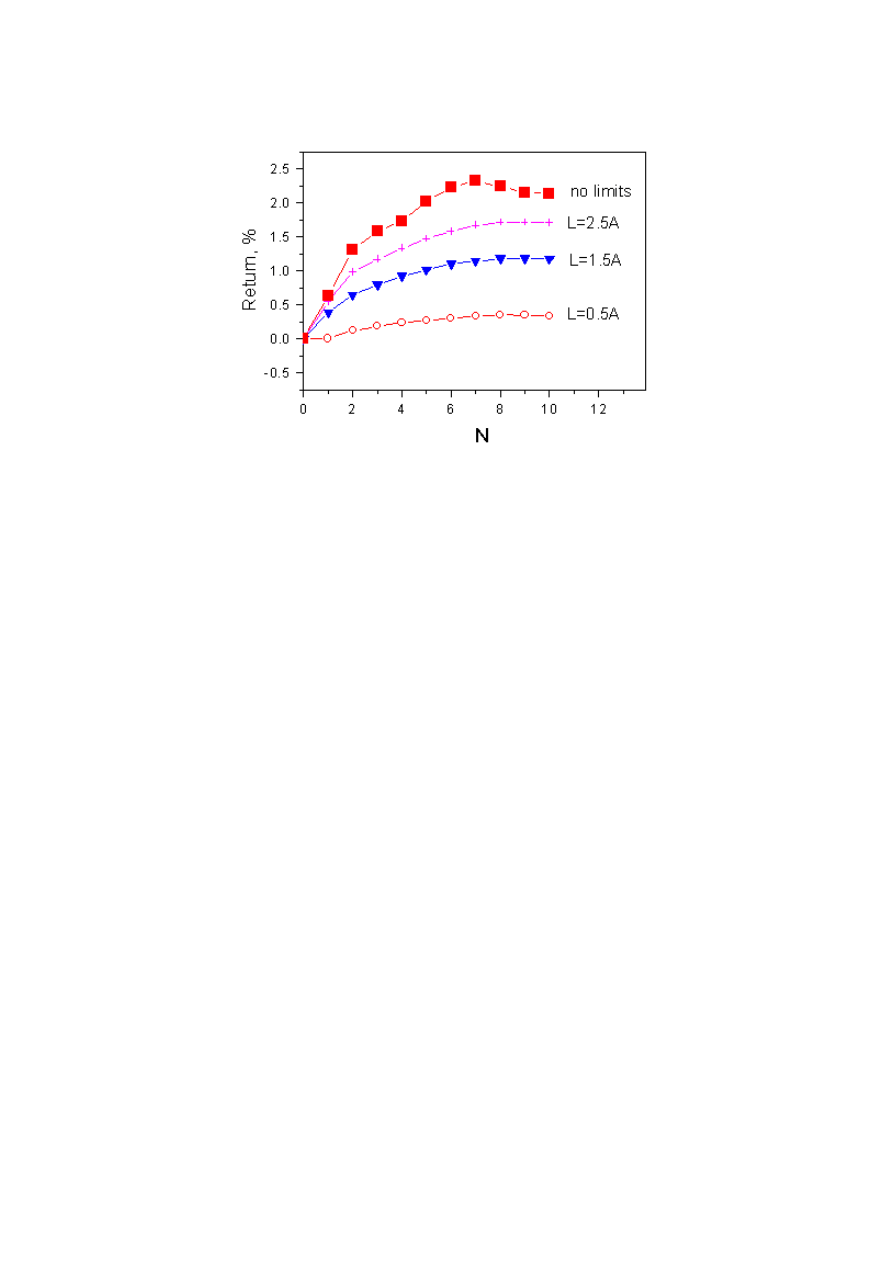
53
The dependencies of average returns on the number of stock holding days for
different levels of limits
One can see that the worst results are obtained when a trader uses limits, which are
very close to the price of purchase.
Limits, stops and risk
We have finished our short discussion of the influence of stop and limit orders on the
average return per trade. However, we can be asked: well, limits and stops reduce the average
returns. How about the risk? Maybe it is better to have a smaller return but smaller risk.
We agree with this argument. The only point that needs to be clarified is the relationship
between the average return and the risk. We mentioned earlier that the best trading strategy is
the strategy with the minimal risk/return ratio. In this section we consider the influence of
stops and limits on this ratio.
The trading of oversold stocks will be considered as an example. We calculated the
average returns, risk (standard deviation of the return distribution) and the risk/return ratios
for various stop and limit values for a four days stock holding period. The next figure shows
the result of these calculations for the sell-limit strategy described previously.
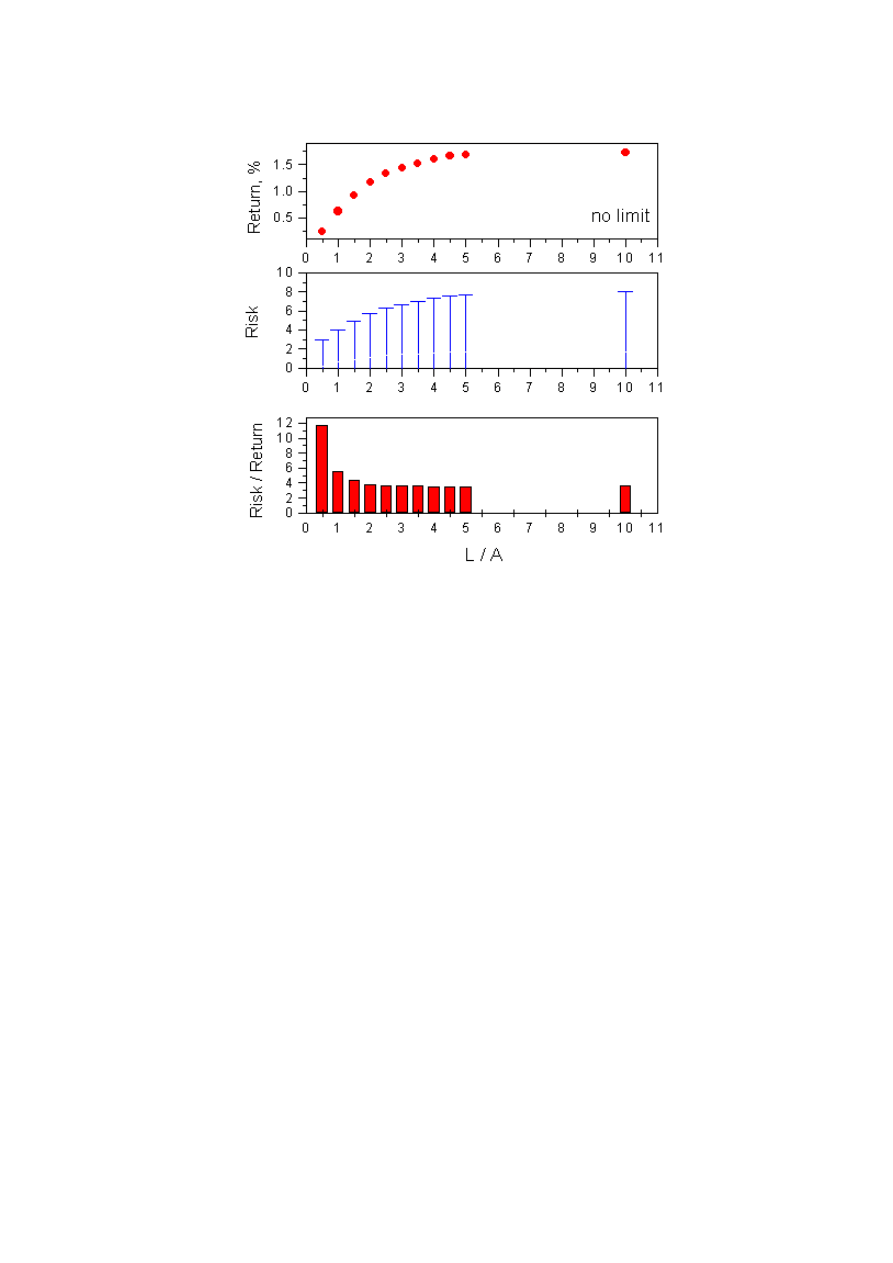
54
Average returns, risk (standard deviation of the return distribution) and the
risk/return ratios for various limit values for a four days stock holding period. Trading
oversold stock has been considered
From this figure one can make a very important conclusion: the risk to return ratio
varies very little if the level of the sell limit order is larger than 2.5A. Let us remind the reader
that A is the average daily stock price amplitude. Therefore, using limit orders for oversold
stocks with high probabilities of growth is not a bad idea.
The risk to return ratios for the strategy with stop loss orders have a more complicated
dependence on the stop levels. The next figure shows the results of calculating the average
returns, risk, and risk to return ratios for different levels of stop orders. As in the previous
case, the strategy of a four days stock holding of oversold stocks has been considered.
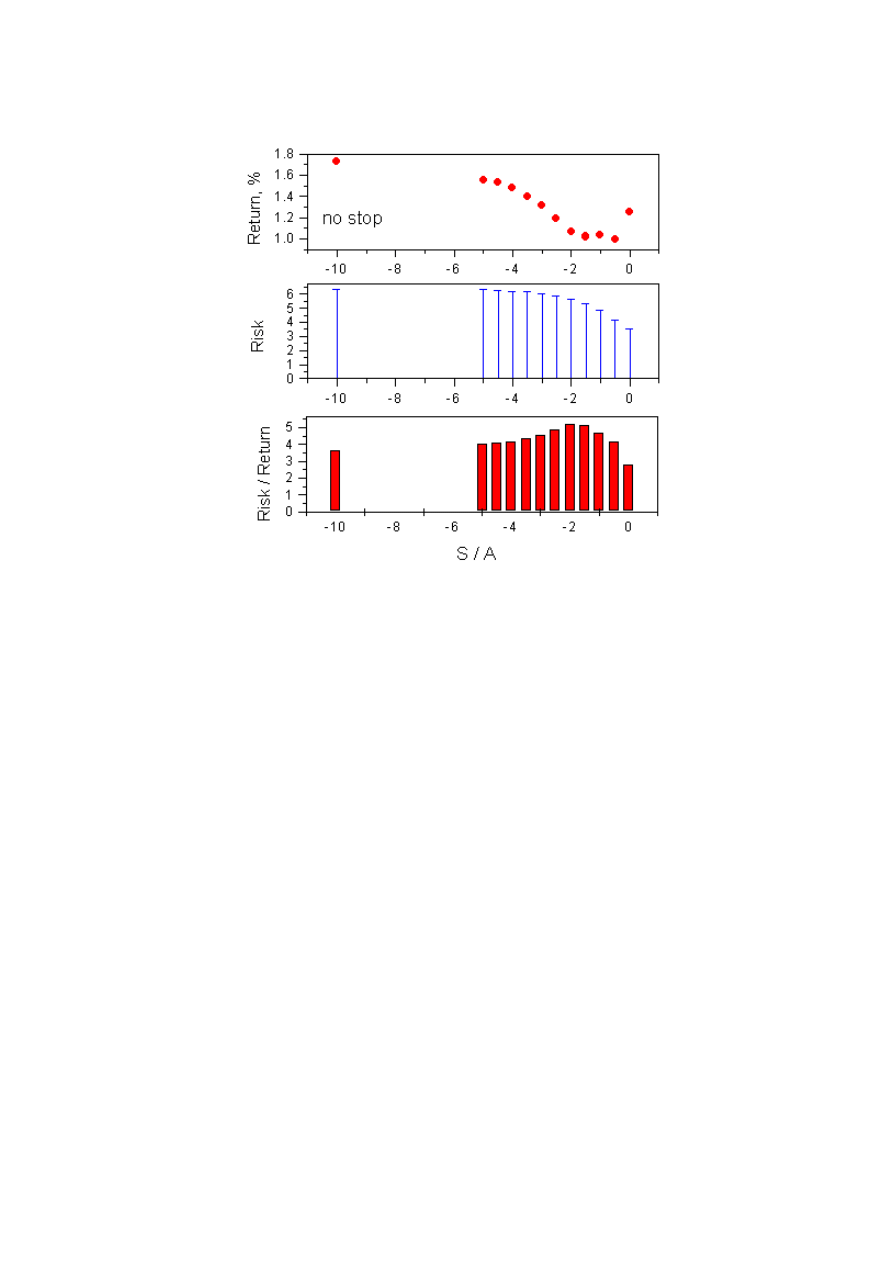
55
Average returns, risk (standard deviation of the return distribution) and the
risk/return ratios for various stop values for a four days stock holding period. Trading
oversold stock has been considered
From the first point of view one can conclude that the best strategy is placing stop loss
orders very close to the purchase price. The risk to return ratio of this strategy is the lowest.
Theoretically this is correct. However, experienced traders know very well that these stops
cannot prevent losses from negative overnight gaps. The opening stock price can be much
lower than the closing price of the previous day, and the stop order will be executed at very low
level.
The morning flow of sell orders in event of bad news can cause execution of the stop
loss order at an almost minimal price during the early selling off. The average return can be
much lower than expected. The trader must also remember about bid-ask spreads and
brokerage commissions, which also reduce the average return.
It seems that the optimal placing of the stop loss order is lower than -5A. The risk to
return ratio is close to the ratio without stop orders, the average return does not suffer much,
and this stop can prevent a big loss of the trading capital.
How much lower? It depends on trader's habits and experience. The average returns and
the risk to return ratios do not change much after -5A. It is much more important to not place
a stop loss order in the vicinity of -2A, where the risk to return ratio is maximal.
We have considered some strategies, which allow us to obtain the maximal average
return while minimizing the downward risk. However, if you look closely at the absolute values
of returns you can conclude that these returns are small and comparable to the transaction cost
(bid-ask spreads and brokerage commissions). How can we increase the absolute values of
returns? This question will be considered in the next section.
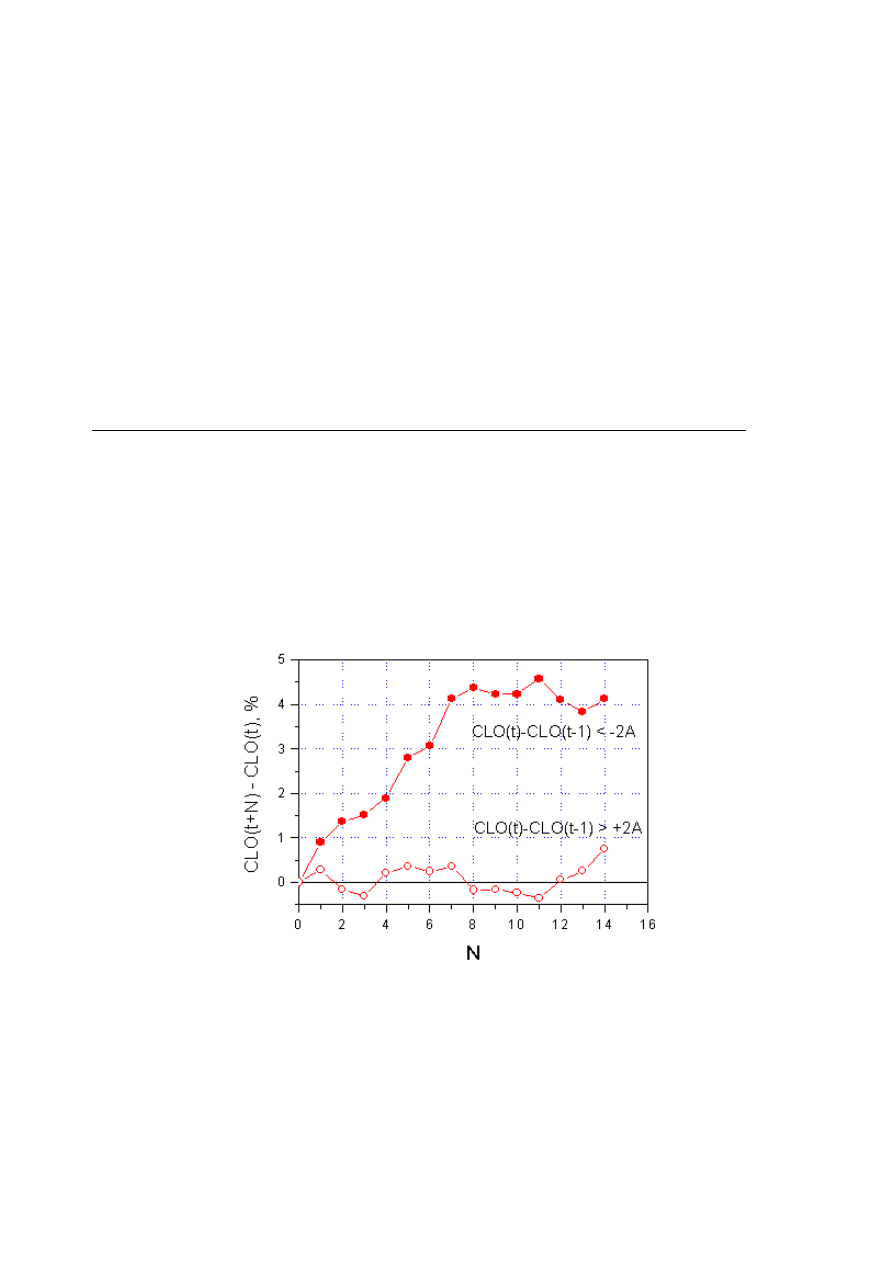
56
Increasing average return
There are many ways to improve trading strategies. We have considered optimization of
stock holding periods, optimal division of trading capital, and using stops and limits to sell
stocks. However, the main source of obtaining better return is a good stock selection. Buying
oversold stocks is good strategy, but it can be improved if a trader makes stronger selection.
Let us illustrate this idea by the next example.
Selection of oversold stocks within a 16 days time interval allows us to obtain an
average return about 2.2%, as described in the section "Returns of overbought and oversold
stocks". It is possible to obtain a much better return if one buys stocks on the next day if stock
prices decline still further. Denote (t-1) the day of analysis, i.e. the day when the list of
oversold stocks is obtained. Day (t) is the day of stock purchase. We consider buying stocks at
the market closing, i.e. the purchase price is equal to CLO (t). The stocks will be sold on day N
at the price CLO (t+N). The next scheme illustrates these notations.
__|__|__|__|__|__|__|__|__|__|__|__|__|__a|....p|....|....|....|....|....|....|....|....|....|...
16 day history for D and T calculations N=0 1 2 3 4 5 6
Here, a = t - 1 denotes the day of the analysis, p = t denotes the day of the purchase
(N = 0). The next figure shows the average returns
R = [CLO (t+N) – CLO (t)] / CLO (t) * 100%
as a function of N. We consider two cases. One is selecting stocks, which dropped during day t
(the next day after the day of the analysis) more than -2A, where A is the daily price
amplitude, which was defined previously. The second case is buying stocks, which rose during
day t more than 2A.
The average returns of specially selected oversold stocks as a function of the stock
holding days
One can see that selecting stocks with large price drops substantially increases the
average return and the strategy becomes much more profitable.

57
If one buys stocks, which started rising, in their price during day t then the average
return is close to zero. This is an example in which momentum strategy (buying rising stocks) is
not working.
In this section we have considered improving the average return per trade. However, we
have mentioned before that a large return per trade does not always means a large annual
return. If the number of trading days when one is able to find these stocks is small then the
annual return will be smaller. One needs to optimize criteria of stock selection to strike a
balance between the numbers of stocks per year, which can be found for trading, the stock
holding period, and the average return per trade. Examples of balanced trading strategies with
low risk to return ratios can be found in our other publication "Short-term trading analysis" or
the Text Level-2 on the website http://www.stta-consulting.com.
We have now completed our description of the analytical methods, which can be used
for improving trading strategies. We hope that our publication will help you to perform the
analysis of your own trading strategy.
We have tried to describe very complicated questions as simply as possible. For this
reasons many important points were but briefly described. We are always ready to help you to
clarify our ideas. Feel free to ask us any questions. We would also very much appreciate it if
you write us about other problems related to stock trading which you feel worth analyzing.
Wyszukiwarka
Podobne podstrony:
Fearless Interviewing How to Win the Job by Communicating with Confidence
J Michael Bishop How to Win the Nobel Prize, An Unexpected Life in Science (2003)
Fearless Interviewing How to Win the Job by Communicating with Confidence
How To Win The Heart Of A Poet
KasparovChess PDF Articles, Sergey Shipov How to Win with the d5 Passer
Economics How The Stock Market Works
How to read the equine ECG id 2 Nieznany
How to summons the dead
How to Install the Power Quality Teaching Toy
Forex For Everyone Learn To Trade The Forex Market Like A Professional
de bondt, thaler does the stock market overreact
How to Use the Electrical Wiring Diagram
a mathematician plays the stock market RAPJW6ZF5GDJGCUNRDPFGUL2BRZHSKXZVFFFKJA
How to get the new iPod Touch(8GB) for nothing (easy to complete)
How to Get the Most Out of Conversation Escalation
how to use the flash tool for Xperia
How to Meditate the Silva Method
How to Win Every Argument
więcej podobnych podstron