
AJS Volume 111 Number 2 (September 2005): 447–504
447
䉷 2005 by The University of Chicago. All rights reserved.
0002-9602/2005/11102-0003$10.00
Collaboration and Creativity: The Small
World Problem
1
Brian Uzzi
Northwestern University
Jarrett Spiro
Stanford University
Small world networks have received disproportionate notice in di-
verse fields because of their suspected effect on system dynamics.
The authors analyzed the small world network of the creative artists
who made Broadway musicals from 1945 to 1989. Using original
arguments, new statistical methods, and tests of construct validity,
they found that the varying “small world” properties of the systemic-
level network of these artists affected their creativity in terms of the
financial and artistic performance of the musicals they produced.
The small world network effect was parabolic; performance
increased up to a threshold, after which point the positive effects
reversed.
Creativity aids problem solving, innovation, and aesthetics, yet our un-
derstanding of it is still forming. We know that creativity is spurred when
diverse ideas are united or when creative material in one domain inspires
or forces fresh thinking in another. These structural preconditions suggest
1
Our thanks go out to Duncan Watts, Huggy Rao, Peter Murmann, Ron Burt, Matt
Bothner, Frank Dobbin, Bruce Kogut, Lee Fleming, David Stark, John Padgett, Dan
Diermeier, Stuart Oken, Jerry Davis, Woody Powell, workshop participants at the
University of Chicago, the University of California at Los Angeles, Harvard University,
Cornell University, and New York University, the Northwestern University Institute
for Complex Organizations (NICO), and the excellent AJS reviewers, especially the
reviewer who provided a remarkable 15, single-spaced pages of superb commentary.
We particularly wish to thank Mark Newman for his advice and help in developing
and interpreting the bipartite-affiliation network statistics. We also wish to give very
special thanks to the Santa Fe Institute for creating a rich collaborative environment
wherein these ideas first emerged, and to John Padgett, the organizer of the States and
Markets group at the Santa Fe Institute. Direct correspondence to Brian Uzzi, Kellogg
School of Management, Northwestern University, Evanston, Illinois 60208. E-mail:
Uzzi@northwestern.edu

American Journal of Sociology
448
that creativity is not only, as myth tells, the brash work of loners, but
also the consequence of a social system of actors that amplify or stifle one
another’s creativity. For example, tracing the history of key innovations
in art, science, and politics in the ancient Western and Eastern worlds,
Collins (1998) showed that only first-century Confucian metaphysicist
Wang Ch’ung, 14th-century Zen spiritualist Bassui Tokusho, and 14th-
century Arabic philosopher Ibn Khaldun fit the loner model, a finding
supported by historians and cultural sociologists who have shown in great
detail that the creativity of many key figures, including Beethoven, Thom-
as Hutchinson, David Hume, Adam Smith, Cosimo de’Medici, Erasmus
Darwin (inventor and naturalist grandfather of Charles Darwin) and
famed bassist Jamie Jamison—who, as a permanent member of the Funk
Brothers, cowrote more number-one hit songs than the Beatles, the Rolling
Stones, the Beach Boys, and Elvis combined—all abided by the same
pattern of being embedded in a network of artists or scientists who shared
ideas and acted as both critics and fans for each other (Merton 1973;
DeNora 1991; Padgett and Ansell 1993; Slutsky 1989).
One form of social organization that has received a great deal of at-
tention for its possible ability to influence creativity and performance is
the small world network. Since Stanley Milgram’s landmark 1967 study,
researchers have plumbed the physical, social, and literary realms in
search of small world networks. Although not universal (Moody 2004),
small worlds have been found to organize a remarkable diversity of sys-
tems including friendships, scientific collaborations, corporate alliances,
interlocks, the Web, power grids, a worm’s brain, the Hollywood actor
labor market, commercial airline hubs, and production teams in business
firms (Watts 1999; Amaral et al. 2000; Kogut and Walker 2001; Newman
2000, 2001; Davis, Yoo, and Baker 2003; Baum, Shipilov, and Rowley
2003; Burt 2004).
In contrast to most other types of systemic-level network structures, a
small world is a network structure that is both highly locally clustered
and has a short path length, two network characteristics that are normally
divergent (Watts 1999). The special facility of a small world to join two
network characteristics that are typically opposing has prompted re-
searchers to speculate that a small world may be a potent organizer of
behavior (Feld 1981; Newman 2000). But do small worlds make the big
differences implied by their high rates of incidence? Surprisingly, research
on this question is just beginning to form. Instead, most work has only
hinted at this proposition by using the small world concept to classify
types of systems rather than quantify differences in the performance of
systems. Newman (2001) examined scientific coauthoring in seven diverse
science fields and found that each had a small world structure, leading
to the conclusion that small worlds might account for how quickly ideas

Collaboration and Creativity
449
flow through disciplines—a conclusion echoing Fleming, King, and Juba’s
(2004) study of the small world of scientific patents and Davis et al.’s
(2003) study of the small world of corporate directors. Using simulations
to study diffusion, Watts and Strogatz (1998) showed that in a small world,
actors in the same cluster were at high risk of contracting an infectious
disease, but so were actors distant from an infected actor if separate
clusters had even a few links between them, an outcome that is also
consistent with the microlevel diffusion function of weak ties (Granovetter
1973) and structural holes (Burt 2004). A pioneering study by Kogut and
Walker (2001) examined the small world of ownership ties among the 550
largest German firms and financials from 1993 to 1997. They determined
that the central firms were more likely to acquire other firms and that
the virtual deletion of many interfirm links would not splinter the small
world—suggesting that small worlds can forcefully affect behavior and
that their effects are robust over a range of values.
We attempt to extend this line of research by developing and testing
arguments on how a small world affects actors’ success in collaborating
on new products. If a small world is more than a novelty or collection of
“spandrels”—inconsequential side effects of micronetwork variables—
then it should independently impact the performance of actors in the
system.
We argue that a small world network governs behavior by shaping the
level of connectivity and cohesion among actors embedded in the system
(Granovetter 1973; Markovsky and Lawler 1994; Frank and Yasumoto
1998; Friedkin 1984; Newman 2001; Moody and White 2003; Watts 1999).
The more a network exhibits characteristics of a small world, the more
connected actors are to each other and connected by persons who know
each other well through past collaborations or through having had past
collaborations with common third parties. These conditions enable the
creative material in separate clusters to circulate to other clusters as well
as to gain the kind of credibility that unfamiliar material needs to be
regarded as valuable in new contexts, thereby increasing the prospect that
the novel material from one cluster can be productively used by other
members of other clusters. However, these benefits may rise only up to a
threshold after which point they turn negative. Intense connectivity can
homogenize the pool of material available to different groups, while at
the same time, high cohesiveness can lead to the sharing of common rather
than novel information, suggesting the hypothesis that the relationship
between a small world and performance follows an inverted
U
-shaped
function.
Our context is the Broadway musical industry, a leading U.S. com-
mercial and cultural export and, like jazz, an original and legendary
American artistic creation (White 1970; DiMaggio 1991). Examining the

American Journal of Sociology
450
population of shows from 1945 to 1989, we examine how variation in the
small world network of the artists who create musicals affects their success
in inventing winning shows. As an industry in which both commercial
and artistic recognition matters, our measures of creative success quantify
a show’s success in turning a profit and receiving favorable notices by
the Broadway critics. In our design, we control for alternative factors
that affect a show’s success, including talent, economic conditions, and
the local network structure of production teams, which helps us to isolate
small world effects relative to other conditions known to favor creativity
(Becker 1982; Uzzi 1997; Collins 1998; Ruef 2002; Burt 2004). Our data
also contain rare failure data on musicals that died in preproduction—a
condition similar to knowing about coauthors’ papers that never made
publication but that produced the same tie-building (or tie-breaking) con-
sequences as published papers—which enables us to avoid underesti-
mating key relations in the network (Wasserman and Faust 1994).
To bolster the strength of our inferences, we use a new statistical model
for examining bipartite-affiliation networks. Occurring often in social life,
bipartite-affiliation networks occur when actors collaborate within project
groups—for example, directors on the same board within the wider net-
work of interlocks or authors on the same paper within the wider citation
network. Bipartite-affiliation networks are distinctive in that all actors in
the network are part of at least one fully linked cluster (e.g., all directors
on the same board are linked directly to each other), which affects critical
social dynamics as well as artificially inflates key small world network
statistics. We use the Newman, Strogatz, and Watts (2001) method to
adjust properly for these unique network dynamics.
We begin by describing the original Milgram thesis and finding, which
illustrates the basis of the small world concept, and then develop our
conceptual model with a focus on the mechanisms by which variation in
a small world affects behavior. We then turn to applying the abstract
small world model to the case of the Broadway musical industry with an
eye to developing testable conjectures about performance and to testing
the construct validity of our small world mechanisms.
MILGRAM’S SMALL WORLD THEORY
Although the general notion of a small world had been in circulation in
various disciplines, the powerful idea has been best illustrated by the
famous work of Stanley Milgram. Milgram was interested in understand-
ing how communication worked in social systems in which each member
of the social system had far fewer ties than there were members of the
total social system. To explain this process, Milgram hit on the idea of a

Collaboration and Creativity
451
small world and described its remarkable nature with the story of a chance
encounter between two strangers who meet far from home and discover
they have a close friend in common:
Fred Jones of Peoria, sitting in a sidewalk cafe in Tunis, and needing a
light for his cigarette, asks the man at the next table for a match. They fall
into conversation; the stranger is an Englishman who, it turns out, spent
several months in Detroit studying the operation of an interchangeable-
bottle cap-factory. “I know it’s a foolish question,” says Jones, “but did you
ever by any chance run into a fellow named Ben Arkadian? He’s an old
friend of mine, manages a chain of supermarkets in Detroit . . .” “Arkadian,
Arkadian,” the Englishman mutters. “Why, upon my soul, I believe I do!
Small chap, very energetic, raised merry hell with the factory over a ship-
ment of defective bottle caps.” “No kidding!” Jones exclaims in amazement.
“Good lord, it’s a small world, isn’t it?” (Milgram 1967, p. 61)
In large networks, Milgram surmised that connections influence behavior
because most people’s friendship circles are highly clustered; that is, most
people’s friends are friends with each other (“I know a guy who knows
a guy who knows me”). And in a small world network, the clusters can
be linked by persons who are members of multiple clusters, making it
possible for even large communities that are made up of many separate
clusters to be connected and cohesive. To test this idea, he concocted an
ingenious experiment to see just how small the world actually was. In
one experiment, Milgram randomly chose a stockbroker in Boston and
160 residents of a small town near Omaha, Nebraska. He sent each person
in the small town a letter with the stockbroker’s name and asked them
to send the letter to the stockbroker if they knew him personally, or to
send it to someone they knew personally who could deliver it to the
stockbroker or deliver it to him through a personal contact of their own.
Counting the number of intermediaries from the senders in Nebraska to
the target in Boston, Milgram found that it took “six degrees of separation”
or just six intermediaries on average to link the two strangers, a finding
that prompted intense inquiry in science and pop culture (Watts and
Strogatz 1998; Watts 1999; Amaral et al. 2000; Gladwell 2000; Moody
2004).
2
2
Another way to look at these ideas is through the parlor game Six Degrees of Kevin
Bacon, which does a better job of capturing a key feature of bipartite networks by
examining the connections among actors who appear in the same movie. The game
works as follows: Name an actor or actress. If the person acted in a film with Kevin
Bacon, then they have a “Bacon number” of “1.” If they have not acted in a film with
Kevin Bacon but have acted in a film with someone who has, they have a Bacon
number of “2,” and so on. Using the Internet Movie Database (www.imdb.com), Uni-
versity of Virginia computer scientist Brett Tjaden, the inventor of the game, deter-
mined that the highest Bacon number is “8,” but that Bacon himself is connected to

American Journal of Sociology
452
Milgram’s conjecture on why small world networks could connect
strangers rested not only on the surprising finding of few degrees of sep-
aration but on the supposition that people interact in dense clusters;
friends of friends tend to be friends. Friends are close to one another—
they have just one degree of separation. But if at least one person in a
cluster also is in another cluster, that person could create shortcuts be-
tween many people. This means that people and their ideas no longer
have to travel along long paths to reach distant others because they can
hop from cluster to cluster. Linked clusters enable degrees of separation
to be much shorter across the global network than is anticipated; the
average person can theoretically link to anyone else by using shortcuts,
enabling resources to flow from different ends of the network. Milgram
illustrated this idea with a folder that made it from Kansas to Cambridge
in just two steps:
Four days after the folders were sent [from Cambridge] to a group of starting
persons in Kansas, an instructor at the Episcopal Theological Seminary
approached our target person on the street. “Alice,” he said, thrusting a
brown folder toward her, “this is for you.” At first she thought he was
simply returning a folder that had gone astray and had never gotten out
of Cambridge, but when we looked at the roster, we found to our pleased
surprise that the document had started with a wheat farmer in Kansas. He
had passed it on to an Episcopalian minister in his home town, who sent
it to the minister who taught in Cambridge, who gave it to the target person.
Altogether, the number of intermediate links between starting person and
target amounted to two! (Milgram 1967, pp. 64–65)
The powerful idea that even distant individuals who are cloistered in
densely connected local clusters could be linked through a few interme-
diaries drew attention by highlighting how resources, ideas, or infection
can rapidly spread or dissipate in social systems. Clusters hold a pool of
specialized but cosseted knowledge or resources, but when clusters are
connected they can enable the specialized resources within them to mingle,
inspiring innovation.
Small World Theory for Bipartite (Affiliation) Networks
Watts (1999) built on prior work (Feld 1981) and provided a sophisticated
theoretical advance in small world analysis. Focusing on important social
and structural aspects of large, sparely linked networks, Watts (1999)
less than 1% of the actors. Similarly, if one looks for the most connected actor or
actress in Hollywood, it turns out to be Rod Steiger. Why are Bacon and Steiger well-
connected actors? Steiger is even more connected than Bacon because he has worked
in more diverse film genres than most actors, making him a node who links diverse
movie-cast clusters.

Collaboration and Creativity
453
showed that two theoretical concepts define a small world network: short
global separation and high local clustering. Short global separation could
be quantified by the average path length (PL), which measures the average
number of intermediaries between all pairs of actors in the network, while
the cluster coefficient (CC) measures the average fraction of an actor’s
collaborators who are also collaborators with one another (Holland and
Leinhardt 1971; Feld 1981).
3
To determine whether a network is a small
world, Watts’s model compares the actual network’s path length and
clustering coefficient to a random graph of the same size, where random
graphs have both very low path lengths and low clustering. Specifically,
the closer the PL ratio (PL of the actual network/PL of a random graph
comparison) is to 1.0 and the more the CC ratio exceeds 1.0 (CC of the
actual network/CC of the random graph comparison), or simply the larger
the small world quotient (Q), which is CC ratio/PL ratio, the greater the
network’s small world nature.
4
Newman et al. (2001) added a significant theoretical innovation to
Watts’s integrative work by reformulating the general small world model
for bipartite networks. As noted above, bipartite networks are widespread
and occur whenever actors associate in teams: directors on the same board,
collaborators on the same project or paper, banks in a syndicate, actors
in a movie, or, in our case, the creative artists who make a musical.
Bipartite networks have a special structure: all members on the same
team form a fully linked clique. When these teams are combined into a
systemic-level network, the global network is made up of fully linked
cliques that are connected to each other by actors who have had multiple
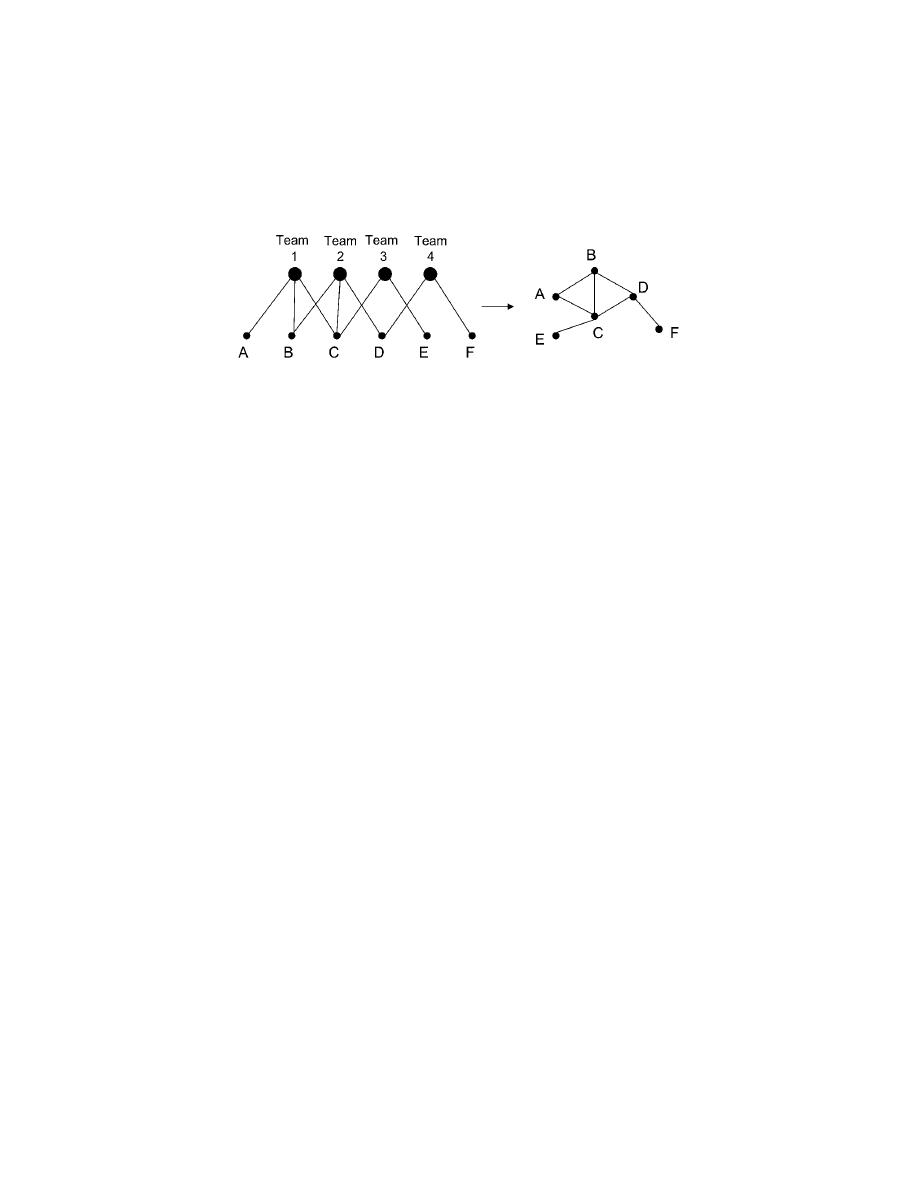
team memberships. Figure 1 illustrates a theoretical bipartite network
and its unipartite projection.
A key structural implication of the unipartite projection of the bipartite
network is that it significantly overstates the network’s true level of clus-
tering and understates the true path length when compared to the relevant
random network because of the pervasiveness of fully linked cliques.
Newman et al. (2001) showed that once the small world statistics of the
3
A note on terminology to avoid confusion: the term cluster coefficient has been used
to refer to two different quantities. The local CC is an egocentric network property of
a single actor and indicates how many of an actor’s ties are tied to each other, an
index often called density. The global CC is a property of the macronetwork and can
be computed as (1) the weighted average of each actor’s local density, or (2) the global
network’s ratio of open to closed triads, i.e., the fraction of transitive triplets (Feld
1981). In this analysis we use operationalization (2) because it is properly distinguished
from local density and is consistent with recent small world analysis (Newman 2001;
Newman et al. 2001). For more details, see the PL and CC equations in the methods
section.
4
Davis et al. (2003), Kogut and Walker (2001), and Amaral et al. (2000) present values
across a range of networks.
American Journal of Sociology
454
Fig. 1.—Bipartite-affiliation network and its unipartite projection. Top row represents
four teams, and the bottom row represents the teams’ members (e.g., coauthors on a paper
or artists who make a show). Teammates are members of a fully linked clique (e.g., ABC,
BCD, CE, and DF). Connections form between agents on separate teams when links like
BC connect the ABC, BCD, and CE teams.
network of the boards of directors of major U.S. companies were corrected
for their bipartite structure, the level of clustering in the network was
not appreciably greater than would be expected in a random bipartite
network of the same size—suggesting that the CC of the one-mode pro-
jection from a bipartite network could be a misleading indicator of a small
world if it is not correctly adjusted.
Following this line of reasoning, Newman et al. (2001) developed a
model for correcting the estimates of the CC and PL in random bipartite
networks. They reasoned that the “true” clustering in a bipartite network
is the clustering over and above the “artifactual” within-team clustering,
which is the between-team clustering or how clustered actors are across
teams, a view that draws on the theory of cross-cutting social ties and
community embeddedness (Frank and Yasumoto 1998; Moody and White
2003). A way to visualize the logic of between-team clustering is to imagine
a bipartite network where all actors are part of only one team—no actors
are members of multiple teams. In the unipartite projection of this bi-
partite network there will be many small but disconnected fully linked
clusters. Consequently, if one created a bipartite random network of the
same size, then the level of clustering in the random and actual network
would be the same because any random reassignment of links among the
actors on the teams reproduces the structural topology of fully linked
cliques of the actual network.
Returning to the original theoretical concepts that define a small world,
the PL ratio and CC ratio, Newman et al. (2001) showed that the bipartite
PL ratio has the same interpretation as in a unipartite network—the
greater the PL ratio, the greater the mean number of links between actors.
In contrast, the bipartite CC ratio has a related but different interpretation
than the unipartite CC ratio. They showed that when the bipartite CC
ratio is approximately 1.0, the clustering in the actual network is a result

Collaboration and Creativity
455
mostly of within-team clustering, and there is little between-team clus-
tering. As the CC ratio exceeds 1.0, there are increasing amounts of be-
tween-team clustering that connect the network’s separate teams and
personnel. Moreover, as the CC ratio rises, the cross-team links are in-
creasingly made up of actors who have previously collaborated (i.e., re-
peated ties) or who have third-party ties in common. This occurs because
actors who work on multiple project teams are inclined to prefer team-
mates with whom they have worked in the past or who have worked
with others with whom they have worked in the past, a process that is
a result of reciprocity and reputation principles (Granovetter 1985). For
example, Newman et al. (2001) showed that the CC ratio is positively
correlated with between-cluster ties that are made up of repeated ties
similar to the BC link shown above in figure 1.
These structural changes suggest that a small world influences behavior
through two mechanisms in bipartite networks: (1) Structurally, the more
a network becomes “small worldly” (formally, the more the small world
quotient exceeds 1.0), the more links between clusters increase in fre-
quency, which potentially enables the creative material within teams to
be distributed throughout the global network. (2) Relationally, the more
a network becomes small worldly, the more links between clusters are
made up of repeated ties and third-party ties, which potentially increases
the level of cohesion in the global network. Thus, as the small world
quotient increases, the clusters within the network become more connected
and connected by persons who know each other well. It is the small world
consequences on the level of connectivity and cohesion among actors in
the global network that we expect to affect their ability to collaborate
successfully and create winning productions.
COLLABORATION AND CREATIVITY: THE BROADWAY MUSICAL
While associated with Broadway in Midtown Manhattan, the neighbor-
hood from which it takes its name, the eldest ancestor of the modern
Broadway musical debuted in Philadelphia, the original capital of the
United States, 11 years before the Revolutionary War. An American com-
pany tried to produce the musical The Disappointment but was prevented
from doing so by the town elders, because the portrayals of racy social
values, though dressed up in song and witty innuendos, were considered
unfit for the stage (Bordman 1986). This combination of entertaining yet
critical viewpoints on American values, though the source of the first
production’s censorship, eventually became the industry’s professional
aspiration and moniker of fame in such classics as Gay Divorce, Cabaret,
Hair, Evita, Rent, and On the Town (which was nicknamed “On the

American Journal of Sociology
456
Make”). By cleverly embedding rebellious or taboo ideas in irresistible
comic songs and dance, creative giants like Noe¨l Coward, Anne Caldwell,
Irving Berlin, Richard Rodgers and Oscar Hammerstein, Agnes de Mille,
Harold Prince, and Stephen Sondheim could artistically treat and make
approachable to the general public issues of oppression, civil rights, al-
ienation, bigotry, or homosexuality.
During the 1945–89 historical period that we study, the industry sup-
ported many of its most renowned talents even as greats from previous
eras such as Cole Porter, Rodgers, Berlin, and Oscar Hammerstein II
extended their pre–World War II success. New talent with innovations
in directing and producing, composing, writing, choreography, and mar-
keting also entered the network. Prince, Sondheim, Leonard Bernstein,
David Merrick, Cameron Macintosh, Andrew Lloyd Webber, Tim Rice,
and Bob Fosse—the first man to win the Triple Crown, an Oscar for
Cabaret, a Tony for Pippin, and an Emmy for Liza with a Z, all in the
same year—produced unmatched hits (and flops) with shows like Cats,
Les Mise´rables, Sweeney Todd, Hair, Evita, The Pajama Game, A Chorus
Line (the longest-running show in Broadway’s history), and West Side
Story (whose soundtrack remained the number-one album in the country
longer than any other album in U.S. history). While great talent continued
to flourish, a mix of coinciding phenomena battled for Broadway’s talent
and consumer dollars. Hollywood and television thrived, creating ap-
pealing options for Broadway’s creative talent, while the drug and protest
culture, the alienated and crime-stricken New York City, the Civil Rights
movement, new family values, and the internationalization of the musical,
while lowering the curtain on earlier subject matter and artistic conven-
tions, raised it on new ones.
Dynamic Structure of the Creative Artist Network
Though it has varied throughout the history of Broadway, the core team
that makes a musical is made up of six freelance artists: a composer, a
lyricist, a librettist who writes the story’s plot and dialogue (a.k.a. the
“book”), a choreographer, a director who facilitates the team’s collabo-
ration, and a producer who manages financial backing. In most cases,
there is one specialist per role, although a single artist can play two roles
(e.g., composer and lyricist), or two artists might partner on a single role.
Figure 2 illustrates the bipartite structure of the Broadway musical
network of artists. The top row of the model represents musicals, and the
middle row represents the fully linked cliques of artists formed by mu-
sicals. The bottom row of the figure represents how the global network
emerges from the separate creative artist teams that enter the industry
each year with new productions. Consistent with figure 1, which illustrates
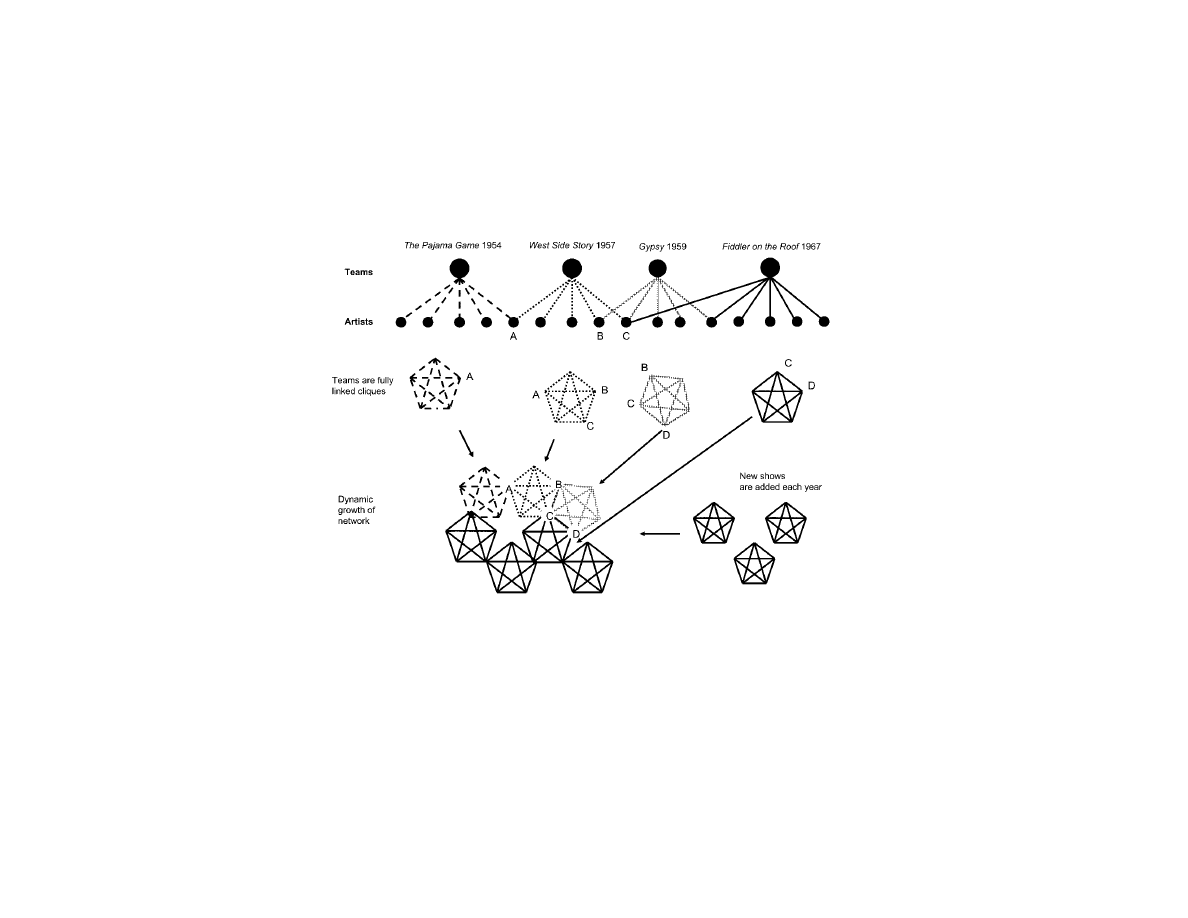
Fig. 2.—Broadway creative artist network. Figure is illustrative but based on actual data; A p Harold Prince (producer), B p Stephen Sondheim
(composer/lyricist in Gypsy and lyricist in West Side Story), C p Arthur Laurents (librettist), and D p Jerome Robbins (director). As the fully linked
cliques are connected to each other through artists who are part of multiple teams, the frequency of between-clique connections is disproportionately
made up of repeated ties and third-party ties. This pattern is illustrated by the high connectivity among the artists who separately worked on West
Side Story, Gypsy, and Fiddler, and the frequency of the repeated and third-party ties among B and C, and C and D, Sondheim and Laurents, and
Laurents and Robbins.

American Journal of Sociology
458
the generic bipartite structure, the Broadway musical network shows that
between-team links arise when artists work in more than one musical and
create dense overlapping clusters of the type that are prototypical of a
small world network. (Note: the resemblance between our fully linked
cliques and satanic pentangles in this figure is coincidental.) Using an
illustrative example based on the actual data (Uzzi and Spiro, in press;
Guimera et al. 2005), figure 3 shows the internal typology of the small
world with different levels of Q. When there is a low level of Q, there
are few links between clusters, and these links have low cohesion in the
sense that they are not disproportionately formed through third-party or
repeat ties among the actors in the network. As the level of Q increases,
the network becomes more interconnected and connected by persons who
know each other well because there are more between-team links, and
these links are disproportionately made up of repeat collaborators and
collaborators who share third parties in common. At high levels of Q, the
small world becomes a very densely woven network of overlapping clus-
ters. Many teams are linked by more than one actor, and the relationships
that make up the between-team ties are highly cohesive.
The production routine of a musical is varied yet follows a basic pattern.
A show originates when at least one artist develops material for a show
and then recruits other artists to develop their specialized parts. For ex-
ample, A Chorus Line began as a medley of dance numbers by chore-
ographer Michael Bennett before the music (Marvin Hamlisch) and other
elements were added by other artists; a new musical could also begin
around a librettist’s (Mel Brooks) book as in the case of The Producers
(Kantor and Maslon 2004). Once the artists have their material in pro-
totype form, they work together in an intensive, team-based collaboration
in which they simultaneously incorporate their separate material into a
single, seamless production. It involves full days of collaborative brain-
storming, the sharing of ideas, joint problem solving, and difficult editing,
as well as flash points of celebration and commiseration that promote
strong social bonds among the teammates. After this “preproduction stage”
has finished, the musical is evaluated in previews. If a show is deemed
worthy for Broadway during previews it is released as a Broadway mu-
sical; otherwise, it is considered a failure and never released in its current
form. Shows that make it to Broadway go on to be hits or flops.
Creative Material and Creativity
Because a musical is a serious art form as well as a business venture (as
the song says, “There’s no business like show business”), shows are created
with an eye to both artistic and commercial value. Although successful
shows can emphasize one aspect of success over the other, paying audi-
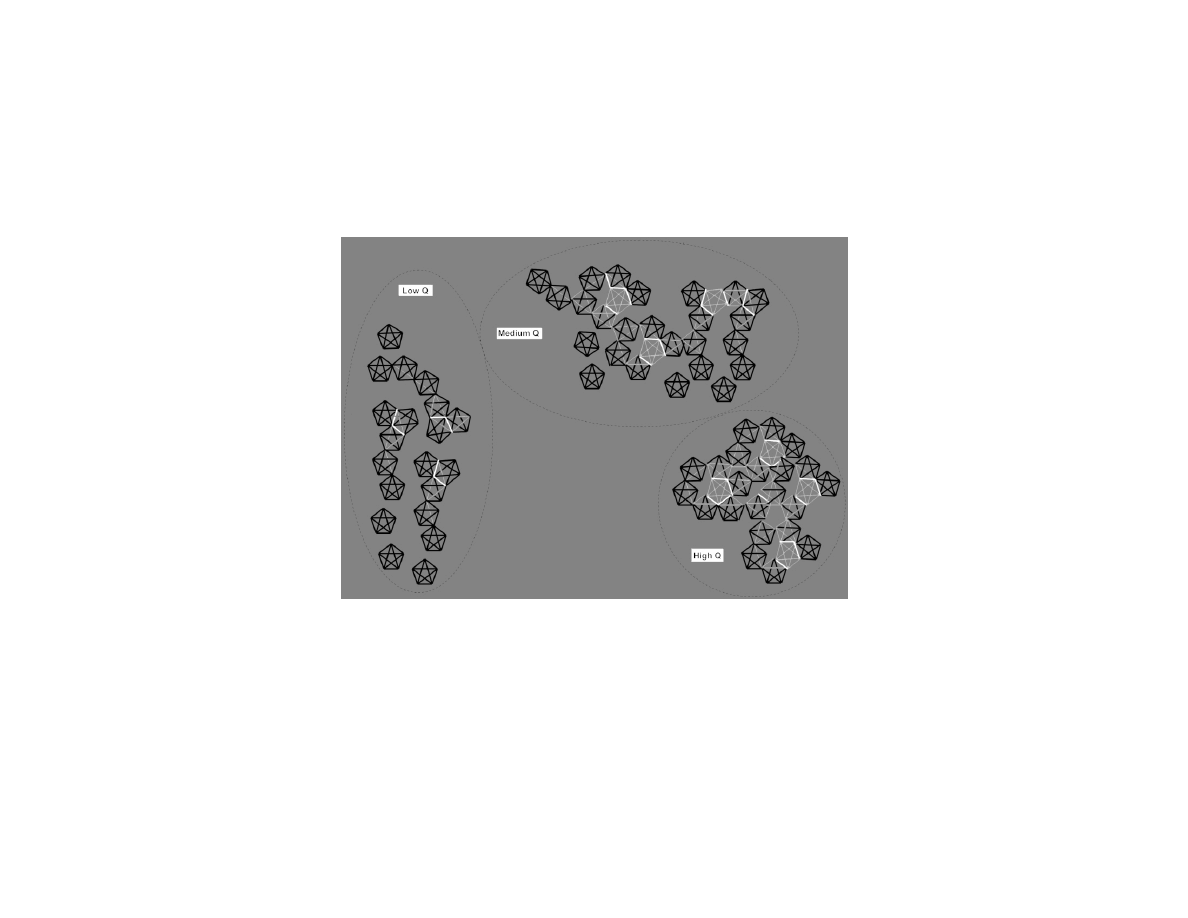
Fig. 3.—Variation in small world network structure. Figure is illustrative but based on the actual structure of our network data for various years.
Each inset reflects the structure that is multiplied many times to create a large global network for three levels of Q. When Q is low there are few
links between teams (cliques), and the ties that make up these links are not disprotionately made up of repeated and third-party ties as represented
by the white (repeated tie) and gray (third-party tie) links. This topology has low connectivity and cohesion. As Q tends toward a high level, there are
many between-team links, and these links are disproportionately made up of repeated and third-party ties—there is high connectivity and cohesion
in the network’s topology. At medium levels of Q the small world network has an intermediate amount of connectivity and cohesion.

American Journal of Sociology
460
ences demand entertainment, and critics (while understanding the req-
uisite need to please audiences) demand that serious subject matter be
treated beneath the surface of hit tunes and infectious dance, characters,
and story lines (Rosenberg and Harburg 1992). Nevertheless, while there
is no certain formula for a hit, and the inner workings of the synaptic
lighting behind creativity remain illusive (Flaherty 2004), it is hypothe-
sized that the more accessible and diverse the creative material available
to artists and the more artists can lower the risks of experimentation, the
more likely it is that artists can see opportunities for creativity or be
forced to assimilate material from earlier periods into something fresh
and new that succeeds with audiences, critics, or both (Becker 1982;
Lawrence 1990; Garebian 1995). For example, in his classic study of art
and the marketplace, Becker concluded that the distribution of available
material shapes the ambitions and capabilities behind the creativity of
artists:
Artists use material resources and personnel. They choose these out of the
pool of what is available to them in the art world they work in. Worlds
differ in what they make available and in the form in which they make it
available. . . . What is available and the ease with which it is available
enter into the thinking of artists as they plan their work and into their
actions as they carry out those plans in the real world. Available resources
make some things possible, some easy, and others harder; every pattern of
ability reflects the workings of some kind of social organization and becomes
part of the pattern of constraints and possibilities that shapes the art pro-
duced. (Becker 1982, p. 92)
What constitutes creative material in the art world of the musical?
Becker (1982) showed that creative material is embedded in conventions—
accepted standards of construction of basic components of music, dance,
lyrics, and more (see chap. 2 for examples). These conventions provide
standards around which artists can easily collaborate. They tend to pro-
duce predictable reactions from mass audiences as well as potentially gain
the critics’ praise when innovatively embedded in productions that only
the trained ears of a professional can appreciate. In music, categories such
as jazz, rock, hip-hop, and so forth all have their separate conventions.
The genre of the “musical” organizes the separate artistic parts into a
whole that is distinguished from related arts such as burlesque, opera,
operetta, and vaudeville, which use elements of music, dance, plot, and
so on. Original artists, as opposed to cover artists, create styles that per-
sonalize conventions by adding novelties, twists, and fresh ideas. As styles
become popularized and imitated they become conventional material. In
the early 1970s, choreographer Bob Fosse worked within the historic
dance conventions of old vaudeville and burlesque. He added the dis-

Collaboration and Creativity
461
tinctive novelties of dancing with down-rounded shoulders, small, rapid,
twinkle-toe steps, straight arms, and the wearing of hats to the basic
conventions. After winning the first Triple Crown his style became con-
ventional material for other artists to mimic and creatively extend.
Artists learn material through personal collaborations, wherein they
can observe firsthand the production process and not just the final product
(Becker 1982). Other artists can observe performances of material. Al-
though they do not observe firsthand how the material is created, they
can at least extract elements of the material for their routines. The dis-
tribution of conventions and styles practiced by related artists for the
music, dance, lyrics, and song that combine into a Broadway musical
provide the extensive “pool of variation” (Becker 1982, p. 92) from which
artists create original work.
Any successful production is likely to be a combination of convention
and innovative material—material that extends conventions by showing
them in a new form or mode of presentation. “Without the first it becomes
unintelligible; without the second, it becomes boring and featureless”
(Becker 1982, p. 63). An example of innovation and convention is provided
by Carousel (1945), a Rodgers (music) and Hammerstein (book and lyrics)
show that creatively extended the convention of the big love song. Because
the conventional use of the big love song required it to come in at roughly
the middle of the program after the leads meet, audiences had to wait to
hear the show’s favorite number. Rodgers and Hammerstein reasoned
that they could enhance the appeal of their shows by adding more big
love songs. But how could they have a love song before the leads had a
chance to know each other? The extension they hit upon was to take the
convention of the love song being sung in the present time and extend it
to “dream” time and future time (Kantor and Maslon 2004). In the former
case, they created a love song about an imaginary lover, and in the latter
case, a love song about falling in love with a future lover.
Just as conventions are learned and gather strength within networks
of personal contact and repeated public performance, innovative exten-
sions often emerge when artists are exposed to other conventions besides
the ones they have been gifted in applying, inspiring or forcing creativity
(Becker 1982). To continue with the example of Carousel, it has been
estimated that the cynicism about love that had been Rodgers’s forte in
writing love songs before collaborating with Hammerstein came into con-
tact with Hammerstein’s command of the conventions for writing about
wide-eyed, optimistic love to create the right balance between fantasy
love, future love, and dream love. Together they creatively combined the
musical and lyrical conventions of the whimsical lovers with those of the
doomed lovers (in collaboration with de Mille’s innovative choreography),
keeping the fantasy behind the songs and plot real enough for audiences

American Journal of Sociology
462
to believe in (Kantor and Maslon 2004). This risky creative gamble was
supported by their close personal relationship, which had formed two
years earlier during Oklahoma (1943), their first musical together. In this
way, the distribution of different conventions and personal relations
around an art can inspire creativity either by revealing previously unseen
connections in material or by necessitating that an innovative solution be
found that enables a synthesis of different material.
SMALL WORLDS AND EXPECTATIONS FOR PERFORMANCE
While the above cases recount the dynamics of creativity at the level of
specific team interactions, we are interested in how the distribution of
talent around the small world of artists affects the creativity of individual
teams and the creativity of the industry as a whole. The concept of the
small world suggests that it can productively organize the distribution of
creative material in an art world as well as promote the ability and desire
of artists to take risks collaboratively on creating something new. Clusters
of interacting artists help incubate conventions. As the same time,
between-cluster connections increase the likelihood that different con-
ventions will come into contact, while the between-cluster connections,
which are disproportionately made up of people who know each other
well, further encourage risk taking on new material. In this way a small
world works not just by bridges that bring together different ideas (Burt
2004) but also by creating the cohesion needed for innovators to take risks
on unfamiliar material.
We argue that as the distribution of connections and cohesion across
the small world changes, the likelihood of creative discoveries should also
go up and down. This is because artists’ creativity will be partly governed
by the increase or decrease in contact among collaborators embedded in
separate clusters, and because successful new material innovations, once
publicly shown, also stimulate creativity among artists in other parts of
the network that attempt to incorporate successful fresh ideas into their
material. In this way, the distributed nature of creativity and creative
material cannot be fully captured by ego- or team-level network effects
because they do not account for how the joint distribution of links among
individuals and teams are embedded in the larger, bipartite global network
of relations.
The structural and relational mechanisms by which a small world af-
fects behavior suggest that when the small world Q of the network is low,
the ability of creative artists to develop successful shows is also low.
Because there are few between-team links to promote the transfer of
creative material between teams in the global network, the creative ma-

Collaboration and Creativity
463
terial that is generated within a production team is unlikely to circulate
to other teams. At the same time, because the between-team links are
made up of few repeated or third-party-in-common ties, the creative ma-
terial passed between teams in the global network may be perceived as
having indefinite value. This is because it has not been spread by known
and trusted sources who can effectively communicate to new teammates
the value of unfamiliar yet novel ideas imported from other teams they
have worked on, making promising material costly to obtain or risky to
employ. This remains true even if creative material can be observed after
the musical is staged because the finished product only partly reveals the
full effort needed to adapt the material for new purposes (see Menon and
Pfeffer [2003] on the reverse engineering of innovations).
For the same reasons, as Q begins to increase, the network’s more
connected and cohesive nature should facilitate the flow of creative ma-
terial and promising collaborations across clusters. This argument is con-
sistent with Merton’s studies of the “invisible college” (1973), which
showed that connectivity between coauthors and labs nurtured research
through the sharing of ideas, soft information, and resources—a finding
reproduced in contemporary studies of science and the arts (Etzkowitz,
Kemelgor, and Uzzi 2000). Granovetter’s (1985) arguments about rela-
tional embeddedness also suggest that the greater the level of repeated
and third-party links, the greater the risk sharing and trust in a com-
munity. Repeated ties can lower innovation costs by spreading the risk
of experimentation over the long term. In a similar view, repeated inter-
actions tend to create expectations of trust and reciprocity that “roll over”
to common third-party ties, increasing the likelihood that risks of collab-
oration or creativity are spread among friends of friends (Uzzi 1997). These
findings suggest that increases in a network’s small world character can
boost the performance of the global network by making the exchange of
conventions as well as risk taking more likely.
While theory implies a positive relationship between small worldliness
and success, research also suggests that connectivity and cohesion can be
a liability for creativity. A robust social psychological finding is that co-
hesive cliques tend to overlook important information that is discrepant
with their current thinking because members tend to exchange common
rather than unique perspectives. Kuhn’s (1970) study of creative change
in science showed that the inability of cohesive teams of scientists to react
to inconsistencies in their thinking can hold true despite empirical data
that clearly refutes the current paradigm, especially if cluster members
have had “hits” with the old research tradition or style. Moody and White’s
(2003) analysis of political behavior showed that as a cluster’s connectivity
intensifies, actors behave more similarly despite freedom to be different,
while Becker (1982, p. 57) found that when groups with tastes and skills

American Journal of Sociology
464
in the same convention or style work predominantly with each other, the
convention “becomes the automatic basis on which the production of art
works can proceed, even among people deeply devoted to not doing things
in the conventional way.”
In exclusive ongoing relationships where friends are friends of friends,
feelings of obligation and camaraderie may be so great between past
collaborators that they risk becoming an “assistance club” for ineffectual
members of their network (Uzzi 1997). Preserving a space for “friends”
can further hamper the recruitment of outsiders that possess fresh talent
into a cluster (Portes and Sensenbrenner 1993) or promote recruitment
by homophily, minimizing diversity and reproducing rather than ad-
vancing existing ways of thinking (McPherson, Smith-Lovin, and Cook
2001). Expectations of reciprocity intensify an actor’s exclusive involve-
ment with certain others at the cost of forming new ties with persons who
have a fresh artistic view or who are “with-it.” These findings suggest
that the high levels of connectivity and cohesion associated with a high
Q can potentially undermine a productive distribution of the kinds of
conventions and extensions that are critical for creativity in an art world.
How can these opposing arguments about a small world’s effect on
performance be reconciled? We suggest that the effect may be parabolic.
When there is a low level of Q, there are few links between clusters, and
the links are more hit-and-miss, on average, in the sense that they are
not disproportionately formed through credible third-party or repeat ties,
isolating creative material in separate clusters. As the level of Q increases,
separate clusters become more interlinked and linked by persons who
know each other. These processes distribute creative material among
teams and help to build a cohesive social organization within teams that
support risky collaboration around good ideas. However, past a certain
threshold, these same processes can create liabilities for collaboration.
Increased structural connectivity reduces some of the creative distinc-
tiveness of clusters, which can homogenize the pool of creative material.
At the same time, problems of excessive cohesion can creep in. The ideas
most likely to flow can be conventional rather than fresh ideas because
of the common information effect and because newcomers find it harder
to land “slots” on productions.
These arguments suggest that a small world network affects the per-
formance of the actors within it by shaping the distribution of creative
material and talent available to them—specifically, the joint distribution
of actors and teams. The small world quotient tells how connected and
cohesive the relations in the global network are, indicating how productive
or unproductive the distribution of creative material and relationships
are across the global network. Are creative ties and materials poorly
distributed among strangers in disconnected cliques or tightly woven into

Collaboration and Creativity
465
a single, undifferentiated mass of close relations? Or are they richly dis-
tributed in a structure that is between these extremes? In this sense, the
small world simultaneously governs the distribution of material for all
the actors in the network. Thus, while collaboration happens between
direct relations, the small world influences lower-level mechanisms such
as actors’ egocentric webs (Burt 2004) that generate their returns contin-
gent on the distribution of resources of the small world network in which
they are embedded. In this sense, the small world network influences to
different degrees, but by the same mechanisms, the performance of in-
dividual actors as well as the performance of the aggregate system.
Hypothesis.—The relationship between a network’s small world ty-
pology and performance is
U
-shaped. Specifically, the financial and artistic
success of a production increases at medium levels of Q and decreases at
either low or high levels of Q. The financial and artistic success of a season
of productions increases at medium levels of Q and decreases at either
low or high levels of Q.
DATA AND METHODS
Our data include the population of all 2,092 people who worked on 474
musicals of new material produced for Broadway from 1945 to 1989. For
each musical, we know the opening and closing date, artists on the creative
team, theater of showing, and measures of commercial and artistic success.
In addition to the shows that were released on Broadway, our sample
also includes data on 49 shows that died in preproduction. The artists on
these shows experienced the same intense collaborative interactions as the
artists who worked on shows that did get released on Broadway. Con-
sequently, they provide rare “failure” data that is often inaccessible for
the purposes of studying networks and that can cause statistical biases
when excluded from the analysis. The sources of the above data are Bloom
(1996), Green (1996), and Simas (1987), which are directories that record
the above data for each musical from the musical’s original Playbill.
Following the industry convention of dating events in the industry by the
calendar year, we measure time in years. Revivals and revues of non-
original shows were excluded.
The nodes in our network are all the creative artists who have worked
on Broadway musicals during this time period. Actors who perform the
shows are excluded. In the global network, artists are directly linked to
each other when they collaborate on the same show and indirectly to each
other through third parties when their separate shows share at least one
common artist (see figs. 2 and 3).
In defining a tie, the issue arises as to how long it should persist. In

American Journal of Sociology
466
the extreme case of no relationship decay, all artists from 1945 and 1989
would be linked in the global network. However, this is unrealistic and
skews many network statistics because it maintains false links to inactive
artists (i.e., Andrew Lloyd Webber ca. 1970–2001 would be linked to Cole
Porter ca. 1920–50 [Porter died in 1964]). Our review of the literature and
interviews with industry experts suggested that if an artist was inactive
for seven years (did not collaborate on a musical during that time), that
artist and all of his or her links should be removed from the network in
year seven. If an inactive artist reactivates in a new show after being
removed, the artist and his or her recent ties are added to the network—
ties that were deleted are not reconstituted on the basis that experts de-
scribed this pattern of reentry as “breaking back into the business.”
5
We
also used decay functions of five and 10 years, and the results were very
similar.
Using the above definitions for nodes, links, and decay, we constructed
the global network. We began with the creative artists who worked on
the shows that opened in 1945 and then added to that network all the
active artists who had worked on shows prior to 1945 to make the in-
formation on the 1945 network match all subsequent years. After that
step, we worked forward in time, adding new artists to the network each
calendar year in accordance with the release of new shows.
The so-called giant component of a network measures the collection of
actors that are linked to each other by at least one path of intermediaries
(Moody 2004). Despite the conservative decay function, the giant com-
ponent in this network averages over 94% from 1945 to 1989. In the
average year, the average number of active artists is about 500, and the
average number of links per artist is 29. Consistent with other work on
small worlds, our network is both very large and sparse and made up of
essentially one large interconnected network (Watts 1999).
Dependent Variables
To operationalize financial success, we used the industry standard mea-
sure, a three-category index devised by Variety (1945–89). A “hit” is a
production that makes enough money to recoup its costs before ending
its run, a “flop” makes money but fails to recoup its costs before ending
its run, and a “failure” is a musical that closes in preproduction before it
makes any money at all. Data on how much money a hit makes or a flop
loses is not publicly available for our shows. Of the 474 musicals, we have
complete data for 442. The distribution for hit or flop or fail is what is
5
We interviewed Stuart Okun, former vice president of Disney Stage Productions
International, and Frank Galati, actor, writer, and Tony Award winner.

Collaboration and Creativity
467
expected in show business. Of a total of 442 shows, 23.68% are hits,
65.06% are flops, and 11.26% are failures. In constructing this variable
we defined failures equal to zero, flops equal to one, and hits equal to
two. In order to be most conservative in our coding we also coded financial
success as a two-category variable with a hit equal to one and a flop
equal to zero by recoding failures to flops (collapsing the two financial
dud categories into one category) and by excluding flops from our analysis.
These changes did not affect the reported results (see app. table A1).
To measure artistic success, we used another industry gold standard,
the average of the critics’ reviews of the musical (Suskin 1990; Rosenberg
and Harburg 1992). Broadway critics’ reviews partly define shows as
being “art,” “not art,” “good or bad,” “beautiful,” “imaginative,” “deriv-
ative,” and so on (Becker 1982). Our data on reviews come from Suskin
(1990, 1997), who coded and recorded all critics’ reviews from 1945 to
1981 from the following publications: the Daily News, the Herald Tribune,
the Journal-American, the Mirror, PM, the Post, the Star, the Sun, the
New York Times, and the World-Telegram and Sun. Critics’ reviews exist
on a five-point critics’ scale: pan (
⫺2), unfavorable (⫺1), mixed (0), fa-
vorable (
⫹1), and rave (⫹2). For each musical, we averaged the reviews,
which resulted in score ranges from
⫺2 (all pan reviews) to ⫹2 (all rave
reviews). These data are not available for 1982 to 1989, dropping our N
for artistic success from 435 to 315.
The virtue of the average is that it measures the overall critical artistic
impression of a show (Baumann 2001). On Broadway this scoring takes
place on opening night, making the review process fairly independent of
the exchange of opinions among critics.
6
We confirmed the validity of this
measure in several ways. First, we checked to see if the number of critics
varied across review categories. The average number of reviews across
our five categories was nearly identical. Second, we examined whether
the scores of shows receiving mixed reviews might be confounded with
the variance of agreement among critics. That is, do the middle three
categories indicate the mean strength of the valance of the reviews or
6
The sociology of culture literature suggests that other measures of artistic success
exist and that the appropriateness of a measure is partly contingent on the historic
and cultural conditions of the time (White 1993). For example, another measure of
critical success is the variance of reviews rather than the average, which operationalizes
critics’ agreement about, rather than keenness for, a production. The Tony Award is
a broad measure of artistic success because it is influenced by end-of-the-season eco-
nomic information and the career-long celebrity of the artist (Faulkner and Anderson
1987). Others cite the production of a legitimate product of high culture (Bourdieu
1996), genius and patronage (DeNora 1991), or reputation (Becker 1982). Our measure
of artistic success reflects a standard used by artists to evaluate their own work in a
field where critics can define what has artistic merit (as well as entertainment value)
in the world of the professional performing arts (Verdaasdonk 1983; Baumann 2001).

American Journal of Sociology
468
simply shows that had more variable reviews? The data showed that the
variance around the mean for mixed notices was lower than around hits
or flops, suggesting that a musical receiving a mixed review is picking up
valance rather than level of agreement among critics.
In this industry, financial and artistic success are correlated 0.56, a
situation that is expected given the aims of creative artists. However, the
measures are not substitutes for one another either substantively or em-
pirically. Table 1 shows that the better the review, the better the show
tends to do financially. This is because (a) artists actively strive for success
in both arenas, and (b) consumers shy away from pricey shows that critics
pan. Nevertheless, it is clear that a nontrivial number of shows overcome
poor notices, and critics do frequently praise what the public ignores; 23%
of the shows with rave reviews were financial flops, and 13% of the shows
with pan reviews were hits. This disparity creates a need for both de-
pendent variables.
Finally, we constructed three system-level variables: (1) the annual per-
centage of hits, (2) the annual percentage of rave reviews, and (3) the
annual average of reviews. We modeled both percentage of rave reviews
and the average of all reviews because both measures of artistic success
are used to describe the performance of the industry. These variables were
operationalized as the yearly number of hits divided by the yearly number
of new shows, the yearly number of shows with rave reviews (values
between one and two on our critics’ scale) divided by the yearly number
of new shows reviewed, and the average of each individual show’s critic
score divided by the total reviews made that year. This yielded an N of
45 for the percentage-of-hits model and an N of 37 for the percentage-
of-rave models, two small samples that test the power of the model.
Independent Variables
To generate our CC ratio, a CC for our actual network and a random
network of the same size must be computed. To compute the actual CC,
we determined how many pairs of artists have a shared acquaintance, or
how many triads are “closed” (Feld 1981; Newman et al. 2001). Three
different configurations can yield a triad: person A is linked to person B
who is linked to person C, both persons A and B are linked to person C,
or both persons B and C are linked to person A. Three links among
persons A, B, and C comprise a closed triad (i.e., a triangle). Thus, the
percentage of closed triads in the network is three times the total number
of closed triads (to account for the three possible configurations of triads)
divided by the total number of triads (eq. [1]). The actual CC is on a scale
from zero to one. Zero represents no clustering, and one represents full

Collaboration and Creativity
469
TABLE 1
Distribution of Financial Hits and Artistic Success, 1945–
1989
Range of Artistic Score
No. of
Observations
Hit
Percentage
Favorable to rave (1 to 2) . . . . . . . . . . . . . . . .
71
.77
Mixed to favorable (0 to .99) . . . . . . . . . . . . .
79
.29
Unfavorable to mixed (
⫺.99 to ⫺.01) ...
91
.15
Pan to unfavorable (
⫺2 to ⫺1) ..........
80
.13
Total . . . . . . . . . . . . . . . . . . . . . . . . . . . . . . . . . . . . . . . .
321
28.97
Note.—Only 321 cases have artistic review data while 442 cases have hit, flop,
failure data.
clustering. An actual CC value of .65 means that 65% of the triads are
closed:
7
3 # no. of triangles on the graph
CC p
.
(1)
no. of connected triplets of vertices
To calculate the random CC, we use Newman et al.’s (2001) solution
for a bipartite graph. The logic that created a random bipartite graph
counterpart to our actual network followed these steps. First, we calcu-
lated the tie distributions (i.e., k) for teams as well as artists from the
actual network for each year. Second, for each show and artist in the
random graph, we created as many links as its degree distribution dictates
by linking team and teammate nodes randomly.
Specifically, the bipartite random CC computes two different degree
distributions in the network: the number of individuals per team and the
number of teams per individual. The probability that an individual is in
j groups is
. The probability that a group has k individuals is
. These
p
q
j
k
probabilities are used to construct the functions in equation (2):
j
k
f (x) p
p x ,
g (x) p
q x .
(2)
冘
冘
0
j
0
k
j
k
7
To make our link to past work clear, it is worth noting the relation between the CC
and the concept of transitivity (Holland and Leinhardt 1971; Feld 1981; Wasserman
and Faust 1994). Eq. (1), the equation for the actual CC, is identical to the equation
for “transitivity.” Because of this history, it might be apt to refer to the actual CC as
transitivity. However, two factors appear to make the term CC more apt in our study.
First, prior work treats transitivity and clustering as almost empirically interchangeable
because they operationalize the same concept of clustering. For example, Feld (1981,
p. 1022) observes, “The extent of clustering is equivalent to the extent of ‘transitivity’
among mutual relationships.” Second, because we use the Newman et al. (2001) model,
we follow their nomenclature, for consistency, while recognizing its debt to the concept
of transitivity.

American Journal of Sociology
470
The above functions are then used to calculate the number of neighbors
that an individual has in a unipartite projection of the network, a network
represented by actors only (teams are not shown):
[ ]
[ ]
G (x) p f (g x )/g 1 ).
(3)
0
0
0
0
Equations (2) and (3) are used to calculate a bipartite random cluster
coefficient (eq. [4]). In equation (4), M is the total number of groups in
the network, and N is the total number of individuals in the network:
M g (1)
0
bCC p
.
(4)
r
N G (1)
0
The random CC lies on a scale that varies from zero to one and has the
same interpretation as the actual CC except for the random graph. The
CC ratio is CC actual/CC random. As noted above in the theory section,
as this ratio exceeds 1.0, the amount of true clustering, or between-team
clustering, increases, and the types of ties that account for the clustering
are disproportionately repeated ties and ties with third parties in common.
The actual PL is calculated by taking the weighted average of the PL
of each actor in the network. The average path length for a random
bipartite graph is computed by using the same degree distribution as the
bipartite random cluster coefficient. In a unipartite random graph, the
PL is estimated as
, where k is the number of links, and n
log (n)/ log (k)
is the number of actors in the network for large networks. In the bipartite
network, paths are traced from both the perspective of the actor and the
team of which the actor is a member. This is done by using the first
derivative of the functions defined in equation (2), evaluated as one. This
is used to construct equation (2), which is the random bipartite path length
(Newman et al. 2001). The PL ratio is equal to PL actual/PL random.
Formally, the random PL is
bPL p ln (n)/ ln [ f (1) 7 g (1)].
(5)
r
0
0
To test our hypothesis inclusively, we use two specifications of the small
world model. First, we separately include the CC ratio and PL ratio as
linear and squared terms in our equations. Second, we enter the small
world quotient (hereafter, small world Q), calculated as CC ratio/PL ratio
as a linear and squared term.
8
8
Because in a mature small world like ours, the PL ratio behaves like a fixed effect
with a constant value near one, many researchers have used the small world quotient
to incorporate the effects of the CC ratio and PL ratio in one variable (Kogut and
Walker 2001; Davis et al. 2003). This measure’s drawback, however, is that the separate
effects of each ratio are hard to discern. Consequently, we apply an inclusive treatment
of the theory and model the small world quotient, as well as the CC ratio and PL
ratio, as separate variables.

Collaboration and Creativity
471
Construct Validity
As one of the first empirical tests of the effects of a small world on
performance, we conducted tests of construct validity to bolster our in-
ferences about how changes in the small world Q affect changes in the
network’s level of connectivity and cohesion. We use the widely accepted
multimethod-multitrait matrix (MMTM) approach. In the MMTM ap-
proach, the theoretical construct under scrutiny is valid if it positively
correlates with related constructs (convergent validity) and is unrelated
to different constructs (discriminant validity).
Structurally, we argued that increases in the small world quotient pos-
itively correlate with more between-team ties. This happens when more
people work on multiple productions. If every artist made just one show
or made multiple shows but always with the same teammates, the network
would be made up of isolated clusters. This suggests that a network is
more connected if 20% of the artists have worked on 10 shows versus
5% on 10 shows. This distributional relationship is conveyed in a power-
law graph, which graphs on the y-axis the probability of an actor having
worked on a certain number of shows against the number of shows on
the x-axis; formally prob(no. of shows) versus number of shows. When
the regression line coefficient fit to the above quantities is nearer zero, the
odds of working on one show are closer to the odds of working on many
shows and vice versa. If the odds of working on one show are close to
the odds of working on many shows, it indicates that there are many
between-team ties connecting the global network. Thus, if we are correct
in arguing that the structure of the network becomes more connected as
Q increases, the coefficient of the line fit to prob(no. of shows) versus
number of shows should move closer to zero as the small world Q
increases.
To test this relationship, we constructed power-law graphs by calcu-
lating how many links each artist has per year in the global network
(Moody 2004). To account for the bipartite structure, we used number of
shows as a proxy for number of ties. From these numbers, we calculated
the probability of having a given number of links as well as the probability
of having more than a given number of links. These probabilities were
then graphed as the prob(no. of shows) versus number of shows for each
year, and a regression coefficient was calculated to estimate the power-
law exponent for each year. Thus, if we are right that global connectivity
increases with the small world, then there should be a positive and sig-
nificant correlation between the regression coefficients from the power-
law graphs and Q. Consistent with this test, we found that the correlation
was
(
).
r p .81 P
!
.000
Similarly, if changes in the small world nature of the network signify

American Journal of Sociology
472
changes in the type of connectivity of the network, then Q should be
positively correlated with the number of ties per artist per year, or k,
because global connectivity increases with k (Moody and White 2003).
Consistent with this expectation, table 2 shows that for a given k equal
to at least 10, 20, 30, 40, or 50 ties, the probability of any artist having
k or more ties is positively and significantly related to the small world Q.
After about 50 ties the correlations remain positive but drop off in mag-
nitude because the number of artists with more than 50 ties is small.
Consequently, the correlation between the small world Q and the cu-
mulative probability of
has fewer observations and many zeros.
prob(k)
The statistical insignificance of 10 ties or more also makes sense because
nearly all actors have about 10 ties, since the average team size is about
seven.
Relationally, we argued that as a small world network becomes more
connected, repeated and third-party-in-common ties disproportionately
make up the connecting links. To test these relationships, we constructed
a variable that is the percentage of teams each year with at least one
repeated tie, where a repeated tie indicates that those individuals worked
on at least two shows and with one another. This variable provides the
most conservative test of our claim because we underestimate the number
of repeat ties to the degree that teams have more than one repeated tie
at a time. Consistent with our arguments the small world Q and repeated
ties are highly positively correlated (
,
), which indicates
r p .47 P
!
.001
that as Q increases, connectivity is increasingly a result of repeated ties.
To test the relationship between the small world Q and third-party ties,
we constructed a variable with the percentage of teams with at least three,
five, seven, and 10 third-party ties in common. A third-party tie occurs
when two collaborators work with each other for the first time on a show
and have previously worked with the same person or persons on a prior
show. If there are five third-party ties on a team, it means that two
collaborators can have five prior third-party collaborators in common, or
that two teammates have two third-party collaborators, and two other
teammates have three prior third-party collaborators. Thus, the more
third-party ties in common, the more the global network is linked via
cohesive ties. Consistent with our expectations, Q is positively correlated
with the number of third-party ties per team: three third-party ties per
team (
), five third-party ties per team (
), seven third-party
r p .61
r p .63
ties per team (
), and 10 third-party ties per team (
), where
r p .65
r p .60
for all tests.
P
!
.000
Finally, when all the comparisons between Q and the above variables
are tested for the CC ratio, the same patterns emerge as expected given
the relative constancy of the PL ratio in this mature network. Thus, the

Collaboration and Creativity
473
TABLE 2
Relationship between Number of Ties
per Artist, k, and Small World Q
Power-Law Estimate of
the Probability of an
Artist with This Many
Ties or More
r with Q
P-Value
10 ties or more . . . . . . . . .
.2154
.1554
20 ties or more . . . . . . . . .
.4349
.0028
30 ties or more . . . . . . . . .
.6650
.0000
40 ties or more . . . . . . . . .
.4962
.0005
50 ties or more . . . . . . . . .
.3021
.0437
above evidence corroborates our arguments that our small world measures
operationalize what they purport to measure.
Control Variables
To account for other factors that can affect the success of a musical
production, we control for production-team-level network structures, the
human capital of creative artists on each team, and economic variables
at the level of the production and the economy. Production-team-level
network variables capture the degree to which the network arrangements
of the team shape success (Faulkner and Anderson 1987; Lazer 2001),
human capital variables capture the degree to which talent rather than
the organization of talent affects success (Faulkner 1983; Baker and
Faulkner 1991), and market controls capture the degree to which economic
and period conditions independently affect success. Although we do not
make hypotheses about these effects, we control for them empirically in
our models.
Team Network
To control for the production team’s ability to reach talent in the global
network of artists, we computed the closeness centrality of the production
team by calculating the closeness centrality for each team member (i.e.,
librettist, composer, etc.), summing the centrality scores, and then dividing
that sum by the number of teammates. Teams with a high centrality score
are at the center of the network and can reach the greatest number of
other artists through the fewest intermediaries (Borgatti and Everett
1999).
Weak tie bridges and structural holes also govern a team’s ability to
reach easily the talents of diverse artists (Granovetter 1973; Burt 2004).

American Journal of Sociology
474
To account for these relationships, we computed Burt’s (2004) structural
hole measure for each person on the team, summed these quantities, and
divided the sum by the number of teammates. To be conservative, we
also adjusted this measure for the number of “redundant” holes there are
among teammates for cases where two or more teammates were the only
third persons to connect two otherwise disconnected artists. Each non-
redundant hole got a score of one; if there were two teammates who acted
as structural holes between the same two people, each hole got a score
of 1/4 (one divided by the number of people squared, 1/4 for two, 1/9 for
three, etc.) so that the value of the structural hole was shared among
teammates. The adjusted measure was highly correlated (
) with
P
!
.000
the unadjusted measure and produced similar results.
We controlled for a production team’s local cohesion with several mea-
sures. First, we used the standard measure of local density, which looks
at the fraction of each teammate’s ties that are tied to each other. We
constructed this measure by calculating the density of each artist on the
team (number of each artist’s ties that are tied to each other divided by
the total possible number of ties among the focal artist and all his or her
ties), summing that ratio for each artist on the team, and then dividing
that sum by the number of team members. Second, to gauge the impor-
tance of the connections between individuals, it is important to differ-
entiate between single- and multiple-time encounters. In the Broadway
musical industry, artists have significant control over whom they work
with and probably prefer to repeat collaborations with others whom they
believe will enhance their chances of future success. To construct a mea-
sure of this construct, we created percentage of repeat ties, which is a
count of the number of repeat ties on each production team divided by
the number possible. We also tried the count of repeated ties per team,
which did not alter the results. Third, to measure the degree of similarity
among the members of the production team, we calculated a structural
equivalence score for each team. A high structural equivalence score in-
dicates that the production team is made up of artists who have worked
with many of the same past collaborators even if they have not worked
with each other before, a condition that increases cohesiveness and fa-
miliarity with similar creative material. If the structural equivalence score
is low, then the artists have had few collaborators in common, and it is
plausible to assume that the creative team’s makeup has varied artistic
styles. We calculated structural equivalence two ways. First, we used the
straightforward Euclidian distance measure. Second, we used Jaccard
matching, which is specifically designed for binary data like ours. It is
computed by taking a, the number of links that both artists share, and
dividing by the sum of a, b—the number of links artist 1 has but artist
2 does not have—and c—the number of links artist 2 has but artist 1

Collaboration and Creativity
475
does not have, or
. Both measures produced similar results.
a/(a
⫹ b ⫹ c)
Consequently, we presented the more familiar Euclidian distance measure.
Individual Talent
To gauge the past talent of the production team, we calculated the success
in prior shows by summing across teammates the number of unique past
hits that they had achieved. A high number indicates that the production
team members on average have been hit makers and have established
reputations that can influence the success of the current show (Baker and
Faulkner 1991). However, the binary nature of hits excludes shows that
were good but not quite great. Consequently, we also calculated success
in prior shows by taking the average of the count of the number of
performances of each teammate’s prior shows. Empirically, number of
prior hits and length of prior runs were indistinguishable in the analyses,
and so we present only the number of hits. To measure the accumulated
past experience, know-how, and developed skill of the production team,
we computed the number of past collaborators for the production team
by counting the number of past collaborators of each teammate and then
dividing by the number of teammates.
Market Characteristics
We constructed an extensive range of market variables to account for
differences in the cost of a show, competition among shows, location,
economic conditions, period effects, and year. The production costs of a
show are typically associated with a large cast that drives up recruitment,
directing, and salary costs; set and costume design costs; and other ad-
ministrative costs. Because this effect is likely to diminish as the pro-
duction grows, we took the log of the size of the cast to operationalize
production size.
Independent of a new musical’s quality, the competition among shows
for the consumer’s dollar can also affect success. New shows benefit from
competition when the market has a small fraction as opposed to a large
fraction of new releases (Faulkner 1983). To control for competition, we
created a variable called percentage of new show openings that year, which
is the number of new shows opening that year divided by the number of
shows playing. Another possible specification of this variable is to split
it into two separate variables where one variable is the numerator and
the other is the denominator of the percentage of new shows variable.
The drawback of this measure is that the number of new releases and
number of shows playing is highly correlated (
), creating multi-
r p .84

American Journal of Sociology
476
collinearity problems. Nevertheless, to be conservative we tried both spec-
ifications, and the results were similar.
Another measure of competition among shows is the theater in which
the show plays. It is well known that the Broadway region between 42d
Street, 49th Street, 8th Avenue, and Broadway is the “core district.” The
playhouses in the core district are tightly packed and located next to
bistros, pubs, and convenience stores. Thus, independent of the show’s
quality, the bustling, well-lit, and public environment makes shows in
this district “crime safest” as well as best situated for a night out on the
town, especially for the out-of-town theater goer who will likely gravitate
toward the center of the action. To measure this effect, we categorized
each theater’s physical location as being in the center or periphery of the
district with the variable core theater (1 p yes). It is notable that the
placement of a show in a core playhouse is driven by numerous factors—
competition (i.e., the other shows already playing in the core theaters),
size of musicals, and perhaps the anticipated hit potential of the show.
In our model, we control for competition and production size. We cannot
control for the anticipated hit quality of the show. However, this factor
is unlikely to create a systematic bias because of the difficulty of predicting
a hit show (Rosenberg and Harburg 1992). Thus, this variable may cor-
relate with factors other than theater goers’ convenience, but probably
in unsystematic ways.
We included the standard economic control variables for this industry
(Vogel 2001). To control for changes in sources of revenue, we included
the variable inflation-adjusted ticket price, where tickets are the main
source of revenue. This variable was measured as the average yearly ticket
prices for a Broadway show (Variety 1945–89) adjusted for inflation rel-
ative to other goods and services that compete for the consumer’s leisure
dollar. Because the price of a Broadway show is relatively similar across
all shows within seating categories (e.g., house seats vs. mezzanine), one
average price controls for how differences in yearly ticket prices might
affect a show’s success over time (Vogel 2001). We used the following
formula to compute the inflation-adjusted ticket price per year: adjusted
price per year p 1989 price # (year’s CPI/1989 CPI). For example, the
inflation-adjusted price for 1945 is
(18/124).
$5.09 p $35.07
The cost of capital can affect the scale of a production, the hiring of
top talent, or the length of time investors permit a weak show to stay
open in the hope of rebounding from a poor start. To control for the cost
of capital, we included the prime rate.
General economic conditions also affect the level of disposable income
consumers have for entertainment, the amount of investment capital in
the hands of financiers, and inflation. To control for this bundle of eco-
nomic conditions, we included change in the GDP.

Collaboration and Creativity
477
Finally, to control for key changes in the marketing- and performance-
related technology of the industry between 1945 and 1989, we included
a period effect called post-1975 (1 p yes). After 1975, “twofers” were
introduced—discount two-for-one tickets that made the high price of a
Broadway show more affordable to the masses. At nearly the same time,
inconspicuous microphones for vocalists were introduced. This allowed
a “new breed” of voices to appear in musicals. Before that time, Broadway
favored vocalists like Ethel Merman who could “sing to the back row.”
After 1975, critics’ notices also grew longer in allied arts like film, which
enabled reviews to contain more commentary than before (Baumann
2001). Table 3 presents descriptive statistics on our variables.
Statistical Model
Our design uses an ordered probit to model for the three-category hit-
flop-failure financial success variable and uses ordinary least squares
(OLS) regression to model critics’ reviews as well as system-level out-
comes, which are measured on a continuous scale. To capture the effect
of a small world on the performance of a musical, we follow the multilevel
modeling practice of regressing the lower-level variable (i.e., the proba-
bility of a musical’s success) on the higher-level variable (i.e., the small
world Q).
Although the multilevel modeling technique is common practice in
many scholarly domains (Maas and Hox 2004) the method can suffer from
three methodological threats to validity. These threats are reverse cau-
sality, omitted variables, and clustering (Duncan and Raudenbush 2001).
We handle these issues as follows. Reverse causality concerns whether
individual-level action causes the macrolevel outcome, rather than the
reverse. In our case, this problem is negligible because our small world
constructs are measured prior to the musical’s opening, while the musical’s
performance is measured after the musical’s opening. The omitted vari-
able issue reflects the concern that some third, unmeasured variable ac-
counts for the macrovariable’s effect. While it is impossible to control for
all imaginable variables, there is a relatively finite set of critical variables
for which to control. We control for change in the GDP, prime rate, ticket
prices, and intershow competition. In particular, GDP is important be-
cause it correlates at about .90 with many other macroeconomic variables
that affect the industry such as the unemployment rate, DOW, and dis-
posable income (Vogel 2001). Moreover, we control for most individual-
level and production-team-level variables, further minimizing the chance
that we have omitted a crucial variable at higher or lower levels of anal-
ysis. Clustering is appropriately handled by adding Huber-White correc-
tions to control for the nonindependence of observations across rows (i.e.,

American Journal of Sociology
478
TABLE 3
Descriptive Statistics
Variable
Mean
SD
Min
Max
Hit, flop, or fail . . . . . . . . . . . . . . . . . . . . . .
1.127
.577
.000
2.000
Artistic score . . . . . . . . . . . . . . . . . . . . . . . . .
⫺.142
1.164
⫺2.000
2.000
% hits per season . . . . . . . . . . . . . . . . . . . .
.226
.130
.000
.600
% raves per season . . . . . . . . . . . . . . . . . .
.154
.132
.000
.444
Average artistic score per season . . .
⫺.14
.53
⫺1.2
.75
Small world Q . . . . . . . . . . . . . . . . . . . . . . . .
1.853
.447
1.331
3.019
Small world Q squared . . . . . . . . . . . . . .
3.635
1.952
1.771
9.117
Cluster coefficient ratio . . . . . . . . . . . . . .
1.971
.500
1.437
3.313
Cluster coefficient ratio squared . . . .
4.136
2.358
2.065
10.977
Path length ratio . . . . . . . . . . . . . . . . . . . . .
1.348
.058
1.258
1.471
Closeness centrality . . . . . . . . . . . . . . . . . .
2.952
.431
1.000
5.185
Structural holes . . . . . . . . . . . . . . . . . . . . . .
.273
.160
.000
.679
Local density . . . . . . . . . . . . . . . . . . . . . . . . .
.354
.220
.101
1.000
% repeated ties . . . . . . . . . . . . . . . . . . . . . . .
.096
.157
.000
1.000
Structural equivalence . . . . . . . . . . . . . . .
5.221
2.066
.000
10.899
No. of past hits . . . . . . . . . . . . . . . . . . . . . .
3.311
5.854
.000
43.000
No. of ties . . . . . . . . . . . . . . . . . . . . . . . . . . . .
28.571
25.568
2.000
396.000
Production size . . . . . . . . . . . . . . . . . . . . . . .
1.694
.604
.000
2.639
% of new musicals released . . . . . . . . .
.482
.102
.238
.667
Core theater (1 p yes) . . . . . . . . . . . . . .
.315
.465
.000
1.000
Adjusted ticket prices . . . . . . . . . . . . . . .
10.595
8.012
4.800
35.070
Prime rate . . . . . . . . . . . . . . . . . . . . . . . . . . . .
6.528
3.996
1.500
21.500
% change in GDP . . . . . . . . . . . . . . . . . . .
.006
.023
⫺.007
.154
1975 year indicator . . . . . . . . . . . . . . . . . .
.284
.451
.000
1.000
shows) opening the same year (Duncan and Raudenbush 2001). We also
ran the reported models with a year trend. Because year trend did not
affect the reported results, was not of theoretical significance, and had to
be omitted to include the Huber-White correction, we did not include it
in the analysis. Along with the sandwich estimator approach, the hier-
archical linear model (HLM) can be used to model multilevel analyses.
HLM confirmed the sandwich estimator’s results.
9
SMALL WORLDS AND PERFORMANCE
Table 4 displays the number of new musicals, average team size, Q, actual
CC, random CC, and CC ratio, and the same quantities for PL for each
9
The sandwich estimator in OLS is considered statistically preferable to HLM because
it produces more reliable estimates of the SEs despite the fact that the coefficient
estimates might be more reliable in HLM (Maas and Hox 2004). However, precise
estimates of the coefficients are important only if one is interested in computing the
variance of the group-level variable across groups, which we are not. Consequently,
we present the more familiar and straightforward OLS sandwich model.

Collaboration and Creativity
479
year in our data. Consistent with small world theory, the table shows that
the CC ratio varies considerably, that the actual CC is always significantly
greater than the random CC, and that the PL ratio is consistently near
1.0.
Our main independent variable, Q, peaks in the 1940s and then declines
at an uneven rate from the 1950s through the early 1970s. From the early
1970s through the early 1980s it significantly rises and then levels off
before dropping again through the mid-1980s, after which it rebounds to
its mid-1960s level. This drop and rise in Q signifies that the small world
nature of our network decreased and increased over the time frame of
this analysis. How does this pattern agree with the historical narrative
of the period?
As mentioned above, while the hit machine of Broadway slowed and
quickened from 1945 to 1989 it was not because Broadway suffered from
a lack of outstanding creative talent, nor did it fail to produce some of
its biggest hits of all time. Nevertheless, it faced an accumulation of
overlapping conditions that dislocated and relocated the industry’s cre-
ative talent and traditional audience, reducing and increasing the degree
to which the network was strongly or weakly organized as a small world.
For creative artists, the historic impact of Hollywood and television (and,
to some extent, rock and roll) furnished new prospects for lucrative forms
of their artistry. For audiences, Hollywood and television meant that the
same entertainment dollars could be split among three rather than just
one medium. Both effects created the kind of career uncertainty that
would make it less likely for the same creative artists to work on multiple
shows and for artists to coordinate their repeat collaborations predictably.
Although there are no systematic data on how many Broadway artists
split their time between artistic media, Bob Fosse’s winning of the Triple
Crown indicates that the elites of the network received high praise for
working in multiple artistic domains, while the co-location of the television
industry and Broadway in New York City meant that television probably
recruited local Broadway talent. At the same time, the post–World War
II peep shows of 42d Street and the high crime and offensive decay of
the 1960s and 1970s Midtown Manhattan area made planning and bank-
rolling a show a bigger gamble, which further lowered the ability of
creative artists to coordinate their collaborations.
While the historical record has provided an indeterminate answer as
to whether the “moonlighting” of Broadway’s talent on television and in
Hollywood brought more back to Broadway than Broadway gave to
television and Hollywood, our results suggest that it was disruptive to
the small world order of the network. Q’s decline reflects the drop in
connectivity and cohesion across the global network as it became harder

TABLE 4
Small World Statistics with Newman et al. (2001) Correction for Bipartite
Networks
Year
New
Musicals
Average
Team
Size
Cluster Coefficient
Path Length
Q
CCr/
PLr
Actual Random Ratio Actual Random Ratio
1945 . . .
14
7.1
.287
.077
3.7
3.13
2.23
1.40
2.63
1946 . . .
19
6.8
.295
.073
4.02
3.11
2.24
1.38
2.90
1947 . . .
12
6.7
.311
.074
4.15
3.12
2.27
1.37
3.01
1948 . . .
16
6.6
.315
.078
4.04
3.14
2.34
1.34
3.01
1949 . . .
9
5.8
.319
.089
3.55
3.04
2.36
1.29
2.75
1950 . . .
16
8.4
.325
.097
3.34
3.09
2.40
1.28
2.59
1951 . . .
11
6.4
.33
.109
3.02
3.06
2.41
1.26
2.38
1952 . . .
8
7.0
.328
.109
3.01
3.03
2.36
1.28
2.35
1953 . . .
8
8.0
.338
.116
2.9
2.98
2.28
1.30
2.22
1954 . . .
11
7.9
.328
.115
2.85
2.98
2.24
1.32
2.15
1955 . . .
12
7.8
.33
.133
2.47
2.93
2.22
1.31
1.88
1956 . . .
10
7.8
.345
.135
2.55
2.93
2.24
1.31
1.94
1957 . . .
11
7.2
.355
.14
2.53
2.97
2.25
1.31
1.92
1958 . . .
11
7.0
.353
.136
2.58
3.06
2.25
1.36
1.89
1959 . . .
16
7.4
.342
.139
2.45
3.03
2.27
1.33
1.84
1960 . . .
13
6.8
.343
.144
2.38
3.06
2.34
1.31
1.81
1961 . . .
17
6.1
.338
.146
2.31
3.09
2.38
1.29
1.78
1962 . . .
13
6.0
.344
.16
2.13
3.14
2.39
1.31
1.63
1963 . . .
13
6.9
.324
.154
2.09
3.21
2.38
1.34
1.55
1964 . . .
17
6.9
.314
.147
2.12
3.17
2.38
1.33
1.59
1965 . . .
18
7.2
.304
.141
2.15
3.12
2.40
1.29
1.65
1966 . . .
13
7.5
.301
.146
2.05
3.04
2.37
1.28
1.59
1967 . . .
7
8.3
.302
.148
2.04
2.98
2.33
1.27
1.59
1968 . . .
16
7.9
.329
.165
1.98
2.96
2.32
1.27
1.55
1969 . . .
13
7.3
.33
.166
1.97
2.97
2.36
1.25
1.57
1970 . . .
14
7.0
.331
.167
1.98
2.97
2.36
1.25
1.57
1971 . . .
17
6.0
.354
.18
1.96
3.2
2.46
1.30
1.51
1972 . . .
16
6.7
.381
.188
2.02
3.53
2.51
1.40
1.43
1973 . . .
12
7.4
.389
.193
2.01
3.48
2.56
1.36
1.47
1974 . . .
9
6.4
.391
.189
2.06
3.54
2.57
1.37
1.49
1975 . . .
17
7.3
.371
.146
2.54
3.74
2.58
1.44
1.75
1976 . . .
14
7.7
.376
.146
2.57
3.75
2.58
1.45
1.77
1977 . . .
7
7.0
.375
.139
2.69
3.72
2.53
1.47
1.82
1978 . . .
19
6.6
.364
.141
2.57
3.61
2.49
1.44
1.78
1979 . . .
16
8.6
.358
.148
2.41
3.42
2.45
1.39
1.72
1980 . . .
14
7.9
.365
.149
2.43
3.54
2.49
1.42
1.71
1981 . . .
17
7.8
.355
.153
2.31
3.48
2.53
1.37
1.68
1982 . . .
15
7.1
.355
.169
2.09
3.57
2.53
1.41
1.48
1983 . . .
10
8.6
.361
.178
2.02
3.61
2.59
1.39
1.45
1984 . . .
4
7.0
.358
.178
2
3.59
2.58
1.39
1.44
1985 . . .
9
7.9
.366
.183
2
3.58
2.61
1.37
1.46
1986 . . .
8
7.5
.369
.173
2.12
3.69
2.61
1.41
1.50
1987 . . .
8
6.3
.383
.207
1.85
3.71
2.67
1.39
1.33
1988 . . .
8
6.9
.409
.2
2.04
3.87
2.69
1.43
1.42
1989 . . .
10
6.9
.406
.182
2.23
3.6
2.62
1.37
1.62
Note.—All figures use the Newman et al. (2001) correction for the estimation of the CC and PL of a
bipartite random graph and include a decay function of seven years (see methods section for details).

Collaboration and Creativity
481
for creative artists to coordinate their collaborations predictably than it
had been in the past.
Also, consistent with these observations is the recovery of Q in the
1980s with the renaissance of Times Square and the influx of international
tourists to New York City. (Remember the I Love NY marketing cam-
paign?) The reelevated artistic and commercial options of Broadway en-
ticed creative artists to return to Broadway and to coordinate their col-
laborations better, prompting a rise in Q. Thus, Q agrees with the historical
narrative while quantifying how exogenous shocks decreased and in-
creased the small world’s potential ability to shape the collaboration and
creativity of the artists embedded within it, a conclusion examined in
more detail below in our statistical tests.
Table 5 and table 6 present our multilevel analysis of the success of a
musical. Models 1 and 2 look at the control variables, and models 3 and
4 present our two operationalizations of a small world as linear and as
quadratic terms. Appendix table A1 shows the full model with three
separate specification tests: (1) outliers removed from the data, (2) a probit
specification instead of an ordered probit specification that collapses fail-
ure and flops into one category, and (3) standardized coefficients.
Financial Success of a Musical
Table 5 presents the results of the financial success analysis. Together, the
control variables for economic and team-level network variables explain
about 27% of the variation in hit, flop, and failure according to our pseudo-
R
2
—a high value given the common belief that the success of artistic
productions is essentially unpredictable (Bielby and Bielby 1994). Of the
economic variables, size of production and playing in a core theater have
two of largest and most stable effects across the models. This suggests
that a larger budget and cast widen the appeal of the show, presumably
through investments in more extravagant visuals and performing talent,
while a show in the core of the district is attractive to theater goers. Our
measure of competition failed to reach a level of significance. One expla-
nation for this is that while competition among shows may influence which
shows theatergoers will pay for, the amount of money theatergoers are
willing to spend increases with the number of quality shows available.
Our year dummy for 1975 does not reach significance, indicating that its
effect on financial performance is netted out by other variables. This may
be a result of the fact that the financial effects of television, Hollywood
blockbusters, and cable television could only be partially offset by new
technology and “two-for-one” marketing strategies.
The team-level network variables have important effects, increasing R
2
by about 12%, but the effects are unevenly distributed across our mea-

482
TABLE 5
Ordered Probit Estimates of the Effects of Small Worlds on the Financial
Success of a Musical, 1945–1989
Variable
Model 1
Model 2
Model 3
Model 4
Small world Q . . . . . . . . . . . . .
4.045**
(1.680)
Small world Q squared . . .
⫺.836**
(.359)
CC ratio . . . . . . . . . . . . . . . . . . . .
3.181***
(1.001)
CC ratio squared . . . . . . . . . .
⫺.490***
(.157)
PL ratio . . . . . . . . . . . . . . . . . . . .
.766
(1.895)
Closeness centrality . . . . . . .
.421**
.485***
.452**
(.180)
(.187)
(.186)
Structural holes . . . . . . . . . . .
.846
1.215**
1.220**
(.530)
(.552)
(.557)
Local density . . . . . . . . . . . . . .
.875
1.222*
1.214*
(.571)
(.651)
(.646)
% repeated ties . . . . . . . . . . . .
.294
.276
.328
(.571)
(.605)
(.587)
Structural equivalence . . . .
.028
.039
.035
(.043)
(.042)
(.042)
No. of past hits . . . . . . . . . . . .
.032***
.030***
.030***
(.011)
(.011)
(.011)
No. of ties . . . . . . . . . . . . . . . . . .
.001
.001
.001
(.002)
(.002)
(.002)
Production size . . . . . . . . . . . .
1.284***
1.285***
1.324***
1.315***
(.164)
(.189)
(.196)
(.195)
% of new musicals . . . . . . . .
⫺1.164*
⫺1.480**
⫺.594
⫺.797
(.698)
(.708)
(.801)
(.786)
Core theater (1 p yes) . . .
.565***
.480***
.476***
.483***
(.115)
(.118)
(.118)
(.120)
Adjusted ticket prices . . . . .
⫺.002
.003
.031
.026
(.016)
(.016)
(.019)
(.020)
Prime rate . . . . . . . . . . . . . . . . . .
⫺.038
⫺.031
.005
⫺.002
(.027)
(.026)
(.028)
(.028)
% change in GDP . . . . . . . . .
⫺3.439*
⫺3.328
⫺3.053
⫺3.121
(2.018)
(2.154)
(2.183)
(2.194)
1975 year indicator . . . . . . .
⫺.182
⫺.112
⫺.730
⫺.428
(.419)
(.457)
(.529)
(.473)
Observations . . . . . . . . . . . . . . .
462
442
442
442
x
2
. . . . . . . . . . . . . . . . . . . . . . . . . . .
130.76
157.1
169.2
172.0
Note.—Robust SEs in parentheses. See methods section and app. table A1 for additional specification
tests.
* P
!
.10; two-tailed tests.
** P
!
.05.
*** P
!
.01.

483
TABLE 6
OLS Estimates of the Effects of Small Worlds on the Artistic Success of a
Musical, 1945–1989
Variable
Model 1
Model 2
Model 3
Model 4
Small world Q . . . . . . . . . . . . .
4.311**
(1.794)
Small world Q squared . . .
⫺.942**
(.379)
CC ratio . . . . . . . . . . . . . . . . . . . .
3.584***
(1.253)
CC ratio squared . . . . . . . . . .
⫺.580***
(.198)
PL ratio . . . . . . . . . . . . . . . . . . . .
.344
(1.904)
Closeness centrality . . . . . . .
.591**
.558**
.527*
(.265)
(.258)
(.261)
Structural holes . . . . . . . . . . .
⫺.105
.117
.147
(.517)
(.491)
(.471)
Local density . . . . . . . . . . . . . .
⫺.464
⫺.286
⫺.264
(.570)
(.597)
(.564)
% repeated ties . . . . . . . . . . . .
.556
.636
.629
(.382)
(.392)
(.386)
Structural equivalence . . . .
.067
.070*
.071*
(.040)
(.039)
(.039)
No. of past hits . . . . . . . . . . . .
.031***
.028***
.028***
(.009)
(.009)
(.009)
No. of ties . . . . . . . . . . . . . . . . . .
⫺.015***
⫺.015***
⫺.014***
(.003)
(.004)
(.004)
Production size . . . . . . . . . . . .
.341
.282
.365
.350
(.225)
(.230)
(.227)
(.227)
% of new musicals . . . . . . . .
⫺.171
⫺.437
.277
⫺.048
(.724)
(.690)
(.837)
(.845)
Core theater (1 p yes) . . .
.333***
.149
.130
.139
(.118)
(.119)
(.111)
(.115)
Adjusted ticket prices . . . . .
.003
.015
.004
.006
(.048)
(.055)
(.043)
(.045)
Prime rate . . . . . . . . . . . . . . . . . .
⫺.063
⫺.063
⫺.021
⫺.033
(.038)
(.042)
(.048)
(.051)
% change in GDP . . . . . . . . .
⫺2.166
⫺1.389
⫺1.505
⫺1.387
(2.414)
(2.565)
(2.643)
(2.578)
1975 year indicator . . . . . . .
⫺.164
⫺.062
⫺.498
⫺.266
(.515)
(.609)
(.654)
(.617)
Constant . . . . . . . . . . . . . . . . . . .
⫺.442
1.526
⫺4.906
⫺3.833
(.645)
(1.179)
(3.437)
(2.707)
Observations . . . . . . . . . . . . . . .
321
315
315
315
R
2
. . . . . . . . . . . . . . . . . . . . . . . . . . .
.09
.20
.22
.21
Note.—See methods section and app. table A1 for additional specification tests. Robust SEs in
parentheses.
* P
!
.10; two-tailed tests.
** P
!
.05.
*** P
!
.01.

American Journal of Sociology
484
sures. While the more central teams and teams with past hits are more
likely to launch a hit, as expected, the number of past collaborators has
a null effect, suggesting that for success, quality of experience is more
important than quantity. Teams with more structural holes also affect
success in the full model, consistent with recent findings by Burt (2004)
on the network sources of good ideas. Local density, repeated ties, and
structural equivalence have null effects. Thus, a team that is locally
densely connected, made up of many repeated ties, or made up of members
who have had similar experiences with the same third parties is not a
reliable indicator of financial success or failure once we control for other
factors.
Our hypothesis predicted an inverted
U
-shaped relationship between
our network’s level of small worldliness and the probability of financial
success. We argued that an intermediate level of small worldliness would
increase the probability of success, while low and high levels of small
worldliness would dampen prospects of success. To test this hypothesis
we used two specifications of small worldliness. First, we introduced into
our control variable models the small world Q as a linear and as a qua-
dratic term. Consistent with our prediction, the linear small world Q was
positive and significant, and the squared small world Q was negative and
significant. Second, we introduced into control variable models the CC
ratio and CC ratio squared along with the PL ratio as a control. Again,
consistent with our prediction, the linear term was positive and significant,
and the quadratic term was negative and significant. These findings sug-
gest that as the level of connectivity and cohesion increase at the global
level of analysis, the probability of success increases up to a certain thresh-
old, after which point increases in the amount of order harm financial
success.
Artistic Success of a Musical
Artistic success is affected by economic and team-level network variables
in ways that are similar to financial success but with notable exceptions.
As with financial success, a team with central artists and a track record
of past hits gets high artistic marks from the critics. The number of
previous collaborators had no effect on the financial success model but
had a negative effect on artistic success. This negative effect seems some-
what counterintuitive given that conventional wisdom holds that expe-
rience breeds success. One reason for this discrepancy may be that artists
who develop expansive contact networks do so at the expense of depth
(Faulkner and Anderson 1987).
Two other notable differences exist between the artistic and financial
success models. Whereas in the financial success models size of production

Collaboration and Creativity
485
and core theater had large effects, in the artistic success model these
variables have null effects. This suggests that whereas the public gravi-
tates to large, extravagant, and centrally located shows, critics’ notices
are not swayed by these factors—a finding that is consistent with the
belief that a critic’s impression of a musical’s artistic merits should be
independent of factors that are weakly related to content.
As predicted by our hypothesis, both our operationalizations of small
worldliness are in the expected directions. The linear term was positively
related, while the squared term was negatively related for both the small
world Q model as well as the CC ratio model, holding the PL ratio con-
stant. Thus, consistent with our theory and prediction, we found that the
small worldliness had a robust effect on two separate but related perfor-
mance behaviors of the system, reinforcing the generality and originality
of our results.
Financial and Artistic Success of a Season
It follows logically from our multilevel arguments that if a small world
affects the behavior of actors within the system, it should also affect
cognate behavior at the system level. If we are correct that the small
world structure influences the creativity of production teams through var-
iations in the level of connectivity and cohesion in the global network,
then during periods of optimal connectivity and cohesion the collective
success of teams in that year should also be superior to the collective
success of teams in years of suboptimal connectivity and cohesion. By
looking at the effect of a small world at multiple levels, we submit our
arguments to tests that are both conservative and multifaceted.
To test the effects of small worlds at the system level, we regressed our
three system-level variables: (1) the annual percentage of hits; (2) the
annual percentage of rave reviews; and (3) the annual average of reviews
on the other relevant system-level control variables: number of teams
with a past history of producing hits, number of shows opening in core
theaters, percentage of shows that were new musicals that year, ticket
price, prime rate, and GDP.
Table 7 presents the results of our three system-level dependent vari-
ables. The models show good fit to the data, with an R
2
of .37, .40, and
.48, respectively. Consistent with our predictions, all three measures of
systemic-level performance have an inverted
U
-shaped relationship with
our two operationalizations of a small world. These results provide an-
other array of confirmatory evidence in support of our small world theory.

486
TABLE 7
OLS Estimates of the Effects of a Small World on the Percentage of Hit Shows, Percentage of Rave Shows, and
Average Critics’ Reviews per Season, 1945–1989
Variable
% Hit Shows
% Rave Shows
Average Critics’
Score across All
Shows
Model 1
Model 2
Model 3
Model 4
Model 5
Model 6
Model 7
Model 8
Small world Q . . . . . . . . . . . . . . . . . . . . . .
1.436***
1.636***
5.553***
(.505)
(.493)
(1.865)
Small world Q squared . . . . . . . . . . . .
⫺.311***
⫺.357***
⫺1.212***
(.114)
(.111)
(.419)
CC ratio . . . . . . . . . . . . . . . . . . . . . . . . . . . . .
1.117***
1.162***
3.953***
(.354)
(.350)
(1.314)
CC ratio squared . . . . . . . . . . . . . . . . . . .
⫺.181***
⫺.188***
⫺.639***
(.059)
(.058)
(.219)
PL ratio . . . . . . . . . . . . . . . . . . . . . . . . . . . . .
.262
⫺.090
⫺.913
(.588)
(.560)
(2.10)
No. of teams with hits . . . . . . . . . . . . .
⫺.001
.001
⫺.001
.002
.002
⫺.000
⫺.016
⫺.021

487
(.012)
(.011)
(.011)
(.012)
(.011)
(.010)
(.039)
(.039)
No. of shows in core theaters . . . . .
.004
⫺.000
.005
.013
.009
.016
⫺.006
.017
(.018)
(.017)
(.017)
(.020)
(.018)
(.017)
(.067)
(.066)
% of new musicals . . . . . . . . . . . . . . . . .
⫺.311
⫺.065
⫺.148
⫺.203
.151
.024
.827
.351
(.294)
(.285)
(.279)
(.295)
(.284)
(.273)
(1.06)
(1.032)
% change in GDP . . . . . . . . . . . . . . . . . .
1.184
1.461*
1.309
.129
.458
.333
5.75*
5.400*
(.907)
(.835)
(.836)
(.877)
(.780)
(.766)
(2.93)
(2.899)
Adjusted ticket prices . . . . . . . . . . . . . .
⫺.003
.007
.005
⫺.009
.002
.001
⫺.032
⫺.033
(.005)
(.006)
(.005)
(.012)
(.012)
(.011)
(.044)
(.042)
1975 year indicator . . . . . . . . . . . . . . . . .
⫺.060
⫺.202
⫺.114
⫺.037
⫺.156
⫺.120
⫺.312
⫺.284
(.090)
(.125)
(.085)
(.110)
(.138)
(.099)
(.517)
(.375)
Constant . . . . . . . . . . . . . . . . . . . . . . . . . . . . .
.415***
⫺1.717*
⫺1.266**
.310*
⫺1.478
⫺1.623***
⫺4.630
⫺5.929
(.131)
(1.010)
(.582)
(.161)
(1.005)
(.585)
(3.770)
(2.215)
Observations . . . . . . . . . . . . . . . . . . . . . . . .
45
45
45
37
37
37
37
37
R
2
. . . . . . . . . . . . . . . . . . . . . . . . . . . . . . . . . . . .
.18
.37
.34
.13
.40
.39
.48
.46
Note.—OLS results are shown; Tobit models of the percentage dependent variables produced nearly identical estimates. See methods section and app.
table A1 for additional specification tests.
* P
!
.10; two-tailed tests.
** P
!
.05.
*** P
!
.01.

American Journal of Sociology
488
Effect Sizes
Figures 4, 5, 6, and 7 visually present the bivariate relationships for our
small world Q and the probability of a hit versus a flop, an artistic success,
percentage of hits, and percentage of raves, respectively. All four graphs
support one inference: an intermediate level of small worldliness produces
the most beneficial small world effect on both financial and artistic success.
Either too little order or too much order in the level of small worldliness
dampens the likelihood that a musical succeeds.
Figure 4 shows the magnitude of the effect of Q on financial perfor-
mance. The results indicate that at the predicted bliss point of Q (about
2.6), a musical’s probability of being a hit is about 2.5 times greater than
the lowest value of Q (about 1.4), while the probability of a flop drops
by 20%. Figure 6 shows that the chance of the percentage of hits in a
season is over three times greater at the bliss point (about 2.37) than when
small worldliness is low (about 1.4). Figures 5 and 7 display the relation-
ship between the small world Q and artistic success. The graphs show
that the chances of a show’s being an artistic success are about three
times greater at the bliss point (about 2.3) than at the lowest level of Q,
while in figure 7, the chances of the percentage of raves per year goes up
about four times at the bliss point in figure 7.
Several noteworthy patterns are prompted by a comparison of the ef-
fects of small worlds on commercial and artistic success. First, the patterns
suggest that both fiscal and artistic success is hurt more by too little
connectivity and cohesion than by too much connectivity and cohesion,
at least within the range of Q in our data. Too little order is worse than
too much. Second, while artistic and commercial success are affected
differently by different variables (e.g., being in a core theater had no effect
on critics’ appraisals), the effects of the small world structure on our
dependent variables are similar across different specifications and levels
of analysis. The consistency of effects of the small world suggest that they
are structurally robust in their effect on behavior, perhaps governing a
fundamental aspect of creativity in teams such that whether the objective
is commercial success, artistic success, or both, an optimal balance of
order in the network generates a regular pattern of effects, an effect that
could partly account for the high incidence of small world networks in
diverse systems of exchange as well as their robustness.
Post Hoc and Out-of-Sample Confirmatory Tests
Despite the consistent confirmation of the
U
-shaped effects for multiple
estimators and model specifications, the removal of outliers, and com-
pound levels of analysis, it is worth noting the uneven dispersion of data
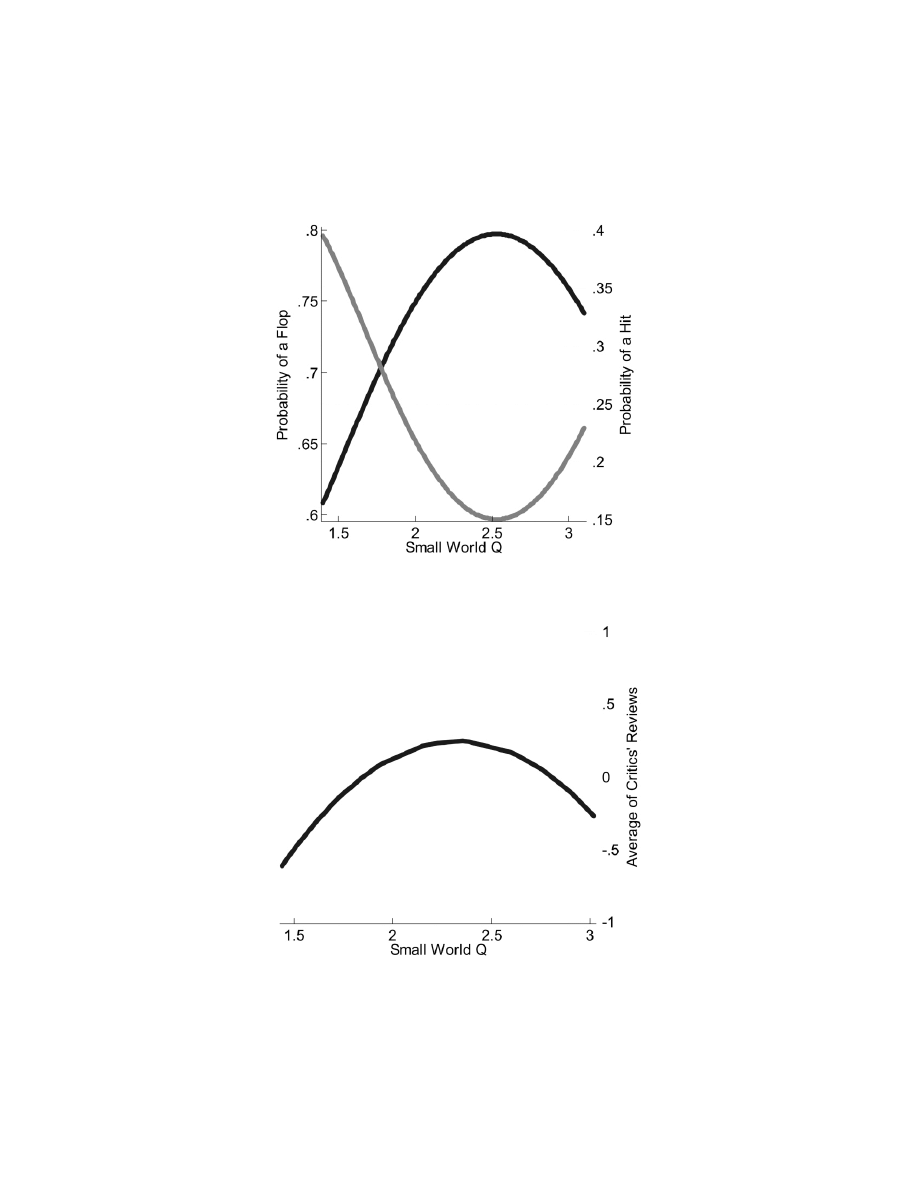
Fig. 4.—Financial success of a show
Fig. 5.—Artistic success of a show
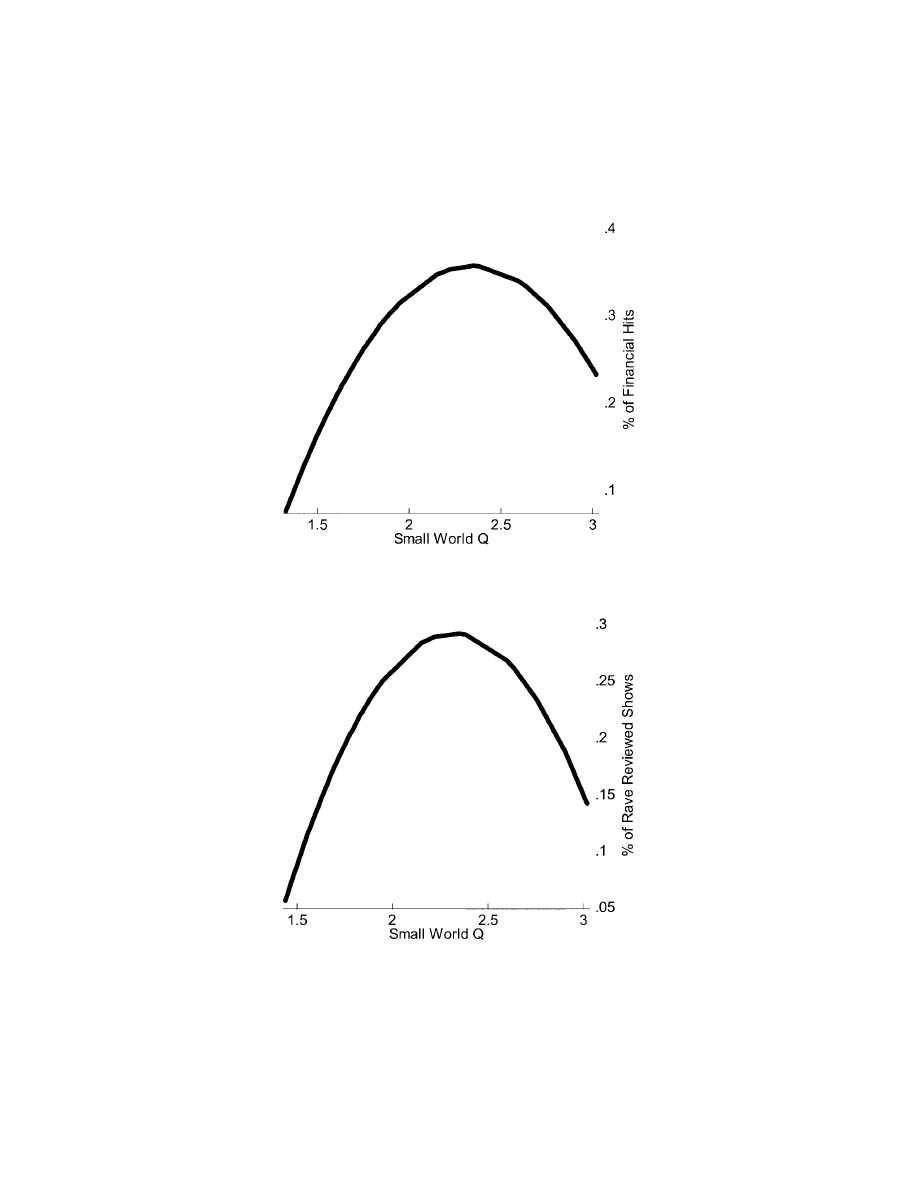
Fig. 6.—Financial success of a season
Fig. 7.—Artistic success of a season

Collaboration and Creativity
491
across the curves. About 80% and 85% of the data lie to the left of the
crest for the artistic and financial success models, respectively. These fig-
ures might suggest that the data to the right of the bliss point are rare,
and if so, the analysis can simplify to a positive and linear relationship.
While a positive and linear relationship would still be an important
finding for a truncated sample of data, we believe this conclusion is pre-
mature and may be misleading. First, under most circumstances, a result
that involves 15%–20% of the population is nontrivial. Second, the in-
clusion of these cases is vital for theory building because they show how
performance changes over the range of our small world’s variation rather
than a truncated sample. Third, a straightforward regression of the de-
pendent variables on Q as a linear term does not reach significance (avail-
able from authors). Thus, if these data were disqualified they could pro-
duce misleading conclusions. One could falsely infer that increasing small
worldliness is uniformly beneficial, leading to suboptimal decisions.
Another way to view this problem is to extend our analysis backward
in time to the years prior to 1945, namely, 1900–1945, where Q is often
above our bliss point value of 2.5. This suggests that Q-values to the right
of our bliss point are not rare, but normative, when considered over a
fuller time frame. Unfortunately, we could not include the Q-values from
before 1945 in our statistical analysis because the detailed multilevel,
multivariate data that we have for the 1945–89 period does not exist for
the earlier period. The only data that were available for the earlier period
were the names of the creative artists who worked on each musical, which
we used to compute Q, and a list of hits for 1919–30 that was compiled
by Bordman (1986) and corroborated by Jones (2003, p. 360–61). These
hit data offer two experts’ opinions of the successful shows for the 1919–
30 period using criteria that are comparable to the hit criteria we used
in the above statistical analysis. Another advantage of this period for
comparison purposes is that it can be ruled out that either a poor economy
or a lack of talent affected the rate of flops during the 1919–30 seasons,
because the economy was strong, and Broadway was flush with talent
(Porter had 2 shows; Rodgers and Lorenz Hart, 12 shows; Hammerstein,
13 shows; Berlin, 1 show; Eubie Blake, 3 shows; Anne Caldwell and
Jerome Kern, 15 shows; Coward, 1 show; and Gershwin, 12 shows). Thus,
while these data cannot definitively test our model outside the range of
data we examined in this article, they do furnish data that can broadly
refute or support the representativeness of our findings.
When we examined the relationship between Q and the percentage of
hits 1919–30, the analysis substantiated our findings. From 1919 to 1930,
Q attained an average value of 4.8, which is among the highest in the
history of Broadway. According to our theory, this would suggest a low
hit rate. Consistent with this prediction, about 90% of the new shows

American Journal of Sociology
492
were flops from 1919 to 1930. By comparison, in the 1945–89 period,
when Q was around the bliss point, about 75% of the shows were flops.
Thus, these data and tests, while only circumstantial, corroborated the
U
-shaped relationship for periods beyond the one studied.
DISCUSSION
Small world networks have been shown to arise in a surprisingly wide
variety of organized systems, from power grids to brain cells to scientific
collaborations. The high incidence with which they occur has led to the
speculation that there is something fundamental and generalizable about
how they organize and govern success in biological, physical, and social
systems alike. The objective of this research was to test that speculation
directly with regard to human creativity and to specify theoretical mech-
anisms that can explain it. We had hoped to create an understanding of
the key performance properties and conditions that lead to beneficial,
disadvantageous, or benign small world network effects.
Our context for study was the network of creative artists who create
original Broadway musicals. We reconstructed the network from archival
data that included every artist who worked on every original Broadway
musical released from 1945 to 1989. These data also included vital time-
varying statistics on the economic characteristics of the market, the pro-
ductions, the relative talent of artists, the local network characteristics of
the creative teams, and two measures of creativity on the musical—
financial success and artistic merit. We found that small world networks
have a robust and novel impact on performance. Small world networks
do benefit performance but only up to a threshold, after which the positive
effects of small worlds reverse.
To explain this behavior we focused on the two properties that define
a small world—the CC ratio and the PL ratio, or simply the small world
Q (formally, CC ratio/PL ratio). We reasoned, following various branches
of network theory, that as the small world Q increases, the separate clusters
that make up a small world become more connected and connected by
persons who know each other well through past collaborations or through
having had past collaborations with common third parties. This suggested
that if the small world Q is low, creative material remains cloistered in
the separate teams that make up the small world. This isolating process
is aggravated by the fact that the few links that do exist between teams
and that can transfer novel but unfamiliar material are also more likely
to be hit and miss in the sense that they are not disproportionately made
up of firsthand third-party ties in common or repeat ties. As the level of
the small world Q increases to a medium level, the level of connectivity

Collaboration and Creativity
493
and cohesion in the network also rises. There is an increase in the level
of connections among teams in the network, and these connections are
increasingly made up of cohesive ties—repeated and third-party-in-com-
mon relationships—that add the necessary level of credibility needed to
facilitate the spread of potentially fresh but unfamiliar creative material
by artists in the network. We also reasoned that too much small world-
liness can undermine the very benefits it creates at more moderate levels.
If the small world Q rises beyond a threshold, the network increases in
connectivity and cohesion to a point at which the positive effects of con-
nectivity turn negative. High levels of connectivity homogenize the pool
of creative material, while repeated ties and third-party-in-common ties
promote common information exchanges, decreasing artists’ ability to
break out of conventional ideas or styles that worked in the past but that
have since lost their market appeal.
Consistent with our hypotheses, we found that the level of small world-
liness has a curvilinear effect on performance. Adding to the confidence
of our inference is that these effects hold independent of levels of analysis,
multiple operationalizations of our small world concepts, several model
specification tests, and two different dependent variables.
Bipartite (Affiliation) and Unipartite Small World Networks
An important part of our framework rests on the distinctiveness of uni-
partite projections of bipartite graphs or what are also called affiliation
networks. These types of networks are common in many types of social
systems. For example, bipartite-affiliation networks characterize board of
directors networks, scientific collaboration networks, movie actor net-
works, and project teams of all kinds (see figs. 1 and 2). In general, they
occur whenever invention is based on teamwork such that the end product
is collaborative handiwork. What is unique about these networks is that
at the team level, they constitute fully connected cliques, and at the global
level, they create a network of dense overlapping clusters joined together
by actors who have multiple team memberships—or classic small world
networks. Our conceptualization of how a small world affects behavior
was specific to bipartite-affiliation networks. We did not speculate on how
our theory would change for unipartite theories, a natural direction for
future research.
Nevertheless, by addressing the key role and special features of bipar-
tite-affiliation networks for social behavior, as well as their relative lack
of attention in past network research, we hope to have enhanced the
potential impact of this work. In that regard, the generality of our model
seems most apropos for the many kinds of networks where production is
team based and roles are specialized, decentralized, and interdependent.

American Journal of Sociology
494
For example, one could imagine extensions of our model for project teams,
boards of directors, voluntary and community service teams, small-size
military units and other security teams, or government cabinets. With
regard to project teams based in commercial business firms or labs in
research and development organizations, it follows logically that a testable
hypothesis would be that the optimal level of product success increases
with a medium level of small world connectedness and cohesion. In com-
mercial firms, this level could even be targeted by design with purposeful
levels of task rotation, job reassignment, or cross-training across practice
areas. In more market-governed project teams such as coauthor or co-
patenting networks in science, the model might be developed to compare
the relative creative potential of different fields (see Guimera et al. 2005).
For example, do fields that come to rest too far to the left of the bliss
point indicate a lack of ability to assimilate the diverse talent in their
fields successfully? Will the science produced from fields far and close to
the bliss point vary in their impact factors?
From another direction, a question could be asked as to whether our
results hold for the creative enterprises not at the center of a field but at
its edge. Would we find the same patterns for off-Broadway and exper-
imental theater, where there is less of a focus on creativity through con-
vention plus extension than there is for Broadway? While more research
is obviously needed before extensions of this research can be made to
other contexts and to target levels of Q, it does provide a new avenue of
research that follows in the tradition of research on the strength of weak
ties and embeddedness, which have been extended from their original
sites of job search and organizational behavior to social movements, gen-
der and race studies, mergers and acquisitions, norm formation, price
formation, international trade, and other socioeconomic phenomena
(Montgomery 1998; Rao et al. 2001; Lincoln, Gerlach, and Takahashi 1992;
Sacks, Ventresca, and Uzzi 2001; Ingram and Roberts 2000; Uzzi and
Lancaster 2004).
Egocentric and Global Networks
The small world problem also relates to the interplay between egocentric
and global network structures. While it seems true that most network
research has focused on local network effects that are attached to specific
individuals, or what is called egocentric network phenomena, it is also
true that there exists a powerful literature on community structures (Feld
1981; Baker and Faulkner 1991; Padgett and Ansell 1993; Markovsky
and Lawler 1994; Frank and Yasumoto 1998; Friedkin 1984; Stark and
Vedres 2005; Kogut and Walker 2001; Moody and White 2003; Moody
2004; Bearman, Moody, and Stovel 2004). Our work follows other com-

Collaboration and Creativity
495
munity-level analysis in looking at how the global structure affects per-
formance. In this work, we have shown how one of possibly several
conceptualizations of the global network can influence a system’s per-
formance, while treating the interplay of global and local network effects
as net of one another.
Our main concept in discussing this aspect of the relationship between
local and global properties is that the global network affects the distri-
bution of creative materials, that is, the joint distribution of actors and
teams, available to all actors in the network, and therefore the effects of
their egocentric characteristics are contingent on the small world network
within which they are embedded. This suggests that egocentric properties
such as structural holes, weak ties, or embedded ties (Granovetter 1973;
Uzzi 1997, 1999; Burt 2004) are likely to have consistent but conditional
effects that depend on the small worldliness of the network they are
embedded in. Thus, one path for new research could concentrate on the
statistical interactions between global and local network mechanisms.
Another important distinction between egocentric and global network
conceptualizations is that the behavior of the global network may be only
partly a consequence of egocentric behavior, and its strategic design is
therefore partly beyond the control of individual actors. This important
concept of randomness is rarely addressed in the empirical modeling of
egocentric networks but is actively conceptualized and estimated when
computing the global structure as a way of separating systematic global
network effects from a simple model of random consequences that can
arise in a global network, like Broadway’s, where actors act separately
from each other and without knowledge of, or perhaps intention to shape
the global network. Nonetheless, they affect each other’s behavior through
their collective simultaneous actions in the global network. This view
implies an invisible-hand-like phenomenon for global social network
structures. While this view may be in contradiction to the historic di-
chotomy of markets and networks as well as the emphasis of egocentric
network analysis on strategic design and nonmarket behavior, it has a
basis in other scientific disciplines where the robustness of the global
network to breakdown, the emergence of networks, global welfare ben-
efits, and other systemic network behaviors have been examined relatively
more than egocentric behavior. Thus, one possible way to begin looking
at the relations between egocentric and global network phenomena is to
bring these two research traditions together, a process that is already
showing fruitfulness (Frank and Yasumoto 1998; White 2003; Burt 2004;
Bearman, Moody, and Stovel 2004; Moody 2004; Guimera et al. 2005;
Powell et al. 2005; Stark and Vedres 2005).
Another path is to link the small world conception of global networks
with other global conceptions such as cohesive subgroupings, community

American Journal of Sociology
496
partitions, or the core/periphery hierarchy. In particular, an important
problem to analyze is how these other approaches to global network
structure treat bipartite networks. We spot two issues. First, because of
the dense overlapping nature of fully linked cliques in a bipartite network,
it is not clear where the partitions of communities might begin and end
(Abbott 1996). This is because the criteria used to define a community’s
boundary is that set of agents with more in-group than out-group ties,
which in a bipartite-affiliation network is the team itself, because each
team is a fully linked clique. Obviously, to make community partitions
viable scientifically, there would need to be a logic for aggregating com-
munities from teams, which brings up the second issue worth pursuing.
As noted above, in bipartite-affiliation graphs, there is an inflated level
of clustering because of the fully linked cliques. This means that before
progress can be made toward analyzing the community structure of bi-
partite-affiliation graphs, there needs to be a null model of what constitutes
the correct ratio of in-group and out-group ties as well as the correct
number of partitions. We estimate that an answer to this issue might lie
in a solution similar to that of the bipartite small world model. The key
measures of connectivity and cohesion are not the within-team ties that
have been typical of community network analysis, but the between-team
ties. An examination of these methodological issues is beyond the scope
of this article, yet provides one possible route for future research that can
begin to show the points of commonality and complementarity between
different approaches to the global structure of networks.
Small Worlds, Culture, and History
To better relate how our specific quantitative measures of the network
coevolved with the culture and history of this creative industry, we showed
how the behavior of Q varied with exogenous conditions, dropping and
rising as other artistic domains struck at the foundations of artists’ in-
tentions and ability to plan their Broadway collaborations reliably. For
Broadway, the emerging artistic media of television, post–World War II
Hollywood, and rock and roll raised the uncertainty associated with build-
ing network ties with other artists. Artistic collaborations became more
competitive to create and harder to schedule as artists split their time
between domains, experimented in other domains, or permanently lost
collaborators to non-Broadway undertakings, particularly television,
which stole market share and tempted Broadway stars with a chance for
overnight national stardom (e.g., Rodgers and Hammerstein agreed to be
the first guests to appear on the Ed Sullivan Show).
It is worth mentioning here in more detail how our mathematical model
registers these historic cultural changes in this creative industry. As we

Collaboration and Creativity
497
noted above, the drop in Q represents a decrease in the number of be-
tween-team ties and the number of cohesive ties in the creative artist
network. But Q is the CC ratio/PL ratio, and so the exact source of the
change may be a result of the numerator, denominator, or both. Our above
results indicated that the PL ratio was relatively constant from 1945 to
1989. This means that the change in Q resulted from the CC ratio. When
we examined the CC actual and CC random separately, we found that
both quantities increased over the time period, but that the CC random
increased faster than the CC actual (hence, the net drop in Q, holding PL
ratio constant).
But what does it mean for the CC random to increase faster than the
CC actual in terms of actual human behavior? The increase in the CC
actual means that more artists were working on only one production.
(Remember, in the extreme case where all artists work on one production
only, the network is made up of many isolated, fully linked cliques, and
therefore would have a CC actual of 1.0, where 0.0 is no clustering and
1.0 is complete clustering.) By the same logic, the estimate of the CC
random for a network of isolated, fully linked teams would also have to
be 1.0. Thus, the faster rise in the CC random relative to the CC actual
means that our model (Newman et al. 2001) estimated that the percentage
of between-team ties that were attributable to random connections among
artists rose more quickly than did the actual percentage of between-team
ties calculated with the CC formula.
This reasoning produces the interesting conclusion that the rising un-
certainty in partnering and network building experienced by creative
artists instigated a rise in the propensity of artists to form random links.
This is not to say that artists randomly formed teams, but that the ability
to forecast and design collaborations regularly was curtailed, infusing
happenstance into the process by which collaborators were chosen. If an
artist’s first choice for a collaborator was unavailable for a production
(perhaps the artist’s first choice was waiting on a television or film pro-
duction), the artist would be more inclined to experiment with partners
with whom they had not worked in the past or with whom they did not
have third-party ties in common. This is what is meant by more ran-
domness in the network—the choices of our collaborators are less depen-
dent on the persons with whom we have worked in the past or the af-
filiations of our third-party ties, and more on who is the best available
of those beyond our circle of cohesive relations. In essence, as the intensity
of the small world properties of our network decreased, the network acted
more like a public market for talent.
Although these connections between history and our quantitative model
are somewhat speculative, they raise interesting questions regarding the
response of the network to uncertainty. One might argue that increased

American Journal of Sociology
498
uncertainty would have motivated actors to go with well-known associates
rather than with strangers (Granovetter 1985), yet our findings suggest
that the opposite occurred. What we cannot unequivocally determine at
this point is whether the observed result was a second-best solution to
being able to work with known associates who were simply unavailable,
or whether the experimentation with new ties was a desirable strategy
for coming up with fresh artistic material in an industry that was trying
to adapt to the social milieu of the times.
Dynamics
These observations suggest that a next step is the study of network dy-
namics. If small world networks can have positive and negative impacts,
how do they arise and evolve? What factors lead to the formation of a
small world as opposed to another type of network? What factors lead
to small worlds that have optimal Q’s? What is the role of the intention-
ality of individuals beyond the compositions of their local network ties?
And conversely, what factors lead to stasis, the lock-in of a high- or low-
performing network, or a network’s transformation from one type of
network into another? While work in this area is nascent, the findings
that a small world affects performance can be enriched by understanding
how they come to pass and change—an important goal in an epoch of
connectedness.

APPENDIX A
TABLE A1
Sensitivity Specification Tests of Small World Effects
Variable
Outlier Sensitivity
Financial Success
Outlier Sensitivity
Artistic Success
Probit of Hit versus
Flop
Standardized Co-
efficients for
Financial
Success
Standardized Co-
efficients for
Artistic Success
Model 1
Model 2
Model 3
Model 4
Model 5
Model 6
Model 7
Model 8
Model 9
Model 10
Small world Q . . . . . . . . . . . . . .
5.930***
7.483***
5.795**
1.8117
1.9338
(2.048)
(2.699)
(2.403)
Small world Q squared . . . .
⫺1.312***
⫺1.729**
⫺1.369**
⫺1.6337
⫺1.8735
(.468)
(.654)
(.543)
CC ratio . . . . . . . . . . . . . . . . . . . . .
4.431***
6.305***
4.730***
1.9855
2.1872
(1.199)
(1.412)
(1.385)
CC ratio squared . . . . . . . . . . .
⫺.727***
⫺1.092***
⫺.835***
⫺1.82312
⫺2.1291
(.206)
(.240)
(.231)
PL ratio . . . . . . . . . . . . . . . . . . . . .
.904
.513
1.808
.1177
.0775
(1.828)
(1.690)
(1.786)
Closeness centrality . . . . . . . .
.497***
.449**
.522*
.467
.275
.227
.2074
.1945
.1892
.1803
(.178)
(.177)
(.270)
(.279)
(.243)
(.241)
Structural holes . . . . . . . . . . . . .
1.304**
1.335**
.212
.324
.652
.675
.1958
.1949
.0243
.0215
(.584)
(.588)
(.557)
(.509)
(.728)
(.729)
Local density . . . . . . . . . . . . . . . .
1.289*
1.306*
⫺.112
⫺.042
1.129
1.111
.2718
.2671
⫺.0445
⫺.0502
(.695)
(.686)
(.659)
(.605)
(.833)
(.816)
% repeated ies . . . . . . . . . . . . . .
.446
.519
.666
.664
.742
.829*
.0427
.0515
.0993
.1001
(.668)
(.651)
(.462)
(.453)
(.516)
(.482)
Structural equivalence . . . . .
.044
.038
.074*
.077*
.099
.088
.0806
.0733
.1379
.1370

(.047)
(.046)
(.040)
(.042)
(.061)
(.058)
No. of past hits . . . . . . . . . . . . .
.030***
.030***
.026**
.026***
.026**
.026**
.1728
.1743
.1797
.1803
(.011)
(.011)
(.010)
(.010)
(.012)
(.012)
No. of ties . . . . . . . . . . . . . . . . . . .
⫺.001
⫺.000
⫺.013***
⫺.012**
⫺.001
⫺.000
.0211
.0279
⫺.2827
⫺.2769
(.006)
(.006)
(.004)
(.005)
(.008)
(.007)
Production size . . . . . . . . . . . . .
1.245***
1.234***
.309
.297
.447**
.428**
.7993
.7943
.1448
.1382
(.190)
(.189)
(.238)
(.238)
(.208)
(.207)
% of new musicals . . . . . . . . .
⫺.323
⫺.631
.660
.228
⫺.706
⫺1.027
⫺.0852
⫺.0814
.0013
⫺.0049
(.869)
(.855)
(.900)
(.936)
(.933)
(.929)
Core theater (1 p yes) . . . . .
.497***
.510***
.131
.143
.458***
.473***
.2251
.2250
.0665
.0669
(.120)
(.121)
(.110)
(.117)
(.141)
(.143)
Adjusted ticket prices . . . . . .
.037**
.033*
.000
.006
.021
.016
.2448
.2102
.0260
.0204
(.019)
(.019)
(.043)
(.043)
(.026)
(.028)
Prime rate . . . . . . . . . . . . . . . . . . .
.005
⫺.003
⫺.011
⫺.027
⫺.003
⫺.012
.0328
⫺.0066 ⫺.0824
⫺.1295
(.028)
(.028)
(.046)
(.049)
(.033)
(.033)
% change in GDP . . . . . . . . . .
⫺3.335
⫺3.322
⫺1.543
⫺1.330
⫺4.512
⫺4.628
⫺.0679
⫺.0709 ⫺.0282
⫺.0274
(2.188)
(2.178)
(2.626)
(2.527)
(3.401)
(3.424)
1975 year indicator . . . . . . . . .
⫺.794
⫺.473
⫺.638
⫺.350
⫺.615
⫺.211
⫺.3460
⫺.1926 ⫺.1947
⫺.0982
(.507)
(.449)
(.627)
(.602)
(.603)
(.563)
Constant . . . . . . . . . . . . . . . . . . . . .
⫺8.987**
⫺7.373**
⫺10.622*** ⫺7.569**
(3.409)
(3.434)
(3.464)
(3.120)
Observations . . . . . . . . . . . . . . . .
408
408
288
288
401
401
R
2
. . . . . . . . . . . . . . . . . . . . . . . . . . . .
.27
.27
.23
.21
.14
.14
* P
!
.10; two-tailed tests.
** P
!
.05.
*** P
!
.01.

Collaboration and Creativity
501
REFERENCES
Abbott, Andrew. 1996. “Things of Boundaries.” Social Research 62:857–82.
Amaral, L. A. N., A. Scala, M. Bartelemy, and H. E. Stanley. 2000. “Classes of Small-
World Networks.” Proceedings of the National Academy of Science 111:49–52.
Baker, Wayne, and Robert R. Faulkner. 1991. “Role as Resource in the Hollywood
Film Industry.” American Journal of Sociology 97:279–309.
Baum, Joel A. C., Andrew V. Shipilov, and Tim J. Rowley. 2003. “Where Do Small
Worlds Come From?” Industrial and Corporate Change 12:697–725.
Baumann, Shyon. 2001. “Intellectualization and Art World Development: Film in the
United States.” American Sociological Review 66:404–26.
Bearman, Peter S., James Moody, and Katherine Stovel. 2004. “Chains of Affection:
The Structure of Adolescent Romantic and Sexual Networks.” American Journal of
Sociology 110:44–91.
Becker, Howard S. 1982. Art Worlds. Berkeley and Los Angeles: University of
California Press.
Bielby, William, and Denise Bielby. 1994. “‘All Hits Are Flukes’: Institutionalized
Decision Making and the Rhetoric of Prime-Time Network Program Development.”
American Journal of Sociology 99:1287–1313.
Bloom, Ken. 1996. American Song: The Complete Musical Theatre Companion, 2d ed.
New York: Schirmer.
Bordman, Gerald. 1986. American Musical Theatre: A Chronicle. Oxford: Oxford
University Press.
Borgatti, Stephen P., and Martin G. Everett. 1999. “Models of Core/Periphery
Structures.” Social Networks 21:375–95.
Bourdieu, Pierre. 1996. The Rules of Art: Genesis and Structure of the Literary Field.
New York: Polity Press.
Burt, Ronald S. 2004. “Structural Holes and Good Ideas.” American Journal of
Sociology 110:349–99.
Collins, Randall. 1998. The Sociology of Philosophies: A Global Theory of Intellectual
Change. Cambridge, Mass.: Harvard University Press.
Davis, Gerald F., Mina Yoo, and Wayne Baker. 2003. “The Small World of the
American Corporate Elite, 1982–2001.” Strategic Organization 3:301–26.
DeNora, Tia. 1991. “Musical Patronage and Social Change in Beethoven Vienna.”
American Journal of Sociology 97:310–46.
DiMaggio, Paul J. 1991. “Constructing an Organizational Field as a Professional
Project: U.S. Art Museums, 1920–1940.” Pp. 267–92 in The New Institutionalism
in Organizational Analysis, edited by W. Powell and P. J. DiMaggio. Chicago:
University of Chicago Press.
Duncan, Greg, and Stephen Raudenbush. 2001 “Neighborhoods and Adolescent
Development: How Can We Determine the Links?” Pp. 105–36 in Does It Take a
Village? Community Effects on Children, Adolescents, and Families, edited by Alan
Booth and Ann C. Crouter. State College: Pennsylvania State University Press.
Etzkowitz, Henry, Carol Kemelgor, and Brian Uzzi. 2000. Athena Unbound: The
Advancement of Women in Science and Technology. Cambridge: Cambridge
University Press.
Faulkner Robert R. 1983. Composers on Demand. New Brunswick, N.J.: Transaction.
Faulkner, Robert R., and Andy B. Anderson. 1987. “Short-Term Projects and Emergent
Careers: Evidence from Hollywood.” American Journal of Sociology 92:879–909.
Feld, Scott. 1981. “The Focused Organization of Social Ties.” American Journal of
Sociology 86:1015–35.
Flaherty, Alice W. 2004. The Midnight Disease: The Drive to Write, Writer’s Block,
and the Creative Brain. New York: Houghton Mifflin.
Fleming, Lee, Charles King III, and Adam Juba. 2004. “Small Worlds and Regional

American Journal of Sociology
502
Innovative Advantage.” Working paper. Harvard University, Harvard Business
School.
Frank, Kenneth, and Jeffrey Yasumoto. 1998. “Linking Action to Social Structure
within a System: Social Capital within and between Subgroups.” American Journal
of Sociology 104:642–86.
Friedkin, Noah. E. 1984. “Structural Cohesion and Equivalence Explanations of Social
Homogeneity.” Sociological Methods and Research 12:235–61.
Garebian, Keith. 1995. The Making of West Side Story. Ontario: Mosaic.
Gladwell, Malcolm. 2000. The Tipping Point: How Little Things Make Big Differences.
New York: Little, Brown.
Granovetter, Mark. 1973. “The Strength of Weak Ties.” American Journal of Sociology
78 (6): 1360–80.
———. 1985. “Economic Action and Social Structure: The Problem of Embeddedness.”
American Journal of Sociology 91:481–510.
Green, Stanley. 1996. Broadway Musicals: Show by Show, 5th ed. Milwaukee: Hal
Leonard.
Guimera, Roger, Brian Uzzi, Jarrett Spiro, and Luis A. Nunes Amaral. 2005. “Team
Assembly Mechanisms Determine Collaboration Network Structure and Team
Performance.” Science 308:697–702.
Holland, Paul W., and Samuel Leinhardt. 1971. “Transitivity in Structural Models of
Small Groups.” Comparative Groups Studies 2:107–24.
Ingram, Paul, and Peter Roberts. 2000. “Friendships among Competitors in the Sydney
Hotel Industry.” American Journal of Sociology 106:387–423.
Jones, John Bush. 2003. Our Musicals, Our Selves. Lebanon, N.H.: Brandeis University
Press.
Kantor, Michael, and Maslon Laurence. 2004. Broadway: The American Musical. New
York: Bulfinch.
Kogut, Bruce, and Gordon Walker. 2001. “The Small World of German Corporate
Networks in the Global Economy.” American Sociological Review 66:317–35.
Kuhn, Thomas. 1970. The Structure of Scientific Revolutions. Cambridge: Cambridge
University Press.
Lawrence, Carol. 1990. The Back Stage Story. New York: McGraw.
Lazer, David. 2001. “The Co-evolution of Individual and Network.” Journal of
Mathematical Sociology 25 (1): 69–108.
Lincoln, James R., Michael L. Gerlach, and Peggy Takahashi. 1992. “Keiretsu
Networks in Japan: A Dyad Analysis of Intercorporate Ties.” American Sociological
Review 57 (5): 561–85.
Maas, Cora J. M., and Joop J. Hox. 2004. “Robustness Issues in Multilevel Regression
Analysis.” Statistica Neerlandica 58:127–37.
Markovsky, B., and Edward J. Lawler. 1994. “A New Theory of Social Solidarity.”
Pp. 113–37 in Advances in Group Processes, vol. 11. Edited by Barry Markovsky,
Jodi O’Brien, and Karen Heimer. Greenwich, Conn.: JAI Press.
McPherson, Miller, Lynn Smith-Lovin, and James Cook. 2001. “Birds of a Feather:
Homophily in Social Networks.” Annual Review of Sociology 27:415–44.
Menon, Tonya, and Jeffery Pfeffer. 2003. “Valuing Internal vs. External Knowledge:
Explaining the Preference for Outsiders.” Management Science 49:497–513.
Merton, Robert K. 1973. The Sociology of Science. Chicago: University of Chicago
Press.
Milgram, Stanley. 1967. “The Small World.” Psychology Today 2:60–67.
Montgomery, James D. 1998. “Toward a Role-Theoretic Conception of Embeddedness.”
American Journal of Sociology 104:92–125.
Moody, James. 2004. “The Structure of a Social Science Collaboration Network:
Disciplinary Cohesion from 1963–1999.” American Sociological Review 69:213–38.
Moody, James, and Douglas R. White. 2003. “Social Cohesion and Embeddedness: A

Collaboration and Creativity
503
Hierarchical Conception of Social Groups.” American Sociological Review 68:
103–27.
Newman, Mark E. J. 2000. “Models of the Small World.” Journal of Statistical Physics
101:819–41.
———. 2001 “The Structure of Scientific Collaboration Networks.” Proceedings of the
National Academy of Sciences 98:404–9.
Newman, Mark E. J., Steve Strogatz, and Duncan Watts. 2001. “Random Graphs with
Arbitrary Degree Distributions and Their Applications.” Physical Review E 64:1–17.
Padgett, John F., and Chris Ansell. 1993. “Robust Action and the Rise of the Medici,
1400–1434.” American Journal of Sociology 98:1259–1319.
Portes, Alejandro, and Julia Sensenbrenner. 1993. “Embeddedness and Immigration:
Notes on the Social Determinants of Economic Action.” American Journal of
Sociology 98:1320–50.
Powell, Walter, Douglas White, Kenneth Koput, and Jason Owen-Smith. 2005.
“Network Dynamics and Field Evolution: The Growth of Interorganizational
Collaboration in the Life Sciences.” American Journal of Sociology 110:1132–1205.
Rao, Hayagreeva, Henrich R. Greve, and Gerald F. Davis. 2001. “Fool’s Gold: Social
Proof in the Initiation and Abandonment of Coverage by Wall Street Analysts.”
Administrative Science Quarterly 46:502–26.
Rosenberg, Bernard, and Ernst Harburg. 1992. The Broadway Musical: Collaboration
in Commerce and Art. New York: New York University Press.
Ruef, Martin. 2002. “Strong Ties, Weak Ties, and Islands: Structural and Cultural
Predictors of Organizational Innovation.” Industrial and Corporate Change 11:
427–50.
Sacks, Michael, Marc Ventresca, and Brian Uzzi. 2001. “Global Institutions and
Networks: Contingent Change in the Structure of World Trade Advantage,
1965–1908.” American Behavioral Scientist 44 (10): 1579–1601.
Simas, Rick. 1987. The Musicals No One Came to See. New York: Garland.
Slutsky, Allan. 1989. Standing in the Shadows of Motown: The Legendary Life of Bassist
Jamie Jamison. Milwaukee: Hal Leonard.
Stark, David, and Vedres Balazs. 2005. “Social Times of Network Spaces: Sequence
Analysis of Network Formation and Foreign Investment in Hungary, 1987–2001.”
Paper presented at the annual meeting of the American Sociological Association,
Philadelphia, August.
Suskin, Steven. 1990. Opening Night on Broadway: A Critical Quotebook of the Golden
Era of the Musical Theatre, Oklahoma! (1943) to Fiddler on the Roof (1964). New
York: Schirmer.
———. 1997. More Opening Nights on Broadway. New York: Schirmer.
Uzzi, Brian. 1997. “Social Structure and Competition in Interfirm Networks: The
Paradox of Embeddedness.” Administrative Science Quarterly 42:35–67.
———. 1999. “Social Relations and Networks in the Making of Financial Capital.”
American Sociological Review 64 (4): 481–505.
Uzzi, Brian, and Ryon Lancaster. 2004. “Embeddedness and the Price of Legal Services
in the Large Law Firm Market.” American Sociological Review 69:319–44.
Uzzi, Brian, and Jarrett Spiro. In press. “Notes on Network Emergence: A Case Study
of the Creative Artist Network in the Broadway Musical Industry.” In Network
Emergence and Transformation, edited by John Padgett and Walter W. Powell.
London: Cambridge University Press.
Variety: The International Entertainment Weekly. 1945–89. Los Angeles: Reed Business
Information.
Verdaasdonk, H. 1983. “Social and Economic Factors in the Attribution of Literary
Quality.” Poetics 12:383–95
Vogel, Harold L. 2001. Entertainment Industry Economics, 4th ed. London: Cambridge
University Press.

American Journal of Sociology
504
Wasserman, Stanley, and Katherine Faust. 1994. Social Network Analysis. London:
Cambridge University Press.
Watts, Duncan J. 1999. Small Worlds: The Dynamics of Networks between Order and
Randomness. Princeton, N.J.: Princeton University Press.
Watts, Duncan J., and Steven H. Strogatz. 1998. “Collective Dynamics of ‘Small-World’
Networks.” Nature 393:440–42.
White, Douglas. 2003. “Networks and Complexity: Converging Streams of Research.”
Complexity 8:14.
White, Harrison C. 1970. “Search Parameters for the Small World Problem.” Social
Forces 49:259–64.
———. 1993. Canvases and Careers: Institutional Change in the French Painting
World. Chicago: University of Chicago Press.

Wyszukiwarka
Podobne podstrony:
Arms And Uniforms The Second World War Part2
Arms and Uniforms The Second World War Part3
Arms and Uniforms The Second World War Part1
Arms and Uniforms The Second World War Part3
Arms And Uniforms The Second World War Part2
Arms and Uniforms The Second World War Part1
kali Social embeddedness and economic governance a small world approach
Griffiths, Turnbullb And White Re Examining The Small Cap Myth Problems In Portfolio Formation And L
Foucault Discourse and Truth The Problematization of Parrhesia (Berkeley,1983)
Spanish Influence in the New World and the Institutions it I
The Renaissance Transformation to the Modern World and Gov
The Experiences of French and German Soldiers in World War I
Conceiving the Impossible and the Mind Body Problem
Maps of the Ancient World Ortelius A Selection of 30 Maps from The Osher and Smith Collections
A Content Analysis of Magazine?vertisements from the United States and the Arab World
Fulford Mental Illness and the Mind Body Problem
Suke Wolton Lord Hailey, the Colonial Office and the Politics of Race and Empire in the Second Worl
Hoffman Conscious Realism and the mind body problem
Magic in The Roman World Pagans, Jews and Christians by Naomi Janowitz
więcej podobnych podstron