
Abstract
SCHIRACK, ANDRIANA VAIS. The Effect of Microwave Blanching on the Flavor
Attributes of Peanuts. (Under the direction of K.P. Sandeep.)
The use of microwave technology as an alternative blanching method for
peanuts could potentially reduce energy costs and processing time, and lead to
products with better nutrient retention. However, an off-flavor was found in peanuts
which were microwave-blanched at high temperatures. As a result, the objective of
this research has been to determine the impact of different microwave blanching
parameters on the properties of roasted peanuts, and to characterize the off-flavor
observed during high-temperature microwave blanching using a descriptive sensory
panel and analysis of volatile flavor compounds. The processing parameters best
suited for microwave blanching of peanuts were determined based on energy
absorbed during processing, internal and surface temperatures, loss in moisture
content, and blanchability. The best blanchability resulted from higher process
temperatures and lower final moisture content. However, peanuts which reached
the highest internal temperatures during blanching also developed an off-flavor,
which was characterized by increased intensities of stale/floral and burnt/ashy notes.
Solvent extraction / solvent assisted flavor evaporation (SAFE), gas
chromatography-olfactometry (GC/O), gas chromatography-mass spectrometry
(GC/MS), aroma extract dilution analysis (AEDA), threshold testing, and model
systems were used to examine the chemical compounds which may be responsible
for this microwave-related off-flavor. Analysis revealed an increased formation of
guaiacol, phenylacetaldehyde, and 2,6-dimethylpyrazine in the off-flavored peanuts
as compared to a process control, which led to the burnt and stale/floral

characteristics noted by descriptive sensory panel. These compounds were only a
small fraction of over 200 aroma-active compounds which were found to contribute
to roasted peanut flavor using GC/O. This research illustrates the importance of the
relative concentrations of the many aroma-active compounds found in peanuts.
These findings could aid in training sensory panels to evaluate processing-related
off-flavors, because guaiacol and phenylacetaldehyde could be used as chemical
standards to define the burnt/ashy and stale/floral off-flavors which can occur during
high temperature processing. Through this project, it was determined that it is
possible to achieve acceptable blanchability in peanuts using microwave blanching
while minimizing the possibility of an off-flavor.

ii
Dedicated to my husband, Pete

iii
BIOGRAPHY
Andriana Schirack is originally from Columbus, Ohio, where she attended
Ohio State University as an OSU Medalist Scholar and National Merit Scholar.
Andriana graduated with a B.S. in Food Science in December, 1997 after completing
an internship in product development of infant formula with Ross Laboratories. In
2000, Andriana completed a master’s program in Food Science at North Carolina
State University with a minor in statistics. During this time, she was also employed
as an aseptic processing technician in the dairy plant. From 2000 to 2003, Andriana
was an Assistant Food Scientist at Jim Beam Brands in Clermont, Kentucky, where
she was trained in analytical chemistry for technical problem solving and developed
new beverages for global launch as part of the product development team. She
began her Ph.D. program in the summer of 2003 under the direction of Dr. K.P.
Sandeep, and has been very active in the national IFT Student Association and the
NCSU Food Science Club. Andriana and her husband, Pete, will move to
Minneapolis, MN where she will begin work at General Mills as an R&D Scientist.

iv
ACKNOWLEDGMENTS
Thanks to my advisor, Dr. K.P. Sandeep, and my committee members, Dr.
MaryAnne Drake, Dr. Tim Sanders, and Dr. Donn Ward for their guidance. Also,
thanks to the many family and friends who have supported me in the past several
years. Most of all, a huge thanks to my husband, Pete – for making this possible.

v
TABLE OF CONTENTS
Page
List of Tables ......................................................................................................viii
List of Figures ....................................................................................................... x
Chapter 1. Introduction ........................................................................................ 1
References.................................................................................................... 7
Chapter 2. Literature Review ............................................................................. 10
Composition of Peanuts .............................................................................. 11
Overview of Peanut Production................................................................... 12
Harvesting................................................................................................... 13
Curing ......................................................................................................... 14
Effect of Peanut Immaturity......................................................................... 18
Storage ..................................................................................................... 20
Blanching .................................................................................................... 21
Roasting...................................................................................................... 26
Microwave Processing ................................................................................ 28
Mechanisms of Action ................................................................................. 30
Dielectric Properties .................................................................................... 32
Microwave Blanching of Peanuts ................................................................ 35
Flavor Chemistry of Peanuts....................................................................... 36
Flavor Production During Roasting ............................................................. 37
Roasting Parameters Effect on Flavor ........................................................ 43
Flavor Research in Other Nuts.................................................................... 45
Precursors to Roasted Notes ...................................................................... 46
Off-flavors in Peanuts ................................................................................. 47
Flavors Due to Lipid Oxidation .................................................................... 48
Off-flavors Due to Anaerobic Respiration.................................................... 52
Fruity Fermented Off-flavor ......................................................................... 55
Off-flavors Due to External Contamination.................................................. 57
Dark Soured Aromatic Off-flavor ................................................................. 57
Methods of Flavor Analysis ......................................................................... 58
Gas Chromatography-Mass Spectrometry (GC-MS) .................................. 64
Correlation to Quality and Sensory ............................................................. 65
Gas Chromatography – Olfactometry (GC-O)............................................. 66
GC-O Applications ...................................................................................... 69
Sensory Evaluation ..................................................................................... 70
Descriptive Sensory Analysis...................................................................... 74
Project Objectives ....................................................................................... 76
Abbreviations .............................................................................................. 78
Symbols ...................................................................................................... 80

vi
References.................................................................................................. 81
Chapter 3. Effect of Processing Parameters on the Temperature and
Moisture Content of Microwave-Blanched Peanuts ............................................ 90
Abstract....................................................................................................... 91
Introduction ................................................................................................ 91
Materials and Methods................................................................................ 94
Results and Discussion............................................................................... 97
Energy Absorption .................................................................................. 97
Peanut Temperature ............................................................................... 98
Change in Moisture Content ................................................................. 101
Blanchability.......................................................................................... 102
Conclusions .............................................................................................. 104
Acknowledgments..................................................................................... 105
Abbreviations ............................................................................................ 106
References................................................................................................ 107
Tables and Figures ................................................................................... 109
Chapter 4. Impact of Microwave Blanching on the Flavor of Roasted
Peanuts............................................................................................................. 118
Abstract..................................................................................................... 119
Introduction ............................................................................................... 120
Materials and Methods.............................................................................. 123
Peanuts................................................................................................. 123
Processing Experiments ....................................................................... 123
Temperature Measurement During Blanching ...................................... 124
Moisture Content Analysis .................................................................... 125
Sensory Evaluation ............................................................................... 125
Data Analysis ........................................................................................ 126
Results and Discussion............................................................................. 127
Sensory Analysis .................................................................................. 127
Temperature Profiles and Change in Moisture Content ....................... 128
Conclusions .............................................................................................. 130
Abbreviations ............................................................................................ 130
Acknowledgments..................................................................................... 131
References................................................................................................ 132
Table Legends .......................................................................................... 135
Chapter 5. Characterization of Aroma-Active Compounds in Microwave
Blanched Peanuts............................................................................................. 141
Abstract..................................................................................................... 142
Introduction ............................................................................................... 143

vii
Materials and Methods.............................................................................. 145
Peanuts................................................................................................. 145
Chemicals ............................................................................................. 147
Static Headspace Gas Chromatography............................................... 147
Solvent Extraction with Solvent Assisted Flavor Evaporation (SAFE)... 148
Gas Chromatography/Olfactometry (GC/O) .......................................... 149
Gas Chromatography/Mass Spectrometry (GC/MS)............................. 150
Identification of Odorants ...................................................................... 151
Quantification of Odorants .................................................................... 151
Threshold Testing ................................................................................. 152
Sensory Evaluation of Peanut Models .................................................. 153
Results and Discussion............................................................................. 154
Sensory analysis................................................................................... 154
Static Headspace Analysis.................................................................... 155
Gas Chromatography-Olfactometry ...................................................... 156
Quantification ........................................................................................ 159
Threshold Determination....................................................................... 160
Model Systems ..................................................................................... 163
Conclusion ................................................................................................ 165
Acknowledgments..................................................................................... 165
References................................................................................................ 167
Chapter 6. Conclusions and Future Work ........................................................ 178
Conclusions .............................................................................................. 179
Future Work .............................................................................................. 182
References................................................................................................ 184
Appendices ....................................................................................................... 185
Appendix 1: Analysis of Peanut Volatiles by Solvent Extraction, SAFE,
GC-O, and GC-MS.................................................................................... 186
Appendix 2: Quantification of Peanut Volatiles ........................................ 192
Appendix 3: Summary of Aroma-Active Compounds Found in
Peanut Samples Using Aroma Extract Dilution Analysis (AEDA).............. 194

viii
LIST OF TABLES
Chapter 2
Table 1
Peanut Volatile Analysis by Gas Chromatography .......................... 63
Table 2
Lexicon of Peanut Flavor Descriptors (Johnsen et al., 1988) .......... 72
Chapter 3
Table 1
Processing Parameters During Microwave Blanching of
Peanuts ....................................................................................... 109
Table 2
Means by Treatment of Internal Temperatures of Peanuts
During
Microwave
Blanching ....................................................... 109
Table 3
Maximum Internal Temperatures of Peanuts by Treatment
During
Microwave
Blanching ....................................................... 110
Chapter 4
Table 1
Microwave Application Parameters and Resulting Blanching
Efficiency ....................................................................................... 136
Table 2
Lexicon of Peanut Flavor Descriptors (Modified From Johnsen
et al., 1988; and Sanders et al., 1989) .......................................... 137
Table 3
Means Separation of Blanching Treatments by Sensory
Attribute......................................................................................... 138
Table 4
Correlations Between Peanut Flavor Attributes............................. 139
Table 5
Maximum Internal Temperature in Peanuts by Treatment ............ 140
Table 6
Moisture Content of Peanuts After Blanching................................ 140
Chapter 5
Table 1
Effect of High Temperature Microwave Blanching on Sensory
Attributes ..................................................................................... 172
Table 2
Model System Concentrations in Reference Peanut Paste……...173

ix
Table 3
High Impact Aroma-Active Compounds in Peanuts as
Determined
by AEDA .................................................................. 174
Table 4
Relative Abundance of Selected High Aroma Impact
Compounds
in
Peanuts ............................................................... 176
Table 5
Quantification, Sensory Orthonasal Threshold Values, and Odor
Activity Values of Selected Compounds in Peanuts .................... 177
Appendices
Table 1
Aroma Active Compounds in Reference Peanuts Detected by
Gas
Chromatography-Olfactometry............................................. 194
Table 2
Aroma-Active Compounds in Microwave-Blanched Peanuts
Detected by Gas Chromatography-Olfactometry......................... 201

x
LIST OF FIGURES
Page
Chapter 3
Figure 1
Mean Energy Absorbed by Peanuts Per Treatment for All
Replicates During Microwave Heating for 4, 5, 8, or 11
Minutes
(Set 1) ............................................................................ 111
Figure 2
Internal and Surface Temperatures of Peanuts During
Microwave Blanching for 11 Minutes With and Without Using
Fan
(Set 1) .................................................................................. 112
Figure 3
Internal and Surface Temperatures of Peanuts of 5 and 11%
Initial Moisture Content (MC) During Microwave Blanching for
11 Minutes Without Using a Fan (Set 2)...................................... 113
Figure 4
Relationship Between Maximum Internal Temperature and Final
Moisture Content of Peanuts After Microwave Blanching
(Correlation
R
2
= 0.87). F= Fan Used During Blanching,
NF = No Fan Used, MC = Moisture Content............................... 114
Figure 5
Mean of Blanchability Results Per Treatment for All Replicates
During Microwave Blanching of Peanuts for 4, 5, 8, or 11
Minutes
(Set 1) ............................................................................ 115
Figure 6
Mean of Blanchability Results Per Treatment for All Replicates
During Microwave Blanching of Peanuts for 11 Minutes
Without Using a Fan (Set 2) ........................................................ 116
Figure 7
Relationship Between Maximum Internal Temperature and
Blanchability of Peanuts After Microwave Blanching
(Correlation
R
2
= 0.81). The Average Final Moisture Content
(MC) of Each Treatment is Noted ................................................ 117

1
CHAPTER 1: INTRODUCTION

2
Peanuts are a valuable agricultural crop in the United States, specifically in
Virginia, the Carolinas, and in the Southeast and Southwest regions. The annual
production of peanuts in the United States reached 4.2 billion pounds in 2004
(NASS, 2005). Peanuts are valuable nutritionally due to their high protein content
and the amount of unsaturated fats. The most common use of peanuts worldwide is
crushing for oil and meal. The oil is used for cooking and as a salad oil, while the
defatted meal is processed into protein concentrates and isolates. In the United
States, a majority of the domestic peanut crop is used for products such as peanut
butter, and it also serves as a versatile ingredient in confections.
When peanuts are roasted, they obtain a unique flavor which drives product
marketing in the peanut industry. This flavor is the result of genetics, handling,
storage, and processing factors (Sanders et al., 1995). As a result, there is an
interest in the effects of harvesting and processing techniques on peanut flavor
(Singleton and Pattee, 1991; Singleton and Pattee, 1992; Osborn et al., 1996; Baker
et al.
, 2003; Didzbalis et al., 2004).
The processing of peanuts includes several steps from harvesting to final
product. Handling of the peanut crop starts with digging, shaking off soil and debris,
drying the peanuts from 35 - 40% moisture content to 15 - 20%, combining to
separate the pods from the plants, transport to storage facilities, removing the hulls,
and blanching to remove the seed coat from the kernels (Ory et al., 1992). After
blanching, most of the peanuts are roasted for use in peanut butter, confections, or
other snack foods.

3
The processing parameters used during blanching can have significant
impacts on the final product quality. The process of peanut blanching consists of an
application of heat followed by abrasive removal of the seed coat. This step is done
for several reasons. Blanching results in the removal of the seed coat which contains
tannins that contribute off-flavors and off-colors. Blanching is also used to remove
foreign material and dust (St. Angelo et al., 1977). It also reduces enzyme activity
and moisture content, which are factors impacting subsequent quality (Adelsberg
and Sanders, 1997). Furthermore, blanching aids in the electronic color-sorter
removal of damaged or discolored seeds, which are associated with aflatoxin
contamination (Sanders et al., 1999).
Several methods are used for blanching: dry-blanching, spin-blanching,
water-blanching, alkali-blanching, and hydrogen peroxide-blanching. In general, the
most common method in industrial processing is dry-blanching. In this process,
peanuts are placed on conveyor belts and moved through large hot-air ovens in
which the direction of airflow is alternated in successive zones (Adelsberg and
Sanders, 1997). The peanuts are heated in sequential zones from 30 °C to 90 °C,
with a total processing time of approximately 45 minutes. During this time, moisture
is removed from the peanuts, the seed coat is loosened, and after cooling, the seed
coats are mechanically removed (Sanders et al., 1999). Paulsen and Brusewitz
(1976) suggested that the mechanism of blanching is due to differences in thermal
expansion and subsequent contraction of the seed and seed coat, resulting in a
loosening of the seed coat.

4
Microwave processing has been investigated as an alternative to traditional
processing methods due to the speed of operation, energy savings, and efficient
process control (Giese, 1992). Since heating takes place only in the food material
and not in the surrounding medium, microwave processing can reduce energy costs.
Shorter heating times also lead to greater nutrient retention, better quality
characteristics such as texture and flavor, as well as increased production (Giese,
1992). The use of a continuous microwave system for blanching has been proposed
as a means of reducing production time and energy costs during peanut processing.
Previous studies at North Carolina State University have shown promise for the use
of an industrial microwave system. Peanuts were effectively blanched by the
microwave when the peanuts reached temperatures over 85 °C and final moisture
contents of 6% or lower. In a study using a series of individual trays of peanuts
passing through the microwave field, Rausch et al. (2005) examined the potential
use of microwaves for peanut blanching. In the current study, refinement of the
microwave applicator has allowed a solid bed of peanuts to be exposed to
microwave energy in a continuous process, using a processing technique similar to
that of Boldor et al. (2005).
The best blanching efficiencies result from peanuts which are subjected to the
highest temperatures during blanching and lose the most moisture. Moisture
content affects blanchability as well as stability and flavor quality of peanuts
(Adelsberg and Sanders, 1997; Katz, 2002). However, high temperature processing
has been tied to the formation of off-flavors. For example, elevated temperatures are
used during curing, in which the moisture content of the peanuts after digging is

5
reduced from 35-40% moisture to 8-10% to prevent quality losses before further
processing. It has been documented that curing peanuts at temperatures above
35 °C is related to the formation of anaerobic by-products which produce an off-
flavor. Also, with increased curing temperatures above 35 °C, positive attributes
such as roasted peanutty decrease while off-flavors such as fruity/fermented
increase in intensity (Sanders et al., 1990). This decrease in positive flavor attribute
intensity with increase in temperature has also been observed in dry-blanching
(Sanders et al., 1999).
Such changes in the quality and flavor of peanuts have been described
previously using descriptive sensory analysis. Peanuts were first evaluated using a
method called the Critical Laboratory Evaluation of Roasted Peanuts, or CLER
(Holaday, 1971). Later, sensory lexicons for peanuts and peanut products were
constructed by Oupadissakoon and Young (1984) and Syarief et al. (1985). A
standardized lexicon was subsequently developed to address deficiencies in earlier
models such as lack of differentiation of oxidized off-flavors and lack of
sweet/caramel descriptors (Johnsen et al., 1988). The lexicon used in this research
incorporates a ten point scale to rate intensity of flavor attributes using commercially
available products as references (Sanders et al., 1989).
Using descriptive sensory analysis, a processing-related off-flavor has been
noted in peanuts undergoing high-temperature microwave blanching (Katz, 2002).
The chemical cause of this off-flavor is not yet known. In other studies, specific
volatile compounds identified by GC-mass spectrometry have been linked to sensory
attributes in peanuts (Young and Hovis, 1990; Vercellotti et al., 1992). Instrumental

6
techniques can be used to analyze the volatile compounds which affect peanut
flavor, although these compounds are present at very low concentrations and can
interact with other components of the food matrix, leading to difficulties in their
extraction (Reineccius, 2002). A variety of extraction and isolation techniques have
been applied in peanut flavor research, including solvent extraction and high vacuum
distillation (Didzbalis et al., 2004), static headspace (Young and Hovis, 1990), and
dynamic headspace (Crippen et al, 1992). Other off-flavors which have been
documented in peanuts, such as fruity fermented, have been linked to their
causative chemical compounds (Didzbalis et al., 2004). By identifying the
compounds responsible for an off-flavor, the possible causes, such as anaerobic
respiration, lipid oxidation, or enzymatic activity, may be determined and the off-
flavor itself can possibly be prevented.
The use of microwave technology for blanching peanuts can result in a large
reduction in processing time, subsequent cost savings, and better product quality.
The objective of this study was to characterize the impact of different microwave
blanching parameters on the quality and flavor of roasted peanuts, and to identify
the chemical components responsible for the off-flavor caused by high-temperature
microwave blanching. Microwave blanching is an alternative processing method
which holds the promise of better product quality and more efficient process control,
if properly implemented. However, the occurrence of an off-flavor in the final product
may be problematic in the adoption of this method. The identification of the
chemical compounds causing this off-flavor could ultimately aid in the development
of an alternative blanching method for peanuts using microwave technology.

7
REFERENCES
Adelsberg GD, Sanders TH. 1997. Effect of peanut blanching protocols on bed
and seed temperatures, seed moisture, and blanchability. Peanut Science 24:
42-46.
Baker GL, Cornell JA, Gorbet DW, O'Keefe SF, Sims CA, Talcott ST. 2003.
Determination of pyrazine and flavor variations in peanut genotypes during
roasting. J. Food Sci. 68(1): 394-400.
Boldor D, Sanders TH, Swartzel KR, Farkas, BE. 2005. A model for
temperature and moisture distribution during continuous microwave drying.
Journal of Food Process Engineering 28(1): 68-87.
Crippen KL, Vercellotti JR, Lovegren NV, Sanders TH. 1992. Defining roasted
peanut flavor quality. Part 2. Correlation of GC volatiles and sensory flavor
attributes. In: Charalambous G, editor. Food Science and Human Nutrition.
New York: Elsevier Science Publishers. p 211-227.
Didzbalis J, Ritter KA, Trail, AC, Plog FJ. 2004. Identification of fruity/fermented
odorants in high temperature cured roasted peanuts. J. Agric. Food Chem. 52:
4828-4833.
Giese J. 1992. Advances in microwave food processing. Food Technology
46(9): 118-123.
Holaday CE. 1971. Report of the peanut quality committee. Journal of
American Peanut Research and Education Association 3: 238-241.
Johnsen PB, Civille GV, Vercellotti JR, Sanders TH, Dus CA. 1988.
Development of a lexicon for the description of peanut flavor. Journal of
Sensory Studies 3: 9-17.
Katz TA. 2002. The effect of microwave energy on roast quality of microwave
blanched peanuts. Master's Thesis, North Carolina State University, Raleigh,
NC.
NASS. 2005. USDA crop production 2004 summary. Washington, DC:
National Agriculture Statistics Service.
Ory RL, Crippen KL, Lovegren NV. 1992. Off-flavors in peanuts and peanut
products. In: Charalambous G, editor. Developments in Food Science v. 29:
Off-Flavors in Foods and Beverages. Amsterdam, The Netherlands: Elsevier
Science Publishers. p 57-75.
Osborn GS, Young JH, Singleton JA. 1996. Measuring the kinetics of

8
acetaldehyde, ethanol, and ethyl acetate within peanut kernels during high
temperature drying. Transactions of the ASAE 39(3): 1039-1045.
Oupadissakoon C, Young CT. 1984. Modeling of roasted peanut flavor for some
Virginia type peanuts from amino acid and sugar contents. J. Food Sci. 49: 52-
58.
Paulsen MR, Brusewitz GH. 1976. Coefficient of cubical thermal expansion for
Spanish peanut kernels and skins. Transactions of the ASAE 19(3): 592-595,
600.
Rausch TD, Sanders TH, Hendrix KW, Drozd JM. 2005. Effect of microwave
energy on blanchability and shelf life of peanuts. J. Agric. Food Chem.,
submitted.
Reineccius, G. 2002. Instrumental methods of analysis. In: Taylor AJ, editor.
Food Flavor Technology. Sheffield, England: Sheffield Academic Press. p
210-251.
St. Angelo AJ, Kuck JC, Hensarling TP, Ory RL. 1977. Effects of water and spin
blanching on oxidative stability of peanuts. Journal of Food Processing and
Preservation 1: 249-260.
Sanders TH, Adelsberg GD, Hendrix KW, McMichael Jr. RW. 1999. Effect of
blanching on peanut shelf-life. Peanut Science 26: 8-13.
Sanders TH, Blankenship PD, Vercellotti JR, Crippen KL. 1990. Interaction of
curing temperature and inherent maturity distributions on descriptive flavor of
commercial grade sizes of Florunner peanuts. Peanut Science 17: 85-89.
Sanders TH, Pattee HE, Vercellotti JR, Bett KL. 1995. Advances in peanut flavor
quality. In: Pattee HE, Stalker HT, editors. Advances in Peanut Science.
Stilwater, OK: American Peanut Research and Education Society, Inc. p 528-
553.
Sanders TH, Vercellotti JR, Blankenship PD, Crippen KL, Civille GV. 1989.
Interaction of maturity and curing temperature on descriptive flavor of peanuts.
J. Food Sci. 54(4): 1066-1069.
Singleton JA, Pattee HE. 1991. Peanut moisture/size, relation to freeze damage
and effect of drying temperature on volatiles. J. Food Sci. 56(2): 579-581.
Singleton JA, Pattee HE. 1992. Maturity and storage affect freeze damage in
peanuts. J. Food Sci. 57(6): 1382-1384.
Syarief H, Hamann DD, Giesbrecht FG, Young CT, Monroe RJ. 1985.

9
Interdependency and underlying dimensions of sensory flavor of selected
foods. J. Food Sci. 50: 631-638.
Vercellotti JR, Crippen KL, Lovegren NV, Sanders TH. 1992. Defining roasted
peanut flavor quality. Part 1. Correlation of GC volatiles with roast color as an
estimate of quality. In: Charalambous G, editor. Developments in Food
Science v. 29: Food Science and Human Nutrition. Amsterdam, The
Netherlands: Elsevier Science Publishers. p 183-206.

10
CHAPTER 2:
LITERATURE REVIEW

11
Composition of Peanuts
The structure of a peanut seed consists of two cotyledons and a germ, which
is enveloped in a thin skin called the testa. The peanut heart contains bitter material
and as a result is often removed during processing, while the testa is removed
during blanching. The testa contains mainly protein, fiber and carbohydrates, as
well as tannins which give the skin a bitter flavor (Hoffpauir, 1953).
Within each year, the composition and quality of the peanut crop changes due
to climatic variations as well as different harvesting and handling techniques (Pattee
et al.
, 1990). Peanut seeds consist of approximately 50% fat and 30% protein
(Hoffpauir, 1953). The main fatty acids found in peanuts include palmitic, oleic, and
linoleic acids. Up to 6% of peanut oil consists of long chain saturated fatty acids
such as arachidic acid (20:0), behenic acid (22:0), lignoceric acid (24:0), oleic acid
(18:1), and linoleic acid --18:2 (Chung et al., 1993). A large percentage of peanut oil
consists of polyunsaturated fatty acids, which are a substrate for oxidation by
lipoxygenase (Ory et al., 1992, St. Angelo, 1996). Ahmed and Young (1982)
indicated that the oleic/linoleic acid ratios in the peanut varied with cultivar, growing
location, maturity, as well as temperatures during the last few weeks of harvest.
This oleic/linoleic acid ratio has been positively correlated to oil stability.
The protein in peanuts includes albumins, and two globulins, arachin and
conarachin. The total protein has a high digestibility coefficient and has significant
amounts of 10 essential amino acids (Hoffpauir, 1953). The specific amino acid
content of peanuts varies depending on the type of peanut, cultivar, location, and

12
maturity, because the concentrations of free amino acids decrease as the peanut
matures (Basha and Young, 1996; Ahmed and Young, 1982).
While in general, plants possess naturally occurring antioxidants such as
superoxide dismutase, tocopherols, carotenes, and ascorbic acid, oilseeds are
specifically identified with peroxidases and catalase. Peroxidase and catalase
function by aiding the conversion of hydrogen peroxide to water and oxygen, and
thereby help eliminate this precursor to free radical species (Sanders et al., 1993).
Peanut oil also contains antioxidants such as α, γ, and δ tocopherols (Hoffpauir,
1953).
The other components in peanuts include carbohydrates such as starch,
sucrose, pectins, and cellulose (Hoffpauir, 1953). Sucrose is the main carbohydrate
in peanuts. In processing, there are slight losses in sucrose during roasting,
although glucose and fructose decrease to a greater extent. Peanuts also contain
high levels of potassium, phosphorus, and magnesium, although the amounts
change with cultivar (Ahmed and Young, 1982).
Overview of Peanut Production
In the early 1990’s, China, the U.S., and Argentina were the most important
peanut exporting countries, and the primary importers were the European
Community, Japan, and Canada. However, imports to the European Community
have dropped due to a policy shift encouraging the use of rapeseed or sunflower
seed oil instead of importing peanut oil. Most of the increases in peanut production
since the 1970’s have occurred in Asian countries such as India, China, Indonesia

13
and Burma. The peanut prices in the Rotterdam market have been recognized as
the world reference price, and this has been tied to monthly estimates of peanut
production in America’s Southeast (Carley and Fletcher, 1995).
The United States produces approximately 10% of the world’s peanuts
(Sanders et al., 1993). Each year in the U.S., 700,000 hectares of peanuts are
harvested, with each hectare producing approximately 2.8 tons (Smith et al., 1995).
The U.S. peanut industry relies on an extensive price support and production quota
system (Carley and Fletcher, 1995). Peanuts are grown in the Southeast (Alabama,
Florida, Georgia), Southwest (Oklahoma, Texas, and New Mexico), as well as in
Virginia and North Carolina (Smith et al., 1995). There are four major market types
of peanuts in the U.S.: runner, virginia, valencia, and spanish (Sanders et al., 1993).
The most important use of world peanut production remains the crushing of
peanuts for oil and meal (Carley and Fletcher, 1995). The oil is used for cooking
and as a salad oil, while the defatted meal is processed into high protein
concentrates and isolates. In comparison, a large percentage of peanuts in the
United States is used for peanut butter and in confections. Alternative uses for
peanut protein have been explored for applications such as fermented milk and
yogurt systems, soup bases, nonfermented cheese analogs, meat product
ingredients, breads and snack products, and the replacement of casein in extended
milk products (McWatters and Cherry, 1982).
Harvesting
Harvesting includes the removal of peanuts from the ground, and separating
the nuts from soil and vines. Further steps include drying the peanuts from 35-40%

14
moisture content to 15-20%, combining to separate the pods from the plants,
transport to storage facilities, removing the hulls, and blanching to remove the testa
from the seeds (Ory et al., 1992). Peanuts are separated from accompanying
materials during harvest by vibrating, perforated screens or by a belt screen which
uses multiple parallel belts rotating continuously around sheaves (Smith et al.,
1995). There is a potential for off-flavor development if the peanuts are damaged
during handling, because lipoxygenase, which is usually separated from the oil by
cell compartmentalization, can then oxidize the oil and create off-flavors (Ory et al.,
1992).
The harvest is set at a time to maximize the number of mature pods.
However, immature pods are usually present in every lot, especially during
abnormally cool or hot harvesting weather, and are difficult to separate from mature
pods. The percent of immature pods in a lot depends on the peanut variety, weather
conditions during growth and development, as well as harvest date (Osborn et al.,
2001).
Curing
Curing is the process of reducing the moisture content of peanuts to a level
maintaining safety and quality (Young et al., 1982). Curing is needed before
combining because when the peanuts contain 35-40% moisture, they are soft and
susceptible to damage by the combine (Ory et al., 1992). Curing dries the peanuts
either completely, or to 20-25% wet basis (w.b.) moisture in the field, with a final
artificial drying in wagons to 8-10%. If the peanuts are not dried to less than 10%

15
(w.b.) within 3 days, large quality losses result from biological activity (Young et al.,
1982). Fungus growth due to high moisture content can lead to high free fatty acid
concentrations, caused by fungal lipase activity (Sanders et al., 1993).
In wagon drying, a balance is needed in air flow, air humidity, and drying time
so that the bottom layers of peanuts are not over-dried, but the top layer of peanuts
will not spoil before drying is completed (Young et al., 1982). Deep-bed drying of
peanuts can be envisioned as the drying of successive single layers. For each
layer, the temperature and humidity of the air is changed as it passes through the
peanuts (Troeger, 1982).
The rate of moisture removal during peanut drying is proportional to the
difference in vapor pressure of the peanut interior and that of the surrounding air. As
the moisture content of the peanut decreases, the time needed to remove a certain
amount of moisture increases because the vapor pressure difference is not as great.
When the humidity of the air becomes equal to that of the peanuts, drying ceases
(Troeger, 1982).
The heat used for drying also promotes reactions of the concentrated peanut
components (Sanders et al., 1993). The step of curing in peanut processing initiates
catabolic processes, such as degradation of carotenoids. Enzymatic and
nonenzymatic reactions also occur, which have been only minimally investigated
(Sanders et al., 1995).
Troeger (1982) conducted drying simulations to determine effects of varying
parameters on drying time and energy use. Simulations showed that drying peanuts
with a higher airflow rate (4.72 m
3
/s versus 3.05 m
3
/s) decreased drying time about

16
6%, while energy use increased 45% as a result. Too low of airflow resulted in a
greater difference in moisture content in peanuts between the top and bottom layers
of the dryer, and the initial moisture content of the peanuts also had a significant
effect on the variation between peanut layers. Allowing the drying air to rise 15 °C
reduced drying time by 36%, while energy consumption increased 14%. However,
this higher temperature rise also reduced the relative humidity to an unacceptable
range to maintain product quality (Troeger, 1982).
Delwiche et al. (1986) examined the use of microwaves for peanut curing in
comparison to traditional methods. Because peanuts must be dried at temperatures
lower than 35 °C and humidity greater than 60% to maintain quality, drying times
exceed 30 hours for peanuts which are dried in standard wagons. Due to faster
processing times, the energy requirement for microwave vacuum drying was found
to be less than for traditionally dried peanuts. However, high moisture shelling
followed by microwave drying led to elevated levels of Aspergillus flavus growth on
the seeds. In addition, as microwave process rate and temperatures increased,
seed germination potential decreased and the seeds were more susceptible to
abrasion and impact. During these experiments, Delwiche et al. (1986) adjusted
microwave power levels depending on the initial temperature and moisture content
of the peanuts, using the following equation:
Q = γ
dry
c
dry
(T
f
-T
i
) + γ
dry
c
w
[mc
i
/ (1-mc
i
)] (T
f
-T
i
) + h
lg
γ
dry
[(mc
i
/ 1-mc
i
) – (mc
f
/1-mc
f
)]
Where:
Q = Energy per unit volume (kJ/m
3
)
γ
dry
=
Bulk density of dry seeds (kg/m
3
)

17
c
dry
= Specific heat of dry seeds (1.880 kJ / (kg °C))
T
f
and T
i
= Final and initial temperature of seeds (°C)
mc
i
and mc
f
= Initial and final seed moisture content (wb)
c
w
= Specific heat of water (4.187 kJ/(kg °C))
h
lg
= Heat of vaporization of water (2.418 x 10⁴ kJ/kg at 35 °C)
The curing of peanuts at temperatures above 35 °C has been associated with
anaerobic by-products which produce an off-flavor (Whitaker et al., 1974). An
increase in the concentration of alcohols, aldehydes and esters, especially ethanol,
ethyl acetate, and acetaldehyde, is thought to be tied to this change in respiration
from aerobic to anaerobic (Pattee et al., 1990). At the high rates of respiration
occurring at high curing temperatures, oxygen cannot diffuse into the seed at a
sufficient rate, causing anaerobic respiration to take place. This was shown in an
experiment by Whitaker et al. (1974), in which a significant depression in oxygen
partial pressure was found inside peanuts cured at 52 °C compared to those cured
at 24 °C.
With increasing curing temperature, positive attributes such as roasted
peanutty decreased and fruity fermented intensity increased (Sanders et al., 1990).
Volatiles such as mercaptans, carbon dioxide, and carbonyls also increased during
roasting after high temperature curing (Young, 1973). Drying temperatures above
35 °C are avoided to prevent off-flavor formation (Troeger, 1982).

18
Effect of Peanut Immaturity
Peanut quality is affected by the degree of maturity at harvest, which reflects
the extent of interaction of genetic, physiological and biochemical processes
(Sanders et al., 1995). Maturity in peanuts is achieved more quickly at higher soil
temperatures, while irrigation practices and harvest date also affect peanut maturity
class (Sanders, 1989). Peanuts are a botanically indeterminate plant, which flower
and initiate peanut development over an extended period of time. Although in
general, a larger seed is related to greater degree of maturity, in commercial peanut
lots of any specific size, a range of maturities is found. In fact, not all mature
peanuts are large and not all immature peanuts are small (Sanders et al., 1995).
Quality characteristics such as roast color, flavor, and storability are variable within
peanut lots of the same commercial size, and this may be the result of a distribution
of maturities (Sanders, 1989).
Differences in maturity will affect the carbohydrate and amino acid
composition, as well as the moisture content of the peanuts. As the peanuts mature,
the moisture content decreases, although a range of moisture contents are present
at harvest of 20-70%. As a result of this and the related biochemical and physical
development of the peanuts during processing and shelf life, quality differences can
occur (Sanders et al., 1993). For example, during maturation and processing steps
such as curing, the precursors for Maillard reaction reach optimum levels (Sanders
et al.
, 1995). Also, as peanuts mature, there is an increase in total oil,
triacylglycerol, and the oleic to linoleic acid ratio. At the same time, free fatty acids,
mono- and diacylglycerols, and polar lipids decrease in concentration. Although

19
there is no direct correlation published between amount of oil and shelf life, a
significant correlation has been shown between oil content with maturity, which itself
is related to flavor and shelf life potential (Sanders et al., 1993).
The compositional and structural differences in the proteins and sugars of
immature peanuts suggest that these components will react differently to processes
in manufacture (Sanders, 1989). Vercellotti et al. (1994) formulated a biochemical
model of carbohydrate turnover during peanut curing. Immature peanuts had more
low molecular weight reducing substances and oligosaccharides than the mature
peanuts at all stages during curing. In addition, during maturation, many enzyme-
catalyzed reactions occur by way of proteases, lipases, glycosidases, and
phosphatases to make flavor intermediates. This dependence on timing may
change the flavor compounds present in the final product (Sanders et al., 1993). As
a result of these compositional differences, the type of response to conditions such
as high temperature curing or freeze damage will also vary based on maturity
(Sanders et al., 1995).
The degree of maturity will also affect color development of the peanuts
during roasting. Immature peanuts brown at a lower temperature and more rapidly
than mature peanuts. Consequently, close control of roasting is needed to reach the
optimum Hunter L value of 50 ± 1 (Ory et al., 1992).
Immature peanuts also vary in their flavor profiles. In general, immature
peanuts are more susceptible to off-flavor formation than mature peanuts (Osborn et
al.
, 2001), and at a given temperature, immature peanut seeds have a higher level of
off-flavor production than mature seeds (Pattee et al., 1965). Immature peanuts

20
have significantly lower intensities of positive notes such as roasted peanutty flavor
after roasting, and a higher intensity of off-flavors such as painty, cardboardy, and
fruity-fermented (Sanders, 1989; Pattee et al., 1990; McNeill and Sanders, 1998). In
addition, sour and bitter notes were higher in immature peanuts, and increased in
intensity with increasing curing temperature (Sanders et al., 1989). Sanders et al.
(1989, 1989b) determined that the flavor potential of any peanut lot is related to its
percentage of immature peanuts and the methods of curing and handling applied.
Storage
After curing, peanuts can be stored before further processing, and the storage
conditions will affect the final product quality. When peanuts are stored after harvest,
storage time and seed size will affect carbohydrate and amino acid composition,
volatiles, and roast seed blanchability (Pattee et al., 1982). Raw peanuts are subject
to loss in quality during storage due to insect, bird, and rodent infestation, microbial
activity, mechanical damage, physical changes such as weight loss or shrinkage,
biochemical changes in flavor, and absorption of odors (Smith et al., 1995). Farmers
stock peanuts, or peanuts which have only been picked and threshed, are stored
anywhere from one week to as long as 10 months (Smith et al., 1995).
Decreasing the moisture and temperature in a storage facility will decrease
quality loss during storage. Generally, the best storage conditions for farmer stock
peanuts are approximately 10 °C and 7.5% moisture content wet basis (Smith et al.,
1995). However, if the storage conditions drop below 7% moisture or 7 °C, high
losses in milling quality result when the peanuts are shelled (Smith et al., 1995).

21
Peanuts are commonly stored in flat-storage warehouses, including the
conventional form, the conventional with doghouse, and the muscogee with
doghouse type warehouses. Large crops of peanuts can also be stored in circular
tanks or silos such as those used in the grain industry. For adequate air circulation
through the peanut mass, there is a minimum distance which should be maintained
between the peanut mass and the warehouse roof at the eaves. Peanuts are loaded
into a warehouse using a hydraulic lift or hoist to empty peanuts from the drying
trailer into a dump pit. A bucket elevator then transports the peanuts to a horizontal
belt conveyor with a mobile tripper which distributes the peanuts in the storage
space below. Farmer stock peanuts can be damaged when handled by a bucket
elevator at belt speeds greater than 61 m/min, by crushing during loading and
unloading, or by the drop from the tripper to the warehouse floor (Smith et al., 1995).
After storage, peanuts are cleaned, shelled and undergo gravity or density
separation. Damaged and split seeds are removed during processing using
bichromatic machines, cameras, or electronic sorting machines (Smith et al., 1995).
Blanching
The next steps in peanut processing include blanching and roasting. The
process of peanut blanching consists of an application of heat followed by abrasive
removal of the seed coat. This step is done for several reasons. Blanching results in
the removal of the seed coat which contains tannins that contribute off-flavors and
off-colors (St. Angelo et al., 1977). Blanching also reduces enzyme activity and
moisture content, which are factors impacting subsequent quality (Adelsberg and

22
Sanders, 1997). For example, in a study of lipoxygenase activity in blanched
peanuts, the enzyme activity significantly decreased with increasing heating time
and temperature. Furthermore, blanching aids in the removal of damaged or
discolored seeds, which are associated with aflatoxin contamination (Sanders et al.,
1999). After the seed coats are removed during blanching, electronic color sorters
are used to detect the damaged seed, effectively reducing aflatoxin in contaminated
lots (Whitaker, 1997).
Several methods are used for blanching: spin-blanching, water-blanching,
dry-blanching, alkali-blanching, and hydrogen peroxide blanching. In spin blanching,
peanuts are passed through a skin cutter, dried to lower the moisture to 5%, and
then the skins are loosened and removed using a spin-blancher. Water-blanched
peanut seeds are slit and treated with 86 °C water for 90 seconds, dried to bring the
moisture to 5%, and the skins are then removed mechanically (St. Angelo et al.,
1977).
In general, the most common method in industrial processing is dry
blanching. To dry the peanuts, they are placed on conveyor belts and moved
through large hot-air ovens in which the direction of air flow is alternated in
successive zones (Adelsberg and Sanders, 1997). The peanuts are treated to
increasing temperatures in subsequent zones from 30 °C to 90 °C, with a total time
of approximately 45 minutes. During this time, moisture is removed from the
peanuts and the seed coat is loosened, and after cooling, the seed coats are
mechanically removed (Sanders et al., 1999). Specific information on industrial
blanching protocols is hard to obtain due to proprietary issues. However, industrial

23
blanching has been imitated using a Proctor and Schwartzingle chamber. This is a
flame-heated oven with airflow control, which can be alternated at timed intervals
while gradually increasing oven temperatures (Adelsberg and Sanders, 1997).
It has been suggested that the mechanism of blanching is due to differences
in thermal expansion and subsequent contraction of the seed and seed coat,
resulting in a loosening of the seed coat. In an experiment by Paulsen and
Brusewitz (1976), the coefficient of cubical thermal expansion of seeds (50 – 60.5 x
10
-5
/ °C) was significantly different than that for peanut skins (26.5 – 55 x 10
-5
/ °C),
and as drying continued, the coefficient for cubical thermal expansion for skins
decreased due to moisture loss. This trend led to an increased stress and rupturing
of the skins as the seeds expanded at an increased rate (Paulsen and Brusewitz,
1976).
The efficiency of blanching has been correlated to the genetic makeup of the
plant, with the selection of certain parents resulting in improved blanchability
(Cruickshank et al., 2003). However, processing parameters during blanching have
a significant impact as well. Adelsberg and Sanders (1997) studied the effects of
varying parameters on peanut temperature distributions and blanching efficiency.
The magnitude of peanut bed temperature variation during blanching was related to
final oven set point temperature and to dwell time at each temperature setting. The
temperature variation of individual seeds was up to 5 °C between the seed surface
and a set distance (3 mm) inside the seed. This difference was thought to be due to
the high oil content in peanuts, which leads to low thermal conductivity values
(Adelsberg and Sanders, 1997). Individual seed variation in temperature may affect

24
degree of enzyme inactivation, moisture loss, blanchability, and storage stability
(Adelsberg and Sanders, 1997). In addition, an increase in the range of exit surface
temperatures of the peanuts was correlated to non-uniform drying, which causes a
large variation in single seed moisture distribution (Vilayannur, 1998; Rausch, 2002).
The effects of moisture content and time-temperature parameters were also
evaluated in terms of blanching efficiency. In general, with increasing temperatures
and increasing moisture loss, blanching becomes more efficient (Paulsen and
Brusewitz, 1976; Katz, 2002). Blanchability was correlated with the final oven set
point temperature and negatively correlated with the final moisture content when
above 3.8% (Adelsberg and Sanders, 1997). The specific parameters giving the best
blanching efficiencies are still being debated. Adelsberg and Sanders (1997)
reported that reduction of peanut moisture content from 5.5 to < 4 % using
temperatures of 87.7 °C for 45 and 60 minutes and 98 °C for 30, 45, and 60 minutes
resulted in blanchability above 75%. However, Katz (2002) found that blanching
treatments in which peanut temperatures exceeded 96.7 °C and moisture content
was lower than 6.0%, showed blanching efficiencies greater than 84.5%.
The perception in the peanut industry is that blanching reduces shelf life
(Sanders et al., 1999). For example, blanching has been tied to an increase in lipid
oxidation in raw peanuts (Ory et al., 1992). Pattee and Singleton (1971) suggested
that blanching may increase production of off-flavors in peanuts during storage
compared to raw peanuts, because although methanol and acetaldehyde
concentrations decreased during blanching, pentane increased over storage as a
result of enzyme reactions or lipid oxidation. However, in a study by Sanders et al.

25
(1999), no detrimental effects of blanching on oxidative stability were found.
Although blanched and nonblanched peanuts were different in peroxide value and
OSI value, all values were within acceptable ranges, indicating no meaningful shelf
life differences over storage (Sanders et al., 1999).
The quality and oxidative stability of the peanuts may depend on temperature
and time parameters used during blanching. In a study by Rausch (2002), peanuts
were stable to lipid oxidation after microwave blanching, as determined by peroxide
value, oxidative stability index, hexanal and pentanal concentrations, when treated
with specific power and exposure time conditions. However, peanut batches which
reached surface temperatures above 100 °C declined rapidly in quality over the 28-
week storage period (Rausch, 2002). Blanching temperature has also been
correlated with other flavor effects. Positive attributes such as roasted peanutty had
a weak negative relationship with final blanching temperature in peanuts blanched to
high temperatures (98.9 °C) and for longer times (Sanders et al., 1999).
It has also been reported that different types of blanching appear to have
varying effects on shelf life stability. Unblanched peanuts were the least and water-
blanched were the most stable of roasted peanuts (St. Angelo et al., 1977).
However, it has been reported that in unroasted peanuts, water-blanched peanuts
have the shortest shelf life, while spin-blanched peanuts and unblanched raw
peanuts were more stable. It has been suggested that water-blanched peanuts gain
a glaze of protein and lipids washed from the insides of slits made during blanching.
This glaze oxidizes and shortens shelf life of the peanuts as compared to spin-
blanched nuts and unblanched nuts which are not roasted (St. Angelo et al., 1978).

26
Additional detrimental effects occur in peanuts which are blanched to reduce
aflatoxin levels. In this case, blanching may result in a more rapid deterioration of
already inferior quality peanuts (Sanders et al., 1999).
Moisture content has been shown to affect the stability and flavor quality of
the peanuts (Pattee et al., 1982; Sanders, 1998; Katz, 2002). The best blanching
efficiencies result from peanuts which are subjected to the highest temperatures
during blanching and lose the most moisture. In addition, a uniform moisture
distribution in the peanut batch after blanching allows for a more uniform roast and
overall better quality of the final product (Rausch, 2002). Moisture content also has
an effect on formation of flavor precursors during storage before final processing.
Peanuts which were stored at a higher moisture content (8.7-9.2% versus 6%) had
more hydrolysis of sugars and proteins, as well as a greater deterioration of quality
(Pattee et al., 1982). Furthermore, higher moisture peanuts had lower roasted
peanutty intensity and pyrazine concentrations, and had higher intensities of sensory
notes related to lipid oxidation, such as painty and cardboard (Abegaz et al., 2004).
Roasting
After blanching, many of the peanuts will be roasted for use in peanut butter,
confections, or other snack foods. During processing in a continuous roaster, the
product is metered onto the roaster bed which is an oscillating pan or a fixed-pitch
belt. Hot air is generated in the upper chamber by using either electricity or fuel
sources. This heated air is then distributed from above or below to make a fluidized
bed. Mixing is induced in the peanut bed by bubbling air from below or jet shearing

27
when the air is distributed from above (Cammarn et al., 1990). A recirculation fan is
used to remove exhaust gas. Peanuts are roasted at an internal temperature of 265
to 300 °F, and the moisture content is lowered from 4-6% moisture to 1% moisture
(Hoffpauir, 1953). As a result, reactions such as the Maillard reaction occur which
are key to the formation of typical roasted peanut flavor and color.
The predominant reactions occurring during roasting include the Maillard
reaction, Strecker degradation, and sugar caramelization. The Maillard reaction
involves a reducing sugar, such as glucose from the hydrolysis of sucrose, and an
amino acid under specific conditions of pH, water activity, and temperature. The
reaction intermediate loses a water molecule to form glycosylamine. After the
subsequent Amadori rearrangement, an amino keto sugar is formed, which can lead
to further decomposition products (Cammarn et al., 1990).
The Strecker degradation involves the decomposition of glucose to a dione,
which reacts with an amino acid and loses water molecule, and eventually
polymerizes to form pyrazines or other products. At high temperatures,
caramelization of sugars can also occur. Caramelization involves the dehydration
and decomposition of sugar molecules to form a variety of products such as
aldehydes, ketones, sugar fragments, and unsaturated rings. These unsaturated
molecules can absorb light to make brown pigments (Cammarn et al., 1990).
In addition to protein and carbohydrate reactions, after the peanuts are
roasted, the oil is more susceptible to oxidation. This occurs despite the fact that
lipoxygenase and polyphenoloxidase have been denatured, because of the
presence of nonenzymatic catalysts (Ory et al., 1992).

28
Microwave Processing
Microwave processing has been explored as an alternative to traditional
processing methods, due to its speed of operation, energy savings and efficient
process control. Because heating takes place only in the food material and not the
surrounding medium, microwave processing can reduce energy costs. Shorter
heating times lead to greater nutrient retention, better quality characteristics such as
texture and flavor, as well as increased production (Giese, 1992).
The development of the continuous conveyor microwave oven in the 1960’s
greatly aided the industrial use of microwaves for food processing, due to a more
uniform distribution of microwave energy. Conveyor systems include resonant-
cavity systems and waveguide systems. A conveyor passes through a microwave
field in a resonant cavity system, while the product conveyor in a waveguide system
runs through a slot perpendicular to the waveguide (Giese, 1992).
There are not many large-scale industrial microwave applications currently,
with less than 500 worldwide (Giese, 1992). The exceptions include the use of
microwaves for tempering of frozen foods, precooking of poultry and pork products,
and drying of pasta and onions. Tempering using microwaves can be completed in
minutes, compared to the 2-5 day period needed for traditional thawing techniques,
and there is less microbial growth, little weight loss, increased juice and flavor
retention, and less space required. Microwave cooking has been increasingly
successful for precooking bacon, meat patties, and poultry, due to increased yields,
shorter preparation times, and increased product quality (Mudgett, 1989). The
cooking of bacon by microwave processing also yields high quality rendered fat as a

29
by-product (Giese, 1992). Drying is conducted with combination of conventional
heating and microwaves for pasta, which utilizes less energy and less case
hardening (Mudgett, 1989). In addition, many industrial processes combine
conventional and microwave heating to raise the surface temperature and improve
browning and crisping, to accelerate drying rates, or to reduce microbial counts
(Mudgett, 1989).
Other applications are still being explored for microwave processing.
Microwaves are commonly used for drying cookies and biscuits, but are not used for
commercial bread baking despite energy savings reported. Microwave sterilization
is currently conducted at 110-130 °C under pressure, although problems are still
being addressed such as development of proper packaging materials, excessive
surface heating, and cooling after sterilization (Giese, 1992). Microwave processes
with potential include vacuum and freeze drying, fat rendering, roasting, and
pasteurization (Mudgett, 1989). In the drying of mushrooms, combined microwave
and hot air drying allowed a shorter heat treatment; as a result, the mushrooms had
a higher aroma retention and preservation of the volatile ratios which are significant
to mushroom flavor (DiCesare et al., 1992). Microwaves have also been
investigated as an alternative method to blanch vegetables (Sevirini et al., 2003),
and this method has shown advantages in vitamin C and carotenoid retention in
microwave-blanched carrots, spinach and bell peppers (Ramesh et al., 2002)
In peanut processing, microwave vacuum drying has been researched as a
method for curing (Delwiche, 1986). Microwaves have also been investigated as an
alternative method to roast peanuts (Megahed, 2001). However, Megahed (2001)

30
concluded that in comparison to conventional roasting methods, the use of
microwave technology resulted in the increase of conjugated dienes and trienes,
epoxy and hydroperoxide formation, oil darkening, and the general formation of
undesirable and possibly harmful oxidation products and pigments. Likewise,
Yoshida et al. (2005) found that following microwave roasting, the lipid profile of
peanuts changed unfavorably, as free fatty acids and diacylglycerols increased
significantly, although the unsaturated fatty acids which were located in the second
position on the triacylglycerol were protected from oxidation.
Mechanisms of Action
Microwaves are electromagnetic waves which are between radio and infrared
wavelengths on the electromagnetic spectrum. High frequency energy is emitted by
the magnetron, and includes poles of positive and negative charge changing
direction billions of times each second. As a result, water, salts, and other polar
molecules line up according to charge in the microwave electric field (Giese, 1992).
In orientation polarization, dipoles such as water attempt to follow the rapidly
changing electrical field, and energy is lost due to random thermal motion of water;
this type of polarization is highly temperature dependent (Ryynanen, 1995).
Hydrated ions in a food also try to move in the direction of the changing electrical
field, and transfer energy as a result (Ryynanen, 1995).
Microwave energy heats foods instantaneously, unlike conventional heating
methods, which transfer thermal energy from product surfaces inward 10-20 times
more slowly (Mudgett, 1989). Heating using microwaves is based on the ability of

31
the material to absorb electromagnetic radiation and convert it into heat. The
magnetic field interactions in food are negligible, due to only trace amounts of
magnetic materials present such as nickel, cobalt, or iron. As a result, only the
electric field has an effect (Ryynanen, 1995; Mudgett, 1989). The overall heating
rate in microwave processing is dependent on dielectric constant and dielectric loss,
specific heat, and density. Microwave energy inactivates microorganisms by thermal
denaturation of proteins and nucleic acids, just like conventional thermal processing,
and depends on the same time/temperature relationships (Mudgett, 1989).
The transmission properties of the electromagnetic waves are related to the
dielectric and thermal properties of the food, and also determine the distribution of
energy (Ryynanen, 1995). Packaging also has an effect, as microwaves are
transmitted through ceramic, plastics, paper, and glass, but metals such as
aluminum foil reflect microwaves (Giese, 1992). Energy reflected from the surface
causes standing wave patterns of nodes and antinodes, which result in uneven
energy distribution at product surfaces and hot and cold spots within the product
(Mudgett, 1989).
The microwave penetration depth and overall heating rate will be determined
by the specific heat, density, surface to volume ratio, thermal conductivity,
evaporative cooling of the food, as well as the shape of the food. The sphere and
cylinder are the best shapes for microwave heating, because microwaves can
penetrate the food from all sides. In general, foods which have a high surface-to-
volume ratio will cook more rapidly (Giese, 1992). Products heated in a continuous
microwave with slab geometry, such as trays of peanuts in microwave blanching,

32
experience more heating on the surface than in the middle of the product, which
exposes a limitation of infrared thermometry for process measurements (Rausch,
2002)
The moisture content and temperature of the product affect rates of internal
conduction and surface convection. These are determined by thermal diffusivity,
and are also affected by heat loss from surface cooling by moisture evaporation
(Mudgett, 1989). The electric field inside the load is affected by the dielectric
properties, geometry of the load, and the oven configuration (Ryynanen, 1995).
For practical purposes, penetration depth is calculated, which is the depth
below a plane surface at which the power density of the electromagnetic wave has
decayed by 1/e (~37%) of its surface value (Ryynanen, 1995). Foods which contain
more moisture and salt content will exhibit less penetration depth by the
microwaves, and subsequently have less uniform heating (Mudgett, 1989; Giese,
1992).
Dielectric Properties
The permittivity describes the ability of a material to absorb, transmit, and
reflect electromagnetic energy. Permittivity has two parts: the real permittivity or
dielectric constant, ε', and the imaginary component or dielectric loss, ε".
Permittivity is described by the equation (Ryynanen, 1995):
ε = ε' - j ε"
Where:
ε = Relative complex permittivity

33
ε' = Relative real permittivity (dielectric constant)
ε" = Relative dielectric loss factor
j = Imaginary unit
The dielectric constant relates the ability of the material to absorb energy,
while the dielectric loss factor is related to various mechanisms of energy
dissipation. The dielectric loss is always positive and usually smaller than the
dielectric constant (Ryynanen, 1995). The dielectric constant decreases with
increasing temperature, while temperature has a variable effect on dielectric loss,
depending on the product. A large dielectric loss will translate into shorter heating
times (Giese, 1992).
Dielectric properties are most commonly measured in one of three ways: by
open-ended coaxial probe, transmission line, or by resonant cavity. In all of these
methods, a microwave signal is generated at a certain frequency and is directed at
or through the material being tested. By observing the changes in signal caused by
the material, the dielectric properties are calculated (Engelder and Buffler, 1991).
In general, food products have a loss factor of 25 or less, and exhibit a
penetration depth of 0.6-1.0 cm. However, dielectric properties change with the
composition of the food and with frequency. Both ε' and ε" are affected by the
moisture content, concentration of salt, frequency of electromagnetic field, and the
temperature. Dielectric properties are also affected by the physical state of the food.
For example, as the temperature of frozen goods rises through thawing, both ε' and

34
ε" increase greatly, but then decrease after thawing with rising temperature
(Ryynanen, 1995).
Water is the main component of most foods, and as a result, its
concentration will also determine its dielectric properties. Dielectric properties have
been of interest in agricultural products for use in determining moisture content. In
agricultural products, the dielectric properties vary widely among different kinds of
grain, crop and weed seed, although in general both ε' and ε" are greater in samples
of higher bulk densities and higher equilibrium moisture content. For example, the
dielectric properties at microwave frequencies have been used to nondestructively
estimate the moisture content of shelled peanuts (Trabelsi and Nelson, 2006).
The salt in foods binds the free water molecules, and acts as a conductor in
an electromagnetic field. As a result, salt depresses the permittivity and elevates the
dielectric loss factor when compared to pure water, because it adds charge carriers
to the matrix. However, while ε' increases with water content, low or moderate salt
content does not affect this value much (Ryynanen, 1995). For salty foods at lower
frequencies, ε' decreases sharply with a rise in temperature. In pure water, ε'
increases slightly with decreasing frequency. The degree of influence of water and
salt content in a food depends on the amount to which they are bound or restricted
in movement by other food components (Ryynanen, 1995). Likewise, the effect of
colloidal organic solids is to depress the permittivity (dielectric constant) by excluding
more dielectrically active materials such as water from the volume. The exclusion of
water by carbohydrates affects dielectric properties, as carbohydrates do not show
much dipole polarization at microwave frequencies (Ryynanen, 1995). For fats and

35
oils, both ε' and ε" are low and relatively independent of frequency and temperature
(Ryynanen, 1995).
The dielectric properties of shelled and unshelled peanuts have been
measured in bulk samples (Trabelsi and Nelson, 2004). Shelled peanuts have
much higher densities than unshelled peanuts, and the corresponding difference in
dielectric properties relates to the amount of water interacting with the electric field,
as well as proportions of air and dry matter in the peanuts. Trabelsi and Nelson
(2004) also found that in peanuts, the dielectric constant and dielectric loss both
increase with increasing moisture content of the peanuts, while as microwave
frequency increases, the dielectric loss increases but there is little change in the
dielectric constant. A range of dielectric properties at frequencies between 6 and 18
GHz was tabulated (Trabelsi and Nelson, 2004). Likewise, in a study by Boldor et
al
. (2004), the dielectric properties of peanut pods and kernels were reported at a
range of temperatures (23-50 °C) and moisture contents (18-39%).
Microwave Blanching of Peanuts
The advantages of using microwaves for blanching include reduced
processing times, increases in shelf stability, and increase in nutrient retention. In a
study using a series of individual trays of peanuts passing through a microwave
applicator, Rausch et al. (2005) examined the potential use of microwaves for
peanut blanching. Reducing the moisture content of the peanuts to 6% using
microwave blanching required 6 minutes compared to 60 minutes using traditional
forced heated air (Rausch et al., 2005). Later refinement of the microwave

36
applicator allowed a solid bed of peanuts to be exposed to microwave energy in a
continuous process. This eliminated the heat reflection and focusing effect observed
by Rausch et al. (2005) and prevented the subsequent wide variation in peanut bed
surface temperatures (Boldor et al., 2005).
Several studies have examined the effects of processing parameters on
blanching efficiency in peanuts. In a study by Rausch et al. (2005), the microwave
treatments in which the peanuts reached the highest surface temperature (>85 °C)
and resulted in low moisture contents (6%) resulted in high blanching efficiencies
over 85%. These treatments resulting in 4.8-6.0% final moisture content also
provided the longest shelf life as determined by PV, OSI, and hexanal and pentanal
content (Rausch et al., 2005). Similarly, all microwave-blanched peanuts were more
oxidation stable than oven-blanched peanuts in a study by Katz (2002). In
microwave blanching of peanuts, increased heat treatment to 110 °C surface
temperature of the peanuts improved oil stability as evident by the lower peroxide
value and higher oxidative stability index (Katz, 2002). However, the mildest
microwave blanching treatment (4.7 kW for 2.85 min) was often indistinguishable
from unblanched and oven-blanched peanuts in oxidative stability (Katz, 2002).
Flavor Chemistry of Peanuts
Raw peanuts contain volatiles characteristic of lipid oxidation that arise
through natural enzymatic processes or by degradation of damaged seeds (Waltking
and Goetz, 1983). The volatile components of raw peanuts associated with
lipoxygenase activity include: ethanol, pentane, pentanal, and hexanal (Pattee et al.,

37
1969). The flavor characteristics of major headspace volatiles in raw peanuts were
identified as musty aftertaste, fruity, and musty (Young and Hovis, 1990). A
combination of γ-butyrolactone, benzaldehyde, indene, 2-methoxy-3-
isopropylpyrazine, nonanal, benzyl alcohol, and alkyl-substituted benzenes have
also been associated with the legume-like flavor (Fischer and Grosch, 1981). In
addition, high amounts of raw/beany flavor in the raw peanuts have been correlated
with methanol and ethanol concentrations (Crippen et al., 1992).
Flavor Production During Roasting
The unique flavor of roasted peanuts drives product marketing in the peanut
industry. This flavor is the result of genetics, production and handling, storage, and
processing factors (Sanders et al., 1995). The basic characteristics of roasted
peanut flavor have been described as nutty, stemming from the presence of
methylpyrazine, 2,6-dimethylpyrazine, and 2-methyl-5-ethylpyrazine; cheesy, from
isobutyric and valeric acids; and garlic, from sulphides present in the peanuts (Lee,
1980). The thermal products of the roasting process contribute to the unique peanut
flavor, and are affected by environment during storage and the initial mix of flavor
precursors (Vercellotti et al., 1994). Non-enzymatic carbonyl-amine browning and
lipid oxidation reactions are the sources of volatile flavor compounds in peanuts, and
include interactions between peanut components as well as thermal decomposition
products and loss of volatiles (Hoffpauir, 1953; Warner et al., 1996).
Maillard reactions are primarily responsible for browning reactions in roasted
peanuts, although caramelization of sugars plays a minor role. The products of

38
browning reactions include pyrazines, pyrroles, furans, and other low molecular
weight compounds (Ahmed and Young, 1982). However, although many
compounds have been found in roasted peanuts which also contribute nutty or
roasted character to other roasted foods, such as potato chips, coffee beans, and
cocoa (Mason et al., 1969; Waltking and Goetz, 1983), the characteristic roasted
peanutty component remains elusive.
The concentration of carbohydrates and other carbonyls impacts peanut
flavor through the Maillard reaction during roasting. During roasting, moisture and
volatiles are driven off, while proteins are denatured and are involved in Maillard
reactions (Hoffpauir, 1953). Reducing sugars are liberated from sucrose and free
amino acids are liberated from large peptides during roasting to form Maillard
reaction products. The heating process destroys the integrity of the membranes
separating starch, oil, and storage proteins in the peanuts, resulting in reaction rates
approximating the Arrhenius model (Mason et al., 1969).
In order to react with amino acids, the carbohydrate must be a reducing
sugar, polyhydroxycarbonyl compound or a breakdown product such as that which
results from the hydrolysis of sucrose into fructose and glucose. These
carbohydrates can then form a Schiff base with amino acids, which undergo
reactions to become reductones, and then in turn are formed into any of a series of
flavor compounds through condensation and ring closure reactions. For example,
imidazoles and pyrazines are formed which can condense into colored polymers
(Sanders et al., 1995). In addition to Maillard products, carbonyls are produced by
Strecker degradation and oxidation, but then may be lost by volatilization (Buckholz

39
et al.
, 1980). Likewise, sugars present can undergo caramelization or can be
degraded (Hoffpauir, 1953).
The volatiles produced by roasting have been classified into three groups
(Ory et al., 1992): those which increase in production rate over a wide range of
temperatures (such as methanol, acetaldehyde, 3-methylbutanal, N-methylpyrrole,
and 3- carbon substituted pyrazines), those produced at low concentrations at
temperatures below 142 °C (2-methylpropanal, dimethylpyrazine, 4-carbon
substituted pyrazines, benzene acetaldehyde), and a third group which is little
affected by an increase in roasting temperature (ethanol and lipid oxidation
products).
Pyrazines, which are volatile heterocyclic nitrogen-containing compounds, are
the major flavor compounds impacting roasted peanut flavor (Warner et al., 1996;
Baker et al., 2003). Pyrazines and a pyrrole were first identified in roasted peanuts
by Mason and Johnson (1966) by making aqueous condensates of stripped volatiles
of Spanish peanuts, and subsequent analysis by gas chromatography-mass
spectrometry (GC-MS). Nuclear magnetic resonance, ultraviolet detection and mass
spectrometry were used to identify methylpyrazine, 2, 5-dimethylpyrazine,
trimethylpyrazine, ethylmethylpyrazine, dimethylethylpyrazine, and N-methylpyrrole
in roasted Spanish peanuts (Mason and Johnson, 1966). Through vacuum
degassing of pressed, roasted peanuts followed by GC-MS, IR and UV identification,
Johnson et al. (1971) first identified 19 alkylpyrazines present in the basic fraction of
roasted peanuts. Most of the alkyl pyrazines reported were attributed to browning
reactions. However, the formation of 2-phenyl-2-alkenal was attributed to aldol

40
condensations between phenylacetaldehyde and aliphatic aldehydes, acetaldehyde,
isobutyraldehyde, or isovaleraldehyde, with the next step being dehydration.
Likewise, the headspace volatiles of roasted peanuts held in storage showed 2-
methyl pyrazine and 2,6-dimethyl pyrazine in the highest concentrations, of 11.19-
25.82 ng/mL headspace gas/10g peanuts (Warner et al., 1996).
Several pathways have been suggested for the formation of pyrazines,
including the reaction of sugars with amino acids, condensation and eventual
cleavage to form alkylpyrazines. Alternatively, at high temperatures, sugars may
first rearrange and cleave into smaller fragments, which then condense with amino
acids to form alkylpyrazines, and this latter is the more likely route in roasted foods
(Koehler and Odell, 1970).
However, pyrazines are not the only compounds which have been detected in
peanuts. In a study of roasted peanut volatiles, Mason et al. (1967) found
acetaldehyde, isobutyraldehyde, benzaldehyde, phenylacetaldehyde, as well as
tentative identification of 2-methylbutanal, 3-methylbutanal, and 3-methyl-2-
butanone using 2,4-dinitrophenylhydrazone derivatives. These aldehydes were
thought to arise by Strecker degradation of the corresponding amino acid. Ethyl
acetate, toluene, and N,N-dimethylformamide were also identified (Mason et al.,
1967). Other heterocyclic and sulfur compounds, such as phenols, ketones, esters,
alcohols, and hydrocarbons were found among the volatile components of roasted
peanuts by Walradt et al. (1971). Basha and Young (1996) separated peanut seed
proteins into fractions by gel filtration, heated these fractions, and tested the
resulting headspace gasses for flavor volatiles present in roasted peanuts, such as

41
n-methylpyrrole. Walradt et al. (1971) also identified 5, 6, 7, 8-tetrahydroquinoxaline
and methyl- and ethyl acetylpyrazine as occurring in roasted peanuts for the first
time. Johnson et al. (1971b) identified 24 compounds including seven furans, six
pyrroles, three 2-phenyl-2-alkenals, and two thiophenes in the neutral fraction of
roasted peanuts, specifically: toluene, methyl disulfide, n-hexanal,
2-methyltetrahydrofuran-3-one, furfural, 5-methylfurfural, furfuryl alcohol,
naphthalene, acetyl-2-thiophene, N-(2-furfuryl)-pyrrole, phenyl-3-furan, 2-phenyl-2-
butenal, 2-acetylpyrrole, pyrrole-2-carboxaldehyde, and 5-methyl-2-hexenal.
The compounds isobutyraldehyde, isovaleraldehyde, 2-methylbutanal, 1-
methylpyrrole, 2-methylpyrazine, and 2,5-dimethylpyrazine were identified by
polymer adsorption method and subsequent mass spectrometry in roasted peanuts
(Buckholz, Jr. et al., 1980b). Ho et al. (1981) reported many flavor components for
the first time using nitrogen gas to remove volatile components of roasted peanuts
and subsequent condensation and ether extraction, including lactones, pyrazines,
pyrroles, pyridines, sulfides, thiophenes, and furanoids. Hexanal, 1-methylpyrrole,
cyclobutanol, 4-ethyl-2, 5-dimethylsoxazolidine, 2, 6-dimethylpyrazine, 1-hexanol,
and acetic acid were detected in raw, roasted, and fried Runner peanuts (Burroni et
al.
, 1997). In fact, when Pattee and Singleton (1981) reviewed volatiles in roasted
peanuts, they found a total of 223 compounds.
The sensory analysis of roasted peanut flavor has been correlated to pyrazine
levels (Maga, 1982). Specifically, 2-ethyl-3-methylpyrazine as well as 2-nonenal has
been associated with the peanutty sensory characteristic (Clark and Nursten, 1977).
An increase in pyrazine compounds was related to a transition between weak and

42
strong roasted flavor in peanuts (Leunissen et al., 1996; Buckholtz et al., 1980).
Methylpropanal, methylbutanal, dimethylpyrazine, and methylethylpyrazine have
been related to dark roasted flavor in peanuts (R> 0.84) using both a dynamic
headspace technique and direct GC (Crippen et al., 1992). Pyrazine
measurements, rather than Hunter LAB value, have also been used with increased
accuracy in relating peanut aroma and flavor in industrial processing, where a mix of
genotypes may be used (Baker et al., 2003).
Several efforts have been made to tie specific pyrazines to the sensory
“roasted peanutty” characteristic. Mason and Johnson (1966) suggested that
trimethylpyrazine or 2-methyl-5-ethylpyrazine might be responsible for the
characteristic roasted note in peanuts. 2, 3, 5-trimethylpyrazine appears also to be a
good indicator of roasted peanut flavor especially in Florida MDR 98 peanuts (Baker
et al.
, 2003). However, in peanuts roasted above 150 °C, 2,5-dimethylpyrazine had
a high correlation with roasted peanut flavor and aroma, as compared to L-values,
for all genotypes of peanuts tested (Baker et al., 2003). Methylpyrazine is
associated with the sensory characteristic of "roasted" and is desirable at low
concentrations; however, at higher concentrations of methylpyrazines as well as
other pyrazines, the flavor becomes more bitter (Leunissen et al., 1996).
The peanuts used for roasting are a mix of genotypes, seed sizes, maturities,
and seed composition, so establishing the relationship between volatile compounds
and roasted peanut flavor would allow for roasting optimization (Baker et al., 2003).
However, not only are pyrazines the most substantial compound tied to positive
characteristics in roasted peanuts, they also function to obscure some off-flavors. In

43
fact, Ory et al. (1992) suggested that the quality of volatiles in peanuts is easier to
determine in raw peanuts, because volatiles formed during roasting may obscure
smaller peaks.
Roasted peanuts are susceptible to eventual fade in the flavor profile, which
may be due to lipid oxidation. Flavor-fade seems to be associated with the masking
of pyrazines and other "roasted peanut" flavor compounds by large quantities of low-
molecular weight aldehydes produced during lipid oxidation, such as hexanal,
heptanal, octanal, and nonanal (Dimick, 1994). Eliminating or decreasing the rate of
flavor-fade requires understanding the relationships between carbonyl-amine and
lipid oxidation reactions, as well as degradation and polymerization reactions of
heterocyclic nitrogen compounds (Warner et al., 1996).
The proteins in peanuts may also be involved in off-flavor formation. Basha
et al.
(1998) isolated a high molecular weight protein fraction from peanut seed
which was involved in off-flavor production during the roasting of peanuts. The
Maillard reactions of sulfur amino acids with carbohydrates can also cause sulfide or
sulfur heterocyclic off-flavors, although small amounts of these compounds can add
positively to overall flavor (Sanders et al., 1995).
Roasting Parameters Effect on Flavor
Although current quality standards for roasted peanut flavor are based on
seed color and changes in moisture content after roasting, other factors such as
peanut genotype, harvest maturity, planting date, and improper curing and drying
also affect roasted flavor (Baker et al., 2003). Pyrazine formation is increased by

44
basic pH, and higher concentrations of certain sugars such as fructose. The specific
type of pyrazine formed is influenced by the nitrogen source (Koehler and Odell,
1970).
Time and temperature conditions of roasting have perhaps the most
significant impact on compound formation. Leunissen et al. (1996) found that the
concentrations of pyrazine compounds and hexanol, hexanal, and methylpyrrole
were related to the severity of the roasting conditions. In a model system study,
Koehler and Odell (1970) found that no pyrazine compounds were formed at
temperatures less than 100 °C, but above this temperature pyrazine yield rapidly
increased. Roasting at temperatures above 120 °C produces a wide range of
compounds in peanuts due to Maillard reactions (Leunissen et al., 1996). In the
early stages of a heating reaction at 120 °C, methylpyrazine was the major product,
while the ratio of dimethylpyrazine to methylpyrazine steadily increased thereafter.
At temperatures above 150 °C, some pyrazine degradation may occur (Koehler and
Odell, 1970). By direct chromatography, Vercellotti et al. (1992) found
methylpropanal, methylbutanal, methylbutanol, methylpyrazine, dimethylpyrazine,
methylethylpyrazine, and vinylphenol to vary with degree of roast. Other factors will
affect roasting temperature, as seen in Chiou et al. (1991), where the internal
temperature of low-moisture seeds (3.4%) was higher than high moisture seeds
(10.4%).

45
Flavor Research in Other Nuts
Several studies have been conducted on the flavor profiles of other types of
nuts, and compounds such as pyrazines and pyrroles have been found in common
with peanuts. Nutty notes in roasted pecans were attributed to alkyl pyrazines and
pyridine by Wang and Odell (1972). In these experiments, the authors characterized
the volatile compounds of roasted pecans using GC-MS and DNPH derivatives.
Nineteen carbonyl compounds were identified, of which 17 were found in pecan oil
extracted from raw and heated pecans, suggesting that the majority of the
compounds arose from the lipid fraction of the nuts. Wang and Odell (1972)
identified the burned notes in roasted pecans as being associated with furfural, 2,3-
pentadione, pyruvaldehyde, and glyoxal, and some of these compounds were
thought to arise from triacylglycerol breakdown during roasting.
Pyrazines and pyrroles have also been found in roasted filberts. Sheldon et
al.
(1972) identified volatiles in roasted filberts, including pyrazines, pyrroles,
carbonyls, furans, and two sulfur-containing compounds by GC-MS. The
development of roasted filbert flavor appeared to parallel the development of 2-
methylbutanal, 3-methylbutanal, and dimethyl sulfide during roasting.
Likewise, Takei and Yamanishi (1974) studied roasted almond volatiles by
separating compounds into nonbasic, basic carbonyl, and basic noncarbonyl
fractions. Using GC-MS, pyrazines, aldehydes, ketones, and furanoic compounds
were identified, and several new components were found using a methanol extract.
In this extract, 2,5-dimethyl-4-hydroxy-3(2H)-furanone was identified as important to
the flavor of roasted almond (Takei and Yamanishi, 1974).

46
Precursors to Roasted Notes
Initial attempts to identify precursors of roasted peanut flavor led to the
conclusion that roasted flavor arose from low molecular weight compounds such as
aleurone grains and protein bodies in the peanut (Mason and Waller, 1964).
Flavor precursors were believed to form flavors through intracompartmental
pyrrolysis and degradation of the precursors at temperatures exceeding 132 °C
(Mason and Waller, 1964). Then Mason et al. (1969) found that raw defatted
peanuts would develop typical roasted peanut aroma, no matter if heated in peanut
oil or oil from another source. Flavor development has been shown to be sensitive to
peanut maturity, and Mason et al. (1969) correlated the concentration increase of a
specific peptide to increase in maturity, suggesting that this peptide is a
characteristic precursor of typical roasted peanut flavor. Newell et al. (1967) also
postulated a mechanism for the conversion of amino acids and sugars into volatile
flavor compounds, with the ultimate product of 2,5-dimethylpyrazine. The same
group found that aspartic acid, glutamic acid, glutamine, asparagine, histidine, and
phenylalanine were associated with the production of typical peanut flavor. These
amino acid concentrations initially represent a majority of free amino acids present,
and decrease as they are degraded during roasting (Newell et al., 1967).
Moisture content also plays a part in flavor development. During roasting,
hydrolysis can occur in higher moisture peanuts, increasing the amounts of free
amino acids and monosaccharides, and as a result, the original content of flavor
precursors in raw peanuts may not be a final indicator of flavor quality (Chiou et al.,
1991). In fact, Chiou et al. (1991) found that the amino acid content of peanuts

47
changed with time of roasting and initial moisture content. The higher the moisture
content of the peanuts, the more labile the proteins were to heat denaturation,
indicating that the moisture content may affect the balance of flavor precursors
(Chiou et al., 1991).
By identifying the compounds that contribute to a flavor, the precursor
compounds and path of development may also be eventually identified (Crippen et
al.
, 1992). Consequently, appropriate pretreatment of raw peanuts could be applied,
such as adjustment of moisture content to release precursors and therefore enhance
formation of roasted peanutty flavor (Chiou et al., 1991). Alternatively, those
precursor concentrations in plants could be increased using genetic engineering to
produce food with more flavor (Teranishi, 1998).
Off-flavors in Peanuts
The off-flavors affecting the sensory profile of a food can be caused by a
variety of sources. Foods can contain off-flavors either by airborne or waterborne
contamination, through packaging, oxidation, nonenzymatic browning, enzymatic
reactions, biochemical reactions, microbial contamination, or light-induced reactions
(Reineccius, 1991). In non-preserved foods, the most common source of off-flavors
is microbial activity, due to production of undesirable primary metabolites, chemical
conversion of certain food constituents, or through residual enzyme activity after cell
death (Reineccius, 1991).
In peanuts, the causes of off-flavors can be divided into three groups: off-
flavors caused by lipid oxidation, off-flavors which are caused by excessive amounts

48
of ethanol (with possible accompaniment of methylbutanol and 2,3-butanediol), and
those off-flavors caused by external contamination such as limonene, antioxidants,
or insecticides (Ory et al., 1992). The main sources of off-flavors in peanuts may be
lipid oxidation and anaerobic respiration due to temperature abuse.
Flavors Due to Lipid Oxidation
Lipid oxidation is one of the leading causes of off-flavors in raw and roasted
peanuts, due to a high content of peanut lipids that contain unsaturated fatty acids
(Warner et al., 1996; Lee et al., 2002). Oxidation of the fatty acids in peanut oil can
be caused by light, heat, air, metal contamination, or microorganisms (Ory et al.,
1992). Oil composition is crucial to oxidation rates and by-product formation. When
evaluating fatty acid composition on product quality, a higher percentage of oleic
acid, low percentage of linoleic acid, a high oleic/linoleic acid ratio, and low iodine
value are associated with better oil stability and longer shelf-life of peanuts
(Jambunathan et al., 1993). In a study examining peanuts from US, China, and
Argentina, Sanders et al. (1992) found that US peanuts had consistently higher
tocopherol content, lower free fatty acids and peroxide value, as well as lower
copper and iron content. In addition, US peanuts had higher oleic:linoleic acid
ratios, showing the influence of these factors on oxidative reactions and shelf life.
Lipid oxidation has been correlated with factors such as water activity, relative
humidity, and especially oxygen concentration in the environment (Labuza, 1971).
However, the chief causes of lipid oxidation are enzymes such as
lipoxygenase or lipase (Sanders et al., 1993). Lipoxygenase is specific for

49
polyunsaturated acids that have a cis-cis 1, 4 pentadiene structure such as linoleic
and linolenic acids (Ory et al., 1992). Lipoxygenases activate oxygen to produce
hydroperoxides at the allylic carbon in polyunsaturated fatty acids, and conjugated
dienes can be subsequently made by rearrangement. Hydroperoxides subsequently
break down into alcohols, alkanes, ketones and aldehydes which can be the source
of off-flavors in the peanut. Oxidation by enzymes such as lipoxygenase is likely at
locations of cell membrane disruption, as reactants previously separated become
mixed and available for reaction (Ory et al., 1992).
When these enzymes are inactivated by high temperatures during roasting,
autoxidation becomes the principle source of lipid breakdown (Lee et al., 2002).
Although all enzymes are denatured during roasting, some enzymes such as
peroxidase, which contains iron, and polyphenoloxidase, which contains copper, can
become pro-oxidants after denaturation (Ory et al., 1992). Transition metals such as
iron and copper can promote lipid oxidation in peanuts by abstracting hydrogen from
unsaturated fatty acid to make a radical, or by indirectly generating reactive oxygen
species (Sanders et al., 1995).
Lipid oxidation can be identified using chromatographic analysis of the
samples. Regular lipid oxidation in raw or roasted peanuts is indicated by hexanal
and/or hexanol in high concentrations, and when present at levels greater than 2
ppm, these can be detected by taste panelists (Ory et al., 1992). The
monohydroperoxides that are formed from linoleate oxidation are precursors for
volatile decomposition products such as nonanal, octanal, decanal, and hexanal,
and the most predominant of these is hexanal (Min et al., 1989). Both the quality

50
and quantity of volatiles formed in heat-treated lipids are governed by the type of
hydroperoxide precursors in the sample (Ulberth and Roubicek, 1993). Volatiles
such as ethanol, pentane, and pentanal have also have been associated with lipid
oxidation (Brown et al., 1977). Furthermore, lipid oxidation products can be linked
through glycosidic linkages or hemiacetal and ketal links to polysaccharides, which
are then released during the roasting process (Vercellotti et al., 1994).
Lipid oxidation can also be identified in a chromatogram by a general rise in
the base line volatiles beyond hexanal, due to the appearance of oxidation by-
products such as aldehydes, ketones, and hydrocarbons. Most of the compounds
with retention times less than hexanal are lost during the roasting process (Ory et
al.
, 1992). Volatile profiles of roasted peanuts both with and without lipid oxidation
were analyzed using direct GC and an external closed inlet device and
“aromagrams” for different quality peanuts were generated (Vercellotti et al., 1992).
Vercellotti et al. (1992) also published profiles matching flavor peaks identified with
GC-O to retention time, enumerating lipid degradation compounds found in the
rancid peanuts.
Although the flavor and aroma of high quality roasted peanuts is in part due to
oxidized compounds generated during storage (Ahmed and Young, 1982), these
compounds can also have a negative impact at higher concentrations. Oxidation
reactions can result in decrease of desirable peanut flavor by loss of low molecular
weight flavor compounds and generation of undesirable volatile carbonyls such as
nonanal, decadienals, or heptadienals (Sanders et al., 1993). Vercellotti et al.
(1992) found that during lipid oxidation, off-flavor producing volatiles such as

51
hexanal are intensified to the high ppm range, while positive olfactory attributes
become imperceptible as heterocycles and thio-derivatives disappear at high
oxidation levels. Low molecular weight aldehydes such as pentanal, hexanal,
heptanal, octanal, and nonanal can also create a cardboard or oxidative rancid flavor
(Warner et al., 1996). St. Angelo et al. (1984) found that when the presence of
hexanal, hexanol and pentane exceeded concentrations of 2-3 ppm in GC
chromatograms, the peanuts were judged as rancid by the sensory panel.
Because off-flavors caused by oxidation have been closely correlated to the
differences in lipid profiles in peanuts, researchers have isolated the peanut oil in
flavor experiments. Chung et al. (1993) studied the differences in the headspace
volatile production from peanut oil heated under a broad range of temperatures from
50-200 °C simulating mild frying, deep-frying, and near-pyrrolysis conditions, and
they identified hydrocarbons as the most abundant class, followed by aldehydes.
During heating, free fatty acids were formed from the hydrolysis of triacylglycerols,
and these were transformed to γ-hydroxy fatty acids by oxidative attack of hydroxy
radicals, followed by transformation to lactones by cyclization. These lactones may
be responsible for the formation of fruitlike aromas in the peanuts, as γ-octalactone
and γ-nonalactone were found in the peanut oil. Formation of fatty and rancid off-
flavors in peanut oil during heating was attributed to the formation of carbonyl
compounds. These low molecular weight carbonyls could be isolated only by
derivatization to thiazolidine compounds (Chung et al., 1993).
Lipid oxidation reactions are strongly influenced by storage conditions, and as
a result, off-flavors can develop during this time. In a study by Warner et al. (1996),

52
headspace concentrations of hexanal, heptanal, octanal, and nonanal increased
during storage, with hexanal being the major aldehyde at concentrations of 187-865
ng/mL headspace gas/10g peanuts after 26 days. In combination with this, higher
TBA values and oxidative rancid flavor scores were seen, indicating that off-flavor
production was in part due to production of low-molecular weight aldehydes from
lipid oxidation.
Peanuts naturally contain antioxidants which can slow or prevent lipid
oxidation reactions. For example, it has been noted that peanuts contain alpha-
tocopherol and carotenoids (Sanders et al., 1995). In addition, some products of
reducing sugar reactions and Maillard browning such as reductones are free radical
scavengers, which protect peanuts from oxidative damage to proteins,
phospholipids, nucleic acids, and polysaccharides (Sanders et al., 1993).
Off-flavors Due to Anaerobic Respiration
When peanuts are subjected to cold or heat stress, the respiration process
changes from aerobic to anaerobic (Singleton and Pattee, 1992, Osborn et al.,
1996). Anaerobic respiration is initiated by an insufficient supply of oxygen diffusing
into the seed for the increased respiratory need at higher temperatures.
Temperature stress in peanut seeds can occur at any temperature greater than
35 °C or less than 4 °C, for example during an abusive curing process. In addition,
when cells are exposed to heat or cold stress, membrane damage occurs and
cellular components can leak, disrupting metabolic processes (Singleton and Pattee,
1997).

53
The results of temperature stress include an increased concentration of
acetaldehyde and ethanol, which have been linked to off-flavor formation (Singleton
and Pattee, 1992). Pattee et al. (1965) reported compounds from high temperature
cured peanuts for the first time, including: formaldehyde, acetaldehyde, ethanol,
acetone, isobutyraldehyde, ethyl acetate, butyraldehyde, isovaleraldehyde, 2-methyl
valeraldehyde, methylbutylketone, and hexaldehyde. Although some of these
compounds were found in control peanuts as well, quantitative differences existed;
in fact, comparison of the concentrations of acetaldehyde and ethyl acetate
suggested that off-flavors may result from increased concentration in the peanuts
(Pattee et al., 1965). Ethyl acetate concentrations increase when ethanol produced
by anaerobic respiration reacts with carboxylic acids in the plant cells to produce
esters. These esters have been commonly associated with flavor production
(Osborn et al., 1996). High temperature cured peanuts were also found to have
increased concentrations of mercaptans, carbon dioxide, basic compounds, and
carbonyls as temperature increased (Young, 1973).
Other changes in the cell can also be used to index quality damage in
peanuts due to temperature abuse. Peanut seed exposed to cold or heat stress
exhibits an increased efflux of potassium and acetic acid, resulting in an increase of
conductivity of the leachate. In addition, photomicrographs of tissue from stressed
peanuts shows that cells take on an irregular shape, because cellular constituents
expand in heat-stressed seed (Singleton and Pattee, 1997).
The levels of these marker compounds and amounts of off-flavor production
are affected by environmental and processing parameters. Specifically, moisture

54
content has a significant effect. In a study by Singleton and Pattee (1991), as the
moisture level of peanuts exposed to freezing temperatures was increased from 6 to
40%, acetaldehyde and ethanol increased in concentration, to up to 27 times the
control concentration. The high moisture peanuts were more susceptible not only to
freeze damage, but also to heat stress, and also had increased rates of hydrolytic
reactions. Even peanuts at 25% moisture were more susceptible to freeze damage,
and subsequent elevated drying temperatures accentuated the damage (Singleton
and Pattee, 1991). In a study by Osborn et al. (1996), seed moisture content as well
as peanut maturity appeared to influence production rates of acetaldehyde, ethanol,
and ethyl acetate, although ethyl acetate production rate appeared to be proportional
to amounts of ethanol produced.
Time and temperature protocols during processing also have an effect.
During drying of peanuts, formation of acetaldehyde, ethanol, and ethyl acetate did
not begin right away. Instead, volatiles increased after 5-15 hours of processing,
while ethanol concentrations began to decrease after 30-40 hours (Osborn et al.,
1996). Procedures for detection of high temperature off-flavors must take into
account that volatiles diffuse from peanuts during drying. The concentrations of
these volatiles after processing depends on the rate of both formation and diffusion
rates of each volatile, which are affected by seed temperature during drying. Seed
temperature has been related to amount of off-flavor produced in the peanuts as
well. Likewise, the ratio of acetaldehyde to ethanol to ethyl acetate during the drying
process was also related to drying air temperature (Osborn et al., 1996).

55
Brown et al. (1977) found that the GC peak area ratios of ethanol/methanol
and ethanol/total volatiles were correlated to taste panel flavor scores, and there
was a negative correlation between ethanol and roasted flavor (Brown et al., 1977).
Ethanol, ethyl acetate, and acetaldehyde contribute to an off-flavor in raw peanuts
which is described as a fermented odor and taste, and this process can be
monitored using headspace analysis and GLC (Singleton and Pattee, 1992).
Conversely, the absence of acetaldehyde, ethyl acetate, and ethanol is connected to
the absence of off-flavor when peanuts are dried under conditions in which
anaerobic respiration does not develop (Osborn et al., 1996). In a study by Young
and Hovis (1990), the descriptive term of abusive drying was correlated to ethanol,
and "aging" was correlated to 2-methylbutanal and 3-methylbutanal.
Fruity Fermented Off-flavor
Exposure to high temperatures, such as during the curing process, has also
been correlated to the development of the fruity fermented off-flavor. Reducing
substances have been shown to contribute fruity fermented off-flavors, and are also
principle fruit flavors in themselves, such as hydroxyfuranones which contribute to
pineapple, strawberry and apricot flavors (Vercellotti et al., 1994). The fruity
fermented off-flavor has been found to increase with a concurrent increase in
ethanol concentration (Sanders et al., 1989).
The specific compounds causing the fruity fermented off-flavor were
investigated by Didzbalis et al. (2004). Using gas chromatography-olfactometry
(GC-O) and solvent assisted flavor evaporation (SAFE), fruit esters such as ethyl 3-

56
methylpropanoate, ethyl 2-methylbutanoate and ethyl 3-methylbutanoate as well as
increased levels of short chain organic acids such as butanoic acid, hexanoic acid,
and 3-methylbutanoic acid were found in immature peanuts cured at high
temperatures, which had the fruity fermented off-flavor. By adding these compounds
back to a model system, the short chain organic acids were shown to be responsible
for the cheesy fermented aroma, while the esters added fruity, apple-like aromas.
Subsequent processing, such as roasting, increased the levels of short chain
organic acids by 10- to 40-fold in fruity fermented peanuts (Didzbalis et al., 2004).
In addition to the off-flavor, fruity fermented peanuts have been associated
with lower levels of the desirable roasted peanutty flavor and sweet aromatic notes.
Pattee et al. (1989) first noted the impact of the fruity character in suppressing
roasted peanut flavor. An inverse linear relationship was found between roasted
peanut flavor and fruity off-flavor in roasted peanut paste, with a 1:2 decrease /
increase ratio, respectively. The fruity off-flavor in peanuts may suppress roasted
peanut flavor perception, or production of the roasted peanut attribute may be
reduced due to high-temperature curing (Pattee et al., 1990).
Immature peanuts may be more susceptible to fruity fermented off-flavor
formation due to the incomplete biosynthesis of primary metabolites. Furthermore,
these metabolites will mix and react during cell damage caused by temperature
stress (Didzbalis et al., 2004). Threonine, tyrosine, and lysine have been found in
high concentrations in immature peanuts with high levels of off-flavors, and as a
result were associated with the production of atypical flavors (Newell et al., 1967).
Didzbalis et al. (2004) found that while immature peanuts cured at high temperatures

57
exhibited the fruity fermented off-flavor, both mature peanuts cured at high
temperature and immature peanuts cured at low temperatures were free of the off-
flavor, and had higher roasted peanutty scores as well.
Off-flavors Due to External Contamination
Off-flavors can occur due to outside contamination from many sources, such
as chlorophenols from the reaction of phenol and chlorine in the water supply or
from algaecides and fungicides; production of chloroanisoles by microbial activity;
airborne contaminants due to emissions from nearby industry; contaminated plant
water used to wash, heat or for reconstitution; pesticides, disinfectants or detergents
used in proximity of the foodstuff; or from minor constituents of food packaging such
as closures, can coatings, or lubricants (Reineccius, 1991). In peanuts, external
contamination can occur if the peanuts are stored with citrus products (limonene
contamination), antioxidants are applied (propylene glycol or ethyl hexanoate
contamination), or insecticides are applied, because these compounds can be
absorbed by the peanuts (Ory et al., 1992).
Dark Soured Aromatic Off-flavor
The dark soured aromatic off-flavor (DSA) was described by Katz (2002) as a
new flavor descriptor for an off-flavor formed in peanuts treated at high temperatures
during microwave blanching. This DSA flavor may be unique to microwave-treated
peanuts. However, initial results were inconclusive, as sensory panelists found DSA
in raw and oven-treated control peanuts as well, possibly due to the panelists’

58
confusion with painty notes developing during lipid oxidation over storage.
Development of DSA appears also to be related to temperature. Treatments
resulting in highest temperatures (4.7kW for 5.77 min, and 7.3 kW for 2.85 min) had
significantly more DSA detected in the samples by sensory panel (Katz, 2002).
Methods of Flavor Analysis
The separation of volatile aroma compounds from non-volatile food matrices
has been a subject of much research. Great care must be taken during the isolation
of flavor compounds not only to ensure that the isolates have the sensory properties
of the foods being studied, but also that heat labile compounds are not destroyed,
highly volatile compounds are not lost during distillation, or low solubility compounds
are not lost in extractions (Teranishi, 1998). Vercellotti et al. (1992) recommended
using temperatures no higher than 130 °C for half an hour during analysis to prevent
the production of additional peanut volatiles. Unfortunately, aroma-active
compounds in foods have a wide range of chemical properties, such as polarity,
volatility, and solubility, so it is difficult to choose the best extraction method. In
addition, aroma compounds can be present at very low concentrations, even
femtogram levels, and extractions can be complicated by interference from other
components of the food matrix (Reineccius, 2002).
The majority of past methods used to quantify peanut volatiles have involved
heating large sample sizes and using distillation to separate the volatile compounds
of the peanut, which caused changes in volatile compound levels, thermal
conversion of volatiles to other isomers, or loss of volatile compounds during transfer

59
(Pawliszyn, 2000). Also, the elevated temperatures used during distillation can
cause the formation of artifacts, such as Maillard or Strecker compounds when
sugars and free amino acids are present. While distillation utilizes differences in
vapor pressure, solvent extractions and chromatography utilize differences of
distribution equilibria (Teranishi, 1998). After Dupuy et al. (1971) developed a direct
GC method to analyze peanut flavor, a database was then developed to establish a
"normal" peanut volatiles profile of good quality raw peanuts which have few
breakdown products of lipid peroxidation. Since the 1950’s, the number of
compounds characterized for their flavor properties has grown from 500 to 15,000,
due to the advent of gas and liquid chromatography, infrared, nuclear magnetic
resonance, and mass spectrometry (Teranishi, 1998).
Direct sample introduction methods in GC have generally employed
headspace sampling, in which gas samples at ambient or elevated temperatures are
drawn off from the headspace of a sample in a gas-tight syringe and injected directly
into the GC (Waltking and Goetz, 1983). Headspace techniques target very volatile
and abundant compounds, which can otherwise be lost during extraction, and these
techniques can be conducted at very low temperatures to prevent artifact formation
(Reineccius, 2002). Headspace techniques can also be beneficial due to speed of
operation; for example, Young and Hovis (1990) developed a rapid headspace
method to determine objectionable flavor defects in peanut samples at the rate of
four per hour.
Sample sensitivity in headspace analysis has been enhanced using dynamic
headspace or purging techniques (Waltking and Goetz, 1983). Purge and trap

60
techniques enable the efficient stripping of compound with a high boiling point, and
reflect the flavor of oil samples to a greater degree than static headspace techniques
(Ulberth and Roubicek, 1993). A neutral, nonreactive gas is used to purge the
sample, and the volatiles are trapped using porous polymer, charcoal, liquid
nitrogen, or sub-ambient cooling (Waltking and Goetz, 1983). In a study by
Vercellotti et al. (1992), a sparging device combined with FID and FPD allowed
simultaneous detection of 18 typical active flavor compounds and 14 sulfur-
containing compounds in peanuts. A polymer adsorption method involving nitrogen
flow over peanut samples in a jacketed glass column to a series of Tenax traps was
used by Buckholz, Jr. et al. (1980b) to collect and quantitate headspace volatiles
from freshly roasted peanuts. The results approximated the same ratio of volatiles
perceived by human senses in the peanut samples. Although this method reduced
sample handling and allowed both a larger sample size and shorter extraction time
(4 hours), the method also resulted in partial loss of some of highly volatile
compounds. This was corrected by using three traps in a series (Buckholz Jr. et al.,
1980b).
An alternative to purge and trap is SPME (solid phase microextraction), which
is a volatile extraction method using no organic solvents and relatively low
temperatures via substituted siloxane coatings attached to a plastic fiber. The fiber
partitions molecules in liquid and air matrices (Pawliszyn, 2000). Modified SPME
methods have been used to analyze volatiles in microwave processing. For
example, Roberts and Pollien (1998) designed a method to quantitate aroma

61
compounds eluting from microwave-heated spaghetti, which incorporated a trap and
condenser to capture volatiles.
Solvent extraction is a technique used to capture higher molecular weight
compounds than is possible with headspace analyses. Because water can also be
co-extracted with the aroma compounds, an additional distillation step is often
necessary. The high vacuum transfer (HVT) method is based on the concept of
transferring volatiles under vacuum between two vessels based on a large
temperature differential (Engel et al., 1999). A specialized version of this is the
solvent assisted flavor evaporation method, or SAFE. Engel et al. (1999) developed
the SAFE, which in connection with solvent extraction and a high vacuum pump
(5x10
-3
Pa) allows the isolation of volatiles from solvent extracts, food suspensions
such as fruit pulp, matrices with a high fat content, and aqueous foods such as milk
or beer. Engel et al. (1999) developed SAFE to avoid some of the drawbacks of
HVT, such as: condensation of aroma volatiles with higher boiling points inside
transfer tubing, limitation to only diethyl ether and dichloromethane extracts due to
their freezing point, blockage of samples high in fat in the stopcock of the sample
funnel, as well as the fragility of the system. Using SAFE, higher boiling point
alkanes as well as more of the polar odorants such as vanillin, sotolon and 3-
methylbutanoic acid were isolated when compared to HVT. Furthermore, the use of
SAFE resulted in higher yields from fatty matrices of 50% fat, compared to high
vacuum transfer (Engel et al., 1999). Solvent assisted flavor evaporation has been
used in several applications, including the analysis of volatile compounds in fresh
milk (Bendall, 2001).

62
Selective detectors can be used in GC analysis to enhance sensitivity. Sulfur
volatiles such as hydrogen sulfide, carbonyl sulfide, methanethiol, dimethylsulfide,
carbon disulfide, propanethiol, diethylsulfide, and dimethyl disulfide were identified in
peanuts by sulfur specific flame photometric detection (Vercellotti et al., 1992). This
is significant because many sulfur-containing compounds have low thresholds of
1ppb or less, enabling these compounds to have significant impact on flavor
perception even at low concentrations (Sanders et al., 1995).
Alternative techniques have also been employed besides traditional
chromatographic analysis. Pattee et al. (1990) surveyed the quality of the 1987
Georgia peanut crop using a headspace volatile concentration (HSVC) test, which
allows detection of high-temperature off-flavor in wagon lots being graded for
marketing. Off-flavor volatiles in peanuts have also been measured using the
organic volatiles meter -- OVM (Osborn et al., 2001). The OVM uses a tin-oxide
meter to measure total organic volatiles in the sample headspace by change in
sensor conductivity, with the main volatiles being ethanol, acetaldehyde and ethyl
acetate (Osborn et al., 2001). Alternatively, electronic nose technology has been
used to detect off-flavors in peanuts and could differentiate off-flavored, high-
temperature cured and regular ground, unroasted peanut seeds Osborn, et al.
(2001).
Current methods in the literature for analyzing peanut volatiles were surveyed
(Table 1):

63
Table 1: Peanut Volatile Analysis by Gas Chromatography
Method Sample
preparation Standard
Detector
T
initial
T
final
Reference
Static
Headspace
30 s grind in coffee mill, 1.5 g in
10 mL vial, block heated 30 min at
150 °C.
external
standard -
acetone in water
FID
a
120
°C
200 °C at 20 °C /
min heating rate,
T
f
for 3 min
Young and
Hovis, 1990
45-60 s grind in 1s pulses. Heated
145 °C, 20 min in headspace
sampler. 1mL headspace gas
injected.
external
standard -
pyrazines
MS
b
35
°C
200 °C at 10 °C /
min heating rate,
splitless
Warner et al.,
1996
1g oil sample heated 60 min at
60 °C, 1.25 mL HS
c
injected.
external
standard with
pentane,
hexanal,
2-heptanal
FID 38
°C
170 °C at 6 °C /
min heating rate,
1:15 split ratio
Ulberth and
Roubicek, 1992
1 min grind in coffee mill. Heated
120 °C for 30 min. 1 mL HS
injected.
N/A MS
50
°C
220 °C at 30 °C /
min heating rate
Burroni et al.,
1997
60 g ground in coffee grinder.
Heated at 140 °C, 30 min.
3-heptanone
(2.0mL of
0.1mg / mL)
FID 35
°C
300 °C at 15 °C /
min heating rate
Rausch, 2002
5 g ground for 8 s, heated at 60 °C
for 15 min.
standard
hexanal solution
in water added
to peanuts
N/A 65
°C
N/A Lee
et al.
, 2002
0.5 g protein. Heated at 150 °C for
12 min. 2 mL HS gas injected.
peaks confirmed
with standards
FID 120
°C
200 °C at 20 °C /
min heating rate
Basha et al.,
1998
SPME
5 g ground in food processor to 1-2
mm diameter. Heated in 60 °C
waterbath for 30 min. Fiber
exposed for 15 min.
external
standard -
pyrazines in
water
FID
60 °C, 3
min
80 °C, 2 °C / min
heating rate
Baker et al.,
2003
Purge and
Trap
1g ground peanut placed between
glass wool into inlet of GC.
Heated at 130 °C, and stripped
with nitrogen for 24 min.
peaks compared
to known
standards
FID
50 °C, 2
min
225 °C, 3 °C /
min heating rate,
then held at T
f
until 85 min
Lovegren et al.,
1982

64
Table 1 (continued)
Method Sample
preparation Standard
Detector
T
initial
T
final
Reference
Purge and
Trap
0.5 g peanut, volatiles purged at
127 °C.
N/A FID
N/A N/A
Crippen et al.,
1992
100g sample mixed with 300 mL
deionized water for 1 min.
Desorbed in trap at 200 °C.
2-propanol N/A
100
°C
200 °C at 2 °C
/ min heating
rate
Singleton and
Pattee, 1992
2.5 g sample, ground for 30s.
0.5 g sample placed into inlet of
GC, stripped with nitrogen at
130 °C for 24 min.
external
standards
FID 50
°C
225 °C at 3 °C
/ min heating
rate
Muego et al.,
1990
1.25 g peanut paste purged for
30 min. Heated at 60 °C with
nitrogen, then concentrated in
closed loop.
N/A FPD
d
N/A
N/A
Crippen et al.,
1992
DNPH
derivative
Ground with glycerol and water,
extracted with methylene
chloride, evaporated, made into
2,4-dinitrophenylhydrazone
derivatives, and carbonyls
regenerated.
butanal
internal
standard
FID 100
°C
200 °C, 6 °C /
min heating
rate
Mason et al.,
1967
a
FID = flame ionization detector
b
MS = mass spectrometer detector
c
HS = headspace
d
FPD = flame photometric detector
Gas Chromatography-Mass Spectrometry (GC-MS)
After separation by GC methods, identification of flavor compounds can be
accomplished using several methods. Tentative identifications can be made using
the retention index and flavor character as noted through GC-O. To further aid in

65
the identification of volatile compounds, gas chromatography-mass spectrometry
(GC-MS) has been frequently used in flavor chemistry. In GC-MS, after the sample
is volatilized and separated in the GC column, fragments of specific mass and
charge are created by either electron or chemical ionization techniques. These ions
are accelerated and directed to a mass analyzer, where they are separated based
on their mass/charge ratio. Each molecule will yield a characteristic fragmentation
pattern used to identify the molecule, because the concentration of different ions
formed depends on their stability and bond energies. Analysis using the MS can
yield structural information about the molecule, the molecular weight, as well as the
chemical formula, depending on the type of MS technique used (Ravindranath,
1989).
Correlation to Quality and Sensory
Flavor volatiles which have been identified in the peanut profile have been
linked to the positive characteristics as well as the off-flavors found in peanut
products. Lovegren et al. (1982) found a good quality peanut to have the following
volatile profile: free methanol (2 ppm), methanol produced + acetaldehyde (1.5
ppm), ethanol (1.3 ppm), acetone (0.25 ppm), N-methylpyrrole (0.25 ppm), hexanal
(0.10 ppm), nonanal (0.10 ppm), total volatiles profile (8 ppm). Although the color of
roasted peanuts can be predicted using GC profiles, the characteristic roasted
peanut flavor note remains unpredictable by instrumental analysis (Ory et al., 1992).
Poor peanut sensory quality has been correlated to a high concentration of
certain volatiles. The harsh, green notes of pentanal were shown to have a negative

66
correlation with sensory preference (Buckholz et al., 1980). Young and Hovis (1990)
related compounds identified by GC-MS to flavor profiles in roasted peanuts: N-
methyl pyrrole was correlated with a musty off-flavor; pentane, acetone, and
dimethyl sulfide with a musty aftertaste; 2-methylpropanol with fruity; 2-butanone
with degree of roast; pentanal with tongue or throat burn; and hexanal with beany
flavor. Likewise, Vercellotti et al. (1992) monitored sulfur compounds such as
hydrogen sulfide ("rotten eggs" off-flavor), methyl sulfide (burnt cabbage), dibutyl
sulfide (rotten onion), dimethyl sulfide (cooked cabbage), dimethyl trisulfide (burnt
cabbage or onion), allyl sulfide (garlic-like) using FPD detection. These compounds
are detectable at thresholds less than 1 ppb, and add positively to the overall
bouquet at very low concentrations.
Gas Chromatography – Olfactometry (GC-O)
Although traditional GC techniques will determine volatile compounds present
in a sample, only a small percentage of these will be odor-active. Furthermore, the
relative amount of a compound in a food does not necessarily equal its sensory
impact. This can be due to matrix effects through which the compounds are
suppressed, but also depends on human thresholds for the compound. As a result,
GC-Olfactometry techniques have been used to bridge the gap between analytical
chemistry and sensory analysis.
The use of GC-Olfactometry was explored in the 1970's (Acree et al., 1976).
The GC-O technique follows volatile extraction from the product and allows a portion
of the column effluent to reach a "sniffing" port, while the other portion is routed to

67
the detector. The compounds can then be identified by aroma descriptors in
combination with retention indices and identification by GC-MS. The main purpose of
GC-O is to order the aroma volatiles in a food matrix according to their potential
importance (Ferreira et al., 2002). Although it is possible that a flavor may result
from a single chemical compound, it is more commonly found that the perceived
flavor is a result of the interaction of several compounds. For example, Bendall
(2001) discovered differences in milk flavor caused by concentration differences in a
set of flavor compounds held in common by the two treatments, rather than selective
occurrence of compounds uniquely associated with a particular treatment.
The volatiles with the most impact on flavor have been identified using a
determination of threshold (CHARM or AEDA), measuring the frequency of citations
and by assessing intensity (OSME), and by cross modality matching (Ferreira et al.,
2002). Both Charm Analysis and AEDA are based on dilution of samples until an
odor is no longer detectable (Drake and Civille, 2002). The highest dilution at which
the odor is still detected is converted to a flavor dilution value (FD) in AEDA, or to a
Charm value. The charm algorithm gives an estimate of sensory intensity apart from
the complexities caused by psychological estimation of stimulus intensity (Acree et
al.
, 1984). However, these techniques require a large number of samples and
panelists, making the method time-consuming (Drake and Civille, 2002).
In AEDA (aroma extract dilution analysis), the flavor extract is sequentially
diluted at a certain rate (usually 2-, 3-, 5-, or 10-fold) and each dilution is analyzed
by GC-O by a number of judges. A dilution rate of 10 was shown to be the best by
simulations although lower dilution rates were advantageous if the compound had a

68
very narrow threshold distribution (Ferreira et al., 2002). Those compounds with a
higher odor activity value (OAV), which is the ratio of compound concentration to
threshold value, tend to be more influential in the aroma profile, although some
compounds can be suppressed by the food matrix (Grosch, 2001). The FD factor is
proportional to the OAV of the compound in air. However, although the FD factor
and OAV are relative to the concentration of the compound in the extract, they are
not measures for perceived odor intensity (Grosch, 2001).
OSME is another GC-O method which is commonly used. Instead of
dilutions, in OSME, three or more panelists evaluate not only the aroma character,
but also the aroma intensity over time. Another technique, which does not involve
dilutions, is posterior intensity technique. Two or more trained panelists note aroma
character as well as maximum perceived intensity (Drake and Civille, 2002).
Additional olfactometry techniques include the NIF/SNIF (nasal impact
frequency/surface of nasal impact frequency) method. This method is based on the
frequency of detection of a compound by untrained panelists. Only undiluted flavor
extract is evaluated, so that the method requires fewer GC injections (Drake and
Civille, 2002). However, this method does not differentiate between compounds
which are far above threshold levels from those barely detectable, but instead
assigns importance to a compound based on the proportion of panelists which can
detect it. Although all GC-O methods have their weaknesses, they perform the
same general function to select key odorants which may have the most impact on
the flavor profile (Noble, 2002).

69
GC-O Applications
High vacuum distillation (HVT), GC-O, and AEDA were used to evaluate the
volatile components of nonfat dry milks subjected to varying heat treatments
(Karagul-Yuceer et al., 2001). HVT, GC-O, and AEDA were also used to evaluate
the typical aroma components of British Farmhouse Cheddar cheese (Suriyaphan et
al.
, 2001). Aroma extract dilution analysis and GC-O were used to analyze volatiles
created during coffee roasting (Czerny and Grosch, 2000). In peanut research, GC-
O was used to generate "aromagrams" correlating odors and peak identities from
GC analysis of roasted peanuts (Vercellotti et al., 1992b). Likewise, Matsui et al.
(1998) used AEDA through GC-O on headspace samples to identify 2-ethyl-3,5-
dimethylpyrazine, 2,3-diethyl-5-methylpyrazine and 1-penten-3-one to have the
highest flavor dilution factors in commercially processed peanut oil.
After linking analytical data with sensory data through GC-Olfactometry
techniques, threshold analysis can be conducted to gauge human perception of
these compounds. To correlate with sensory, compounds found by chromatographic
analysis must exceed human thresholds. For example, the compounds
methylpropanal, methylbutanal, N-methylpyrrole, hexanal, hexanol, 2-pentylfuran,
vinylphenol, and decadienal were determined to have thresholds below the levels
found by FID in roasted peanuts, and therefore will have an effect on the flavor
(Vercellotti et al., 1992).
A final step might include the addition of specific compounds into a
deodorized model system, to analyze creation of the flavor note. A model is created
that matches the original sample aroma, and this can be the starting material for

70
omission experiments to further define the compounds which contribute to the flavor
profile (Grosch, 2001). There are many reasons why a model may not accurately
represent the sample, including the omission of odorants which are only detectable
in the food by GC-O but not by other GC detectors, or incorrect quantitative data
(Grosch, 2001).
In recent years, the shift of emphasis in flavor chemistry has been to the
correlation of chemical structures to sensory characteristics, and to the study of the
biological activities of the compounds (Teranishi, 1998). As a result, if the chemical
causes of positive flavors as well as off-flavors can be identified, they can also
potentially be controlled.
Sensory Evaluation
The perception of peanut flavors involves the gustatory system to detect basic
tastes of sweet, salty, sour, and bitter stimuli which react with taste receptors in the
taste buds; the olfactory system to perceive volatiles which access receptors in the
roof of the nasal cavity; and the trigeminal system, which responds to stimuli of heat,
astringency, acridness, and pungency (Sanders et al., 1993). While the range of
concentrations perceived in tasting is typically less than 10
4
, volatiles can be
detected by the olfactory system in a range of concentration of 10
12
(Sanders et al.,
1993).
The first sensory method accepted for quality evaluation of peanuts was the
Critical Laboratory Evaluation of Roasted Peanuts (CLER) method (Holaday, 1971).
In the CLER method, 20 halves of peanuts were selected from a 300g sample, and

71
each half was allocated into one of four categories: badly off-flavor, low level off-
flavor, low peanut flavor, or good peanut flavor. The CLER score was found by
calculating the number of peanuts in each category (St. Angelo, 1996). This method
has been criticized for using a single continuum for quality and hedonic responses
(Sanders et al., 1995). As a result, the CLER score only indirectly reflects the
roasted flavor of a sample as it mixed hedonic ratings with roast level (Johnsen et
al.
, 1988).
A lexicon for roasted peanut flavor was developed by Oupadissakoon and
Young (1984). A lexicon is a set of words used to describe the flavor of a product
(Drake and Civille, 2003). Lexicons are used to provide a means of communication
within an industry. Researchers use the lexicon to associate flavors with treatment
variables, growers and processors use the lexicon to communicate quality issues,
and manufacturers can use the lexicon to communicate with suppliers and the
consumer (Johnsen et al., 1988). Lexicons can be used to correlate instrumental
data, product development, shelf life, quality control and basic research. A well-
developed lexicon will be discriminatory, representative of a wide range of samples,
defined and unambiguous, composed of nonredundant terms, can be related to
instrumental data and consumer perceptions, and contains references for all terms
(Drake and Civille, 2003).
It was suggested that the lexicon by Oupadissakoon and Young (1984)
lacked terms to separate the different degrees of roast in peanuts often present in a
lot (Johnsen et al., 1988). In 1985, Syarief et al. also developed a lexicon for
roasted peanuts as well as peanut butter, using "oxidized", "mold", "earthy", and

72
"petroleum'" as terminology for off-flavors. A lexicon was later developed to address
deficiencies in earlier attempts such as lack of differentiation in oxidized off-flavors
and lack of sweet/caramel descriptors (Johnsen et al., 1988).
The lexicon of peanut flavor descriptors that was developed by Johnsen et al.
(1988) can be found in Table 2. A ten point scale was established to rate intensity of
flavor, using flavor intensities of commercially available products. For example, on a
scale of 0-10, the sodium carbonate in saltine crackers was rated an intensity of 2,
the apple flavor in Motts apple juice was an intensity of 4, orange in Minute Maid
orange juice was an intensity of 6, grape in Welch's grape juice was an intensity of 8,
and cinnamon in Big Red gum was an intensity of 10 (Johnsen et al., 1988). The
terminology has been modified and improved over the years, including the addition
of a "fruity" descriptor associated with high temperature curing (Sanders et al.,
1989).
Table 2: Lexicon of Peanut Flavor Descriptors (Johnsen et al., 1988).
Aromatics
Roasted Peanutty
The aromatic associated with medium-roast peanuts
(about 3-4 on USDA color chips) and having fragrant
character such as methyl pyrazine
Raw Bean / Peanutty
The aromatic associated with light-roast peanuts
(about 1-2 on USDA color chips) and having legume-
like character (specify bean or pea if possible)
Dark Roasted Peanut
The aromatic associated with dark roasted peanuts (4+
on USDA color chips) and having very browned or
toasted character
Sweet
Aromatic
The aromatics associated with sweet material such as
caramel, vanilla, molasses, fruit (specify type)

73
Table 2 (continued)
Woody/Hulls/Skins
The aromatics associated with base peanut character
(absence of fragrant top notes) and related to dry wood,
peanut hulls, and skins
Cardboard
The aromatic associated with somewhat oxidized fats and
oils and reminiscent of cardboard
Painty
The aromatic associated with linseed oil, or oil based paint
Burnt
The aromatic associated with very dark roast, burnt
starches, and carbohydrates (burnt toast or espresso
coffee)
Green
The aromatic associated with uncooked vegetables/grass
twigs, cis-3-hexanal
Earthy
The
aromatic
associated with wet dirt and mulch
Grainy
The aromatic associated with raw grain (bran, starch, corn,
sorghum)
Fishy
The aromatic associated with trimethylamine, cod liver oil,
or old fish
Chemical/Plastic
The
aromatic
associated with plastic and burnt plastics
Skunky/Mercaptan
The aromatic associated with sulfur compounds, such as
mercaptan, which exhibit skunk-like character
Tastes
Sweet
The taste on the tongue associated with sugars
Sour
The taste on the tongue associated with acids
Salty
The taste on the tongue associated with sodium ions
Bitter
The taste on the tongue associated with bitter agents such
as caffeine or quinine
Chemical
Feeling
Factors
Astringent
The chemical feeling factor on the tongue, described as
puckering/dry and associated with tannins or alum
Metallic
The chemical feeling factor on the tongue described as flat,
metallic and associated with iron and copper

74
Descriptive Sensory Analysis
Evaluating flavor by descriptive analysis separates the overall flavor character
of a product into its components. These components are precisely defined and
referenced during training of the panelists (Lawless and Heymann, 1999). The
panelists evaluate the impact of each flavor component using a defined scale, on
which they have been trained to distinguish the range of intensities (Lawless and
Heymann, 1999).
To develop the descriptors for the food product, a trained panel leader
presents a range of samples that includes typical flavors and off-flavored samples.
Discussion among the panelists is guided to develop descriptive terms. Definitions
and references are defined for all terms, and subsequent analyses are used to
eliminate redundant terms and to further develop the final list which will be used for
sample analysis (Drake and Civille, 2003).
The first trained descriptive analysis panel for roasted peanut flavor was
established at North Carolina’s Tate University in 1975. The panel used 14
character notes and three categories including aroma, flavor-by-mouth, and
aftertaste (Sanders et al., 1995). However, the development of descriptive sensory
analysis began much earlier. The Flavor Profile Method was developed in the
1950's by Arthur D. Little. This method involved a small panel of highly trained
experts which evaluated samples as a group using a four point scale. Although this
method was very sensitive, the technical language used was difficult at times to
interpret. In the 1960's, General Foods developed the Texture Profile Method, which
involved at least ten panelists and a scale anchored with specific food references.

75
Givaudan-Roure developed Quantitative Flavour Profiling in the 1990's. The method
is distinguished by its extensive use of references, making the results easier to
compare between labs and over time. A panel of experts is utilized to characterize
flavors, using nonambiguous technical language (Murray et al., 2001).
One of the most common techniques in descriptive sensory analysis used
today is QDA, or Quantitative Descriptive Analysis. QDA involves a panel of 10-12
people, and a panel leader which is not actively involved in the evaluation. In QDA,
the subject marks a line scale at the perceived intensity. The line scale is anchored
on each end but has no interval numbers or labels, with the possible exception of the
reference. It is not essential that each judge uses the same segment of the scale,
but rather that performance is consistent (Stone et al., 1974). Although the data
must be measured by hand, this type of scale may eliminate central tendency in the
subjects. QDA is usually linked to product-specific scaling, in which scoring is
relative to other samples. Although the panelist training does not need to be as
extensive as in other methods of descriptive analysis, the product-specific scaling
makes comparisons with other panels difficult. The key elements of the QDA
technique include: formal statistical testing for reliability, development of a language
by the group under a panel administrator’s leadership, subject selection based on
performance, repeated judgements to monitor panel performance, relatively short
subject training time, data collection using coded samples, and the use of analysis of
variance and principle component analysis to evaluate data (Stone et al., 1974).
The Spectrum technique, developed by Gail Civille in 1970s, is also
commonly used today. The Spectrum technique is based on a complete and

76
detailed description of the sensory characteristics of a sample both in qualitative and
quantitative aspects, by a panel consisting of 12-15 members. The trained panel
uses a 15-point category scale, which is marked at regular intervals with numbers or
words. More extensive training is needed to train the panel in the use of a category
scale, but it is a universal scaling technique which can be easily applied to other
products. This method is also differentiated by its extensive use of references
(Drake and Civille, 2003).
A final technique that is also used is Free Choice Profiling. In this method,
consumers generate their own terms to describe samples. Although it may be
harder to interpret data as a result, the consumers may find novel ways to
differentiate products, and the data will also reflect consumers' perception of the
product (Murray et al., 2001).
Project Objectives
Using these techniques of descriptive sensory analysis and chemical
techniques such as GC-O and GC-MS, the flavor profile of peanuts can be
characterized. Specifically, the off-flavors which may form during high temperature
microwave blanching can be linked to their causative chemical compounds. The
objectives of this study were to characterize the processing parameters best suited
for the microwave blanching of peanuts, to identify the conditions under which the
off-flavor occurs, and to analyze this off-flavor using descriptive sensory analysis
and chemical analysis. Through this project, the causes of the off-flavor formed

77
during high temperature microwave blanching could be determined and thereby
possibly prevented, allowing the adoption of this alternative blanching process.

78
Abbreviations
AEDA
Aroma extract dilution analysis
CLER
Critical laboratory evaluation of roasted peanuts
DNPH
2, 4-dinitrophenylhydrazine
DSA
Dark soured aromatic
FD
Flavor dilution factor
FID
Flame ionization detector
FPD
Flame photometric detector
g Gram
GLC
Gas
liquid
chromatography
GC
Gas
chromatography
GC-MS
Gas chromatography-mass spectrometry
GC-O
Gas chromatography-olfactometry
HSVC
Headspace volatile concentration test
HVT
High vacuum transfer
IR Infrared
spectroscopy
L Liter
m Meter
min
Minute
MS
Mass
spectrometry
NIF
Nasal impact frequency
OSI
Oxidative stability index

79
OVM
Organic volatiles meter
Pa
Pascal
ppb
Parts per billion
ppm
Parts
per
million
PV
Peroxide value
QDA
Quantitative descriptive analysis
s Second
SAFE
Solvent assisted flavor evaporation
SNIF
Surface of nasal impact frequency
SPME
Solid phase microextraction
TBA
Thiobarbituric acid analysis
US
United
States
USDA
United States department of agriculture
UV
Ultraviolet
spectroscopy
w.b.
Wet
basis

80
Symbols
ε
Relative complex permittivity
ε'
Relative real permittivity (dielectric constant)
ε"
Relative dielectric loss factor
c
dry
Specific heat of dry seeds (1.880 kJ / (kg °C))
c
w
Specific heat of water (4.187 kJ/(kg °C))
γ
dry
Bulk density of dry seeds (kg/m
3
)
h
lg
Heat of vaporization of water (2.418 x 10⁴ kJ/kg at 35°C)
j Imaginary
unit
mc
f
Final seed moisture content (w.b.)
mc
i
Initial seed moisture content (w.b.)
Q
Energy per unit volume (kJ/m
3
)
T
i
Initial temperature (°C)
T
f
Final temperature (°C)

81
References
Abegaz EG, Kerr WL, Koehler PE. 2004. The role of moisture in flavor changes
of model peanut confections during storage. Lebensmittel Wissenschaft und
Technologie 37(2): 215-225.
Acree TE, Barnard J, Cunningham DG. 1984. A procedure for the sensory
analysis of gas chromatographic effluents. Food Chemistry 14: 273-286.
Acree TE, Butts RM, Nelson RR, Lee CY. 1976. Sniffer to determine the odor of
gas chromatographic effluents. Analytical Chemistry 48(12): 1821-1822.
Adelsberg GD, Sanders TH. 1997. Effect of peanut blanching protocols on bed
and seed temperatures, seed moisture, and blanchability. Peanut Science 24:
42-46.
Ahmed EM, Young CT. 1982. Composition, quality, and flavor of peanuts. In:
Pattee HE, Young CT, editors. Peanut Science and Technology. Yoakum,
Texas: American Peanut Research and Education Society. p 655-688.
Baker GL, Cornell JA, Gorbet DW, O'Keefe SF, Sims CA, Talcott ST. 2003.
Determination of pyrazine and flavor variations in peanut genotypes during
roasting. Journal of Food Science 68(1): 394-400.
Basha SM, Ying M, Vives MR, Young CT, Boyd LC. 1998. Fractionation and
characterization of a protein fraction producing off-flavor volatiles in peanut
seed. Journal of Agricultural Food Chemistry 46: 2130-2135.
Basha SM, Young CT. 1996. Protein fraction producing off-flavor headspace
volatiles in peanut seed. Journal of Agricultural Food Chemistry 44: 3070-
3074.
Bendall JG. 2001. Aroma compounds of fresh milk from New Zealand cows fed
different diets. Journal of Agricultural and Food Chemistry 49: 4825-4832.
Boldor D, Sanders TH, Simunovic J. 2004. Dielectric properties of in-shell and
shelled peanuts at microwave frequencies. Transactions of the ASAE 47(4):
1159-1169.
Boldor D, Sanders TH, Swartzel KR, Farkas BE. 2005. A model for temperature
and moisture distribution during continuous microwave drying. Journal of Food
Process Engineering 28(1): 68-87.
Brown ML, Wadsworth JI, Dupuy HP. 1977. Correlation of volatile components
of raw peanuts with flavor score. Peanut Science 4: 54-56.

82
Buckholz LL Jr., Daun H, Stier E, Trout R. 1980. Influence of roasting time on
sensory attributes of fresh roasted peanuts. Journal of Food Science 45: 547-
554.
Buckholz LL Jr., Withycombe DA, Daun H. 1980b. Application and
characteristics of polymer adsorption method used to analyze flavor volatiles
from peanuts. Journal of Agricultural and Food Chemistry 28: 760-765.
Burroni LV, Grosso NR, Guzman CA. 1997. Principal volatile components of raw
roasted, and fried Argentinean peanut flavors. Journal of Agricultural Food
Chemistry 45: 3190-3192.
Cammarn SR, Lange TJ, Beckett GD. 1990. Continuous fluidized bed roasting.
Chemical Engineering Progress 86: 40-46.
Chiou RY-Y, Chang Y-S, Tsai T-T, Ho S. 1991. Variation of flavor-related
characteristics of peanuts during roasting as affected by initial moisture
contents. Journal of Agricultural and Food Chemistry 39: 1155-1158.
Chung TY, Eiserich JP, Shibamoto T. 1993. Volatile compounds identified in
headspace samples of peanut oil heated under temperatures ranging from 50
to 200 °C. Journal of Agricultural and Food Chemistry 41: 1467-1470.
Crippen KL, Vercellotti JR, Lovegren NV, Sanders TH. 1992. Defining roasted
peanut flavor quality. Part 2. Correlation of GC volatiles and sensory flavor
attributes. In: Charalambous G, editor. Food Science and Human Nutrition.
New York: Elsevier Science Publishers. p 211-227.
Cruickshank AW, Tonks JW, Kelly AK. 2003. Blanchability of peanut (Arachis
hypogaea L.) kernels: early generation selection and genotype stability over
three environments. Australian Journal of Agricultural Research 54(9): 885-
888.
Czerny M, Grosch W. 2000. Potent odorants of raw Arabica coffee: their
changes during roasting. Journal of Agricultural and Food Chemistry 48: 868-
872.
Delwiche SR, Shupe WL, Pearson JL, Sanders TH, Wilson DM. 1986.
Microwave vacuum drying effect on peanut quality. Peanut Science 13: 21-27.
DiCesare LF, Riva M, Schiraldi A. 1992. Improved retention of mushroom flavor
in microwave-hot air drying. In: Charalambous G, editor. Developments in
Food Science v. 29: Food Science and Human Nutrition. Amsterdam, The
Netherlands: Elsevier Science Publishers. p 249-256.
Didzbalis J, Ritter KA, Trail AC, Plog FJ. 2004. Identification of fruity/fermented

83
odorants in high temperature cured roasted peanuts. Journal of Agricultural
and Food Chemistry 52: 4828-4833.
Dimick PS. 1994. Peanut flavor-fade research report. The Manufacturing
Confectioner 74(1): 45-48.
Drake MA, Civille GV. 2003. Flavor lexicons. Comprehensive Reviews in Food
Science and Food Safety 1: 33-40.
Engel W, Bahr W, Schieberle P. 1999. Solvent assisted flavour evaporation - a
new and versatile technique for the careful and direct isolation of aroma
compounds from complex food matrices. European Food Research and
Technology 209: 237-241.
Engelder DS, Buffler CR. 1991. Measuring dielectric properties of food products
at microwave frequencies. Microwave World 12(2): 2-11.
Ferreira V, Petka J, Aznar M. 2002. Aroma extract dilution analysis: precision
and optimal experimental design. Journal of Agricultural and Food Chemistry
50: 1508-1514.
Giese J. 1992. Advances in microwave food processing. Food Technology
46(9): 118-123.
Grosch W. 2001. Evaluation of the key odorants of foods by dilution
experiments, aroma models and omission. Chemical Senses 26(5): 533-45.
Ho C-T, Lee M-H, Chang SS. 1981. Isolation and identification of volatile
compounds from roasted peanuts. Journal of Food Science 47: 127-133.
Hoffpauir CL. 1953. Peanut composition: relation to processing and utilization.
Agricultural and Food Chemistry 1(10): 668-671.
Holaday CE. 1971. Report of the peanut quality committee. Journal of
American Peanut Reseach and Education Association 3: 238-241.
Jambunathan R, Sridhar R, Raghunath K, Dwivedi SL, Nigam SN. 1993. Oil
quality characteristics and headspace volatiles of newly released groundnut
(Arachis hypogaea L) cultivars. Journal of the Science of Food and Agriculture
61: 23-30.
Johnsen PB, Civille GV, Vercellotti JR, Sanders TH, Dus CA. 1988.
Development of a lexicon for the description of peanut flavor. Journal of
Sensory Studies 3: 9-17.
Johnson BR, Waller GR, Burlingame AL. 1971. Volatile components of roasted

84
peanuts: basic fraction. Journal of Agricultural and Food Chemistry 19(5):
1020-1024.
Johnson BR, Waller GR, Foltz RL. 1971b. Volatile components of roasted
peanuts: neutral fraction. Journal of Agricultural and Food Chemistry 19(5):
1025-1027.
Karagul-Yuceer Y, Drake M, Cadwallader KR. 2001. Aroma-active components
of nonfat dry milk. Journal of Agricultural and Food Chemistry 49: 2948-2953.
Katz TA. 2002. The effect of microwave energy on roast quality of microwave
blanched peanuts. Master's Thesis, North Carolina State University, Raleigh,
NC.
Koehler PE, Odell GV. 1970. Factors affecting the formation of pyrazine
compounds in sugar-amine reactions. Journal of Agricultural and Food
Chemistry 18(5): 895-898.
Lawless HT, Heymann H. 1999. Sensory evaluation of food: principles and
practices. New York: Chapman & Hall. 827p.
Lee MH. 1980. Studies on roasted peanuts and peanut butter flavor.
Dissertation Abstracts International B 40(12): 5598.
Lee S-Y, Trezza TA, Guinard J-X, Krochta JM. 2002. Whey-protein-coated
peanuts assessed by sensory evaluation and static headspace gas
chromatography. Journal of Food Science 67(3): 1212-1218.
Leunissen M, Davidson VJ, Kakuda Y. 1996. Analysis of volatile flavor
compounds in roasted peanuts using supercritical fluid extraction and gas
chromatography-mass spectrometry. Journal of Agricultural Food Chemistry
44: 2694-2699.
Lovegren NV, Vinnett CH, St. Angelo AJ. 1982. Gas chromatographic profile of
good quality raw peanuts. Peanut Science 9: 93-96.
Mason ME, Johnson B. 1966. Flavor components of roasted peanuts: some low
molecular weight pyrazines and a pyrrole. Journal of Agricultural and Food
Chemistry 14(5): 454-460.
Mason ME, Johnson B, Hamming MC. 1967. Volatile components of roasted
peanuts: the major monocarbonyls and some noncarbonyl components.
Journal of Agricultural Food Chemistry 15(1): 66-73.
Mason ME, Newell JA, Johnson BR, Koehler PE, Waller GR. 1969. Nonvolatile
flavor components of peanuts. Journal of Agricultural and Food Chemistry

85
17(4): 728-732.
Mason ME, Waller GR. 1964. Isolation and localization of the precursors of
roasted peanut flavor. Agricultural and food chemistry 12(3): 274-278.
Matsui T, Guth H, Grosch W. 1998. A comparative study of potent odorants in
peanut, hazelnut, and pumpkin seed oils on the basis of aroma extract dilution
analysis (AEDA) and gas chromatography-olfactometry of headspace samples
(GCOH). Fett/Lipid 100(2): 51-56.
McNeill KL, Sanders TH. 1998. Maturity effects on sensory and storage quality
of roasted Virgnia-type peanuts. Journal of Food Science 63(2): 366-369.
McWatters KH, Cherry JP. 1982. Potential food uses of peanut seed proteins.
In: Pattee HE, Young CT, editors. Peanut Science and Technology. Yoakum,
Texas: American Peanut Research and Education Society. p 689-736.
Megahed MG. 2001. Microwave roasting of peanuts: effects on oil
characteristics and composition. Nahrung/Food 45: 255-257.
Mudgett RE. 1986. Scientific Status Summary: Microwave Food Processing.
Food Technology 43:117-126.
Murray JM, Delahunty CM, Baxter IA. 2001. Descriptive sensory analysis: past,
present, and future. Food Research International 34: 461-471.
Newell JA, Mason ME, Matlock RS. 1967. Precursors of typical and atypical -
roasted peanut flavor. Journal of Agricultural and Food Chemistry (5): 767-
772.
Noble AC. 2002. Sensory methods of flavour analysis. In: Taylor AJ, editor.
Food Flavor Technology. Sheffield, England: Sheffield Academic Press. p
252-271.
Ory RL, Crippen KL, Lovegren NV. 1992. Off-flavors in peanuts and peanut
products. In: Charalambous G, editor. Developments in Food Science v. 29:
Off-Flavors in Foods and Beverages. Amsterdam, The Netherlands: Elsevier
Science Publishers. p 57-75.
Osborn GS, Lacey RE, Singleton JA. 2001. A method to detect peanut off-
flavors using an electronic nose. Transactions of the ASAE 44(4): 929-938.
Osborn GS, Young JH, Singleton JA. 1996. Measuring the kinetics of
acetaldehyde, ethanol, and ethyl acetate within peanut kernels during high
temperature drying. Transactions of the ASAE 39(3): 1039-1045.

86
Pattee HE, Beasley EO, Singleton JA. 1965. Isolation and identification of
volatile components from high-temperature-cured off-flavor peanuts. Journal of
Food Science 30: 388-392.
Pattee HE, Rogister EW, Giesbrecht FG. 1989. Interrelationships between
headspace volatile concentration, selected seed-size categories and flavor in
large-seeded Virginia-type peanuts. Peanut Science 16: 38-42.
Pattee HE, Singleton JA. 1971. Observations concerning blanching and storage
effects on the volatile profile and flavor of peanuts. Journal of the American
Peanut Research and Education Association 3: 189-194.
Pattee HE, Singleton JA, Cobb WY. 1969. Volatile components of raw peanuts:
analysis by gas liquid chromatography and mass spectrometry. Journal of
Food Science 34(6): 625-7.
Pattee HE, Yokoyama WH, Collins MF, Giesbrecht FG. 1990. Interrelationships
between headspace volatile concentration, marketing grades, and flavor in
runner-type peanuts. Journal of Agricultural Food Chemistry 38: 1055-1060.
Pattee HE, Young CT, Pearson JL, Singleton JA, Giesbrecht FG. 1982. Storage
and moisture effects on peanut composition and roasted flavor. Peanut
Science 9(2): 98-101.
Paulsen MR, Brusewitz GH. 1976. Coefficient of cubical thermal expansion for
Spanish peanut kernels and skins. Transactions of the ASAE 19(3): 592-595,
600.
Ramesh MN, Wolf W, Tevini D, Bognar A. 2002. Microwave blanching of
vegetables. Journal of Food Science 67(1): 390-398.
Rausch TD, Sanders TH, Hendrix KW, Drozd JM. 2005. Effect of microwave
energy on blanchability and shelf life of peanuts. Journal of Agricultural and
Food Chemistry, submitted.
Ravindranath B. 1989. Principles and practice of chromatography. New York:
Halstead Press. 502p.
Reineccius G. 1991. Off-flavors in foods. Critical Reviews in Food Science and
Nutrition 29(6): 381-402.
Reineccius, G. 2002. Instrumental methods of analysis. In: Taylor AJ, editor.
Food Flavor Technology. Sheffield, England: Sheffield Academic Press. p
210-251.
Roberts DD, Pollien P. 1998. Relationship between aroma compounds'

87
partitioning constants and release during microwave heating. In: Mussinan CJ,
Morello MJ, editors. Flavor Analysis: Developments in Isolation and
Characterization. Washington DC: American Chemical Society. p 61-68
Ryynanen S. 1995. The electromagnetic properties of food materials: a review
of the basic principles. Journal of Food Engineering 26: 400-429.
St. Angelo AJ. 1996. Lipid oxidation in foods. Critical Reviews in Food Science
and Nutrition 36(3): 175-224.
St. Angelo AJ, Kuck JC, Hensarling TP, Ory RL. 1977. Effects of water and spin
blanching on oxidative stability of peanuts. Journal of Food Processing and
Preservation 1: 249-260.
St. Angelo AJ, Lovegren NV, Vinnett CH. 1984. Volatile "fingerprint" profile of
raw peanuts as an indicator of quality. Peanut Science 11: 40-42.
Sanders TH. 1989. Maturity distribution in commercially sized Florunner
peanuts. Peanut Science 16: 91-95.
Sanders TH, Adelsberg GD, Hendrix KW, McMichael Jr. RW. 1999. Effect of
blanching on peanut shelf-life. Peanut Science 26: 8-13.
Sanders TH, Blankenship PD, Vercellotti JR, Crippen KL. 1990. Interaction of
curing temperature and inherent maturity distributions on descriptive flavor of
commercial grade sizes of Florunner peanuts. Peanut Science 17: 85-89.
Sanders TH, Pattee HE, Vercellotti JR, Bett KL. 1995. Advances in peanut flavor
quality. In: Pattee HE, Stalker HT, editors. Advances in Peanut Science.
Stilwater, OK: American Peanut Research and Education Society, Inc. p 528-
553.
Sanders TH, Vercellotti JR, Blankenship PD, Crippen KL, Civille GV. 1989a.
Interaction of maturity and curing temperature on descriptive flavor of peanuts.
Journal of Food Science 54(4): 1066-1069.
Sanders TH, Vercellotti JR, Crippen KL, Civille GV. 1989b. Effect of maturity on
roast color and descriptive flavor of peanuts. Journal of Food Science 54(2):
475-477.
Sanders TH, Vercellotti JR, Crippen KL, Hinsch RT, Rasmussen GK, Edwards
JH. 1992. Quality factors in exported peanuts from Argentina, China, and the
United States. JAOCS 69(10): 1032-1035.
Sanders TH, Vercellotti JR, Grimm DT. 1993. Shelf life of peanuts and peanut
products. In: Charalambous G, editor. Shelf Life Studies of Foods and

88
Beverages. Amsterdam, The Netherlands: Elsevier Science Publishers. p 289-
309.
Sevirini C, Baiano A, Pilli T. 2003. Microwave blanching of cubed potatoes.
Journal of Food Processing and Preservation 27(6): 475-491.
Singleton JA, Pattee HE. 1991. Peanut moisture/size, relation to freeze damage
and effect of drying temperature on volatiles. Journal of Food Science 56(2):
579-581.
Singleton JA, Pattee HE. 1992. Maturity and storage affect freeze damage in
peanuts. Journal of Food Science 57(6): 1382-1384.
Singleton JA, Pattee HE. 1997. Effects of cold and heat stress on the chemistry
and cell structure of peanut seeds. Peanut Science 24: 32-37.
Smith JS Jr, Blankenship PD, McIntosh FP. 1995. Advances in peanut handling,
shelling and storage from farmer stock to processing. In: Pattee HE, Stalker
HT, editors. Advances in Peanut Science. Stilwater, OK: American Peanut
Research and Education Society, Inc. p 500-527.
Stone H, Sidel J, Oliver S, Woolsey A, Singleton RC. 1974. Sensory evaluation
by quantitative descriptive analysis. Food Technology 28(11): 24, 26, 28-29,
32, 34.
Suriyaphan O, Drake MA, Chen XQ, Cadwallader KR. 2001. Characteristic
aroma components of British Farmhouse Cheddar cheese. Journal of
Agricultural and Food Chemistry 49: 1382-1387.
Teranishi R. 1998. Challenges in flavor chemistry: an overview. In: Mussinan
CJ, Morello MJ, editors. Flavor Analysis: Developments in Isolation and
Characterization. Washington DC: American Chemical Society. p 61-68.
Trabelsi S, Nelson SO. 2004. Microwave dielectric properties of shelled and
unshelled peanuts. Transactions of the ASAE 47(4): 1215-1222.
Trabelsi S, Nelson SO. 2006. Nondestructive sensing of bulk density and
moisture content in shelled peanuts from microwave permittivity
measurements. Food Control 17(4): 304-311.
Troeger JM. 1982. Peanut drying energy consumption - a simulation analysis.
Peanut Science 9: 40-44.
Ulberth F, Roubicek D. 1993. Evaluation of a static headspace gas
chromatographic method for the determination of lipid peroxides. Food
Chemistry 46: 137-141.

89
Vercellotti JR, Crippen KL, Lovegren NV, Sanders TH. 1992. Defining roasted
peanut flavor quality. Part 1. Correlation of GC volatiles with roast color as an
estimate of quality. In: Charalambous G, editor. Developments in Food
Science v. 29: Food Science and Human Nutrition, Amsterdam, The
Netherlands: Elsevier Science Publishers. p 183-206.
Vercellotti JR, Mills OE, Bett KL, Sullen DL. 1992b. Gas chromatographic
analyses of lipid oxidation volatiles in foods. In: St. Angelo AJ, editor. Lipid
Oxidation in Food. Washington, DC: American Chemcial Society. p 232-265.
Vercellotti JR, Munchausen LL, Sanders TH, Garegg PJ, Seffers P. 1994.
Confirmation of sugars and reductones in complex peanut flavor precursor
extracts by ion chromatography and methylation analysis. Food Chemistry 50:
221-230.
Waltking AE, Goetz AG. 1983. Instrumental determination of flavor stability of
fatty foods and its correlation with sensory flavor responses. CRC Critical
Reviews in Food Science and Nutrition 19(2): 99-132.
Warner KJH, Dimick PS, Ziegler GR, Mumma RO, Hollender R. 1996. "Flavor-
fade" and off-flavors in ground roasted peanuts as related to selected pyrazines
and aldehydes. Journal of Food Science 61(2): 469-472.
Whitaker TB. 1997. Efficiency of the blanching and electronic color sorting
process for reducing aflatoxin in raw shelled peanuts. Peanut Science 24(1):
62-66.
Whitaker TB, Dickens JW, Bowen HD. 1974. Effect of curing on the internal
oxygen concentration of peanuts. Transactions of the ASAE 17(3): 567-569.
Yoshida H, Hirakawa Y, Tomiyama Y, Nagamizu T, Mizushina Y. 2005. Fatty
acid distributions of triacylglycerols and phospholipids in peanut seeds (Arachis
hypogaea L.) following microwave treatment. Journal of Food Composition and
Analysis 18: 3-14.
Young CT. 1973. Influence of drying temperature at harvest on major volatiles
released during roasting of peanuts. Journal of Food Science 38: 123-125.
Young CT, Hovis AR. 1990. A method for the rapid analysis of headspace
volatiles of raw and roasted peanuts. Journal of Food Science 55(1): 279-280.
Young JH, Person NK, Donald JO, Mayfield WD. 1982. Harvesting, curing, and
energy utilization. In: Pattee HE, Young CT, editors. Peanut Science and
Technology. Yoakum, Texas: American Peanut Research and Education
Society. p 458-485.

90
CHAPTER 3:
EFFECT OF PROCESSING PARAMETERS ON THE TEMPERATURE AND
MOISTURE CONTENT OF MICROWAVE-BLANCHED PEANUTS
A.V. Schirack
1
, T.H. Sanders
2
, K.P. Sandeep
1*
1
Department of Food Science
North Carolina State University, Raleigh, North Carolina 27695-7624
2
USDA-ARS, Market Quality and Handling Research Unit
North Carolina State University, Raleigh, North Carolina 27695-7624
Submitted for publication in Journal of Food Process Engineering.
M.E. Castell-Perez, and R. Moreira, eds. Blackwell Publishing, Malden, MA.

91
ABSTRACT
Peanut blanching consists of heat application followed by abrasive removal of
the seed coat.
The use of a continuous microwave system for the blanching of
peanuts has been proposed as a means of reducing processing time and energy
costs compared to the traditional hot air, multi-zone oven. The purpose of this
research was to characterize effective processing parameters for microwave
blanching. The factors examined were the time of exposure in the microwave, use
of increased airflow in the microwave applicator during processing, and the initial
moisture content of the peanuts. Processing treatments were differentiated by
energy absorbed during processing, average and maximum internal temperatures,
loss in moisture content, and blanchability. High blanchability resulted from higher
process temperatures and greater loss in moisture content. Treatments exceeding
110 °C resulting in a final moisture content of 5.5 % or below yielded blanchability
percentages greater than the 85 % industry standard. The time required to generate
sufficient heat to dry peanuts for acceptable blanchability is greatly reduced by the
use of microwave technology.
INTRODUCTION
Peanut blanching consists of heat application followed by abrasive removal of
the seed coat. Removal of the seed coat prepares peanuts for further processing
into specific products, and the heating step reduces enzyme activity and moisture

92
content, which are factors impacting subsequent quality (Adelsberg and Sanders,
1997). Blanching allows for electronic color-sorter removal of damaged or discolored
seed, which are associated with aflatoxin contamination (Sanders et al., 1999).
Several methods are used for blanching: dry-blanching, spin-blanching,
water-blanching, alkali-blanching, and hydrogen peroxide blanching. In general, the
most common method in industrial processing is dry-blanching. In this process,
peanuts are placed on conveyor belts and moved through large ovens in which the
direction of airflow is alternated in successive zones (Adelsberg and Sanders, 1997).
The peanuts are heated in sequential zones from 30 °C to 90 °C, with a total normal
processing time of approximately 45 minutes. During this time, moisture is removed
from the peanuts, the seed coat is loosened, and after cooling, the seed coats are
mechanically removed (Sanders et al., 1999). Paulsen and Brusewitz (1976)
suggested that the mechanism of blanching is due to differences in thermal
expansion and subsequent contraction of the seed and seed coat, resulting in a
loosening of the seed coat.
Adelsberg and Sanders (1997) studied the effects of varying parameters on
peanut temperature distributions and blanchability using a lab-scale simulation of
conventional blanching methods. The magnitude of temperature variation in the
peanut bed during blanching was related to the final set point temperature of the
oven and to the dwell time at each temperature setting. In general, with increased
temperatures and increased moisture loss, blanching percentage increased
(Paulsen and Brusewitz, 1976; Katz, 2002). Adelsberg and Sanders (1997)
provided specific detail of that information when they reported that reduction of

93
peanut moisture content from 5.5 to < 4 % using temperatures of 87.7 °C for 45 and
60 minutes and 98 °C for 30, 45, and 60 minutes resulted in maximum blanchability.
Moisture content affects blanchability as well as stability and flavor quality of peanuts
(Adelsberg and Sanders, 1997; Katz, 2002).
Microwave processing has been explored as an alternative to traditional
blanching methods due to speed of operation, energy savings, and efficiency of
process control. Shorter heating times during processing lead to greater nutrient
retention, better quality characteristics such as texture and flavor, as well as
increased production (Giese, 1992). The use of vacuum drying and microwaves for
peanut processing has been studied in comparison to traditional methods (Delwiche
et al.
, 1986). In a study using a series of individual trays of peanuts passing through
a linear applicator, Rausch et al. (2005) examined the potential use of microwaves
for peanut blanching. In the current study, refinement of the microwave applicator
has allowed a solid bed of peanuts to be exposed to microwave energy in a
continuous process, using a processing technique similar to Boldor et al. (2005).
Processing a continuous bed of peanuts eliminated the heat reflection and focusing
effect observed by Rausch et al. (2005) and prevented wide variation in peanut bed
surface temperatures.
The use of microwave technology for blanching peanuts can result in large
decreases in processing time and subsequent cost savings. The purpose of this
research was to characterize effective processing parameters for microwave
blanching, using a range of factors including exposure time, use of increased air flow
in the applicator, and initial moisture content of the peanuts. Relationships between

94
moisture content, energy absorbed by the peanuts, internal and surface temperature
profiles, and blanchability were evaluated in response to variations in processing
parameters.
MATERIALS AND METHODS
Medium-grade size, runner-type peanuts (Arachis hypogaea L., variety
Georgia Green) at an average moisture content of 7 % (wet basis) were obtained
from a single harvested lot from USDA, ARS, National Peanut Research Laboratory
(Dawson, Georgia). The peanuts were harvested, cured, shelled, sized, and stored
according to normal practices prior to delivery to Raleigh, NC. A second lot of
peanuts at 11% moisture content were received from USDA, ARS, National Peanut
Research Laboratory (Dawson, Georgia). The second lot was divided into 150
pound samples which were dried to 5 %, 7 %, and 9 % moisture content with forced
ambient air, and one lot was maintained at 11 % moisture content. All peanuts were
bagged, placed in opaque tubs and stored in a cooler at 6 °C and 60 % relative
humidity before use in experiments one week later. Before use, peanuts were
tempered overnight to room temperature.
Peanuts were heated using a 5 kW, 915 MHz microwave unit (Industrial
Microwave Systems, Morrisville, NC) with a 2.74 m belt conveyor for sample
delivery. The conveyor tunnel was equipped with an electric fan and heater, which
was set to deliver 25 °C air into the system. The microwave generator was
controlled by a data acquisition and control unit (HP34970A, Agilent, Palo Alto, CA).

95
The computer monitored power output, reflected power, and power at the exit of the
microwave tunnel through power diodes (JWF 50D-030+, JFW Industries, Inc.,
Indianapolis, IN). Immediately after blanching, peanuts were cooled to room
temperature using forced ambient air. Samples were taken for moisture content and
blanchability analysis. The remainder of each sample was sealed in plastic bags
and stored in opaque plastic tubs.
A random complete block design was used to evaluate the effect of
processing factors during microwave blanching. The experiments were split into two
sets (Table 1). Set 1 consisted of 7% moisture content peanuts heated using
varying microwave exposure times and both with (F) and without (NF) the use of
circulated 25 °C air in the conveyor tunnel. These peanuts were exposed to
microwave energy for 4, 5, 8, or 11 minutes. The control sample for this set was
peanuts undergoing the same storage procedures but which were not treated with
microwave energy. Peanuts in Set 2 had initial moisture contents of 5, 7, 9 and
11 % and were processed for the same exposure time (11 minutes, 5 kW) without
the use of a fan. The treatments in Set 2 were replicated three times, while
treatments in Set 1 were replicated four times.
The surface temperatures of the peanuts during processing were measured
using infrared probes installed along the length of the conveyor tunnel (model OS36-
T, OMEGA Engineering, Inc., Stamford, CN). Internal peanut temperatures were
measured using four fiber optic probes (FOT- L/10M, Fiso Technologies, Inc.,
Quebec, Canada) inserted into the center of individual peanuts which traveled the
length of the conveyor. The probes were connected to a multi-channel fiber optic

96
signal conditioner (Model UMI 4, Fiso Technologies, Inc., Quebec, Canada) which
was controlled using FISO Commander software (Fiso Technologies, Inc., Quebec,
Canada) on a laptop computer (Dell Inspiron 8500, Dell Computer Corporation,
Round Rock, TX). Data collection was started simultaneously for the infrared probes
and fiber optic probe systems to coordinate internal and external temperature
measurements during processing.
The energy absorbed by the peanuts during treatment was calculated using
the forward power from the generator and subtracting energy lost in reflection and at
the end of the conveyor tunnel. The exposure time of the treatment was also used
to calculate an average total absorption of energy during each treatment.
After the seed coats were removed, moisture content was measured using a
forced convection oven (Despatch LXD Series, Despatch Industries, Minneapolis,
MN); 25 gram samples were dried at 130 °C for 11 hours, and weight change was
used to calculate moisture content. Analyses were conducted in triplicate.
For seed coat removal, 350 grams of peanuts were exposed to counter-
rotating grit rollers for two minutes on a laboratory scale blancher (Model EX Ashton,
Ashton Food Machinery Company, Inc., Newark, NJ). Blanchability was determined
by visual inspection of a subsample of 100 peanuts. Peanuts with any portion of
skin attached were categorized as unblanched. Analyses were conducted in
triplicate for each treatment. All statistical analysis including analysis of variance
was conducted using SAS software (Version 9.1, SAS Institute Inc., Cary, NC).

97
RESULTS AND DISCUSSION
Energy Absorption
. Microwave blanching involves the generation of heat by
the selective absorption of electromagnetic energy by water molecules and ionic
materials, as reflected in the dielectric properties of the material. In this study, all
treatments were statistically different in the amount of energy absorbed during
microwave blanching (p < 0.0001), although a significant effect occurred within
replicates in Set 1 only. Peanuts in the 11 minute exposure treatment absorbed the
most energy overall (Fig. 1). All other exposure times were significantly different (p
< 0.05) from each other, and the use of a fan made no difference. The amount of
power absorbed depends on the intensity of the electric field, as well as the dielectric
properties of the material. This is often expressed by the equation:
P=2
Πfε
0
E
2
ε”
where f is frequency (Hz), E is electric field intensity (v/m),
ε” is the dielectric loss
and
ε
0
is the dielectric constant of free space (8.854 farad/m). Although the
dielectric properties of shelled peanuts at these experimental conditions are not
found in the literature, Trabelsi and Nelson (2004) found that at frequencies of 12 to
18 GHz, shelled peanuts at 5.1% moisture content had a dielectric constant (
ε’) of
2.1 and dielectric loss (
ε”) of 0.11. Boldor et al.(2004) found a range of dielectric
constants of 4.5-10 and dielectric loss values from 1.25-2.75 in peanuts at 18-33%
moisture content (dry basis), respectively. Although the dielectric properties will
decrease with frequency and increase with higher moisture content, these studies
give a general range of values for the conditions in this study. These values for

98
dielectric constant and dielectric loss in peanuts are relatively low compared to other
foods on a dielectric properties map (Ryynanen, 1995), although this would be
expected because of the high content of oil in the peanuts.
In Set 2, 11 % moisture content peanuts absorbed more energy than the 5 %
moisture content peanuts in each replicate, but the remaining treatments were not
different (data not shown). In peanuts, water dominates the effect on dielectric
properties (Trabelsi and Nelson, 2004). In fact, in many materials, the change in
dielectric constant and dielectric loss with moisture content is so pronounced, it has
been used to develop methods of measuring moisture content using microwave
technology (Engelder and Buffler 1991). These differences in energy absorption
with moisture content agree with the literature (Trabelsi and Nelson, 2004), as a
significant decrease in dielectric constant and dielectric loss was seen in shelled
peanuts as moisture content decreased from 18 to 7%.
Peanut Temperature.
As microwave energy is absorbed by the peanuts, the
rate of temperature increase will depend on the power (P), mass (M), and specific
heat (Cp), as in the following equation (Metaxas and Meredith, 1983):
P = M Cp (T-T
0
) / t
During microwave heating, both internal (Table 2) and surface temperatures of the
peanuts were monitored. A comparison of internal and surface temperature profiles
for select treatments can be seen in Fig. 2 and 3. The average internal temperature
profiles of the treatments (Table 2) from both sets were significantly different from
each other (p < 0.0001). In Set 1, peanuts from treatment 11NF had the highest
internal temperatures, followed by 8NF.

99
All treatments using the fan (F) had consistently lower temperatures than the NF
treatment of the same time, due to surface cooling of the peanuts (Table 2). Fans
are commonly used in the curing (drying) of peanuts (Troeger 1982; Young, 1982).
Since one of the objectives of blanching is to reduce moisture, the use of a fan was
included in these experiments. During microwave heating, some heat will be lost
from the material due to radiation and also by convection, which is affected by the
difference in the temperatures between the material (T) and its surroundings (T
inf
),
the surface area (A), and h, the heat transfer coefficient (Metaxas and Meredith,
1983):
Q
conv
= h A (T – T
inf
)
Convection is also affected by the velocity of the surrounding air; as a result, a fan
will increase surface cooling. Evaporation at the surface of the material will also
increase, as a fan will remove moisture from the system quickly and speed moisture
diffusion. This will result in lower temperatures due to increased evaporative
cooling, and temperature gradients can be formed. Furthermore, Datta and Liu
(1992) found that during microwave processing of solids, heat is generated at
increasing rates at the surface, and the difference between surface and center
temperature continue to increase with time of processing. As a result, cooling the
surface of the peanuts by using a fan during blanching has a large effect on internal
temperatures, and did not enhance blanching as might be expected.
The effect of increased airflow via a fan during blanching has been studied
previously. In their research on conventional oven blanching, Adelsberg and
Sanders (1997) found that increased airflow caused the portion of the peanut bed

100
exposed to the fan to be approximately 10
°C lower than the rest of the peanuts.
This temperature difference was greater in treatments conducted at higher
temperatures, reaching a 17
°C difference in treatments conducted at 98.9 °C
(Adelsberg and Sanders 1997). The difference in the temperatures between the
longer treatments in this study conducted with and without a fan were somewhat
larger, but they were also conducted at much higher temperatures used in
microwave blanching.
In Set 2, the lowest moisture peanuts reached the highest temperatures (Table 2,
Fig. 3). Although all treatments in Set 2 exceeded 100 °C, peanuts in the 5 % MC
treatment had the highest internal temperature (139 °C), followed by 7 %, 9 %, and
11 % MC treatments. The typical temperature profile which is seen in materials
dried using microwave technology has three separate regions: an initial heating
region in which the temperature of the material reaches the wet bulb temperature; a
constant temperature drying region, in which most of the liquid is vaporized and
moves through the sample; and a third region in which the temperature increases
without any further removal of liquid (Metaxa and Meredith 1983). Peanuts with
lower initial moisture contents (5% and 7%) did not absorb as much energy during
processing, because of the relatively lower amounts of polar components in the
sample. However, these low moisture peanuts may be progressing through this
drying curve more quickly as they soon reach an equilibrium moisture content during
the constant drying region. As a result, they spend more of the processing time in
the third region of the curve, increasing in temperature.

101
Treatments 11NF, 8NF, and 5NF also had the highest surface temperatures,
which exceeded 100 °C, and lower moisture peanuts (5 % and 7 % MC) had higher
surface temperatures in Set 2. Boldor et al. (2005) found that more convective
cooling will occur at the surface of peanuts during drying when more water is being
evaporated, thus treatments with the most moisture loss will have a greater cooling
effect at the surface. This agrees with the trend seen in the peanuts in Set 2, in
which all peanuts were treated for the same period of time, but the higher moisture
content peanuts had lower surface temperatures. Surface temperatures have been
previously correlated to internal temperatures in microwave processing of peanuts
(Boldor et al., 2005).
Change in moisture content.
The final moisture content of the peanuts was
significantly affected by treatment (p < 0.0001), although replicate effects were
significant in Set 1 only (p = 0.02). In Set 1, as processing times increased, internal
peanut temperatures increased, and more moisture was lost (Fig. 4). Treatments
8NF and 11NF had significantly lower final moisture content (approximately 4.0 - 5.5
%) than other treatments (p < 0.05). Unlike conventional heating, microwave energy
is absorbed throughout the volume of the wet solid, and the temperature of the solid
can reach the boiling point of the liquid component. As the moisture evaporates, a
pressure gradient is formed from the vapors and will drive the moisture from the
interior of the solid (Metaxas and Meredith, 1983).
Despite the variations in initial moisture contents and energy absorption, all
peanuts in Set 2 reached a similar moisture content of approximately 4.1 % (Fig. 4).
This moisture content appears to be the final equilibrium point at which the peanuts

102
finish the constant drying region of the temperature profile. Since the lower moisture
peanuts reached this point more quickly, they entered the third phase in the
temperature profile, and reached higher temperatures during processing than the
9% and 11% peanuts (Table 2, Fig. 3). It has been noted that it is difficult to remove
tightly bound water using microwaves, because of the low absorption of energy by
the residual liquid (Metaxas and Meredith, 1983). As a result, the 4% moisture level
may be at a transition between free and bound water in the peanuts, which would
impede further moisture loss during processing at the conditions studied.
Blanchability.
Treatments had a significant effect on blanchability
(p < 0.0001). Individually, the treatments of 8NF, 11F, and 11NF were not
significantly different from each other (Fig. 5) but were more blanchable than the
other treatments (p < 0.05). Only 8NF and 11NF consistently exceeded the industry
standard of 85 % blanchability in Set 1, and all variable moisture content peanut
samples in Set 2 exceeded the standard (Fig. 6). In addition, the peanuts with initial
moisture content of 5 % were significantly higher in blanchability (average = 93 %)
than the other 3 lots for each replicate. To ensure that the initial ambient air drying
step for peanuts in Set 2 did not affect blanchability, controls for each moisture
content were also examined, and blanchability was found to average 1 %.
High blanchability resulted from higher process temperatures and lower final
moisture content, with those treatments exceeding 110 °C and reaching a final
moisture content of 5.5 % or below yielding blanchability greater than 85 % (Fig. 7).
Similarly, Rausch et al. (2005), when blanching individual trays of peanuts, found
that microwave treatments resulting in 0.5 – 1.0 % moisture loss provided better

103
blanchabilities as well as a longer raw peanut shelf life. It has been suggested that
the mechanism of blanching is due to differences in thermal expansion and
subsequent contraction of the seed and seed coat, resulting in a loosening of the
seed coat. In an experiment by Paulsen and Brusewitz (1976), the difference
between the coefficients of cubical thermal expansion of seeds (50 – 60.5 x 10
-5
/°C)
and that for peanut skins (26.5 – 55 x 10
-5
/°C) grew larger at lower moisture
contents
.
As a result, this explains why peanuts which reached the lowest moisture
content were the most effective treatments for blanchability. In fact, in another
study, Paulsen and Brusewitz (1976b) determined that the effectiveness of
blanching was dependent mainly on the degree of moisture removal, although
Adelsberg and Sanders (1997) did not see an increase in blanchability at moisture
contents below 3.8%. Instead, Adelsberg and Sanders (1997) determined that
differences in blanchability may be affected by thermal expansion or variations in
moisture loss, or possibly a combination of factors. This study was also not able to
separate these factors of temperature and final moisture content, although initial
moisture content does not appear to have much effect on blanchability.
An interplay of temperature and moisture loss must be responsible for the high
rates of blanchability seen in the 8NF treatment. Although this treatment absorbed
significantly less energy and reached lower temperatures than the 11NF treatment
and the peanuts in Set 2, it reached a level of blanchability above the 85% standard.
In order to investigate this, the maximum internal temperatures during processing
were also evaluated, and were found significantly different (p < 0.0001) for each
treatment (Table 3). In this comparison, the maximum temperature of the 8NF

104
treatment was over 100 °C, similar to the 11NF treatment and the peanuts in Set 2
which ranged from 119 – 139 °C. In temperatures under 100 °C, Datta and Liu
(1992) found that temperature profiles became increasingly non-uniform over longer
heating times during microwave processing. However, Ni et al. (1999) found that the
non-uniformity in temperatures is lessened when the food temperature reaches the
boiling point of water. The same study (Ni et al, 1999) also found that the key
variable which controls moisture loss during the microwave heating of solid foods
was achieving an average temperature uniformly. By evaluating the maximum
temperatures reached during processing, it was seen that the internal temperatures
during the 8NF treatment exceeded 100 °C, and perhaps reached a more uniform
temperature profile, leading to greater moisture loss and acceptable blanchability.
CONCLUSIONS
The use of microwave technology for peanut blanching provides a significant
decrease in processing time and can result in cost savings. In this study, the
relationships between temperature, moisture content, and blanchability using a
continuous belt processing method have been demonstrated. Effective blanchability
was correlated to high process temperatures and corresponding low moisture
content. All peanuts with internal temperatures exceeding 110 °C and reaching a
final moisture content of 5.5 % or below yielded acceptable blanchability. Even
peanuts varying in initial moisture content resulted in a low final moisture content
and acceptable blanchability. This study demonstrated that peanuts heated by

105
microwave attain much higher temperatures than conventional multizone oven
heated peanuts. The time required to generate sufficient heat to dry peanuts for
acceptable blanchability is greatly reduced by the use of microwave technology.
ACKNOWLEDGMENTS
Funded in part by the North Carolina Agricultural Research Service. Paper
no. --- of the Journal Series of the Dept. Food Science, North Carolina State
University, Raleigh, NC 27695. The assistance of Keith Hendrix and Jim Schaefer is
gratefully acknowledged. The authors would also like to thank Marshall Lamb and
Bobby Tennille of USDA, ARS, National Peanut Laboratory (Dawson, Georgia) for
supplying the peanuts used in this study. The use of trade names in this publication
does not imply endorsement by the North Carolina State University or USDA, ARS
of the products named nor criticism of similar ones not mentioned.

106
ABBREVIATIONS
ARS -
Agricultural Research Service
F
-
Fan used during processing
MC -
Moisture content (wet basis)
NF -
No fan used during processing
OSI -
Oxidative stability index
PV -
Peroxide value
USDA -
United States Department of Agriculture

107
REFERENCES
ADELSBERG, G.D. and SANDERS, T.H. 1997. Effect of peanut blanching
protocols on bed and seed temperatures, seed moisture, and blanchability.
Peanut Science 24: 42-46.
BOLDOR, D., SANDERS, T.H., SIMUNOVIC, J. 2004. Dielectric properties of in-
shell and shelled peanuts at microwave frequencies. Transactions of the ASAE
47(4), 1159-1169.
BOLDOR, D., SANDERS, T.H., SWARTZEL, K.R. and FARKAS, B.E. 2005. A
model for temperature and moisture distribution during continuous microwave
drying. Journal of Food Process Engineering 28(1), 68-87.
DATTA, A.K., and LIU, J. 1992. Thermal time distributions for microwave and
conventional heating of food. Food Bioproducts and Processing 70(2), 83-90.
DELWICHE, S.R., SHUPE, W.L., PEARSON, J.L., SANDERS, T.H. and
WILSON, D.M. 1986. Microwave vacuum drying effect on peanut quality.
Peanut Science 13, 21-27.
ENGELDER, D.S., and BUFFLER, C.R. 1991. Measuring dielectric properties of
food products at microwave frequencies. Microwave World 12(2), 2-11.
GIESE, J. 1992. Advances in microwave food processing. Food Technology
46(9), 118-123.
KATZ, T.A. 2002. The effect of microwave energy on roast quality of microwave
blanched peanuts. Master's Thesis, North Carolina State University, Raleigh,
NC.
METAXAS, A.C., and MEREDITH, R.J. 1983. Industrial Microwave Heating.
London: Peter Peregrinus Ltd. 357pp.
NI, H. and DATTA, A.K. 1999. Moisture loss as related to heating uniformity in
microwave processing of solid foods. Journal of Food Process Engineering 22,
367-382.
PAULSEN, M.R. and BRUSEWITZ, G.H. 1976. Coefficient of cubical thermal
expansion for Spanish peanut kernels and skins. Transactions of the ASAE
19(3), 592-595, 600.
PAULSEN, M.R. and BRUSEWITZ, G.H. 1976b. Moisture contraction of Spanish
peanuts. Peanut Science 3, 52-55.
RAUSCH, T.D., SANDERS, T.H., HENDRIX, K.W., and DROZD, J.M. 2005.

108
Effect of microwave energy on blanchability and shelf life of peanuts. Journal
of Agricultural and Food Chemistry, submitted.
RYYNANEN, S. 1995. The electromagnetic properties of food materials: a review
of basic principles. Journal of Food Engineering 26, 409-429.
SANDERS, T.H., ADELSBERG, G.D., HENDRIX, K.W. and MCMICHAEL, R.W.
JR. 1999. Effect of blanching on peanut shelf-life. Peanut Science 26, 8-13.
TRABELSI, S. and NELSON, S.O. 2004. Microwave dielectric properties of shelled
and unshelled peanuts. Transactions of the ASAE 47(4), 1215-1222.
TROEGER, J.M. 1982. Peanut drying energy consumption - a simulation analysis.
Peanut Science 9, 40-44.
YOUNG, J.H., PERSON, N.K., DONALD, J.O., and MAYFIELD, W.D. 1982.
Harvesting, curing, and energy utilization. In Peanut Science and Technology.
Edited by Pattee, H.E. and Young, C.T. Amer. Peanut REs. Educ. Soc., Inc.,
Yoakum, TX.

109
TABLES AND FIGURES
Table 1: Processing parameters during microwave blanching
of peanuts
Treatment
Initial moisture content of peanuts
Set 1 4 min., Fan
7 %
4 min., No fan
7 %
5 min., Fan
7 %
5 min., No fan
7 %
8 min., Fan
7 %
8 min., No fan
7 %
11 min., Fan
7 %
11 min., No fan
7 %
Set 2 11 min., No fan
5 %
11 min., No fan
7 %
11 min., No fan
9 %
11 min., No fan
11 %
Table 2: Means by treatment of internal temperatures of peanuts
during microwave blanching
Treatment
Mean temperature (°C)
Set 1
4 min., Fan
38.4j
1
5 min., Fan
54.7i
8 min., Fan
57.4h
11 min., Fan
62.7g
4 min., No fan
71.0e
5 min., No fan
63.9f
8 min., No fan
85.7d
11 min., No fan
103.3b
Set 2
5 % Moisture content
102.9b
7 % Moisture content
104.9a
9 % Moisture content
98.6c
11 % Moisture content
98.1c
1
Values followed by the same letter are not significantly different (LSD = 0.91)

110
Table 3: Maximum internal temperatures of peanuts by treatment
during microwave blanching
Treatment
Maximum
temperature
(°C)
Set 1
4 min., Fan
69.3h
1
5 min., Fan
77.0gh
8 min., Fan
84.4fg
11 min., Fan
90.6ef
4 min., No fan
92.0ef
5 min., No fan
94.6e
8 min., No fan
112.8d
11 min., No fan
128.0bc
Set 2
5 % Moisture content
138.8a
7 % Moisture content
132.5ab
9 % Moisture content
122.2cd
11 % Moisture content
119.1cd
1
Values followed by the same letter are not significantly different (LSD = 9.8)
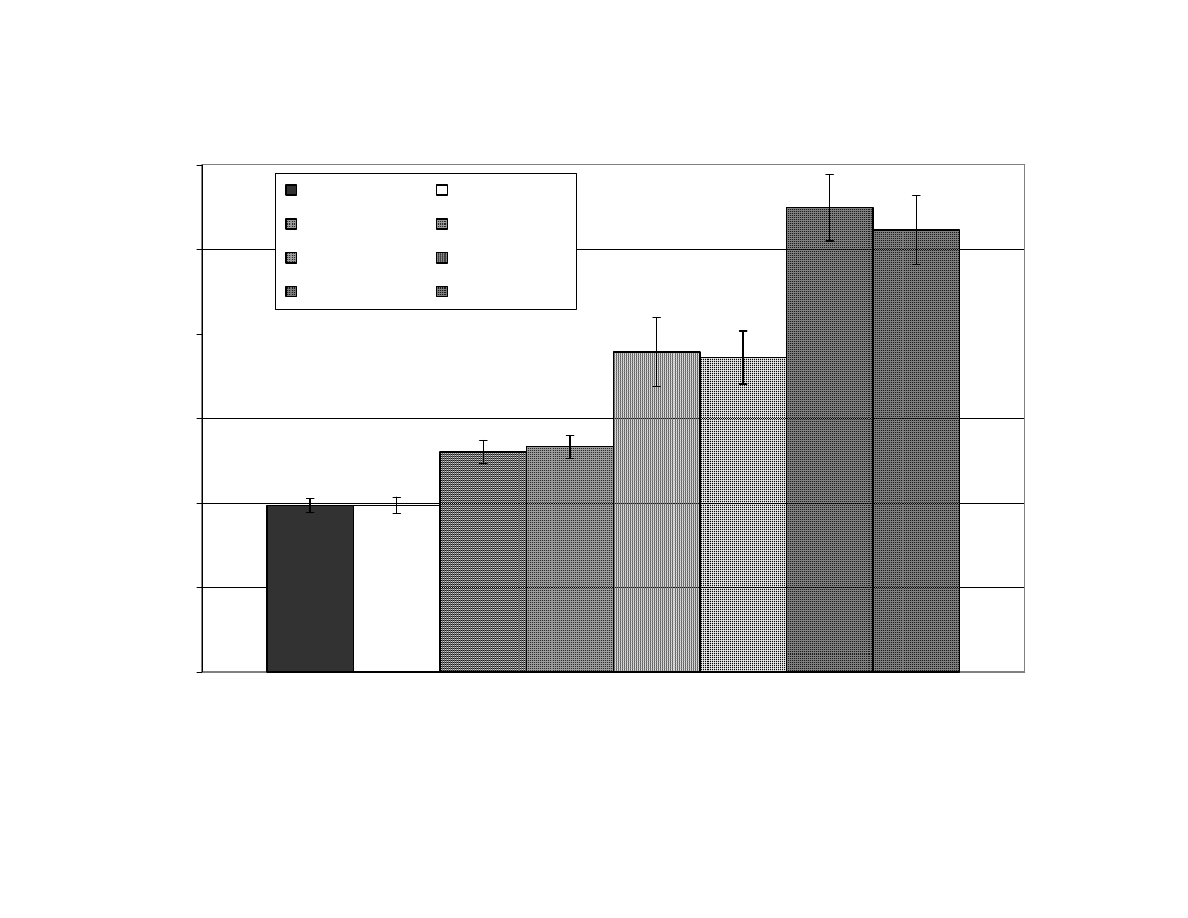
111
Fig. 1: Mean energy absorbed by peanuts per treatment for all replicates during microwave heating
for 4, 5, 8, or 11 minutes (Set 1)
0
500
1000
1500
2000
2500
3000
Samples
E
n
er
gy abs
orb
e
d
(kJ
)
4 min., Fan
4 min., No fan
5 min., Fan
5 min., No fan
8 min., Fan
8 min., No fan
11 min., Fan
11 min., No fan
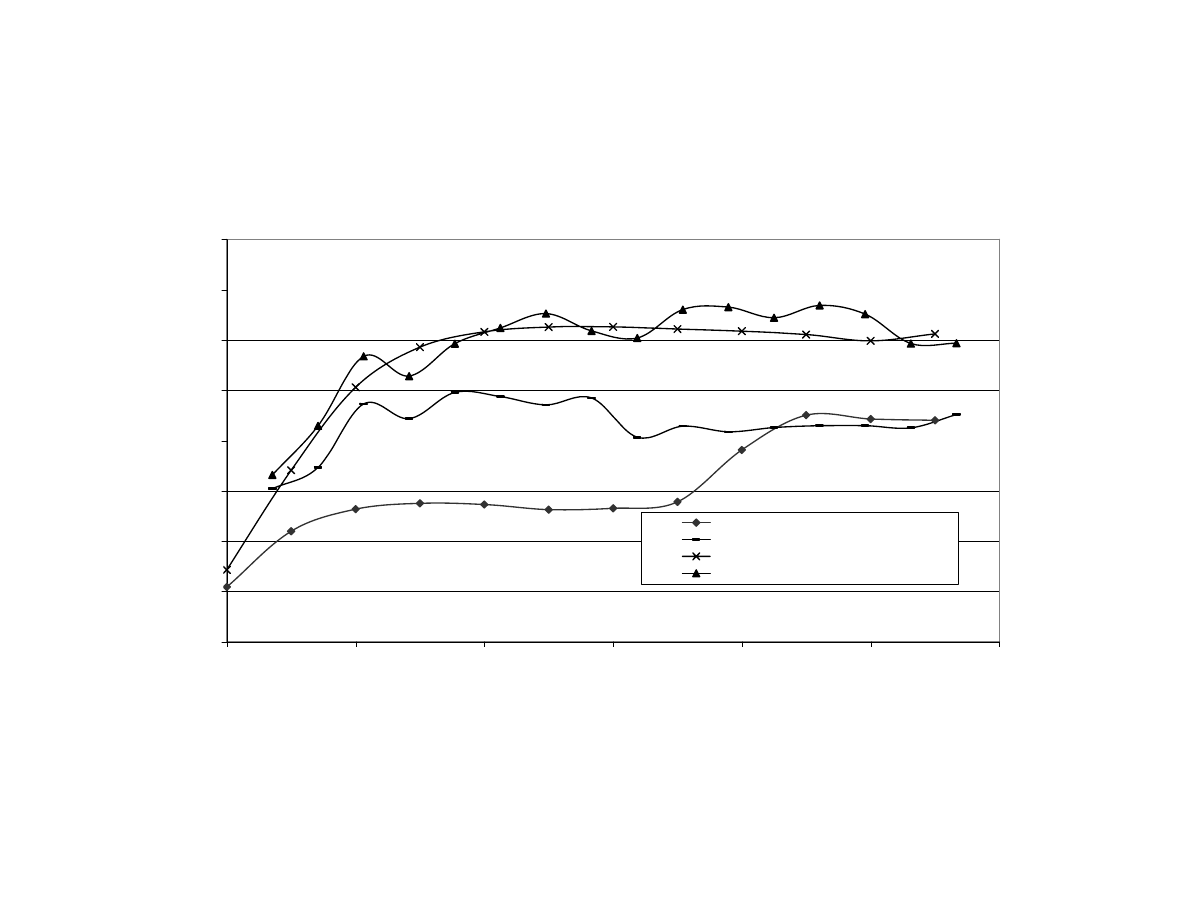
112
Figure 2: Internal and surface temperatures of peanuts during microwave blanching for 11 minutes
with and without using fan (Set 1)
0
20
40
60
80
100
120
140
160
0
2
4
6
8
10
12
Time of microwave exposure (min)
T
em
p
er
atu
re of pe
an
ut
s
(°
C)
11 min with fan (internal)
11 min with fan (surface)
11 min without fan (internal)
11 min without fan (surface)
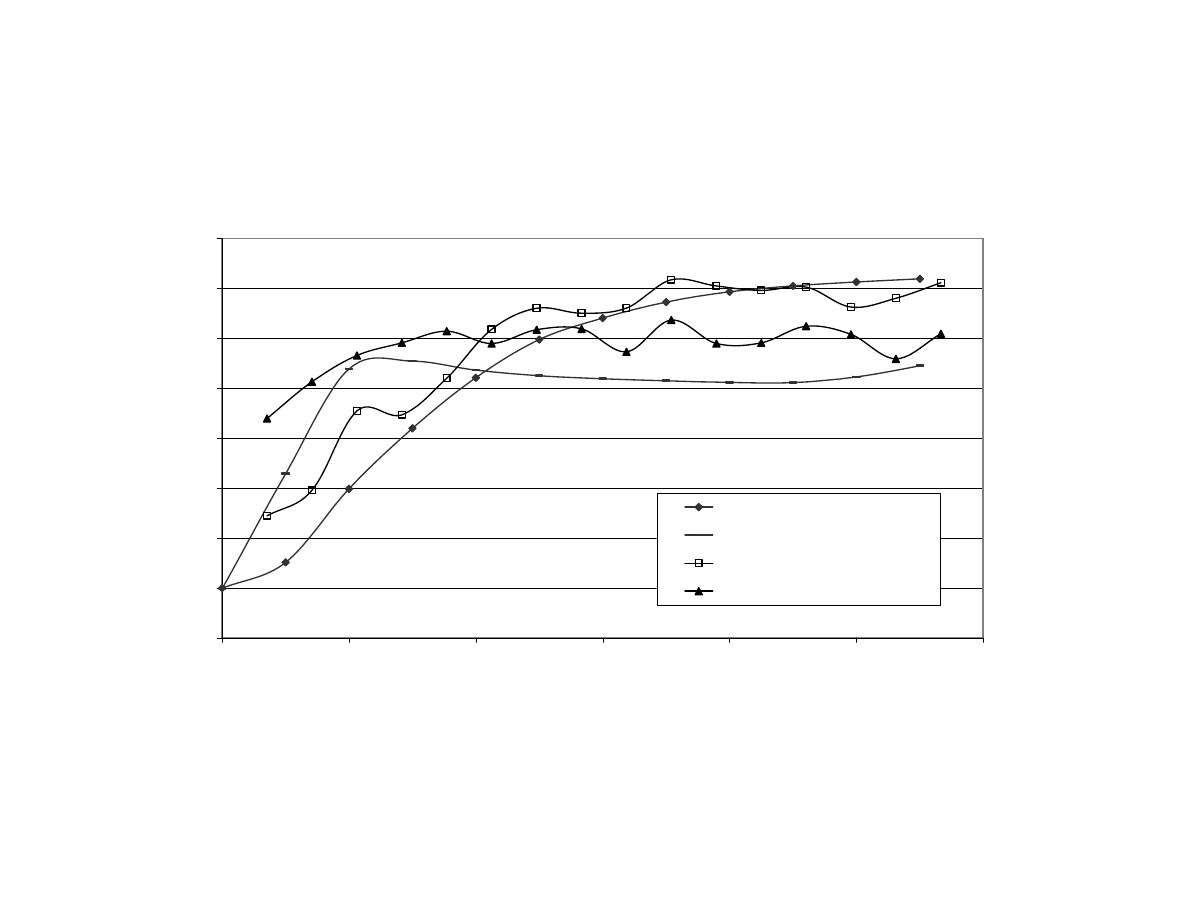
113
Figure 3: Internal and surface temperatures of peanuts of 5 and 11% initial moisture content (MC)
during microwave blanching for 11 minutes without using a fan (Set 2)
0
20
40
60
80
100
120
140
160
0
2
4
6
8
10
12
Time of microwave exposure (min)
T
e
m
p
era
tu
re o
f p
ean
uts
(°C)
5% MC peanuts (internal)
11% MC peanuts (internal)
5% MC peanuts (surface)
11% MC peanuts (surface)
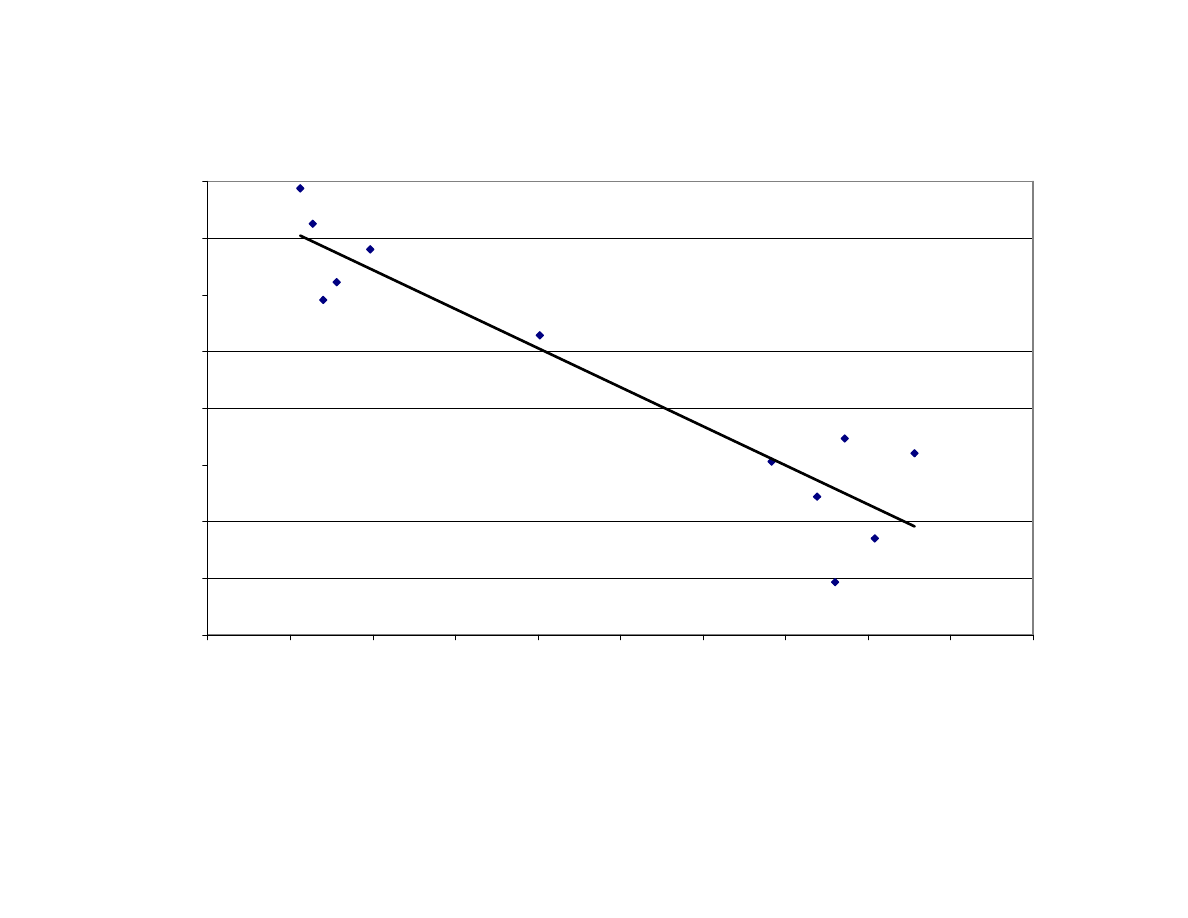
114
Fig 4. Relationship between maximum internal temperature and final moisture content of peanuts
after microwave blanching (correlation r
2
= 0.87). F= fan used during blanching, NF = no fan used,
MC = moisture content
60
70
80
90
100
110
120
130
140
3.5
4.0
4.5
5.0
5.5
6.0
6.5
7.0
7.5
8.0
8.5
Moisture content (% wb)
Int
e
rn
al
te
m
per
at
ur
e (
°C)
4F
5F
8F
11F
5NF
4NF
8NF
11NF
7% MC (Set 2)
5% MC (Set 2)
9% MC (Set 2)
11% MC (Set 2)
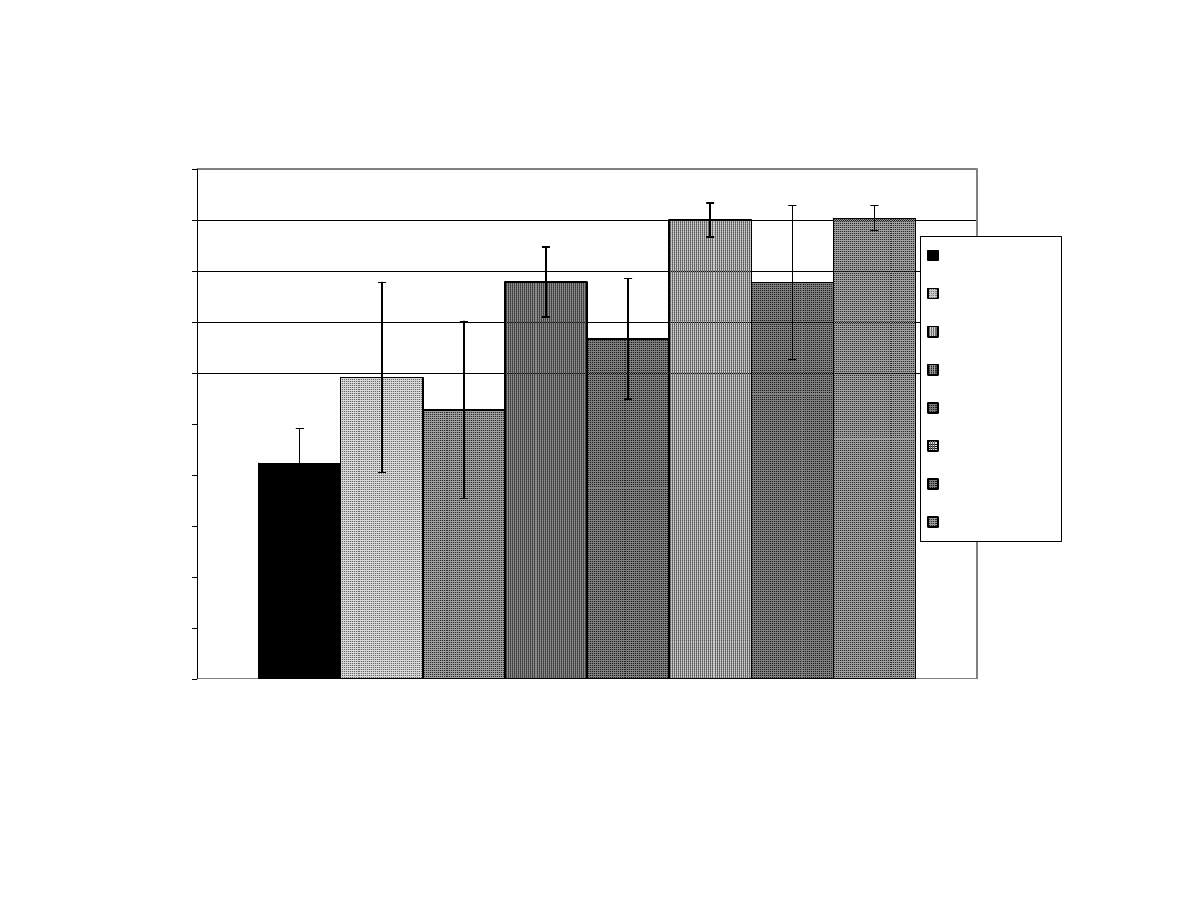
115
Figure 5: Mean of blanchability results per treatment for all replicates during microwave blanching of
peanuts for 4, 5, 8, or 11 minutes (Set 1)
0
10
20
30
40
50
60
70
80
90
100
Samples
Pe
rce
nt blan
ch
ab
ility
4 min., Fan
4 min., No fan
5 min., Fan
5 min., No fan
8 min., Fan
8 min., No fan
11 min., Fan
11 min., No fan
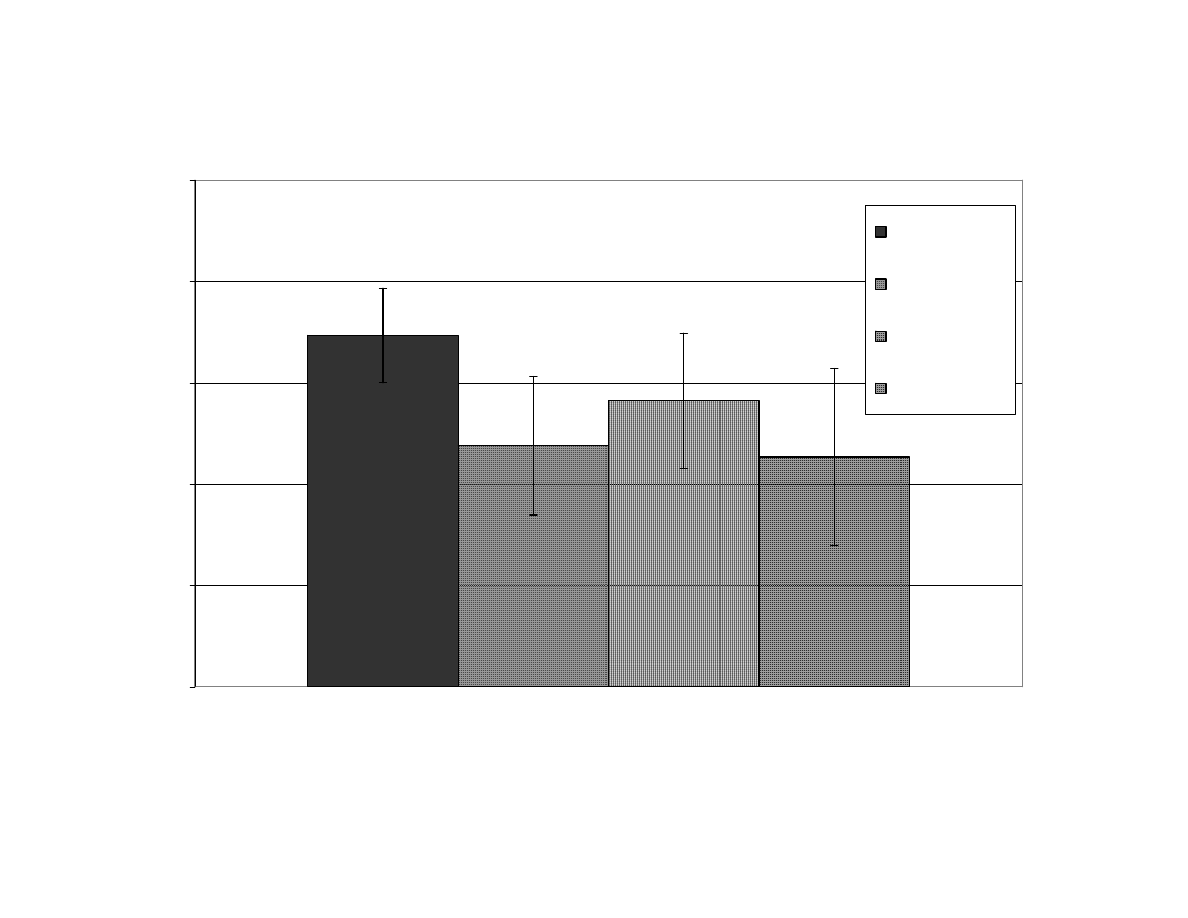
116
Figure 6: Mean of blanchability results per treatment for all replicates during microwave blanching of
peanuts for 11 minutes without using a fan (Set 2)
75
80
85
90
95
100
Samples
Pe
rcen
t b
lancha
bili
ty
5% Microwave
7% Microwave
9% Microwave
11% Microwave
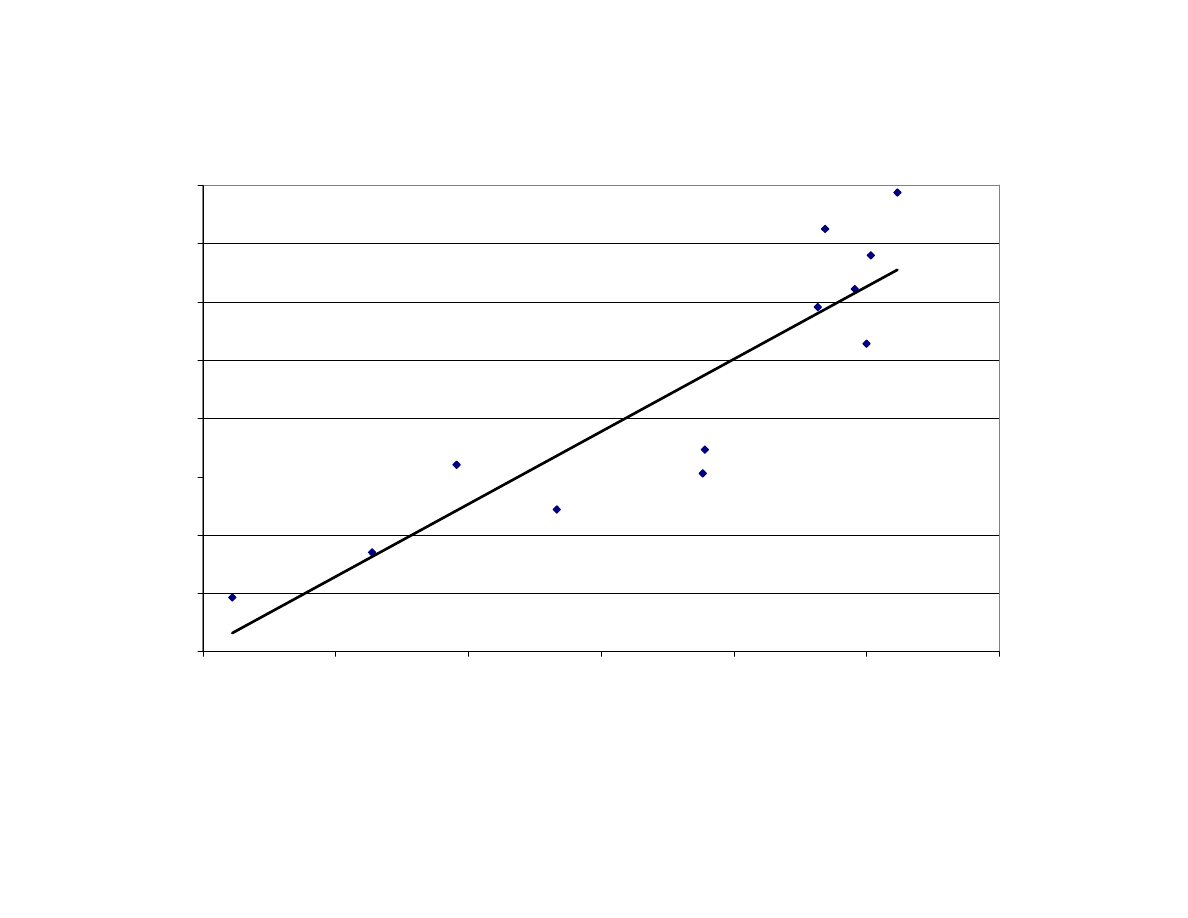
117
Figure 7: Relationship between maximum internal temperature and blanchability of peanuts after
microwave blanching (correlation r
2
= 0.81). The average final moisture content (MC) of each
treatment is noted.
60
70
80
90
100
110
120
130
140
40
50
60
70
80
90
100
Blanchability (%)
Maxi
mum inte
rna
l tempe
rature
(°C)
7.30% MC
7.54% MC
7.78% MC
7.19% MC
6.92% MC
7.36% MC
5.51% MC
4.28% MC
4.20% MC
4.49% MC
4.14% MC
4.06% MC

118
CHAPTER 4:
IMPACT OF MICROWAVE BLANCHING ON THE FLAVOR OF
ROASTED PEANUTS
Andriana V. Schirack
1
, MaryAnne Drake
1*
, Timothy H. Sanders
2
, K.P. Sandeep
1
1
Department of Food Science
North Carolina State University, Raleigh, North Carolina 27695-7624
2
USDA-ARS, Market Quality and Handling Research Unit
North Carolina State University, Raleigh, North Carolina 27695-7624
*Corresponding author:
mdrake@unity.ncsu.edu
Department of Food Science, Box 7624,
North Carolina State University, Raleigh, North Carolina 27695-7624
Running title: Impact of microwave blanching on peanut flavor
Accepted for publication in Journal of Sensory Studies.
M.Gacula, Jr., ed. Blackwell Publishing, Malden, MA.

119
ABSTRACT
Microwave blanching of peanuts has been proposed as an attractive
alternative to traditional techniques of blanching, due to energy and time savings.
However, the occurrence of a processing-related off-flavor has been reported. This
study examined the effect of processing factors during microwave blanching on the
moisture content and sensory characteristics of the peanuts. Peanuts reached a
range of internal temperatures during microwave blanching treatments between 4
and 11 minutes. A total offnote attribute was introduced to the peanut lexicon and
was used successfully to differentiate the effects of microwave treatments. The
microwave-associated off-flavor was related (but not identical) to cardboardy/stale
flavor, and was related inversely to the positive flavor attributes roasted peanutty,
sweet aromatic, and sweet taste. Peanuts reaching the highest internal
temperatures and greatest moisture losses during blanching exhibited the most total
offnote flavor; however, temperatures as high as 113 °C did not produce significantly
increased total offnote intensity.
Key Words: microwave, blanching, peanuts, sensory, off-flavor, moisture

120
INTRODUCTION
Peanuts are an important crop in the United States, with an annual production
of 4.26 billion pounds in 2004 (NASS, 2005). The most common use of peanuts is
crushing for oil and meal. The oil can be used for cooking and as a salad oil, while
the defatted meal can be processed into protein concentrates and isolates. In the
United States, a large percentage of peanuts is used for manufacturing peanut
butter and confections. The unique flavor of roasted peanuts drives product
marketing in the peanut industry. This flavor is the result of genetics, handling,
storage, and processing factors (Sanders et al., 1995). As a result, there is an
interest in the effects of production techniques on peanut flavor (Baker et al., 2003;
Singleton and Pattee, 1992; Singleton and Pattee, 1991; Osborn et al., 1996;
Didzbalis et al., 2004).
A peanut seed consists of two cotyledons and the germ, and is enveloped in
a seed coat, or testa. The blanching of peanuts, or removal of the testa, is done for
several reasons. Blanching removes the seed coat, which may interfere with further
processing into specific products, and reduces enzyme activity and moisture
content, which are factors impacting subsequent quality (Adelsberg and Sanders,
1997). Blanching aids in the electronic color-sorting removal of damaged or
discolored seeds, which are associated with aflatoxin contamination (Sanders et al.,
1999). Blanching also is used to remove foreign material and dust (St. Angelo et al.,
1977).

121
Several methods are used for blanching: dry-blanching, spin-blanching,
water-blanching, alkali-blanching, and hydrogen peroxide-blanching. Microwave
blanching has been explored as an attractive alternative to traditional processing
methods due to its speed of operation, energy savings, and efficient process control
(Giese, 1992). Since heating takes place only in the food material and not in the
surrounding medium, microwave processing can reduce energy costs. Shorter
heating times also lead to greater nutrient retention, better quality characteristics
such as texture and flavor, as well as increased production (Giese, 1992).
The best blanching efficiencies result from peanuts which are subjected to the
highest temperatures during blanching and lose the most moisture. However, high
temperature processing has been tied to the formation of off-flavors. Curing peanuts
(in order to remove moisture before storage) at temperatures above 35 °C has been
related to the formation of anaerobic by-products which produce an off-flavor. With
increasing curing temperature, positive attributes such as roasted peanutty decrease
while off-flavors such as fruity/fermented increase in intensity (Sanders et al., 1990).
This decrease in positive flavor attribute intensity with increase in temperature also
has been observed in blanching with traditional techniques (Sanders et al., 1999).
In addition, blanching has been studied in relation to rates of lipid oxidation in
raw peanuts. Lipid oxidation is one of the leading causes of off-flavors in raw and
roasted peanuts, due to a high content of peanut lipids that contain unsaturated fatty
acids (Warner et al., 1996; Lee et al., 2002). Oxidation reactions also can result in
the decrease of desirable peanut flavor by loss of low molecular weight flavor
compounds or the generation of volatile carbonyls which can create a cardboard or

122
oxidative rancid flavor (Sanders et al., 1993; Warner et al., 1996). The effect of
blanching on lipid oxidation is not yet known, as some studies have shown an
increase in lipid oxidation after blanching (Ory et al., 1992), while a study by Sanders
et al.
(1999) showed no practical detrimental effects of blanching on oxidative
stability.
The quality and flavor of peanuts were evaluated first using a method called
the Critical Laboratory Evaluation of Roasted Peanuts, or CLER (Holaday, 1971).
Later, sensory lexicons for peanuts and peanut products were constructed by
Oupadissakoon and Young (1984) and Syarief et al. (1985). A standardized lexicon
subsequently was developed to address deficiencies in earlier models such as lack
of differentiation in oxidized off-flavors and lack of sweet/caramel descriptors
(Johnsen et al., 1988). In this lexicon, a ten point scale is used to rate intensity of
flavor, using commercially available products as references. This terminology
subsequently was modified and improved, including the addition of a "fruity"
descriptor associated with high temperature curing (Sanders et al., 1989).
Using descriptive sensory analysis, a processing-related off-flavor has been
noted in peanuts undergoing microwave blanching. The off-flavor has been
described as having “stale” and “sour” notes (Katz, 2002). The cause of this off-
flavor is not known. The objective of this study was to characterize the impact of
different microwave blanching parameters on the sensory attributes of roasted
peanuts. The effects of the moisture content of the peanuts and internal temperature
profiles were studied in relation to sensory characteristics determined by a
descriptive panel.

123
MATERIALS AND METHODS
Peanuts
Medium sized Runner peanuts (Arachis hypogaea L., variety Georgia Green)
at an average of 7% moisture were obtained from a single lot from the USDA-ARS-
National Peanut Research Laboratory (Dawson, Georgia). Although different peanut
varieties may have different flavor properties, Georgia Green peanuts were chosen
for the experiments because this variety represents the largest proportion of peanuts
on the U.S. commercial market. The peanuts were harvested, cured, shelled, sized,
and stored according to normal practices prior to delivery to Raleigh, NC. All
peanuts were bagged and stored in opaque plastic containers in a cooler at 6 °C and
60% relative humidity before use. Before blanching, peanuts were allowed to warm
to room temperature overnight in opaque containers.
Processing Experiments
Peanuts were blanched using a 5 kW, 915 MHz microwave unit (Industrial
Microwave Systems, Morrisville, NC) with a 2.74 m conveyor for sample delivery.
The conveyor tunnel was equipped with an electric fan and a heater, which was set
to deliver 25 °C air. The microwave generator was controlled by a data acquisition
and control unit (HP34970A, Agilent, Palo Alto, CA). The computer monitored power
output, reflected power, and power at the exit of the microwave tunnel through
power diodes (JWF 50D-030+, JFW Industries, Inc., Indianapolis, IN). A randomized
complete block design was used to evaluate the effect of processing factors during

124
microwave blanching (Table 1). A filled conveyor of peanuts (approximately 6 kg)
was exposed to the microwave field for 4, 5, 8, or 11 minutes in a continuous
process. The variation in microwave exposure times allowed for a range of internal
temperatures to be reached in the peanuts during heating. This translated into
peanuts which ranged from minimally blanched to those exhibiting high blanching
efficiency, as determined by the percentage of seeds with complete removal of the
testa (Table 1). Each of these treatments was processed both with (“F”) and without
a fan (“NF”). The use of a fan was explored due to the effect on temperature and
moisture content in the peanuts during heating. The control for these treatments
was a batch of peanuts which went through the same processing procedures but did
not receive microwave heating.
The treatments were replicated four times. Immediately after blanching,
peanuts were cooled to room temperature using forced ambient air. They then were
sealed in plastic bags, and stored in opaque containers in a cooler at 6 °C and 60%
relative humidity. The peanuts were processed into paste for sensory analysis
within 2 days of blanching.
Temperature Measurement During Blanching
Internal temperatures of the peanuts during blanching were measured using
four fiber optic probes (FOT- L/10M, Fiso Technologies, Inc., Quebec, Canada)
inserted into the center of individual peanuts as they traveled the length of the
conveyor. The probes were connected to a multi-channel fiber optic signal
conditioner (Model UMI 4, Fiso Technologies, Inc., Quebec, Canada) which was
controlled using FISO Commander software (Fiso Technologies, Inc., Quebec,

125
Canada) on a laptop computer (Dell Inspiron 8500, Dell Computer Corporation,
Round Rock, TX).
Moisture Content Analysis
After the peanuts were blanched, moisture content was measured using a
forced convection oven (Despatch LXD Series, Despatch Industries, Minneapolis,
MN). Twenty five gram samples were dried at 130 °C for 11 hrs, and weight change
was used to calculate moisture content (wet basis). The analysis was conducted in
triplicate.
Sensory Evaluation
An 800 g sample from each replicate was roasted and processed into paste
for sensory analysis. A thermostat-controlled Aeroglide Roaster was used
(Aeroglide Corporation, Raleigh, NC) to roast samples at 177 °C for the time needed
to achieve L values in the range of 48-52 (Vercellotti et al., 1992) using a colorimeter
(Hunter LAB DP-9000, Hunter Associates Laboratory, Reston, VA). Samples were
ground into paste for sensory evaluation using a food processor (Cuisinart Little Pro
Plus, Cuisinart Corporation, East Windsor, NJ). A grind / cool protocol was used to
prevent overheating of the paste, as discussed by Sanders et al. (1989). Samples
were kept frozen at -20 °C in glass jars until evaluation.
For descriptive sensory analysis, samples were coded with three digit random
codes, and evaluated against controls for each processing replication. The sensory
panel consisted of 10 panelists, each with at least 3 months training in peanut
sensory evaluation. Panelists were trained with the Spectrum
TM
Descriptive Analysis

126
method using a 15 point intensity scale (Meilgaard et al., 1999), and samples were
described using the peanut lexicon developed by Johnsen et al. (1988) and Sanders
et al.
(1989), with the addition of some attributes specifically for this study (Table 2).
Each sample was evaluated in duplicate by each panelist.
The microwave-related off-flavor first noted by Katz (2002) was described as
Dark Soured Aromatic (DSA). However, no standardized references were available
for this attribute. Throughout panel training and calibration discussions for the
present study, the term DSA was discarded and the term ashy, as defined by the
aroma of cigarette ash, was added. Discussion of the initial analysis of microwave-
blanched samples revealed some difficulty in agreement on the exact nature of off-
flavors detected. As a result, the total offnote term, which encompassed all negative
attributes which were unique from the control, was used and proved effective in
differentiating the samples.
Data Analysis
The results were analyzed using the general linear model procedure in SAS
(Version 9.1, SAS Institute Inc., Cary, NC), with Fisher’s least significant difference
used as a post-hoc test. Correlation analysis was used to describe relationships
amongst the variables and samples.

127
RESULTS AND DISCUSSION
Sensory Analysis
Microwave exposure time and use of air circulation had a significant effect
on peanut flavor attributes (Table 3) such as roasted peanutty, sweet aromatic, dark
roast, raw beany, woody, bitter, ashy, and sweet (p < 0.0001), as well as on
cardboardy/stale (p < 0.001). Although these attributes were statistically significant,
some of the differences between treatments for attributes such as roast peanutty or
sweet aromatic were not likely to be meaningful in practical terms due to the small
range in average score. In the range of processing parameters examined, treatment
11NF was the most different, because it was significantly higher in total offnote
(Table 3). The 11NF treatment was characterized by higher cardboardy/stale, bitter,
dark roast and ashy attribute intensities, while being characterized less by the raw
beany attribute.
The attribute, total offnote, was incorporated into the lexicon as an additional
tool to differentiate the processing treatments. The total offnote term does not
describe the specific attributes of the sample, so future work should characterize this
offnote using a descriptive panel. However, treatments were differentiated based on
total offnote (p < 0.0001), indicating that this term was effective in a basic
categorization of processing effects.
Several of the sample attributes were correlated to each other (Table 4).
Desirable attributes such as roast peanutty, sweet aromatic, and sweet taste
positively correlated with each other, and negatively correlated with bitter, ashy, and

128
total offnote. Also, dark roast was correlated positively with bitter, woody/hulls/skins,
ashy, and total offnote, and negatively correlated with raw beany and sweet taste.
Total offnote, which was the attribute primarily used to differentiate the processing
treatments, was correlated to dark roast, woody/hulls/skins, cardboardy/stale, bitter,
and ashy and was related inversely to the positive attributes of roasted peanutty,
sweet aromatic, and sweet (p < 0.05). It is notable that although total offnote was
correlated to attributes commonly linked to over-roasting, all treatments were
roasted to the same endpoint based on color, implying that this off-flavor was not
related to actual roasting differences.
A progression of changes in sensory attributes can be observed with longer
microwave exposure times during blanching. As exposure times increased to 11
minutes and air was not circulated in the conveyor, the treatments were
characterized by high intensities of total offnote attribute. The use of increased
airflow during processing affected off-flavor formation, as 11F was more similar to
treatments with shorter exposure times in the microwave.
Temperature profiles and change in moisture content
The maximum internal temperature reached in these treatments was
compared (Table 5), and treatments were significantly different (p < 0.0001). As the
amount of energy absorbed and internal temperatures increased, peanuts lost more
moisture during heating. The final moisture content of the peanuts was affected
significantly by treatment (p < 0.0001), and the treatments of 8NF and 11NF had

129
significantly lower final moisture content (Table 6) than the other treatments. The
peanuts which lost the most moisture also exhibited the highest total off-flavor.
Moisture content has been shown to have a significant effect in peanut flavor
development and quality, both by affecting the concentrations of precursors
available for flavor formation, and by changing the susceptibility to quality loss due to
the environment. For example, hydrolysis can occur during roasting in peanuts with
higher moisture contents, which increases the amounts of free amino acids and
monosaccharides that serve as precursors for flavor development (Chiou et al.,
1991). This indicates that the changes in moisture content during blanching may
affect final peanut flavor. In past studies, lower moisture content after blanching
appeared more conducive to higher blanching efficiency. However, this loss in
moisture also may lead to the creation of off-flavors.
Ongoing volatile analysis may help identify the causes of microwave-
associated off-flavor. Specific compounds identified by GC-MS have been linked to
sensory attributes in peanuts (Young and Hovis, 1990; Vercellotti et al., 1992;
Didzbalis et al., 2004). By identifying the compounds responsible for the total
offnote perception, a chemical anchor for clarification of this flavor can be identified.
As a result, the metabolic cause may be determined and the off-flavor itself possibly
can be prevented if microwave blanching is adopted as an industry practice.

130
CONCLUSIONS
Microwave exposure time and amount of air circulation during processing had
a small, but significant effect on peanut flavor attributes. Total offnote was related to
other off-flavors such as cardboardy, ashy, and bitter, and was related inversely to
positive attributes such as roast peanutty and sweet aromatic. The treatment of 11
minutes without air circulation was the most different because it scored the highest
in total offnote and reached temperatures of 128 °C or higher. A short duration
treatment, in which the internal temperature of the peanuts does not exceed a
maximum of 110 °C, appears to be acceptable for heating for seed coat removal. It
is possible to achieve efficient blanchability in peanuts while preventing microwave-
associated off-flavor. Further research is needed to determine the compounds
responsible for and the possible causes of microwave-blanching related off-flavor.
ABBREVIATIONS
F -
Fan
used
MC -
Moisture content (wet basis)
NF -
No fan used
W.B. -
Wet basis

131
ACKNOWLEDGMENTS
Funded in part by the North Carolina Agricultural Research Service. Paper
no. --- of the Journal Series of the Dept. Food Science, North Carolina State
University, Raleigh, NC 27695. The use of trade names in this publication does not
imply endorsement by North Carolina Agricultural Research Service or USDA, ARS
of the products named nor criticism of similar ones not mentioned.

132
REFERENCES
ADELSBERG, G.D. and SANDERS, T.H. 1997. Effect of peanut blanching
protocols on bed and seed temperatures, seed moisture, and blanchability.
Peanut Science 24, 42-46.
BAKER, G.L., CORNELL, J.A., GORBET, D.W., O’KEEFE, S.F., SIMS, C.A., and
TALCOTT, S.T. 2003. Determination of pyrazine and flavor variations in
peanut genotypes during roasting. J. Food Sci. 68(1), 394-400.
CHIOU, R.Y.-Y., CHANG, Y.-S., TSAI, T.-T., and HO, S. 1991. Variation of
flavor-related characteristics of peanuts during roasting as affected by initial
moisture contents. J. Agric. Food Chem. 39, 1155-1158.
DIDZBALIS, J., RITTER, K.A., TRAIL, A.C., and PLOG, F.J. 2004. Identification
of fruity/fermented odorants in high temperature cured roasted peanuts.
J. Agric. Food Chem. 52, 4828-4833.
GIESE, J. 1992. Advances in microwave food processing. Food Technology
46(9), 118-123.
HOLADAY, C.E. 1971. Report of the peanut quality committee. J.
American Peanut Research and Education Association 3, 238-241.
JOHNSEN, P.B., CIVILLE, G.V., VERCELLOTTI, J.R., SANDERS, T.H., and
DUS, C.A. 1988. Development of a lexicon for the description of peanut flavor.
J. Sensory Studies 3, 9-17.
KATZ, T.A. 2002. The effect of microwave energy on roast quality of microwave
blanched peanuts.
MSc Thesis, pp. 87-88, North Carolina State University,
Raleigh, NC.
LEE, S.-Y., TREZZA, T.A., GUINARD, J.-X., and KROCHTA, J.M. 2002. Whey-
protein-coated peanuts assessed by sensory evaluation and static headspace
gas chromatography. J. Food Sci. 67(3), 1212-1218.
MEILGAARD, M.M. G.V. and CIVILLE, B.T. Carr. 1999. Selection and training of
panel members. Pages 174-176 in Sensory Evaluation Techniques, 3
nd
ed. CRC
Press, Boca Raton, Fl.
NASS. 2005. USDA crop production 2004 summary. National Agriculture
Statistics Service, Washington, DC.
ORY, R.L., CRIPPEN, K.L. and LOVEGREN, N.V. 1992. Off-flavors in peanuts
and peanut products. In: Developments in Food Science: Off-Flavors in

133
Foods and Beverages
, Vol. 29, (G. Charalambous, ed.) pp. 57-75, Elsevier
Science Publishers, Amsterdam, The Netherlands.
OSBORN, G.S., YOUNG, J.H., and SINGLETON, J.A. 1996. Measuring the
kinetics of acetaldehyde, ethanol, and ethyl acetate within peanut kernels
during high temperature drying. Transactions of the ASAE 39(3), 1039-1045.
OUPADISSAKOON, C., and YOUNG, C.T. 1984. Modeling of roasted peanut
flavor for some Virginia type peanuts from amino acid and sugar contents.
J. Food Sci. 49, 52-58.
SANDERS, T.H., ADELSBERG, G.D., HENDRIX, K.W. and MCMICHAEL, R.W.
1999. Effect of blanching on peanut shelf-life. Peanut Science 26, 8-13.
SANDERS, T.H., BLANKENSHIP, P.D., VERCELLOTTI, J.R., and CRIPPEN,
K.L. 1990. Interaction of curing temperature and inherent maturity distributions
on descriptive flavor of commercial grade sizes of Florunner peanuts. Peanut
Science 17, 85-89.
SANDERS, T.H., PATTEE, H.E., VERCELLOTTI, J.R. and BETT, K.L. 1995.
Advances in peanut flavor quality. In: Advances in Peanut Science, (H.E. Pattee
and H.T. Stalker, eds.) pp. 528-553, American Peanut Research and Education
Society, Inc., Stilwater, OK.
SANDERS, T.H., VERCELLOTTI, J.R., BLANKENSHIP, P.D., CRIPPEN, K.L.,
and CIVILLE, G.V. 1989. Interaction of maturity and curing temperature on
descriptive flavor of peanuts. J. Food Sci. 54(4), 1066-1069.
SANDERS, T.H., VERCELLOTTI, J.R., and GRIMM, D.T. 1993. Shelf life of
peanuts and peanut products. In: Shelf Life Studies of Foods and
Beverages
. (G. Charalambous, ed.) pp. 289-309, Elsevier Science Publishers,
Amsterdam, The Netherlands:
SINGLETON, J.A. and PATTEE, H.E. 1991. Peanut moisture/size, relation to
freeze damage and effect of drying temperature on volatiles. J. Food
Sci. 56(2), 579-581.
SINGLETON, J.A., and PATTEE, H.E. 1992. Maturity and storage affect freeze
damage in peanuts. J. Food Sci. 57(6), 1382-1384.
ST. ANGELO, A.J., KUCK, J.C., HENSARLING, T.P. and ORY, R.L. 1977.
Effects of water and spin blanching on oxidative stability of peanuts. J.
Food Processing and Preservation 1, 249-260.
SYARIEF, H., HAMANN, D.D., GIESBRECHT, F.G., YOUNG, C.T. and
MONROE, R.J. 1985. Interdependency and underlying dimensions of sensory

134
flavor of selected foods. J. Food Sci. 50, 631-638.
VERCELLOTTI, J.R., CRIPPEN, K.L., LOVEGREN, N.V., and SANDERS, T.H.
1992. Defining roasted peanut flavor quality. Part 1. Correlation of GC volatiles
with roast color as an estimate of quality. In: Developments in Food Science:
Food Science and Human Nutrition
, Vol. 29, (G. Charalambous, ed.) pp. 183-
206, Elsevier Science Publishers, Amsterdam, The Netherlands.
WARNER, K.J.H., DIMICK, P.S., ZIEGLER, G.R., MUMMA, R.O., and
HOLLENDER, R. 1996. "Flavor-fade" and off-flavors in ground roasted
peanuts as related to selected pyrazines and aldehydes. J. Food Sci.
61(2), 469-472.
YOUNG, C.T., and HOVIS, A.R. 1990. A method for the rapid analysis of
headspace volatiles of raw and roasted peanuts. J. Food Sci. 55(1), 279-280.

135
TABLE LEGENDS
Table 1. Microwave application parameters and resulting blanching efficiency
Table 2. Lexicon of peanut flavor descriptors (modified from Johnsen et al., 1988;
and Sanders et al., 1989)
Table 3. Means separation of blanching treatments by sensory attribute
Table 4. Correlations between peanut flavor attributes
Table 5. Maximum internal temperature in peanuts by treatment
Table 6. Moisture content of peanuts after blanching

136
TABLE 1.
MICROWAVE APPLICATION PARAMETERS AND RESULTING BLANCHING
EFFICIENCY
Treatment Airflow
during
processing
Average Blanching
Efficiency (%)
4 minutes
With fan
42.2
4 minutes
Without fan
59.1
5 minutes
With fan
52.8
5 minutes
Without fan
77.8
8 minutes
With fan
66.7
8 minutes
Without fan
90.0
11 minutes
With fan
77.7
11 minutes
Without fan
90.3

137
TABLE 2.
LEXICON OF PEANUT FLAVOR DESCRIPTORS
(MODIFIED FROM JOHNSEN ET AL., 1988; AND SANDERS ET AL., 1989)
Roast Peanutty
The aromatic associated with medium-roast peanuts (about 3-4 on USDA
color chips) and having fragrant character such as methyl pyrazine
Sweet Aromatic
The aromatics associated with sweet material such as caramel, vanilla,
molasses
Other Aromatics
Other aromatics detected in the sample
Dark Roast
The aromatic associated with dark roasted peanuts (4+ on USDA color
chips) and having very browned or toasted character
Raw/Beany The
aromatics
associated with under-roasted peanuts or beans
Woody/Hulls/Skins
The aromatics associated with base peanut character (absence of fragrant
top notes) and related to dry wood, peanut hulls, and skins
Cardboardy/Stale
The aromatic associated with somewhat oxidized fats and oils and
reminiscent of cardboard
Earthy/Musty/Wet Dirt
The aromatic associated with wet dirt and mulch
Painty/Old Oil
The aromatic associated with linseed oil, oil based paint
Plastic/Chemical The
aromatic associated with plastic and burnt plastics
Fruity/Fermented The
aromatic
associated with fruity or fermented foods
Ashy The
aromatic
associated with cigarette ash
Sweet
The taste on the tongue associated with sugars
Sour
The taste on the tongue associated with acids
Bitter
The taste on the tongue associated with bitter agents such as caffeine or
quinine
Astringency
A chemical feeling factor on the tongue and oral tissues, described as
puckering/dry and associated with tannins or alum
Tongue and
Throat Burn
A chemical feeling factor described as a burning sensation on the tongue or
throat
Metallic
A chemical feeling factor on the tongue described as flat, metallic and
associated with iron and copper
Total Off-note
A term summarizing the overall degree to which a sample exhibits off-
flavors, as compared to the reference

138
TABLE 3.
MEANS SEPARATION OF BLANCHING TREATMENTS BY SENSORY ATTRIBUTE
Treatment Control
4 min,
Fan
4 min,
w/o Fan
5 min,
Fan
5 min,
w/o Fan
8 min,
Fan
8 min,
w/o Fan
11 min,
Fan
11 min,
w/o Fan
LSD
a
Roast Peanutty
4.33
b
4.36 4.55 4.65 4.40 4.33 4.45 4.40 4.28 0.13
Sweet Aromatic
2.89 2.90 3.04 2.90
2.94 2.88 2.88 2.88 2.81 0.11
Dark Roast
3.02 2.82 2.92 3.00
2.75 2.87 3.03 2.97 3.26 0.14
Raw Beany
2.05 2.30 2.23 2.18
2.45 2.28 2.12 2.23 1.90 0.16
Woody/Hull/Skins
3.09 3.06 3.06 3.08
3.04 3.02 3.04 3.08 3.11 0.09
Cardboardy/Stale
0.61 0.95 0.92 0.99
0.88 1.06 0.81 1.06 1.16 0.28
Sweet Taste
2.54 2.65 2.62 2.54
2.63 2.61 2.57 2.54 2.49 0.11
Bitter
3.27 3.27 3.22 3.30
3.28 3.26 3.28 3.29 3.38 0.10
Astringency
1.02 1.04 1.01 1.02
1.01 1.01 1.00 1.03 1.01 0.04
Ashy
0.54 0.38 0.38 0.51
0.47 0.49 0.62 0.55 0.82 0.22
Total Offnote
1.19 1.32 1.24 1.56
1.40 1.56 1.28 1.61 2.25 0.33
a
LSD = Least Significant Difference
b
Attribute intensities were scored using the 15-point Spectrum
TM
universal intensity scale (Meilgaard et al., 1999).

139
TABLE 4.
CORRELATIONS BETWEEN PEANUT FLAVOR ATTRIBUTES
Sweet
Aromatic
Dark
Roast
Raw
Beany
Woody /
Hull/Skins
Cardboardy
/Stale
Sweet
Taste
Bitter Astringency Ashy
Total
Offnote
Roast Peanutty
0.77
a
-0.35 0.48 -0.46
-0.41 0.57 -0.67 -0.13
-0.55 -0.76
Sweet Aromatic
-0.53 0.59 -0.52
-0.37
0.81 -0.81
-0.17
-0.76 -0.79
Dark Roast
-0.96 0.78 -0.05
-0.79 0.79
-0.01
0.89 0.71
Raw Beany
-0.79
0.08
0.77 -0.85
-0.01
-0.88 -0.72
Woody/Hull/Skins
-0.20
-0.66 0.79
0.25
0.81 0.63
Cardboardy/Stale
-0.31
0.11
-0.26
0.08
0.50
Sweet Taste
-0.85
-0.08
-0.86 -0.83
Bitter
0.04
0.89 0.82
Astringency
-0.05
-0.12
Ashy
0.86
a
Numbers in bold represent significant correlations (p < 0.05)

140
TABLE 5.
MAXIMUM INTERNAL TEMPERATURE IN PEANUTS BY TREATMENT
Treatment
Mean temperature (°C)
4 min., Fan
69.3 g
1
5 min., Fan
77.0 fg
8 min., Fan
84.4 ef
11 min., Fan
90.6 de
4 min., No fan
92.0 de
5 min., No fan
94.6 d
8 min., No fan
112.8 c
11 min., No fan
128.0 ab
1
Values followed by the same letter are not significantly
different (LSD = 9.8)
TABLE 6.
MOISTURE CONTENT OF PEANUTS AFTER BLANCHING
Treatment
Moisture content after
blanching (w.b.)
Control 7.92
a
1
4 min., Fan
7.30 abc
5 min., Fan
7.54 ab
8 min., Fan
7.19 bc
11 min., Fan
6.92 c
4 min., No fan
7.78 a
5 min., No fan
7.36 abc
8 min., No fan
5.51 d
11 min., No fan
4.49 e
1
Values followed by the same letter are not significantly different (LSD = 0.61)

141
CHAPTER 5:
CHARACTERIZATION OF AROMA-ACTIVE COMPOUNDS IN MICROWAVE
BLANCHED PEANUTS
Andriana V. Schirack
1
, MaryAnne Drake
1*
, Timothy H. Sanders
2
, K.P. Sandeep
1
1
Department of Food Science
North Carolina State University, Raleigh, North Carolina 27695-7624
2
USDA-ARS, Market Quality and Handling Research Unit
North Carolina State University, Raleigh, North Carolina 27695-7624
*Corresponding author:
mdrake@unity.ncsu.edu
Department of Food Science, Box 7624,
North Carolina State University, Raleigh, North Carolina 27695-7624
Running title: Aroma compounds in blanched peanuts…
Submitted for publication in Journal of Food Science.
D. B. Lund, ed. Institute of Food Technologists, Chicago, IL.

142
Abstract
Microwave blanching of peanuts has been explored as an alternative to conventional
oven methods based on its speed of operation, energy savings, and efficiency of
process control. Although processing times can be greatly reduced, the occurrence
of stale/floral and ashy off-flavors have been reported at high process temperatures.
This study examined the chemical compounds responsible for this off-flavor using
solvent extraction / solvent assisted flavor evaporation (SAFE), gas
chromatography-olfactometry (GC/O), gas chromatography-mass spectrometry
(GC/MS), and aroma extract dilution analysis (AEDA). Select compounds were
quantified based on AEDA results using SAFE and GC/MS. Quantification,
threshold testing, and analysis of model systems revealed increased formation of
guaiacol and phenylacetaldehyde in the off-flavored peanuts which resulted in the
burnt and stale/floral flavors noted by a trained panel.
Key Words: microwave, peanut, off-flavor, gas chromatography-olfactometry,
threshold

143
Introduction
The most common use of world peanut production remains the crushing of
peanuts for oil and meal. However, the proportion of peanuts used for other food
products has steadily increased (Revoredo and Fletcher 2002). The unique flavor of
roasted peanuts drives product marketing for products such as peanut butter and
confections. This flavor is the result of genetics, production, handling, storage, and
processing factors (Sanders and others 1995).
The main sources of volatile flavor compounds in peanuts are non-enzymatic
carbonyl-amine browning and lipid oxidation reactions, and include interactions
between peanut components as well as thermal decomposition products and loss of
volatiles (Hoffpauir 1953; Warner and others 1996). Maillard reactions are primarily
responsible for browning reactions in roasted peanuts, and produce pyrazines,
pyrroles, furans, and other low molecular weight compounds. In addition to Maillard
products, carbonyls are produced by Strecker degradation and oxidation, but can
then be lost by volatilization (Buckholz and others 1980). Pyrazines, which are
volatile heterocyclic nitrogen-containing compounds, are thought to be the major
flavor compounds impacting roasted peanut flavor (Warner and others 1996).
The causes of off-flavors in peanuts include lipid oxidation, induction of
anaerobic respiration, and external contamination with compounds such as
limonene, antioxidants, or insecticides (Ory and others 1992). Lipid oxidation is one
of the leading causes of off-flavors in raw and roasted peanuts, due to a high content
of unsaturated fatty acids (Warner and others 1996; Lee and others 2002).
Oxidation of the fatty acids in peanut oil can be caused by light, heat, air, metal

144
contamination, microorganisms or enzymatic activity (Ory and others 1992; Sanders
and others 1993). Hydroperoxides formed during lipid oxidation subsequently break
down into alcohols, alkanes, ketones and aldehydes which can be the source of off-
flavors in the peanut. Exposure to high temperatures, such as during the curing
process, has also been correlated to the development of off-flavors (Whitaker and
others 1974). High concentrations of certain compounds such as ethanol, ethyl
acetate, and acetaldehyde were found in high temperature cured peanuts (Pattee
and others 1965). In addition, fruity fermented off-flavor has been shown to occur
predominantly in immature peanuts undergoing high temperature curing (Sanders
and others 1989; Didzbalis and others 2004).
Most previous studies examining the effects of processing techniques on
peanut flavor have concentrated on high temperature curing. However, new
processing technologies have been developed which can improve production
efficiency but can also impact flavor quality. For example, microwave technology
has been investigated as an alternative method for the drying (Delwiche 1986) and
roasting of peanuts (Megahed 2001; Yoshida and others 2005). Although
microwave roasting led to formation of undesirable lipid oxidation products, the use
of microwaves for blanching has potential as an alternative to traditional blanching
methods due to the speed of operation, energy savings, and efficiency of process
control. However, during high temperature microwave treatments, an off-flavor has
been observed which was related to other off-flavors such as cardboardy, ashy, and
bitter, and was related inversely
to positive attributes such as roast peanutty and
sweet aromatic (Schirack and others 2006).

145
The objective of this study was to investigate the off-flavor formed in peanuts
during the high temperature heating step of microwave blanching through
instrumental volatile analysis and model systems. The identification of the
compounds responsible for the off-flavor could enable better quality control and may
ultimately aid in the adoption of alternative blanching methods in peanut processing.
Materials and Methods
Peanuts
Medium-grade size, runner-type peanuts (Arachis hypogaea L., variety
Georgia Green) at an average moisture content of 7 % (wet basis) were obtained
from a single harvested lot from USDA, ARS, National Peanut Research Laboratory
(Dawson, Georgia). The peanuts were harvested, cured, shelled, sized, and stored
according to normal practices prior to delivery to Raleigh, NC. Peanuts were heated
as part of the blanching process using a 5 kW, 915 MHz microwave unit (Industrial
Microwave Systems, Morrisville, NC) using the equipment and methods detailed
previously in Schirack and others (2006). A filled conveyor of peanuts
(approximately 6 kg) was exposed to the microwave field for 11 minutes in a
continuous process, in which internal peanut temperatures were as high as 128 °C.
Immediately after heating, peanuts were cooled to room temperature using forced
ambient air. The control sample was peanuts undergoing the same preparation and
storage procedures but which were not treated with microwave energy. The peanuts
were roasted before descriptive sensory and instrumental analysis, in order to
approximate the impact of the off-flavor on commercial products, such as

146
confections and peanut butter. The peanuts were also roasted to avoid interference
of the strong raw/beany note of unroasted peanuts with off-flavor detection
(Didzbalis and others 2004).
An 800 g sample for each replicate was roasted and processed into paste for
sensory and instrumental analysis. A thermostat-controlled Aeroglide Roaster was
used (Aeroglide Corporation, Raleigh, NC) to roast samples at 177 °C for the time
needed to achieve L values in the range of 48-52 (Vercellotti and others 1992) using
a Hunter LAB DP-9000 colorimeter (Hunter Associates Laboratory, Reston, VA).
Samples were ground into paste using a food processor (Cuisinart Little Pro Plus,
Cuisinart Corporation, East Windsor, NJ). A grind / cool protocol was used to
prevent overheating of the paste, as discussed by Sanders and others (1989).
Samples were kept frozen at -20 °C in glass jars until evaluation.
The peanut samples evaluated by instrumental analysis were selected based
on sensory analysis results. For descriptive sensory analysis, samples were coded
with three digit random codes, and evaluated against controls for each of four
processing replications. The sensory panel consisted of 10 panelists, each with at
least 40 h training in peanut sensory evaluation. Panelists were trained with the
Spectrum
TM
Descriptive Analysis method using a 15 point intensity scale (Meilgaard
and others 1999). Each sample was evaluated in duplicate by each panelist.
Samples were described using the peanut lexicon developed by Johnsen and others
(1988) and Sanders and others (1989), with the addition of some attributes identified
by the trained panel for these samples, such as ashy, as defined by the aroma of
cigarette ash; and total offnote, an attribute which encompassed all negative

147
attributes which were different from the control. The 11-minute blanching treatment
was described by the panel (Table 1) as high in total offnote, cardboardy, and ashy
(Schirack and others 2006). As a result, the 11-minute blanching treatment sample
and its process control were selected for instrumental volatile analyses.
Chemicals
Ethyl ether (anhydrous, 99.8 %), sodium chloride (99 %), sodium sulfate
(99 %), 2-methyl-3-heptanone (internal standard for the neutral/basic fraction), and
2-methylvaleric acid (internal standard for the acidic fraction) were obtained from
Sigma-Aldrich Corporation (St. Louis, MO). The standards for the aroma
compounds listed in Table 3 were provided by the Sigma-Aldrich Corporation (St.
Louis, MO) with the exception of tetradecanal (VWR, West Chester, PA).
Static headspace gas chromatography
Static headspace chromatography was conducted to screen the most volatile
flavor compounds in the sample as possible contributors to the microwave-related
off-flavor. Peanut samples were analyzed using 1g of peanut paste in a 10 mL
crimp-top vial. An external standard of hexanal diluted in acetone at 104 ppm was
used. The sample was heated for 30 minutes at 150 °C with a carrier gas flow of
17 mL/minute. The headspace was sampled for 0.5 minutes using a Turbomatrix 40
Headspace Sampler (Perkin Elmer Life and Analytical Sciences, Inc., Wellesley,
MA). For separation and identification of headspace volatiles, a Perkin Elmer
Autosystem XL gas chromatograph (GC) was coupled to a Perkin Elmer Turbomass

148
Gold mass spectrometer (MS; Perkin Elmer Life and Analytical Sciences, Inc.,
Wellesley, MA). The injector temperature was maintained at 150 °C. Separations
were performed on a fused silica capillary column (ZB-5, 30 m x 0.25 mm i.d., 1.0
µm d
f
,; Phenomenex, Torrance, CA). The GC oven temperature was programmed to
increase from 35 °C to 300 °C at a rate of 15 °C/minute with an initial and final hold
time of 1 minute each. The carrier gas was helium with a flow rate of 0.83
mL/minute, and the flow was split at a 20 to 1 ratio. Mass spectrometer conditions
were as follows: capillary direct interface temperature, 270
o
C; ionization energy, 70
eV; mass range, 50-300 a.m.u; EM voltage (Atune+306 V); scan rate, 0.5 scans/s.
Each sample was evaluated in duplicate.
Solvent extraction with solvent assisted flavor evaporation (SAFE)
Compounds of a higher molecular weight were screened using a solvent
extraction/SAFE technique to determine if they contribute to the microwave-related
off-flavor. One hundred grams of peanut paste was weighed and placed in Teflon
bottles. Then, 100 mL of ethyl ether, 100 mL saturated sodium chloride solution, and
2.45 ppm of internal standard (comprised of 2-methyl-3-heptanone and 2-methyl
pentanoic acid in methanol) were added. The mixtures were shaken for 30 minutes
on a Roto mix (Type 50800; Thermolyne Dubuque, IA) at high speed. The bottles
were then centrifuged at 3000 rpm for 15 min in order to separate the solvent phase
from the mixture, which was subsequently transferred to a glass jar. The procedure
was repeated twice with the addition of 100 mL of ethyl ether to the sample each
time.

149
Volatile compounds from the solvent extract were collected using solvent
assisted flavor evaporation (SAFE). The assembly used was similar to that
described by Engel and others (1999). Distillation was carried out for 2 h under
vacuum (ca. 10
-4
Torr). The sample was loaded into the top of the SAFE apparatus,
and released into the vacuum dropwise. The SAFE apparatus was maintained at 50
o
C with a circulating water bath. After distillation, the distillate was concentrated to
20 mL under a gentle stream of nitrogen gas.
The concentrated distillate was washed twice with 3 mL sodium bicarbonate
(0.5M) and vigorously shaken. It was then washed three times with 2 mL saturated
sodium chloride solution. The ether layer containing the neutral/basic fraction was
collected, dried over anhydrous sodium sulfate, and concentrated to 0.5 mL under a
gentle stream of nitrogen gas. Acidic volatiles were recovered by acidifying the
aqueous phase with hydrochloric acid (18% w/v) to a pH of 2.0 and extracting the
sample three times with 5 mL ethyl ether. The sample was dried over anhydrous
sodium sulfate before being concentrated to 0.5 mL under a nitrogen gas stream.
Gas chromatography/olfactometry (GC/O)
For GC/O analysis, an HP5890 series II gas chromatograph (Hewlett-Packard
Co., Palo Alto, CA) equipped with a flame ionization detector (FID), sniffing port, and
a splitless injector was utilized. Both the neutral/basic and acidic fractions were
analyzed from each extraction. Two microliters were injected onto a polar capillary
column (DB-WAX, 30 m length x 0.25 mm i.d. x 0.25
μm film thickness of stationary
phase (d
f
); J. & W. Scientific, Folsom, CA) and a nonpolar column (DB-5MS, 30 m

150
length x 0.25 mm i.d. x 0.25
μm d
f
; J & W Scientific, Folsom, CA). Column effluent
was split 1:1 between the FID and sniffing port using deactivated fused silica
capillaries (1 m length x 0.25 mm i.d.). The GC oven temperature was programmed
to increase from 40
o
C to 200
o
C at a rate of 8
o
C/min with an initial hold for 3 min
and a final hold of 20 min. The FID and sniffing port were maintained at a
temperature of 250
o
C. The sniffing port was supplied with humidified air at
30 mL/min.
Both post peak intensity and aroma extract dilution analysis (AEDA) were
used to characterize the aroma properties and perceived intensities of the aroma-
active compounds in the solvent extracts (Van Ruth 2001; Grosch 1993). Four
experienced panelists with at least 40 hours of training sniffed the neutral/basic and
acidic fractions of the solvent extracts on the two different columns. For post peak
intensity analysis, panelists described the odor and scored the intensity of odorants
in the extracts using a 5-point numerical intensity scale (Van Ruth 2001). For
AEDA, the solvent fractions were serially diluted at a ratio of 1:3 (v/v) with diethyl
ether and sniffed (using a DB-WAX column for acidic fractions, and a DB-5MS
column for neutral basic fractions) until no odorants were detected by the panelists.
Gas chromatography/mass spectrometry (GC/MS)
For GC/MS analysis of the solvent extracts, a 6890N GC/5973 mass selective
detector (Agilent Technologies, Inc., Palo Alto, CA) was used. Separations were
performed on a fused silica capillary column (DB-5MS, 30 m length x 0.25 mm i.d. x

151
0.25
μm d
f
; J & W Scientific, Folsom, CA). Helium gas was used as a carrier at a
constant flow of 1 mL/min. Oven temperature was programmed to increase from
40
o
C to 200
o
C at a rate of 2
o
C/min with initial and final hold times of 5 and 30 min,
respectively. Mass selective detector conditions were as follows: capillary direct
interface temperature, 250
o
C; ionization energy, 70 eV; mass range, 50-300 a.m.u;
EM voltage (Atune+200 V); scan rate, 2.94 scans/s. Each extract (1
μL) was
injected in duplicate in the splitless mode.
Identification of odorants
Retention indices (RI) were calculated using an n-alkane series (Van den
Dool and Kratz 1963). For positive identifications, RI, mass spectra, and odor
properties of unknowns were compared with those of standard compounds analyzed
under identical conditions. Tentative identifications were based on comparing mass
spectra of unknown compounds with those in the mass spectral database of the
National Institute of Standards and Technology (1992) and by matching the RI
values and odor properties of unknowns against published values in the Kovacs
retention indices located at http://www.flavornet.org.
Quantification of odorants
Relative abundance of compounds was calculated relative to the peak areas
of 2-methyl-3-heptanone (for the neutral/basic fraction) or 2-methylvaleric acid (for
the acidic fraction). In the cases when target flavor compounds coeluted with other
peanut volatiles, an extracted ion search was used for quantification. For guaiacol

152
(m/z 124 and 109), toluene (m/z 91), heptanal (m/z 96 and 114), tetradecanal (m/z
96 and 194), 2-phenylethylalcohol (m/z 91), 2-methylbutanal (m/z 86 and 56), 1,4-
butanediol (m/z 71 and 57), the specific ions in parenthesis were monitored during
analysis. The response factors of selected compounds were determined by direct
addition of known amounts of standards to odor-free water prior to solvent extraction
and SAFE. Response factors for the compounds were calculated using a five-point
standard curve on a DB-5 column (DB-5MS, 30 m length x 0.25 mm i.d. x 0.25
μm
d
f
; J & W Scientific, Folsom, CA) using GC/MS (6890N GC/5973 MSD; Agilent
Technologies, Inc., Palo Alto, CA). The selected compounds were then quantified
using the response factor and the peak area ratio of the compound to the internal
standard.
Threshold testing
Orthonasal detection thresholds of acetophenone, phenylacetaldehyde, and
2,6-dimethylpyrazine (in oil) and toluene, acetophenone and 2,6-dimethylpyrazine (in
water) were determined using the forced choice ascending concentration series
method of limits (ASTM practice E 679-91). Compounds were diluted in methanol
(for the water threshold) or in vegetable oil (oil threshold) before addition to the
matrix of either deodorized water or vegetable oil. Deodorized water was prepared
by boiling deionized water to two-thirds of its volume. The vegetable oil (Wesson,
ConAgra Foods, Omaha, NE) was obtained at a local grocery store. The compound
concentrations were serially diluted by a factor of three for each level in the
threshold test, and a seven level series was used. Blank samples in each set were

153
adjusted with the same concentration of methanol to eliminate any bias due to the
solvent used. Each 2-ounce sample cup (Sweetheart Cup Company, Inc., Owings
Mills, MD) was filled to 20 mL and allowed to equilibrate for one hour before testing.
All sample preparation and testing was done with the lights off to minimize
compound degradation during this time. Each level in the series was presented in a
randomized order.
Panelists were asked to choose the different sample out of a set of three, and
to indicate whether they were guessing. The individual best estimate threshold was
calculated by taking the geometric mean of the last concentration which was
incorrect, and the first concentration which was correct with no further samples
missed. The group threshold was calculated as the geometric mean of the individual
best estimate thresholds. Thirty five panelists were used. The panelist’s degree of
certainty was used to adjust the best estimate threshold according to the method in
Lawless and others (2000).
Sensory evaluation of peanut models
Sensory analysis of model systems was conducted to further investigate the
compounds responsible for the off-flavor caused by high temperature microwave
blanching in peanuts. Flavor models were prepared from peanut paste which was
chosen based on absence of off-flavor. The peanut paste was divided into 15 g
portions, and the compounds were introduced by a disposable pipet. After addition
of the chemicals, the peanut paste was stirred for 30 s and then equilibrated for 2 h
prior to sensory analysis.

154
Phenylacetaldehyde, guaiacol, and 2,6-dimethylpyrazine were prepared in
methanol for aroma evaluation or in 95 % ethanol for flavor evaluation across the
concentration range found in the peanut samples by quantification (Table 2). The
peanut models were evaluated in duplicate for aroma or flavor by 6 highly trained
panelists, each with > 150 h of training in the sensory evaluation of peanuts.
Results and Discussion
Sensory analysis
The sensory attributes of high-temperature microwave-blanched peanuts
were described previously (Table 1) by a descriptive sensory panel (Schirack and
others 2006). Peanuts which had been microwave blanched were significantly
higher (P < 0.05) in total offnote, which is a term encompassing all negative aspects
of the sample which are different from a reference. The total offnote term was
introduced to the current peanut lexicon (Johnsen and others 1988; Sanders and
others 1989) for this study, because the descriptive panel had some difficulty in
agreeing to the exact nature of the off-flavor. Based on the other attribute scores
which were significantly higher (P < 0.05) than the process control, the microwave
blanched peanuts also displayed higher intensities of dark/ashy, bitter, and
cardboardy/stale notes, which also may contribute in part to the total offnote score.
Further descriptive panels were conducted with experienced panelists to
more fully describe the nature of the off-flavor. Over the course of five sessions, the
panelists agreed that the distinct off-flavor of microwave blanched peanuts (which
had an average total offnote score of 2.0 on a 15 point intensity scale) was best

155
characterized by the attributes of stale/floral, cardboardy, and burnt/ashy. Product
references such as cigarette ash for the burnt/ashy attribute were very useful,
although the development of clear chemical anchors would be even more beneficial
in further clarifying this total offnote attribute to panelists.
Static headspace analysis
Static headspace analysis was conducted as the first step to screen the
samples for compounds contributing to the microwave-related off-flavor. In this
analysis, no unique volatile compounds were found in the off-flavored sample which
were not present in the process control (data not shown). This technique did isolate
compounds which have been previously identified with flavor deterioration in high
temperature-cured peanuts such as hexanal, 3-methylbutanal, and 2-methylpentanal
(Pattee and others 1965). However, the compound concentrations in the control and
off-flavored samples were not significantly different (P < 0.05). Most compounds
which are similar in volatility to hexanal can be lost during roasting (Ory and others
1992). In addition, this extraction technique isolates only the most volatile and
lowest molecular weight flavor compounds. This could explain why flavor
differences detected in roasted peanuts by the sensory panel were not reflected in
static headspace results. As a result, the static headspace method was deemed not
suitable in differentiating the microwave blanched samples from the control peanuts
and was not investigated further.

156
Gas Chromatography-Olfactometry
Over 200 aroma-active compounds were detected through gas
chromatography-olfactometry (GC/O) in the peanut samples, which is consistent
with reviews of the flavor compounds in peanuts in the literature (Pattee and
Singleton 1981). Although many flavor compounds have been documented in
peanuts, systematic studies of the relative importance and balance of the flavor
compounds in peanuts are lacking. In this study, aroma extract dilution analysis
(AEDA) was used to narrow the list of compounds which may have the most impact
on the flavor. In AEDA, solvent extracts were serially diluted by a factor of 3 until no
odorants were detected by the panelists. The compounds with dilution factors (FD)
greater than 5 for the process control and the off-flavored peanuts are shown for
both the neutral/basic and acidic fractions (Table 3). Of the 38 compounds with the
highest FD values, 26 were positively identified using odor properties, retention
indices, and mass spectra; 10 were tentatively identified using odor properties and
retention indices in comparison to standards; and two compounds remained
unidentified.
Maillard reaction products and lipid oxidation products are known to affect
peanut flavor. The impact of pyrazines, which have long been associated with the
characteristic flavors of peanuts (Mason and Johnson 1966; Johnson and others
1971) was both increased and lessened in the microwave blanched samples. For
example, the FD factor of 2,5-dimethyl-3-ethylpyrazine (brothy) was lower in the off-
flavored samples, while 2,6-dimethylpyrazine (nutty/earthy) and 2-ethyl-5-
methylpyrazine (fruity) FD factors were higher. Lipid oxidation compounds, such as

157
(E,E)-2,4-decadienal (fried/oxidized), (E,Z)-2,4-heptadienal (fatty), nonanal
(green/floral), decanal (fried), and heptanal (fatty) were found in both the control and
off-flavored peanuts. Products such as nonanal and decanal are formed from
monohydroperoxide precursors during linoleate oxidation (Min and others 1989).
While some of these compounds such as heptanal are associated with cardboard or
rancid off-flavors (Warner and others 1996), other lipid oxidation compounds such as
hexanal and 2,4-decadienal have been documented in good quality peanuts
(Vercellotti and others 1992b). Based on AEDA results, the role of lipid oxidation
compounds in microwave-related off-flavor was not clear.
GC/O results correlate with quantitative differences best when olfactometry
differences between samples are high (Cullere and others 2004). Seventeen
compounds had the largest differences in AEDA results between the process control
and microwave-blanched peanuts (i.e., differences in FD factors of 3 or more).
These compounds included floral compounds such as phenylacetaldehyde (rosy)
and geranyl buyrate (rosy); fatty compounds such as (E,E)-2,4-decadienal
(fried/oxidized), (E,Z)-2,4-heptadienal (fatty), and (E)-2-hexenoic acid (fatty); sweet
or fruity compounds such as 4-ethylbenzaldehyde (burnt sugar), benzaldehyde
(sweet/malty), toluene (sweet/chemical), 2,3-butanediol (fruity), tetradecanal
(honey/hay), methyl cinnamate (strawberry), 2-methylbutanal (chocolate/malty), and
2-ethyl-5-methylpyrazine (sweet/fruity); savory compounds such as 2,6-
dimethylpyrazine (nutty/earthy) and 2,5-dimethyl-3-ethylpyrazine (brothy ); and
others such as guaiacol (burnt/smoky), and delta-elemene (wood). Many of these
compounds have been reported previously in peanuts (Mason and others 1967;

158
Johnson and others 1971; Clark and Nursten 1977; Ho and others 1981; Vercellotti
and others 1992). Specifically, several of these compounds have been associated
with off-flavors in peanuts, such as 2,3-butanediol (Ory and others 1992), and 2-
methylbutanal, which has been correlated to an “aging” off-flavor (Young and Hovis
1990). In addition, 2,6-dimethylpyrazine, 2-ethyl-5-methylpyrazine, 2-ethyl-3,5-
dimethylpyrazine, phenylacetaldehyde, and guaiacol (2-methoxyphenol) were
identified in high temperature cured peanuts by Didzbalis and others (2004).
It is important to note that AEDA is only a semi-quantitative technique, and it
does not establish that compounds are present in concentrations above sensory
threshold. AEDA also does not reflect the impact of the food matrix on the
perception and odor properties of a compound. In fact, although the FD factors are
relative to the compounds’ concentration in the extract, they are not measures for
perceived odor intensity (Grosch 1993). No compound in the AEDA results by itself
gave the exact odor noted in microwave-blanched peanuts. This indicated that the
microwave-related off-flavor may be influenced by the other compounds in the food
matrix or caused by a combination of compounds that are present in both samples,
but at different concentration levels.
In order to compare volatile concentrations across samples, the relative
abundances of compounds identified by GC/O were calculated using relative
abundance: {(peak area of internal standard/concentration of internal standard) =
(peak area of compound/concentration of compound)}. The relative abundance
values for compounds which were not further quantified are seen in Table 4. Many
of the compounds in the acid fractions of the solvent extract were not different in

159
flavor dilution factors, nor did they possess a unique character that could potentially
contribute to the microwave-related off-flavor. Many of these compounds had a
sweet or burnt sugar odor which can be expected from Maillard reaction products.
An examination of the relative abundances revealed compounds which were below
reported thresholds or which had no consistent differences between samples for this
set of compounds.
Quantification
Select compounds were quantified by analysis of standards in deodorized
water using solvent extraction, SAFE, and GC-MS analysis. Compounds were
chosen for further quantification if they had large differences in AEDA results
between the off-flavored peanuts and the control, or if they had been tied to off-
flavors in the peanut literature (i.e., lipid oxidation compounds). A selection of
pyrazines was also quantified to determine whether these decreased in
concentration in the off-flavored peanuts, because coincident decreases in the
roasted peanutty attribute have been documented with other off-flavors in peanuts
(Sanders and others 1989; Didzbalis and others 2004). The nine compounds
selected for quantification included: one compound possibly contributing to the burnt
note in the off-flavored peanuts (guaiacol), a compound possibly adding the
stale/floral attribute noted by the sensory panel (phenylacetaldehyde), two pyrazines
(2,6-dimethylpyrazine, and 2,3-diethyl-5-methylpyrazine), two compounds with sweet
odors (acetophenone, toluene), and three lipid oxidation compounds (nonanal,

160
decanal, 2,4-decadienal). A five point standard curve was used, and for all
compounds, the linear fit had an R
2
≥
92%.
The results of quantification (Table 5) support the descriptive panel comments
used to describe the off-flavor. The microwave-blanched peanuts were described as
being more burnt/ashy, which could be due to an increase in guaiacol, and more
stale/floral, which could be due to the increase in phenylacetaldehyde. The samples
were not differentiated in levels of acetophenone or nonanal. Although large FD
differences were seen between the samples for toluene, quantification results did not
support these differences, but the AEDA differences may have been complicated
due to coelution with the solvent peak during GC/O.
Threshold determination
In order to clarify quantification results, threshold analyses were conducted to
gauge human perception of these compounds. Detection threshold values for the
quantified compounds which were not available in the literature were determined
experimentally using the ASTM ascending forced choice method of limits procedure
(Table 5). Because peanuts are composed of approximately 50% fat (Hoffpauir
1953), both the water and oil thresholds were evaluated. Based on these threshold
values, guaiacol, phenylacetaldehyde, 2,6-dimethylpyrazine, and 2,3-diethyl-5-
methylpyrazine had the most impact on the flavor of these samples.
Phenylacetaldehyde, 2,6-dimethylpyrazine, and 2,3-diethyl-5-methylpyrazine
concentrations in both control and off-flavored samples were above the threshold
values. Not only were guaiacol concentrations in the off-flavored peanuts double

161
that of the control, but only in the off-flavored peanuts did the concentrations exceed
the compound’s threshold in oil. Toluene, acetophenone, nonanal, decanal, and
(E,E)-2,4-decadienal values were below the threshold values, either in the oil matrix
or in both matrices.
After threshold testing, the odor activity value (OAV) of each compound in
different matrices was determined in the control and microwave-blanched peanuts
(Table 5). The OAV is the ratio of the compound concentration in a food to its
sensory threshold. The OAV can further identify those compounds having the most
flavor impact (Guth and Grosch 1994). In Emmentaler cheese, a high fat food, the
oil threshold value was chosen to calculate OAV for evaluation of key compounds
because the lipid phase predominated in the samples (Preininger and Grosch 1994).
Similarly in this study, the OAVs in oil were compared due to the high lipid content of
peanuts. Phenylacetaldehyde, 2,6-dimethylpyrazine, 2,3-diethyl-5-methylpyrazine,
and guaiacol had the highest OAV in oil of the compounds quantified. The OAV
values of phenylacetaldehyde, 2,6-dimethylpyrazine, and guaiacol were the highest
in the off-flavored samples and were also approximately twice their OAV values in
the control, which further supported the role of these compounds in the flavor profile
of microwave-blanched peanuts.
Phenylacetaldehyde has been previously found in peanuts (Mason and
others, 1967), in lavender honey (Bouseta and others 1996), and in other foods such
as chocolate (Schieberle and Pfnuer 1999). Phenylacetaldehyde has also been
linked to off-flavors, such as aroma deterioration in beer (Soares da Costa and
others 2004) and rosy off-flavor in Cheddar cheese (Carunchia Whetstine and others

162
2005). Phenylacetaldehyde is known to be generated in peanuts from phenylalanine
through Strecker degradation (Mason and others 1967). Phenylalanine is typically
present as a flavor precursor in peanuts and makes up a significant portion of the
free amino acids present (Newell and others 1967). Guaiacol is found in strongly
flavored cheeses (Suriyaphan and others 2001), and affected the sensory
differences in Spanish aged wines (Cullere and others 2004). This phenolic
compound has also caused medicinal or antiseptic off-flavors in apple juice (Orr and
others 2000). 2,3-diethyl-5-methylpyrazine and 2,6-dimethylpyrazine have been
correlated to peanut flavor (Mason and Johnson 1966; Maga 1982), and 2,3-diethyl-
5-methylpyrazine is a key odorant in bitter chocolate (Schieberle and Pfnuer 1999).
Among these four key compounds, phenylacetaldehyde, guaiacol, and 2,6-
dimethylpyrazine were present at significantly different (P < 0.1) levels in the off-
flavored samples, and as a result were pursued as the possible source of the
microwave-related off-flavor. These three compounds are affected by increased
temperatures. Pyrazine formation begins above 100 °C, and yield increases as the
temperature increases (Koehler and Odell 1970). Although guaiacol can be
produced by Alicyclobacillus spoilage (Orr and others 2000) and has been
associated with the maturation of wine in oak barrels (Pollnitz and others 2004),
most pertinently to peanut production, guaiacol is also a thermal degradation product
of ferulic acid during the roasting process (Holscher and Steinhart 1994). Likewise,
the kinetic rate of phenylacetaldehyde formation was significantly increased with
increasing temperatures (Soares da Costa and others 2004). During peanut
blanching, the microwave process temperatures reached up to 128 °C, which may

163
be high enough for pyrazine formation, and could explain the increased formation of
phenylacetaldehyde and guaiacol.
Interestingly, lipid oxidation compounds did not appear to have a role in
microwave-related off-flavor. This is consistent with the literature, as Katz (2002)
found that microwave-blanched peanuts were more oxidation stable than oven-
blanched peanuts as evident by lower peroxide values and higher oxidative stability
index. In addition, Maillard reaction products in peanuts such as reductones are free
radical scavengers which could further prevent formation of oxidation products
(Sanders and others 1993).
Model systems
In order to examine the effects of these compounds at their relative
concentrations in a food matrix, phenylacetaldehyde, guaiacol, and 2,6-
dimethylpyrazine were added singly and in combination to a freshly roasted peanut
paste free of off-flavors (Table 2). Although these compounds individually had
distinct aromas during GC/O of rosy (phenylacetaldehyde), smoky/burnt (guaiacol),
and nutty/earthy (2,6-dimethylpyrazine), the flavor profile of the reference paste
changed in different ways upon compound addition, emphasizing the effect of
compound concentration and the effect of other components in the matrix.
In aroma evaluation, 6 out of 6 panelists agreed that the addition of
phenylacetaldehyde, guaiacol, and 2,6-dimethylpyrazine singly at the average
concentrations found during quantification, created notable and negative differences
from the control. In each of these models, a decrease in roasted peanutty aroma

164
was also observed. The addition of phenylacetaldehyde caused a green/plant-like
note, while the addition of guaiacol gave a darker roast character to the model as
compared to the control. 2,6-dimethylpyrazine, although adding a sweet, caramel
note at lower concentrations, became perceived as a sweet and rotten aroma at
higher concentrations. In the tasting models, phenylacetaldehyde added a
green/plant-like note at low concentrations, but created a stale/cardboardy character
at higher concentrations. Guaiacol added astringency, bitterness, and more ashy
and woody character to the flavor. 2,6-dimethylpyrazine added rotten notes to the
flavor, and also contributed to the perception of dark roast flavor. A combination of
these three compounds at their respective concentrations found in microwave
blanched peanuts created an aroma profile high in dark roast character, with more
astringency and tongue and throat burn, and less impact of positive characteristics
such as roasted peanutty attribute. The panel agreed that the combination of
phenylacetaldehyde, guaiacol, and 2,6-dimethylpyrazine each at a concentration of
one standard deviation above the average concentration found in the microwave-
blanched samples appeared to most closely mimic the off-flavor in microwave-
blanched peanuts.
The unique characters of these three compounds combine to form an off-
flavor which is difficult to define. Further work must be conducted to clarify the role
of 2,6-dimethylpyrazine. However, it appears that guaiacol contributes to the dark
roast/burnt flavor perceived in the microwave samples, and phenylacetaldehyde is
responsible for a green and cardboardy note which could be perceived as
stale/floral. In the future, these compounds could be used as chemical anchors for

165
sensory panelists analyzing process samples and would aid in the identification of
process-related off-flavors.
Conclusion
More than 200 aroma-active compounds contributed to the flavor of roasted
peanuts. Maillard reaction, lipid oxidation, and thermal degradation products
dominated the flavor profiles. Isolation of the compounds causing a microwave-
related off-flavor in peanuts was possible through solvent extraction/SAFE, GC/O,
GC/MS, threshold testing and model systems analysis. The stale/floral and ashy off-
flavor in microwave-blanched peanuts was related to increased concentrations of
phenylacetaldehyde, guaiacol, and 2,6-dimethylpyrazine. Increased and
unfavorable levels of these compounds may have been formed through Maillard
reactions and thermal degradation during the high temperatures attained during
microwave blanching. These findings are important because they further explore the
relative balance of the many aroma-active compounds which have been
documented in peanuts, and could possibly aid in enhancing quality control for
alternative processing techniques in peanut production.
Acknowledgments
This research was funded in part by the North Carolina Agricultural Research
Service. This is paper no. --- of the Journal Series of the Dept. Food Science, North
Carolina State University, Raleigh, NC 27695. The assistance of Mary Carunchia
Whetstine, Lisa Oerhl Dean, Evan Miracle and Joy Wright is gratefully

166
acknowledged. The use of trade names in this publication does not imply
endorsement by North Carolina Agricultural Research Service or USDA, ARS of the
products named nor criticism of similar ones not mentioned.

167
References
(ASTM) American Society for Testing and Materials. 1992. Standard practice for
determination of odor and taste thresholds by a forced-choice method of limits.
E-679-91. In: Annual book of standards. 15.07. Philadelphia, Pa.: ASTM. P
35-9.
Bouseta A, Scheirman V, Collin S. 1996. Flavor and free amino acid
composition of lavender and eucalyptus honeys. J Food Sci 61(4): 683-687.
Buckholz LL Jr, Daun H, Stier E, Trout R. 1980. Influence of roasting time on
sensory attributes of fresh roasted peanuts. J Food Sci 45: 547- 554.
Carunchia Whetstine ME, Cadwallader KR, Drake MA. 2005. Characterization
of aroma compounds responsible for rosy/floral flavor in Cheddar cheese. J
Agric Food Chem 53: 3126-3132.
Clark RG, Nursten HE. 1977. Analysis of the sensory term ‘nutty’ and a list of
compounds claimed to be nutty. International Flavours and Food Additives
8(5):197-201.
Cullere L, Escudero A, Cacho J, Ferreira V. 2004. Gas chromatography-
olfactometry and chemical quantitative study of the aroma of six premium
quality Spanish aged red wines. J Agric Food Chem 52: 1653-1660.
Delwiche SR, Shupe WL, Pearson JL, Sanders TH, Wilson DM. 1986.
Microwave vacuum drying effect on peanut quality. Peanut Science 13: 21-27.
Didzbalis J, Ritter KA, Trail AC, Pflog FJ. 2004. Identification of fruity/fermented
odorants in high temperature cured roasted peanuts. J Agric Food Chem 52:
4828-4833.
Engel W, Bahr W, Schieberle P. 1999. Solvent assisted flavour evaporation - a
new and versatile technique for the careful and direct isolation of aroma
compounds from complex food matrices. Eur Food Res Technol 209: 237-241.
Grosch W. 1993. Detection of potent odorants in foods by aroma extract dilution
analysis. Trends Food Sci Technol 4: 68-73.
Guth H, Grosch W. 1994. Identification of the character impact odorants of
stewed beef juice by instrumental analyses and sensory studies. J Agric Food
Chem 42: 2862-2866.
Ho C-T, Lee M-H, Chang SS. 1981. Isolation and identification of volatile
compounds from roasted peanuts. J Food Sci 47: 127-133.

168
Hoffpauir CL. 1953. Peanut composition: relation to processing and utilization.
Agricultural and Food Chemistry 1(10): 668-671.
Holscher W, Steinhart H. 1994. Formation pathways for primary roasted coffee
aroma compounds. In: Parliament TH, Morello MJ, McGorrin RJ, editors.
Thermally Generated Flavors: Maillard, Microwave, and Extrusion Processes.
Washington, DC: American Chemical Society. p 206-217.
Johnsen PB, Civille GV, Vercellotti JR, Sanders TH, Dus CA. 1988.
Development of a lexicon for the description of peanut flavor. J Sens Stud 3: 9-
17.
Johnson BR, Waller GR, Foltz RL. 1971. Volatile components of roasted
peanuts: neutral fraction. J Agric Food Chem 19(5): 1025-1027.
Karagul-Yuceer Y, Drake MA, Cadwallader KR. 2004. Evaluation of the
character impact odorants in skim milk powder by sensory studies on model
mixtures. J Sens Stud 19: 1-13.
Katz TA. 2002. The effect of microwave energy on roast quality of microwave
blanched peanuts. Master's Thesis, North Carolina State University, Raleigh,
NC.
Koehler PE, Odell GV. 1970. Factors affecting the formation of pyrazine
compounds in sugar-amine reactions. J Agric Food Chem 18(5): 895-898.
Lawless H, Harono C, Hernandez S. 2000. Thresholds and supra-threshold
intensity functions for capsaicin in oil and aqueous based carriers. J Sens Stud
15: 437-447.
Lee S-Y, Trezza TA, Guinard J-X, Krochta JM. 2002. Whey-protein-coated
peanuts assessed by sensory evaluation and static headspace gas
chromatography. J Food Sci 67(3): 1212-1218.
Maga JA. 1977. Alkylpyrazine levels in various vegetable protein flours.
Lebensmittel Wissenschaft und Technologie 10(2): 100-101.
Maga JA. 1982. Pyrazines in foods: an update. CRC Critical Reviews in Food
Science and Nutrition 16: 1-48.
Mason ME, Johnson B. 1966. Flavor components of roasted peanuts: some low
molecular weight pyrazines and a pyrrole. J Agric Food Chem 14(5): 454-460.
Mason ME, Johnson B, Hamming MC. 1967. Volatile components of roasted
peanuts: the major monocarbonyls and some noncarbonyl components.
J Agric Food Chem 15(1): 66-73.

169
Megahed MG. 2001. Microwave roasting of peanuts: effects on oil characteristics
and composition. Nahrung/Food 45: 255-257.
Meilgaard, MM, Civille GV, Carr BT. 1999. Selection and training of panel
members. In: Sensory Evaluation Techniques, 3
nd
ed. Boca Raton, Fl: CRC
Press. p 174-176.
Min DB, Lee, SH, Lee EC. 1989. Singlet oxygen oxidation of vegetable oils. In:
Min DB, Smouse TH, editors. Flavor chemistry of lipid foods. Champaign, IL:
American Oil Chemists' Society. p 57-97.
Newell JA, Mason ME, Matlock RS. 1967. Precursors of typical and atypical -
roasted peanut flavor. J Agric Food Chem (5): 767- 772.
Orr RV, Shewfelt RL, Huang CJ, Tefera S, Beuchat LB. 2000. Detection of
guaiacol produced by Alicyclobacillus acidoterrestris in apple juice by sensory
and chromatographic analyses and comparison with spore and vegetative cell
populations. Journal of Food Protection 63: 1517-1522.
Ory RL, Crippen KL, Lovegren NV. 1992. Off-flavors in peanuts and peanut
products. In: Charalambous G, editor. Developments in Food Science v. 29:
Off-Flavors in Foods and Beverages. Amsterdam, The Netherlands: Elsevier
Science Publishers. p 57-75.
Pattee HE, Beasley EO, Singleton JA. 1965. Isolation and identification of
volatile components from high-temperature-cured off-flavor peanuts. J Food
Sci 30: 388-392.
Pattee HE, Singleton JA. 1981. Peanut quality: its relationship to volatile
components - a review. In: ACS Symposium Series - American Chemical
Society, no. 170. p 147-161.
Pollnitz AP, Pardon KH, Sykes M, Sefton MA. 2004. The effects of sample
preparation and gas chromatograph injection techniques on the accuracy of
measuring guaiacol, 4-methylguaiacol and other volatile oak compounds in oak
extracts by stable isotope dilution analysis. J Agric Food Chem 52: 3244-3252.
Preininger M, Grosch W. 1994. Evaluation of key odorants of the neutral
volatiles of Emmentaler cheese by the calculation of odour activity values.
Lebensmittel Wissenschaft und Technologie 27: 237-244.
Revoredo CL, Fletcher SM. 2002. World peanut market: an overview of the past
30 years. The Georgia Agricultural Experiment Station Research Bulletin 437:
1-24.
Rychlik M, Schieberle P, Grosch W. 1998. Compilation of thresholds, odor

170
qualities, and retention indices of key food odorants. Deutsche
Forschungsanstalt fur Lebensmittelchemie and Institut fur Lebensmittelchemie
der Technischen Univ. Munchen. Garching, Germany. 50 p.
Sanders TH, Pattee HE, Vercellotti JR, Bett KL. 1995. Advances in peanut flavor
quality. In: Pattee HE, Stalker HT, editors. Advances in Peanut Science.
Stilwater, OK: American Peanut Research and Education Society, Inc. p 528-
553.
Sanders TH, Vercellotti JR, Blankenship PD, Crippen KL, Civille GV. 1989.
Interaction of maturity and curing temperature on descriptive flavor of peanuts.
J Food Sci 54(4): 1066-1069.
Sanders TH, Vercellotti JR, Grimm DT. 1993. Shelf life of peanuts and peanut
products. In: Charalambous G, editor. Shelf Life Studies of Foods and
Beverages. Amsterdam, The Netherlands: Elsevier Science Publishers. p 289-
309.
Schieberle P, Pfnuer P. 1999. Characterization of key odorants in chocolate. In:
Flavor Chemistry: 30 years of progress. New York: Kluwer Academic/Plenum
Publishers. p 147-153.
Schirack AV, Drake MA, Sanders TH, Sandeep KP. 2006. Impact of microwave
blanching on the flavor of roasted peanuts. J Sens Stud 21. Forthcoming.
Soares da Costa M, Goncalves C, Ferreira A, Ibsen C, Guedes De Pinho P, Silva
Ferreira AC. 2004. Further insights into the role of methional and
phenylacetaldehyde in lager beer flavor stability. J Agric Food Chem 52: 7911-
7917.
Suriyaphan O, Drake MA, Chen XQ, Cadwallader KR. 2001. Characteristic
aroma components of British Farmhouse Cheddar cheese. J Agric Food Chem
49: 1382-1387.
Van den Dool H, Kratz P. 1963. A generalization of the retention index system
including linear programmed gas liquid partition chromatography. J.
Chromatogr 11: 463-471.
Van Ruth S. 2001. Methods for gas chromatography-olfactometry: a review.
Biomol Eng 17: 121-128.
Vercellotti JR, Crippen KL, Lovegren NV, Sanders TH. 1992. Defining roasted
peanut flavor quality. Part 1. Correlation of GC volatiles with roast color as an
estimate of quality. In: Charalambous G, editor. Developments in Food
Science v. 29: Food Science and Human Nutrition. Amsterdam, The
Netherlands: Elsevier Science Publishers. p 183-206.

171
Vercellotti JR, Mills OE, Bett KL, Sullen DL. 1992b. Gas chromatographic
analyses of lipid oxidation volatiles in foods. In: St. Angelo AJ, editor. Lipid
Oxidation in Food. Washington, DC: American Chemical Society. p 232-265.
Warner KJH, Dimick PS, Ziegler GR, Mumma RO, Hollender R. 1996.
‘Flavor-fade’ and off-flavors in ground roasted peanuts as related to selected
pyrazines and aldehydes. J Food Sci 61(2): 469-472.
Whitaker TB, Dickens JW, Bowen HD. 1974. Effect of curing on the internal
oxygen concentration of peanuts. Transactions of the ASAE 17(3): 567-569.
Yoshida H, Hirakawa Y, Tomiyama Y, Nagamizu T, Mizushina Y. 2005. Fatty
acid distributions of triacylglycerols and phospholipids in peanut seeds (Arachis
hypogaea
L.) following microwave treatment. Journal of Food Composition and
Analysis 18: 3-14.
Young CT, Hovis AR. 1990. A method for the rapid analysis of headspace
volatiles of raw and roasted peanuts. J Food Sci 55(1): 279-280.

172
Table 1- Effect of high temperature microwave blanching on
sensory attributes
Attribute
Process
Control
Microwave
Blanched
Peanuts
Roast Peanutty
4.33a
a
4.28a
Sweet Aromatic
2.89a 2.81a
Dark Roast
3.02a 3.26b
b
Raw Beany
2.05a 1.90a
Woody/Hull/Skins
3.09a 3.11a
Cardboardy/Stale
0.61a 1.16b
Sweet Taste
2.54a 2.49a
Bitter
3.27a 3.38b
Astringency
1.02a 1.01a
Ashy
0.54a 0.82b
Total Offnote
1.19a 2.25b
a
Attribute intensities were scored using the 15-point Spectrum
TM
universal intensity scale (Meilgaard et al., 1999)
b
Means followed by different letters are significantly different
between treatments (p < 0.05)

173
Table 2- Model system concentrations in reference peanut paste
Model Compound
Added
Concentration
(ppb)
a
Reference
-- --
1
2,6-dimethylpyrazine 16401
2
2,6-dimethylpyrazine 17698
3
2,6-dimethylpyrazine 18996
4
Guaiacol 13.62
5
Guaiacol 18.33
6
Guaiacol 23.04
7
Phenylacetaldehyde 3236
8
Phenylacetaldehyde 3915
9
Phenylacetaldehyde 4594
10
2,6-dimethylpyrazine 16401
Guaiacol 13.62
Phenylacetaldehyde 3236
11
2,6-dimethylpyrazine 17698
Guaiacol 18.33
Phenylacetaldehyde 3915
12
2,6-dimethylpyrazine 18996
Guaiacol 23.04
Phenylacetaldehyde 4594
a
Concentrations calculated based on average, average +
σ
, average
+ 2
σ
as determined in quantification results

174
Table 3 - High impact aroma-active compounds in peanuts as determined by AEDA
RI
b
Log
3
FD Factors
c
No. Compound Fraction
Odor
a
DB-5MS DB-WAX
Control Off-
flavor
Method of
Identification
1
2-methylbutanal
NB
Chocolate/malty
653
907
6
9
RI, odor, MS
d
2
Toluene
NB
Sweet/chemical
756
1027
5
11
RI, odor, MS
3 2,3-butanediol
NB Fruity
803
1554
3
9
RI,
odor
e
4
Furfural
AC
Sweet
821
1468
5
7
RI, odor, MS
5
(E)-2-hexenal
AC
Fruity
844
1188
3
5
RI, odor, MS
6
Ethyl valerate
AC
Fruity
915
1116
6
6
RI, odor
e
7
2,6-dimethylpyrazine
NB
Nutty/earthy
934
1314
6
9
RI, odor, MS
8
Heptanal
NB
Fatty
937
1163
5
7
RI, odor, MS
9
(E,Z)-2,4-heptadienal
NB
Fatty
968
1399
<1
7
RI, odor, MS
10
2-ethyl-5-methylpyrazine
AC
Sweet/ fruity
981
1323
4
7
RI, odor, MS
11
Methyl hexanoate
AC
Sweet
1015
1154
5
7
RI, odor, MS
12 Furaneol
TM
(2,5-dimethyl-4-
hydroxy-3(2H)-furanone)
AC
Burnt sugar
1047
2046
8
7
RI, odor, MS
13
Phenylacetaldehyde
NB
Rosy/green
1058
1605
7
11
RI, odor, MS
14
Acetophenone
NB
Fruity/sweet
1080
1638
7
7
RI, odor, MS
15
Guaiacol
NB
Burnt
1089
1825
3
9
RI, odor, MS
16 2,5-dimethyl-3-
ethylpyrazine
AC
Brothy
1091
1416
7
4
RI, odor, MS
17 2-ethyl-3,5-
dimethylpyrazine
NB
Nutty/roasted
1095
1443
8
8
RI, odor, MS
18 Maltol
(3-hydroxyl-2-methyl-
4H-pyran-4-one)
AC
Cotton candy
1106
1936
6
5
RI, odor, MS
19 2,3-diethyl-5-
methylpyrazine
NB
Roasted
1153
1504
6
6
RI, odor, MS
20
Nonanal
NB
Green/floral
1159
1381
8
8
RI, odor, MS
21
4-ethylbenzaldehyde
AC
Burnt sugar
1163
1730
3
7
RI, odor
22 3-ethylphenol
NB Old
books/musty
1176
ND
f
6
8
RI, odor, MS
23 3,5-diethyl-2-
methylpyrazine
NB
Roasted
1184
ND
6
7
RI, odor, MS
24
Decanal
NB
Fried
1231
1485
4
3
RI, odor, MS
25
(E,E)-2,4-decadienal
NB
Fried/oxidized
1343
1740
7
4
RI, odor, MS
26
Decanoic acid
NB
Oxidized
1357
ND
7
8
RI, odor, MS
27 Delta-elemene
NB Wood
1361
ND
6
1
RI,
odor

175
28 4-acetoxy-2,5-dimethyl-
3(2H)-furanone
AC
Burnt sugar
1386
1981
7
6
RI, odor
29
Delta-decalactone
AC
Sweet/ fruity
1471
2209
5
7
RI, odor
30
Geranyl butyrate
NB
Rosy
1544
1888
3
8
RI, odor
31
Tetradecanal
NB
Honey/hay
1618
1931
6
2
RI, odor, MS
32
(E)-2-hexenoic acid
NB
Fatty
1632
1938
6
10
RI, odor
33
Pantolactone
AC
Burnt sugar
1689
1998
6
5
RI, odor, MS
34 Unknown
AC Sweet
N/A
352
5
6
Odor
35 Unknown
AC Sweet/malty
N/A
707
6
7
Odor
36
Benzaldehyde
AC
Sweet/malty
ND
1500
6
2
RI, odor, MS
37
Methyl cinnamate
AC
Strawberry
ND
2045
7
ND
RI, odor
38 3-methoxy-2,5-
dimethylpyrazine
AC Spicy/pepper
ND
1385
4
5
RI,
odor
a
Odor description by GC/O
b
Retention indices (RI) were calculated from GC/O data
c
Flavor dilution factors were determined on a DB-5MS column for neutral and basic compounds, and on a DB-WAX column for acidic
compounds
d
Compound identified by RI, MS data and odor character in comparison with the standard
e
Compound tentatively identified using RI data and odor character in comparison with standard
f
ND: not detected

176
Table 4 - Relative abundance of selected high aroma impact compounds in peanuts
Compound
RI on
DB-5MS
a
Concentration in
control (ppb)
b
Concentration in
off-flavored peanuts
(ppb)
Threshold in water
(ppb)
Threshold in oil
(ppb)
Decanoic acid
1357
25.7 ± 18.6
48.2 ± 61.3
10000
d
Not reported
2-methylbutanal
653
2613 ± 856
4024 ± 789
1
d
2.2
d
Heptanal
937
0.41 ± 0.03
0.14 ± 0.04
3
d
250
d
(E,Z)-2,4-heptadienal 968
ND
e
0.29 ± 0.05
Not reported
4000
d
2-ethyl-3,5-dimethylpyrazine
1095
5534 ±3117
6961 ± 495
0.04
d
2.2
d
3-ethylphenol
1176
14.9 ±4.5
16.5 ± 3.1
0.05
f
Not reported
3,5-diethyl-2-methylpyrazine
1184
554 ± 410
572 ± 28
Not reported
Not reported
Tetradecanal
1618
3.05 ± 1.98
0.63 ± 0.18
Not reported
Not reported
Compound
RI on
DB-Wax
c
Concentration in
control (ppb)
Concentration in
off-flavored peanuts
(ppb)
Threshold in water
(ppb)
Threshold in oil
(ppb)
Methyl hexanoate
1142
486 ± 471
72 ± 67
50
d
Not reported
(E)-2-hexenal
1188
77 ± 48
15 ± 11
17
d
424
d
2-ethyl-5-methylpyrazine
1323
3441 ± 1937
498 ± 149
100
h
Not
reported
2,5-dimethyl-3-ethylpyrazine
1416
352 ± 163
1239 ± 806
0.4
d
24
d
Furfural
1468
941 ± 514
536 ± 370
3000
d
Not reported
Benzaldehyde
1500
506 ± 250
328 ± 285
Not reported
Not reported
Maltol (hydroxymethylpyrone)
1936
303 ± 92
71 ± 59
210
g
Not reported
Pantolactone
1998
133 ± 44
126 ± 106
Not reported
Not reported
Furaneol
TM
2051
59 ± 52
17 ± 13
0.6
d
25
d
a
Retention indices (RI) were calculated from mass spectrometry results on a DB-5MS column
b
Average concentration ± standard deviation
c
RI calculated from flame ionization results on a DB-WAX column
d
Orthonasal threshold reported by Rychlik and others (1998)
e
ND - not detected
f
Retronasal threshold reported by Rychlik and others (1998)
g
Orthonasal threshold reported by Karagul-Yuceer and others (2004)
h
Orthonasal threshold reported by Maga (1977)

177
Table 5 - Quantification, sensory orthonasal threshold values, and odor activity values of selected compounds in peanuts
Nr. Compounds RI
on
DB-5MS
column
a
Concentration
in control
(ppb)
Concentration
in off-flavored
peanuts (ppb)
Threshold
in water
(ppb)
Threshold
in oil
(ppb)
OAV of
control
in
water
b
OAV of
control
in oil
OAV of
off-
flavored
peanuts
in water
OAV of
off-
flavored
peanuts
in oil
1
Toluene
756
104 ± 30
114 ± 23
527 ± 4
c
94660
c
0.2 0.001 0.2
0.001
2
2,6-dimethylpyrazine
944
15234 ± 2594
40009 ± 2773
g
718 ± 5
c
1021 ± 3
c
21 15 56
39
3
Phenylacetaldehyde
1058
4447 ± 1894
8266 ± 1505
f
2
d
154 ± 4
c
2224 29 4133
54
4
Acetophenone
1080
3.60 ± 0.16
3.2 ± 3.2
245 ± 6
c
5629 ± 6
c
0.015 0.001 0.01
0.0006
5
Guaiacol
1089
13.7 ± 0.6
29 ± 5
f
2.5
e
16
e
5.5 0.9 12 1.81
6 2,3-diethyl-5-
methylpyrazine
1148
2.2 ± 0.5
1.6 ± 0.3
0.09
e
0.5
e
24 4 18 3.2
7
Nonanal
1159
121 ± 79
168 ± 42
1
e
1000
e
121 0.1 168 0.17
8
Decanal
1231
3.7 ± 0.7
5.9 ± 0.5
0.1
e
6700
e
37 0.001 59
0.001
9
(E,E)-2,4-decadienal
1343
135 ± 85
28.9 ± 4.5
0.07
e
180
e
1929 0.8 413
0.16
a
Retention indices calculated from mass spectrometry results on a DB-5MS column
b
The odor activity value (OAV) is the ratio of the concentration to the threshold value of the compound
c
Orthonasal threshold experimentally determined from 35 panelists
d
Orthonasal threshold reported by Carunchia Whetstine and others (2005)
e
Orthonasal threshold reported by Rychlik and others (1998)
f
Concentration is significantly different from the control at p < 0.05
g
Concentration is significantly different from the control at p < 0.1

178
CHAPTER 6:
CONCLUSIONS AND FUTURE WORK

179
Conclusions
This research investigated the impact of different microwave blanching
parameters on the properties of roasted peanuts, and characterized the changes in
flavor which occur in peanuts during microwave blanching at high temperatures.
The microwave processing parameters best suited for blanching peanuts were first
identified. Processing treatments were differentiated by energy absorbed during
processing, average and maximum internal temperatures, loss in moisture content,
and blanchability. The best blanchability resulted from higher process temperatures
and greater loss in moisture content. Treatments exceeding 110 °C resulting in a
final moisture content of 5.5 % or less yielded blanchability values greater than the
85 % industry standard.
The effect of this alternative blanching technique on flavor was evaluated
using descriptive sensory analysis. A sensory panel determined that peanuts
reaching the highest internal temperatures (~ 128 °C) and resulting in the lowest
moisture content (4.5%) during blanching had the most total offnote flavor.
However, temperatures as high as 113 °C did not produce significant off-flavor. The
microwave-associated off-flavor was related to stale/floral and burnt/ashy flavors,
and was related inversely to positive flavor attributes such as roasted peanutty,
sweet aromatic, and sweet taste.
Analysis of the peanut flavor volatiles using GC/O, GC/MS, and threshold
testing revealed an increased formation of guaiacol, phenylacetaldehyde, and 2,6-
dimethylpyrazine in the off-flavored peanuts compared to that in a process control.
Model system work confirmed that increased concentrations of these compounds

180
caused the increased intensity of burnt and stale/floral characteristics noted by the
descriptive sensory panel. These compounds were only a small fraction of over 200
aroma-active compounds which were found to contribute to roasted peanut flavor
using GC/O. Increased and unfavorable levels of these compounds may have been
formed through Maillard reactions and thermal degradation during the high
temperatures reached in microwave blanching. This research also confirmed the
importance of Maillard reaction and lipid oxidation compounds in the peanut flavor
profile. However, as the results show, even increased concentrations of compounds
which are commonly found in good quality peanuts can lead to an imbalance in the
flavor profile and cause the perception of an off-flavor.
This research has helped improve the peanut lexicon, and has further
characterized the extraction techniques best suited for the volatile analysis of
peanuts. The analysis of an off-flavor that was difficult to define was made possible
through the introduction of the total offnote term to the peanut lexicon, which was
used successfully to differentiate the effects of microwave treatments. Further
additions were made to the lexicon, such as the attribute “ashy”, which was
referenced by the aroma of cigarette ash. In instrumental analysis, solvent
extraction and SAFE were deemed more suitable than static headspace methods for
analysis of aroma-active peanut compounds generated during the high temperatures
in microwave blanching, indicating that compounds of higher molecular weight and
moderate volatility had the highest impact on flavor.
This research is important because it illustrates the importance of the relative
concentrations of the many aroma-active compounds found in peanuts. Although

181
microwave technology may provide many advantages during blanching, its effects
on the formation of flavor compounds must be considered. This research could aid
in training sensory panels to evaluate processing-related off-flavors, because
guaiacol and phenylacetaldehyde could be used as chemical standards to define the
burnt/ashy and stale/floral off-flavors which can occur during high temperature
processing. Through this project, it was determined that it is possible to achieve
acceptable blanchability in peanuts using microwave blanching while minimizing the
possibility of an off-flavor.

182
Future Work
In future work, analysis of peanut flavor compounds before roasting may
further illuminate the chemical changes caused by microwave blanching. During
roasting, many flavors originating from the raw product might be obscured, as was
seen in green coffee beans (Yeretzian and others 2002). In addition, more chemical
anchors (standards) could be assigned to the attributes in the peanut lexicon. Just
as certain fruity esters and short chain organic acids have been associated with the
fruity/fermented off-flavor (Didzbalis and others 2004), and guaiacol can be used to
demonstrate the attribute of ashy, other chemical standards could be established.
This would help in the training of panelists and could provide a basis to further
instrumentally classify differences between peanut varieties as well as peanuts from
different geographical locations, which have been shown to vary in flavor (Sanders
and others 1992). This research demonstrated that we do not fully understand the
importance of the relative concentrations of aroma compounds needed to achieve
good quality peanut flavor. To aid this understanding, omission experiments (in
which one or more compounds are omitted from an aroma model) could be
conducted to pinpoint those compounds key to peanut flavor, as for example has
been done in coffee (Grosch 2001; Czerny and others 1999).
Peanuts are not only valuable for their flavor attributes, but also for their
nutritional benefits, some of which may not be known to the average consumer.
Peanuts are a good source of mono- and polyunsaturated fats (Hoffpauir 1953),
which have been connected to better heart health in nutritional literature (Kris-
Etherton and others 2001), and phytosterols such as beta-sitosterol, which may

183
protect against colon, prostate, and breast cancers (Awad and others 2000). Also,
like red wine and grapes, peanuts are a good source of resveratrol, which has been
associated with reduced cardiovascular disease and anticarcinogenic properties
(Sanders and others 2000). Furthermore, peanuts contain significant amounts of B
vitamins and tocopherol (Hoffpauir 1953), which play important roles in heart and
nervous system health. Although these nutritional benefits will make peanuts more
marketable to consumers, some of these components are also heat and process-
sensitive. Polyunsaturated fats are several times more prone to oxidation (Min and
others 1989), and vitamins are well known to degrade at high processing
temperatures (Lund 1982). The effect of microwave blanching and microwave
roasting on components such as vitamins, polyunsaturated fatty acids, resveratrol,
and beta-sitosterol could be assessed. If significant losses of these compounds
could be prevented using microwave blanching or microwave roasting, it would
further increase the value of this product.

184
References
Awad AB, Chan KC, Downie AC, Fink CS. 2000. Peanuts as a source of beta-
sitosterol, a sterol with anticancer properties. Nutrition and Cancer 36(2):238-
241.
Czerny M, Mayer F, Grosch W. 1999. Sensory study on the character impact
odorants of roasted Arabica coffee. J Agric Food Chem 47:695-699.
Didzbalis J, Ritter KA, Trail AC, Pflog FJ. 2004. Identification of fruity/fermented
odorants in high temperature cured roasted peanuts. J Agric Food Chem 52:
4828-4833.
Grosch W. 2001. Evaluation of the key odorants of foods by dilution
experiments, aroma models, and omission. Chemical Senses 26(5): 533-545.
Hoffpauir CL. 1953. Peanut composition: relation to processing and utilization.
Agricultural and Food Chemistry 1:668-671.
Kris-Etherton PM, Zhao G, Binkoski AE, Coval SM, Etherton TD. 2001. The
effects of nuts on coronary heart disease risk. Nutrition Reviews 59(4):103-
111.
Lund DB. 1982. Influence of processing on nutrients in foods. Journal of Food
Protection 45(4):367-373.
Min DB, Lee, SH, Lee EC. 1989. Singlet oxygen oxidation of vegetable oils. In:
Min DB, Smouse TH, editors. Flavor chemistry of lipid foods. Champaign, IL:
American Oil Chemists' Society. p 57-97.
Sanders TH, McMichael RW Jr, Hendrix KW. 2000. Occurrence of resveratrol in
edible peanuts. J Agric Food Chem 48:1243-1246.
Sanders TH, Vercellotti JR, Crippen KL, Hinsch RT, Rasmussen GK, Edwards
JH. 1992. Quality factors in exported peanuts from Argentina, China, and the
United States. JAOCS 69(10): 1032-1035.
Yeretzian C, Jordan A, Badoud R, Lindinger W. 2002. From the green bean to
the cup of coffee: investigating coffee roasting by on-line monitoring of
volatiles. European Food Research Technology 214:92-104.

185
APPENDICES

186
Appendix 1:
Analysis of Peanut Volatiles by Solvent Extraction, SAFE, GC-O, and GC-MS
Standard Operating Procedure
Extraction
(1 day)
1. Make saturated salt solution: 50g NaCl to 300mL dI water. Add salt until some
precipitates out.
2. Weigh out sample: 2x50g for rep 1, 2x50g for rep 2. Weigh directly into plastic
extraction bottles.
3. Make up internal standard with concentration of 50
μL 2-methyl-3-heptanone,
50
μL 2-methyl valeric in 5 mL methanol. In sample, use 15μL istd per bottle
x2bottles ( = 30
μL per rep).
4. Add 50 mL of NaCl solution to each bottle.
5. Add 50 mL ethyl ether anhydrous per bottle (HPLC or spectral grade).
6. Make sure cap is tight, place on shaker and shake for 30 minutes at speed 8.
7. Centrifuge bottles - make sure centrifuge is balanced. Angular velocity = 3x1000.
Be sure to screw on both lids of the centrifuge. Set timer for 15 minutes and
start.
8. Pull off top layer of ether and put in mason jar. Put jar in freezer between
shaking/centrifuging. Use 1 jar per replicate = 2 jars total.
9. Repeat three times, only adding ether for subsequent repetitions. This will result
in 300mL per rep (50mL x 2 bottles/rep x 3 extractions).

187
SAFE
(3 SAFE's can be done in 1 day)
(If the sample was in the freezer overnight, allow it to warm up early at RT)
1. Make sure blue ball valve on vacuum system is closed (nearest to pump).
2. Turn on the rough pump to achieve 10
-2
Torr (turn on gauge), and plug in the fan.
3. Fill waterbath with 40-50°C water and plug in so it can warm up.
4. Assemble the SAFE apparatus:
¾
Put Teflon threaded pieces and associated o-ring on any glass part without
threads. Also, a sample stopper and stopcock are needed.
¾
There are 4 parts to the SAFE: a round bottom flask, elbow, trap, and the
main unit.
¾
Connect elbow and trap, and clamp into place.
¾
Attach this to the second trap (leave in dewar). Put traps as deep as possible
into dewars.
¾
Make sure configuration is completely horizontal, and then loosely attach
SAFE apparatus to ring stand. Fit nose of SAFE into neck of trap.
5. Open blue valve slowly to 1/2 way, and wait to stabilize. Then connect SAFE – if
it’s not going in easily, change angle of the SAFE apparatus. Use the vacuum to
pull the SAFE into place. Avoid applying torque while attaching SAFE to trap -
screw in and back off as necessary. Tighten as much as you can by hand (use
gloves).
6. Wait until pressures stabilize to 10
-2
Torr, then turn on the small diffusion pump
(small metal switch).

188
7. If target pressures are not reached in 15 minutes, check for leaks. When open
fully, should get to 10
-3
and 10
-4
before proceeding.
8. Fill up dewars with liquid nitrogen.
9. Attach 2 sets of heating tape - tie to sample chamber, wrap to right of stopcock
and over neck of first trap, and use the second tape to cover the neck of the
round bottom flask. Leave access to all threads.
10. Attach water hoses – allow for a slow stream on exit to the sink.
11. Plug in heating tape and turn on.
12. Make sure all fittings tight, and make sure stopcock is closed.
13. Add sample to top chamber, then slowly open stopcock to let drops of extract into
round bottom flask.
14. After all of the extract is introduced, pour ether in as wash (~30mL). Rinse both
the glassware used, and inside of chamber.
15. Let SAFE distillation run approximately 2 hours. It is done when you can no
longer see boiling in round bottom flask.
16. Refill liquid nitrogen in dewars and cover (aluminum foil); make sure nitrogen
levels are full during entire run and periodically check waterbath temperature.
17. NOTE: Make sure the sample does not freeze during the SAFE procedure –
apply heating tape far down the neck of the round bottom flask, and make sure
water levels in the bath are sufficiently high enough.
When SAFE is completed:
1. Close blue valve.

189
2. Turn off waterbath.
3. Turn off circulating water and heating tape.
4. Turn off fine pump, then rough pump. Allow 20 minutes to cool.
5. Release vacuum (loosen stopcock). Detach SAFE from trap.
6. After fan cools off, unplug it.
7. Put frozen trap into dewar with room temperature water in the hood, and allow to
defrost.
8. Transfer sample into small jar, and wash elbow with ether for remaining sample.
9. Label this with 1) date 2) experimenter’s name and 3) extraction step using
colored lab tape and sharpie.
10. Clean SAFE with hot soapy water and in base bath, then bake dry in oven.
11. Put extract under nitrogen to evaporate to 20 mL. This will take about 30
minutes – do not allow to go to dryness! It is easier to transfer extract to test
tube for evaporation of last few milliliters.
Phase Separation
(1 day)
1. Wash concentrate with 3mL of 0.5M Na
2
CO
3
. Shake for 10s, and take off water
layer (water is on bottom, use long pipette).
2. Repeat for 2 washes total.
3. Wash with 2mL saturated NaCl, and take off water layer.
4. Repeat this twice for 3 washes total.
5. The ether phase at this point is the Neutral Basic fraction. Label this as “Stock
NB1”.

190
Aqueous Phase
1. Use fresh pipettes for the next segment.
2. Lower pH to 2.0 with 18% HCl w/v. Initial pH is ~11, and this usually requires 2
pipettes’ full of acid.
3. Re-extract with 5 mL ether. Take off ether layer (top), and leave ~1mm above
meniscus. If water gets into sample, freeze overnight and separate.
4. Repeat for 3 washes total.
5. This ether layer is the Acid fraction.
Filtering with Sodium Sulfate
Make sodium sulfate columns
1. Fill MonStr pipettes partway with glass wool, pack wool towards bottom.
2. Fill pipette halfway with sodium sulfate (anhydrous, reagent grade) which has
been baked in the oven (deodorized).
Filtration
1. Tape 2 sodium sulfate columns together, and shake columns to loosen powder.
2. Filter samples through columns into a new, smaller test tube. Don’t let columns
go dry.
3. Dry down sample to less than 2mL under nitrogen.
4. Label GC vials for the fractions: each fraction (NB, Acid) has 2 GC vials (one
with insert, one without). For one sample that includes 2 replicates, you will have
8 vials total.

191
5. Filter through a third sodium sulfate column into a GC vial without insert.
6. Dry to 0.5 mL under nitrogen.
7. Transfer 200
μL to second GC vial with insert, and save remaining 300 μL in
freezer.
8. Blow down sample in insert to 50
μL immediately before starting GC analysis.
GC-O Analysis
1. Use HP 5890 with FID and sniffing port.
2. Both the neutral/basic and acidic fractions are analyzed from every extraction.
3. Two
μL are injected using the sandwich technique into a polar capillary column
(DB-WAX) and into a nonpolar column (DB-5). For injection, 2 µL ether, 1 µL air,
and then 2 µL of sample are drawn into a 10 µL injection syringe.
4. Three experienced panelists will sniff the neutral/basic and acidic fractions of
peanut paste extracts on two different columns. The samples will be described
and scored using a 5-point scale.
GC-MS Analysis
1. Use 6890N GC / 5973 MSD and DB-5MS column.
2. Each extract (1
μL) is injected in the splitless mode.
3. Duplicate analyses are performed on each sample.

192
Appendix 2: Quantification of Peanut Volatiles
First, identify the target compounds in the project by GC/MS and GC/FID
based on the retention index, odor property, and mass spectra as compared to
standards. Calculate relative abundance for a general idea of the compound
concentration, and then quantify to find absolute abundance.
To quantify compounds, follow the procedure in Appendix 1, with the following
exceptions:
1. Before beginning, calculate the stock solutions of the compound standards.
Make the highest concentration first, and dilute accordingly to make 5 levels
of standards. Convert all concentrations to a weight per volume basis, using
the compound density. Be sure not to add more than 500
μL or less than
2
μL of the standard to any sample.
2. Make a table to carefully detail the amount of standard added to each
concentration level. Don’t forget the internal standard.
3. Make the stock solutions in methanol, and add these to 100 mL of deodorized
deionized water at the calculated concentrations. All standards can be
extracted at once, unless there are co-eluting peaks.
4. Add 50 mL of ether to each sample, and continue with the procedure in
Appendix 1 from this point on.
5. For GC/MS analysis, inject each of the 5 levels of standard at least 3 times.
Inject each NB fraction on the GC/MS and each acid fraction on the DB-WAX.
Consider using a dedicated syringe for these standards to avoid

193
contamination, and run a blank on the GC/MS to be certain that the syringe is
clean.
6. Record the ratio of the peak area of each compound to the peak area of the
internal standard, and construct a standard curve. This standard curve must
be linear, and should have an R
2
greater than 0.85. Place the concentration
ratio on the x axis (concentration of the compound / concentration of internal
standard). Place the area ratio on the y axis (peak area of the compound /
peak area of the internal standard). The response factor is calculated as the
inverse of the slope of this line.
7. To calculate the absolute abundance of the compound:
Conc. of cmpd = response factor * (area of cmpd/area of istd) * (conc. cmpd / conc. of istd)

194
Appendix 3: Summary of Aroma-Active Compounds Found in
Peanut Samples Using Aroma Extract Dilution Analysis (AEDA)
Table 1: Aroma Active Compounds in Reference Peanuts Detected by
Gas Chromatography-Olfactometry
RI
c
Fraction
a
Odor
b
DB-5 DB-
WAX
Intensity
d
AC sweet
e
352
1.5
AC burnt
628
1.5
NB chocolate/malty
653
2.5
AC fruity
667
1.5
NB sweet/malty
678
2.0
AC vinegar
691
1.8
NB garlic/onion
700
1.5
NB malty
702
1.5
AC sweet/malty
707
1.7
NB fatty
710
1.5
AC lemony
714
2.0
NB nutty/malty
747
1.5
AC plastic/chemical
752
1.5
NB sweet/acrid/chemical
760
2.0
AC chocolate/sweet
763
1.8
AC onion
772
1.5
AC malty
783
2.0
NB sweet/chocolate/malty 809
3.5
NB malty/fruity
810
1.5
NB corn
chip/smoky
814
1.5
AC sweet
821
1.0
AC chemical/rubber
833
2.0
AC fruity
840
1.5
NB onion/brothy
860
1.4
NB sweet/fruity
886
2.0
NB grape
886
2.0
AC malty/chocolate
898
2.5
NB burnt
sugar
906
2.0
NB chocolate
907
2.5
NB sweaty
910
3.5
AC dried
apricots/cheesy 929
3.5
NB peanutty/earthy
930
3.8
NB corn
chip/fatty
931
4.0
NB onion
947
2.2
NB potato/brothy
965
3.3
NB sweet
972
1.5

195
AC nutty/burnt
975
1.5
NB cabbage/garbage
977
3.3
NB fried
977
3.0
AC sweet
980
1.5
NB metallic/mushroom 986
2.5
NB potato
992
1.5
NB roasted/nut
998
2.5
AC sweaty
999
2.0
AC burnt/cabbage
1001
1.5
NB fruity/sweet
1003
2.3
NB popcorn/musty
1004
4.5
NB fruity/citrus
1006
3.0
AC bubble
gum
1008
2.0
AC sour/burnt
1010
2.0
NB peanutty
1021
2.0
NB nutty/corn
chip
1023
2.0
NB green/spicy
1025
1.8
NB fruity/chemical
1026
3.2
NB green
1031
2.0
AC sweaty/musty
1036
2.0
NB brothy/nutty
1037
3.0
AC fruity/burnt
sugar
1043
2.0
NB plastic
bottle
1047
2.0
NB skunk
1052
2.7
AC nutty/roasted
1054
1.5
NB burnt/burnt
sugar
1058
5.1
NB rosy
1060
2.8
NB dirty/floral/fatty
1068
3.0
AC chemical
1071
2.0
NB sweet/nutty
1081
1.5
NB dirty
1082
1.5
NB fruity/sweet
1087
1.5
AC sweet
1090
1.5
NB burnt
1091
3.8
NB chemical/fruity
1092
3.0
NB nutty
1093
2.8
NB popcorn
1093
1.5
NB burnt/brothy
1100
4.0
AC chemical/ammonia
1105
2.0
AC green
peanuts
1106
3.0
NB fruity
1107
3.0
NB dusty/rubber
1111
2.5
AC sugary/
stale
1112
3.5
NB citrus
1113
1.8
NB animal/brothy
1113
3.0
AC fruity
1116
2.5

196
NB roasted/nutty
1130
2.4
AC burnt/dusty/sweet
1130
2.0
NB bubble
gum/fruity
1136
2.8
NB popcorn
1137
1.5
AC burnt,
sweet
1143
2.0
NB rubber/sulfur
1144
2.0
NB nutty
1148
3.0
NB pine/spicy
1158
2.0
NB green/floral
1159
3.0
AC nutty/chemical
1159
2.8
AC sweet/fruity
1163
1.5
NB burnt/roasted
nuts 1165
4.0
AC chemical/sweet
1166
2.5
AC maple
syrup
1169
3.7
NB old
books
1176
3.5
NB burnt
sugar
1183
2.0
NB fried/popcorn
1183
1.5
NB roasted
1185
2.8
NB dusty/foul/green
1187
4.0
NB sweet/chemical
1192
3.3
AC
burnt sugar
1196
2.3
AC sweet/fruity
1198
1.5
NB
spicy
1205
2.0
NB roasted/burnt
1208
2.0
NB garlic
1211
2.0
AC sweet/fruity
1212
2.5
NB nutty/green/plastic
1215
3.5
NB pungent/frier
oil
1216
3.2
NB rosy/floral
1218
2.8
AC musty/urine
1222
3.6
NB cheesy
1226
2.0
NB fried
1231
2.2
NB fruity
1233
2.7
NB spicy/green
1237
3.0
AC floral/spicy/sweaty 1241
3.0
NB metallic/mushroom
1248
4.0
NB potato/green
1249
4.0
AC spicy/garlic
1251
2.5
AC burnt
sugar
1254
2.3
NB cuke/floral
1255
1.8
NB burnt/roasted
nuts
1260
3.0
AC chemical
1262
2.0
NB roasted/sweet
1265
1.5
NB oxidized/nutty
1267
2.3
NB popcorn
1277
4.5
NB sweet
1282
1.5

197
AC oxidized
1289
1.5
NB dusty/nutty/popcorn
1290
3.5
NB burnt/nutty
1291
2.5
NB catty
1299
3.5
AC popcorn
1300
3.5
NB fruity
1304
3.5
NB nutty/roasted/earthy 1308
2.0
AC sweaty/cheesy
1310
2.0
NB fatty/stale
1313
3.5
NB dusty/catty/chemical 1317
5.0
AC sweaty
1318
2.0
NB floral
1319
2.8
NB cabbage
1322
3.7
AC bubble
gum/fruity
1323
2.3
NB burnt
1328
2.0
NB fruity
1328
3.0
NB solvent
1335
3.0
NB
burnt/roasted
1336
3.5
NB parmesan
cheese
1339
4.0
NB fried/oxidized
1343
4.0
NB glue/solvent
1343
3.0
NB sweet/green/peanuts 1345
3.5
NB
fake peanut butter
1346
2.5
NB coconut
1349
2.0
NB bready
1351
3.0
AC fruity
1354
3.0
NB fatty/licorice/oxidized
1355
2.7
AC catty
1358
1.5
NB wood/campfire
1361
3.5
NB popcorn/corn
chip
1364
3.5
AC vinegar/cabbage
1365
3.5
NB floral/musty
1368
3.5
NB spicy/skunk
1368
3.0
NB nutty
1377
5.0
NB green/geranium
1381
4.0
NB burnt/smoke
1381
4.0
AC sugary
1386
2.5
NB stale/fatty
1389
4.0
AC spicy
1395
4.0
NB potato
1398
3.7
NB chemical/nutty
1401
5.5
AC burnt/chocolate
1401
3.3
NB hay/sweet/licorice 1405
3.3
NB parmesan/nutty
1411
3.0
NB chemical/marker
1414
3.8
AC brothy
1416
3.5

198
NB burnt
potatoes
1428
4.0
NB grainy/metallic
1436
2.5
AC chocolate/dark
roast 1437
2.8
AC burnt/bell
pepper
1440
2.8
NB fried/nutty
1442
2.5
NB oxidized
1454
3.5
AC glue/sweet
1456
2.0
AC citrus
1458
2.5
AC sweet
1468
2.0
NB nutty
1469
3.5
AC burnt
sugar
1470
2.0
NB brothy
1473
1.5
AC
sweet and mossy
1477
2.0
NB bell
pepper/oxidized 1481
3.5
NB carpet
1483
2.0
AC sour/vinegar
1484
2.0
AC rosy
1485
2.0
AC fatty
1487
1.5
NB metallic
1489
3.0
AC sweaty
1494
2.0
AC sweet/vanilla/floral 1498
2.8
AC burnt
1498
1.5
AC sweet/malty
1500
2.0
NB nutty/chemical
1503
3.4
NB nutty
1504
2.5
NB hay/fatty
1509
2.8
AC plastic/chemical
1527
2.0
AC malty/sweaty
1528
2.0
NB solvent/nutty
1535
3.0
AC vinegar/vegetable
1540
2.0
AC rosy
1547
2.5
AC cheesy/sweet
1549
4.0
NB peanut
butter
1553
3.3
NB nutty/roasted
1556
1.5
NB burnt/sour
1565
3.0
AC sour/stinky
1567
2.0
NB rosy
1553
2.1
NB rosy
1572
5.6
AC cheese
popcorn
1572
3.5
NB floral/nutty
1577
4.0
AC vanilla
1582
2.0
AC sweaty/malty
1592
4.3
AC rosy
1594
1.8
AC rosy
1606
5.0
AC cheesy/sweaty
1606
3.0
NB roasted/sweet
1609
3.0

199
NB brothy
1612
3.5
NB honey/hay
1618
2.0
NB
woody/smoky
1625
1.5
NB fatty
1632
2.0
NB floral
1633
2.5
NB fruity/Juicy
Fruit
1638
2.0
AC brothy/sweaty
1645
5.0
NB stale/cucumber
1651
4.0
NB brothy
1654
2.0
NB woody/smoky/sweet 1658
2.0
AC orange/citrus
1666
2.5
NB nutty/burnt
1677
3.0
AC sweet/solvent
1680
1.8
AC sweaty/swiss
cheese 1680
4.0
NB fatty
1693
2.3
NB popcorn
1697
1.5
NB brine/broth/roasted 1710
1.0
AC chemical/sulfur
1728
1.8
AC dirty/sweaty
animal
1734
4.5
AC burnt
sugar
1735
2.8
NB garlic
1750
1.5
NB oxidized
1759
3.5
AC solvent/spicy/floral 1760
1.5
AC burnt
sugar
1763
1.5
NB rosy
1763
2.5
NB grainy
1770
2.0
AC minty/tobacco/hay
1784
3.3
NB meaty/smoky
1787
3.5
NB oxidized
1793
3.5
AC burnt
sugar
1801
2.0
AC floral/pungent
1813
2.0
AC sugary
1825
2.0
NB sweet/spicy/stale
1827
3.0
NB peanut
butter
1855
2.0
NB brothy/oxidized
1886
2.8
AC hay
1888
1.5
AC sweet/strawberry
1895
2.0
NB nutty
1903
1.5
AC
burnt sugar/ cotton
candy
1913
2.5
AC menthol
1933
2.0
AC burnt
sugar
1937
2.0
AC toast
1939
3.0
NB oniony/nutty
1945
2.5
AC burnt
toast/burnt
sugar
1987
3.0

200
AC burnt
sugar
1988
3.3
NB peanut
butter
1992
2.5
AC toasted
marshmallow 2008
3.0
AC smoky
2016
2.5
NB brothy/meaty
2017
3.0
NB sweet/papery
2023
2.3
NB solvent/spicy
2025
2.0
NB metallic/papery
2049
2.5
AC burnt
sugar
2051
3.0
AC fake
strawberry
2059
3.5
AC burnt/sulfur
2061
2.0
NB meaty/nutty
2070
2.5
NB sweaty/nutty
2085
1.8
AC sweet/hay
2089
1.5
NB oxidized
2091
1.5
NB toast
2099
3.0
NB fruity
2109
1.5
AC sweet/strawberry
2120
2.5
NB sweet/grainy
2128
2.0
AC maple/cotton
candy
2158
2.0
NB spicy/cinnamon/pumpkin
spice
2163
2.5
NB burnt/nutty
2180
2.0
AC burnt
sugar/strawberry
2198
2.3
NB grainy/sweet
2223
2.0
AC tealeaves/smoky
2239
2.5
NB sweet/spicy
2262
2.0
AC brothy/meaty/smoked 2330
3.0
a
Fraction in which odor was detected, AC = acid, NB = neutral/basic
b
Odor description by GC/O
c
Retention indices (RI) calculated from GC/O data
d
Odor intensity for each compound averaged from panelist data
e
Compounds in bold were determined to have high impact on flavor
through subsequent AEDA analysis (Schirack et al., 2006).
AEDA was conducted on the DB-5 column for NB compounds,
and on the DB-WAX column for AC compounds.

201
Table 2: Aroma-Active Compounds in Microwave-Blanched
Peanuts Detected by Gas Chromatography-Olfactometry
RI
c
Fraction
a
Odor
b
DB-5 DB-WAX Intensity
d
NB sweet
e
355 1.5
NB fruity
556
1.5
NB painty
594
1.5
NB chocolate/malty
636
2.7
AC vinegar
666
3.5
NB onion
678
2.0
NB chocolate
693
2.0
AC sweet
699
1.5
NB sweet/malty
702
2.5
AC rubber
739
1.5
NB sweet
743
1.5
NB burnt/roasted
747
2.0
NB plastic/sweet
780
2.0
NB fruity
803
2.0
AC sweet/fruity
807
1.5
NB malty/chocolate
807
2.0
AC grassy/hay
809
1.5
AC sweaty
815
2.0
NB ammonia
820
2.0
NB sweaty
822
2.5
NB onion
823
1.8
NB malty/chocolate
839
3.2
AC burnt
sugar/fruity
844
1.5
AC grainy
851
1.5
AC green
853
1.5
AC popcorn
858
1.5
AC butyric/cheesy
868
2.5
NB beany
876
1.5
NB garlic
882
2.5
NB roasted/potato/bread 890
1.8
AC buttery
906
3.0
NB caramel/malty
908
2.5
AC sweaty
909
3.6
NB fishy/oxidized
909
2.5
NB plastic
910
2.5
NB buttery
912
3.0
AC dried
apricots/fruity
922
3.8

202
NB fatty/potato
930
3.3
AC nutty/sweet/roasted
937
1.5
NB potato/fatty
937
3.3
NB onion
939
2.5
AC barnyard
940
3.5
AC malty
943
2.0
NB nutty/earthy
944
4.3
AC bo/sweaty
965
3.0
NB buttery
potato/fatty 968
2.0
NB cheesy
969
2.0
NB spicy
970
2.0
NB plastic
bottle
975
2.0
AC citrus
979
1.8
AC sweet/fruity
981
2.0
NB baked
potato
988
2.0
NB onion
989
2.5
NB onion
992
3.0
NB burnt
994
2.0
NB sweet/fruity
995
1.5
NB corn
chip
1002
3.5
NB toffee
1002
2.0
NB metallic/mushroom
1002
3.5
NB fruity/citrus
1010
2.4
NB peanut
candy
1011
3.0
NB solvent
1012
2.5
NB old
books
1012
1.5
AC sweet
1015
1.5
NB malty/buttery
1024
2.5
NB sweet/chemical
1027
2.0
AC citrus/orange
1034
2.0
AC geranium
1036
3.0
NB nutty
1039
2.4
NB green
1046
2.3
AC sweet/burnt
sugar
1047
2.5
AC vinegar
1049
1.3
NB plastic/rubber/chemical
1050
2.8
NB roasted
1057
1.5
NB rosy/green
1058
4.8
NB popcorn
1063
2.0
NB nutty/cheesy
1064
2.5
NB burnt
plastic/weeds
1071
2.8
NB oxidized
1071
3.0
NB brothy/potato
1074
2.5
NB fruity
1080
2.9

203
AC cedar
1081
3.0
AC burnt
sugar/nutty
1086
1.8
NB popcorn
1087
2.5
NB burnt
1089
3.0
NB dusty/rubber
1094
3.0
AC charred/brothy
1095
3.3
NB peanuts
1095
2.5
NB sweet/fruity
1095
2.8
NB chemical/cabbage
1101
2.5
AC cotton
candy
1102
4.1
NB minty
1109
3.0
NB fried
1112
3.5
AC geranium/nutty/roasted
1113
3.5
AC fruity
1120
2.3
NB green
1122
2.0
NB ammonia/brothy
1128
3.5
NB popcorn
1139
2.8
NB green/floral
1142
2.3
NB minty
1142
3.0
AC burnt
sugar/dusty
1145
2.3
NB burnt
1151
4.0
NB sweet/roasted
1153
2.0
AC burnt
sugar
1154
2.0
NB smoky/dirty
1155
3.8
NB cucumber/floral
1159
3.5
NB nutty
1159
2.5
NB paremsan/fatty
1163
2.5
AC burnt
sugar
1163
4.3
NB cabbage
1168
2.0
NB carpet
1171
4.3
NB metallic
1172
2.5
NB green/weedy
1172
2.0
NB old
books
1176
3.0
NB solvent
1182
1.5
NB sweaty
1182
3.0
NB roasted/popcorn
1184
3.8
NB oregano
1184
2.0
AC caramel
1185
2.8
NB bell
pepper
1186
3.0
AC fruity
1188
1.8
NB wine
1188
3.5
NB sour
1196
2.3
NB burnt
1197
2.0
NB sulfur/fatty
1201
3.0

204
NB rosy
1202
2.8
NB malty
1205
2.0
NB potato/fatty
1211
3.8
NB plastic
bottle
1218
1.5
NB licorice
1220
4.2
AC sulfur/rubber/exhaust 1223
4.2
NB fried/oxidized
1231
4.0
NB dish
soap
1232
2.0
NB garlic
1232
2.3
AC sweet/burnt
sugar
1236
1.8
NB citrus/green
1239
3.0
AC burnt
sugar
1240
2.3
NB catty/weeds
1243
3.3
AC fruity
1246
2.0
NB smoke/burnt
1257
3.0
NB solvent/sweet
1257
1.5
NB sweat
1257
2.0
NB citrus
1263
2.8
NB sweet/spicy
1264
3.0
NB floral/cucumber
1267
3.0
NB mushroom/metallic
1270
3.3
NB burnt
rubber
1275
3.5
NB nutty
1277
3.5
NB popcorn
1278
3.5
AC sweet/fruity
1281
2.3
NB vegetable/green
1286
3.0
AC waxy
1292
2.0
NB fecal/mothball
1294
3.5
NB spicy
1295
3.0
NB nutty
1303
4.5
NB oxidized/licorice
1309
3.5
NB wine/alcohol
1318
2.5
AC roasted
1319
1.5
NB rosy
1322
3.0
AC bubble
gum/fruity
1323
2.0
NB bell
pepper
1330
3.0
NB catty
1334
4.9
NB vinegar
1334
3.8
AC burnt
sugar
1335
3.0
NB spicy
1337
3.0
NB rubber/sulfur
1338
3.0
NB fried/oxidized
1343
3.8
NB citrus
1349
3.5
NB minty/spicy
1349
4.0

205
AC brothy
1350
2.0
NB garlic
1352
5.0
AC burnt
1352
2.0
NB corn
chip
1355
3.0
NB sweet/hay/oxidized 1357
3.7
NB malty/grainy
1361
4.0
NB peanut
butter
1363
3.0
AC vinegar
1368
3.5
AC sweet
1369
1.5
NB burnt
corn
chip
1372
3.5
AC spicy/pepper
1374
3.0
AC sweet/burnt
sugar
1376
3.0
NB charcoal/smoky/wood 1378
2.5
NB green/fresh
1381
2.5
NB potato
1386
4.5
NB dusty/cheesy
1387
2.0
AC fatty
1387
2.0
AC mushroom
1387
2.0
NB sulfur
1388
4.0
NB popcorn
1391
3.2
NB burnt
toast
1399
4.0
NB frier
oil
1399
4.0
NB sweet/cloying/hay
1404
2.3
NB green
peanuts
1405
4.5
AC burnt/charred
1409
3.5
NB grainy/smoky
1411
3.0
NB plastic
1411
4.0
AC potato/brothy
1416
3.5
NB oxidized
1417
3.3
AC vinegar
1420
3.3
NB stale
1424
2.0
NB smoked
meat
1425
2.5
NB garlic
1436
3.0
NB burnt/nutty
1437
3.0
AC spicy
1439
1.5
NB spicy
1440
3.0
NB parmesan
cheese
1442
3.5
AC carpet/dusty
1445
2.5
NB green/floral
1445
3.0
NB plastic/sweet/burnt
1448
3.0
NB licorice
1450
1.5
NB fried/garlic
1462
1.5
NB wood/sweet
1464
3.0
AC sweet/fruity
1467
2.3

206
AC sweet/fruity
1471
2.5
NB rosy
1472
3.0
NB nutty
1476
2.0
NB sweet/hay
1478
2.0
NB sweet/alcoholic
1481
3.0
AC vanilla
1482
2.9
NB barn/fecal
1483
2.3
NB green
1484
3.0
NB smoke/chemical
1485
4.5
NB oxidized
1490
3.0
AC old
books
1495
2.5
NB smoked/peanut
1498
3.0
NB nutty/roasted
1504
2.5
AC fruity/sugary
1509
3.0
NB sweet/bell
pepper
1513
3.5
NB floral/cucumber
1514
3.0
AC acidic
1523
2.5
AC cheesy
1538
2.5
NB peanut
candy
1539
3.0
NB popcorn
1543
3.5
NB rosy
1544
2.8
NB fruity
1554
2.0
NB spicy
1555
3.0
AC sweet/solventy
1560
2.3
AC popcorn
1560
2.0
NB stale/malty
1565
3.5
NB rosy
1571
5.5
NB floral/hay
1572
2.8
NB oxidized/butyric
acid
1577
3.0
AC nutty
1578
2.0
AC vanilla/waxy
1584
3.0
AC cheesy
1587
3.8
AC sweaty
1592
3.5
NB rosy
1605
4.2
NB honey/hay
1618
2.0
AC burnt/cheesy
1628
5.0
NB fatty
1632
1.8
NB roasted
1636
2.3
AC waxy
1636
3.5
NB fruity
1638
2.5
NB brothy
1648
3.3
AC sweet/honey
1655
1.5
NB plastic
bottle
1660
2.5
NB bell
pepper
1662
2.0

207
NB fruity/floral
1670
3.0
NB rosy
1671
2.0
NB oxidized/fried
1678
2.3
AC sweaty
1681
1.5
AC sweet
1689
2.3
NB popcorn/nutty
1689
3.8
NB fried/fatty
1696
2.0
AC sweet/fruity
1710
1.5
AC burnt
toast
1721
2.0
NB popcorn
1728
2.5
AC burnt
sugar
1730
2.0
AC strawberry/burnt
sugar 1738
2.0
NB hay/oxidized
1740
1.5
NB peanut
butter
1746
3.0
NB burnt
oil/fatty/oxidized
1751
3.5
AC sour/fruity
1760
1.8
NB cheesy
1763
3.5
NB sweet/burnt
1775
2.5
AC sweaty/dirty
1775
3.0
NB
fatty/spicy corn chip
1786
3.5
AC maple
syrup
1789
3.5
NB grainy/cheesy
1799
3.5
AC fatty/sweet/coconut 1807
3.5
AC hay/sweet
1813
2.8
NB burnt
1813
2.0
NB minty/tobacco
1822
3.0
NB chemical/burnt
1825
3.0
NB grainy/nutty
1830
3.3
NB onion/brothy
1842
2.5
AC hay/licorice
1850
1.5
NB nutty
1858
3.5
NB oxidized
1863
4.0
AC burnt
sugar
1880
2.0
NB floral
1888
2.5
AC burnt/waxy
1913
1.5
NB burnt/sulfur
1917
2.0
AC bready
1925
2.5
AC cotton
candy
1936
3.0
NB brothy/fatty
1938
1.5
AC fruity
1940
2.0
NB sweet
1945
1.8
NB peanut
butter
1959
3.0
AC sour
1971
2.0
AC
burnt sugar
1981
3.3

208
AC sour
1982
1.5
AC green/hay/fatty
1989
2.0
AC burnt
sugar/fruity
1998
1.5
NB burnt
toast
2008
2.5
AC burnt
sugar
2022
2.8
AC burnt
2039
1.5
NB floral
2049
2.0
AC fruity
2052
2.0
NB nutty/green
2059
2.0
NB fecal/stale/burnt
2068
2.5
NB burnt
nutty
2089
2.3
NB fruity
2104
1.5
AC hay/licorice
2111
2.5
AC burnt
sugar
2124
2.0
NB beany
2133
2.3
AC maple
syrup
2171
2.3
NB sweet/citrus
2177
2.5
AC burnt/sweaty
2187
2.0
NB sweet/pumpkin
spice
2203
2.0
AC sweet/fruity
2209
2.5
NB brothy/smoky
2228
2.3
NB corn
chips
2237
3.0
AC burnt
sugar
2237
1.5
NB burnt
corn
2284
2.3
AC sweet/floral
2321
2.0
AC
sweet/burnt
2319
1.8
a
Fraction in which odor was detected, AC = acid, NB = neutral/basic
b
Odor description by GC/O
c
Retention indices (RI) calculated from GC/O data
d
Odor intensity for each compound averaged from panelist data
e
Compounds in bold were determined to have high impact on flavor
through subsequent AEDA analysis (Schirack et al., 2006).
AEDA was conducted on the DB-5 column for NB compounds,
and on the DB-WAX column for AC compounds.
Wyszukiwarka
Podobne podstrony:
Microwave drying characteristics of potato and the effect of different microwave powers on the dried
Effect of drying conditions on the quality of vacuum microwave dried potato cubes
31 411 423 Effect of EAF and ESR Technologies on the Yield of Alloying Elements
Effects of the Great?pression on the U S and the World
Effects of the Atomic Bombs Dropped on Japan
Effect of magnetic field on the performance of new refrigerant mixtures
76 1075 1088 The Effect of a Nitride Layer on the Texturability of Steels for Plastic Moulds
Curseu, Schruijer The Effects of Framing on Inter group Negotiation
A systematic review and meta analysis of the effect of an ankle foot orthosis on gait biomechanics a
71 1021 1029 Effect of Electron Beam Treatment on the Structure and the Properties of Hard
Effects of kinesio taping on proprioception at the ankle
Glińska, Sława i inni The effect of EDTA and EDDS on lead uptake and localization in hydroponically
Effecto of glycosylation on the stability of protein pharmaceuticals
Understanding the effect of violent video games on violent crime S Cunningham , B Engelstätter, M R
The Effect of Childhood Sexual Abuse on Psychosexual Functioning During Adullthood
On the Effectiveness of Applying English Poetry to Extensive Reading Teaching Fanmei Kong
EFFECTS OF CAFFEINE AND AMINOPHYLLINE ON ADULT DEVELOPMENT OF THE CECROPIA
Inhibitory effect of tea flavonoids on the ability of cell to oxidaze LDL
The effect of temperature on the nucleation of corrosion pit
więcej podobnych podstron