Theory of analyte extraction by selected porous polymer SPME
fibres†
Tadeusz Górecki, Xiaomei Yu and Janusz Pawliszyn*
Department of Chemistry and Waterloo Centre for Groundwater Research, University of
Waterloo, Waterloo, Ontario, Canada, N2L 3G1
Received 2nd November 1998, Accepted 12th February 1999
Extraction of analytes by the new porous polymer solid phase microextraction (SPME) fibres is based on
adsorption rather than absorption. The equilibrium theory developed for the liquid poly(dimethylsiloxane) (PDMS)
coating does not apply to these coatings. The paper presents theoretical description of the extraction process for
adsorption-type fibres, including PDMS–DVB (divinyl benzene), Carbowax–DVB and Carbowax–TR (template
resin). The model is based on Langmuir adsorption isotherm. Expressions describing the amount of analyte
extracted by the fibre in two- and three-phase systems are presented and discussed. The effect of selected
experimental variables is discussed. In general, there is a non-linear dependence between the amount of an analyte
extracted by the fibre and its concentration in a sample. The dependence can be approximated by a straight line
for low concentrations only. Matrix composition can significantly affect the amount extracted. Interferences
co-extracted with the analyte of interest may reduce the amount extracted and the quasi-linear range of the
response. Great care should be exercised therefore when performing quantitative analysis with porous polymer
SPME fibres. The phenomena discussed are illustrated on an example of benzene and 4-methyl-2-pentanone
extraction from water by PDMS–DVB and Carbowax–DVB fibres.
Introduction
Solid phase microextraction (SPME) has gained widespread
acceptance in many areas in recent years. It has been applied for
the determination of a wide spectrum of analytes in a variety of
matrices. The most widespread seems to be analysis of volatile
and semi-volatile compounds in water. Examples in this area
include determination of substituted benzene compounds,
1,2
volatile organic compounds,
3–5
polycyclic aromatic hydro-
carbons and polychlorinated biphenyls,
6
pesticides,
7–12
phe-
nols,
13,14
fatty acids,
15
as well as lead and tetraethyllead.
16
There are two distinct types of SPME coatings available
commercially. The most widely used is poly(dimethylsiloxane)
(PDMS), which is a liquid coating. Even though it looks like a
solid, it is in fact a high viscosity rubbery liquid. Poly(acrylate)
(PA) is a solid crystalline coating that turns into liquid at
desorption temperatures. Both PDMS and PA extract analytes
via absorption. The remaining coatings, including PDMS–DVB
(divinylbenzene), Carbowax–DVB, Carbowax–TR (template
resin—DVB with uniform pore sizes) and Carboxen, are mixed
coatings, in which the primary extracting phase is a porous
solid, extracting analytes via adsorption. Similarity of the names
can be very deceptive, since the fundamentals of absorption and
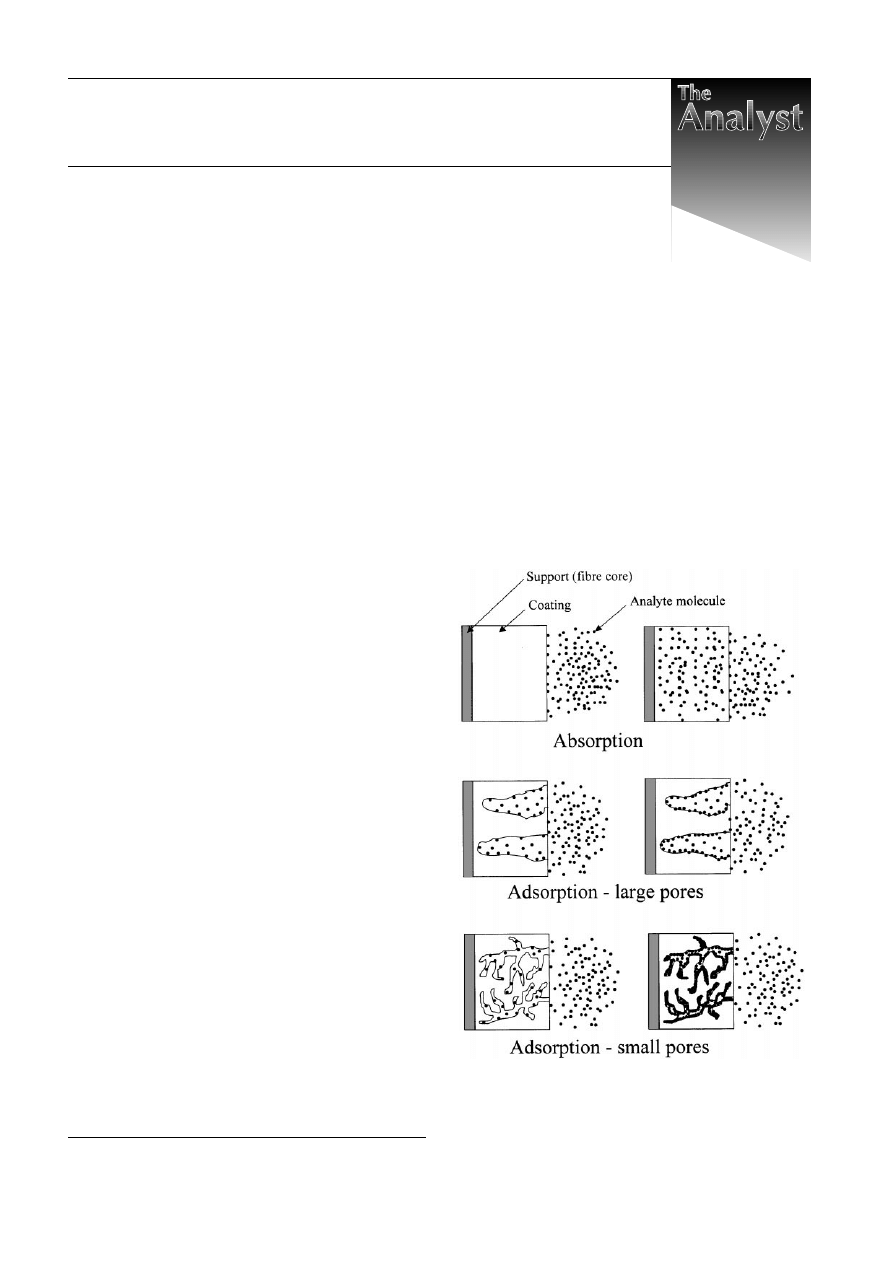
adsorption are different. Fig. 1 illustrates the initial and
equilibrium/steady-state stages of the extraction process for
absorption- and adsorption-type SPME coatings. Independently
of the nature of a coating, analyte molecules initially get
attached to its surface. Whether they migrate to the bulk of the
coating or remain at its surface depends on the magnitude of the
diffusion coefficient of an analyte in the coating. Diffusion
coefficients of organic molecules in PDMS are close to those in
organic solvents, therefore diffusion into PDMS is relatively
fast and this coating extracts analytes via absorption. Diffusion
coefficients in poly(acrylate) are lower by about an order of
magnitude, but still large enough for absorption to be the
primary extraction mechanism. On the other hand, diffusion
coefficients of organic molecules in the bulk of divinylbenzene
and Carboxen are so small that within the time frame of SPME
† Presented in part at Pittcon ’99, March 7–12, 1999, Orlando, Florida,
USA.
Fig. 1
Comparison of absorption and adsorption extraction mechanisms
(cross-sections of the coated fibres). Diagrams on the left illustrate the
initial stages of the processes. Diagrams on the right illustrate the steady-
state condition.
Analyst, 1999, 124, 643–649
643

analysis, essentially all the molecules remain on the surface of
a coating. Should the organic molecules remain there for a very
long time (measured in days or weeks rather than hours), they
still might diffuse into the bulk of the coating (over very short
distances). This would manifest itself during analysis as
persistent carryover, difficult to eliminate even after repeated
desorptions. For all practical purposes, however, adsorption is
the only extraction mechanism for those coatings.
Louch et al.
17
developed equilibrium theory for coatings
extracting analytes via absorption in two-phase systems (sample
and fibre coating), while Zhang and Pawliszyn extended it to
three-phase systems (sample-headspace-coating).
18
A complete
theory for absorption-type coatings was presented in a book by
Pawliszyn.
19
Recently, Ai developed theoretical descriptions of
the dynamics of non-equilibrium direct extraction,
20
as well as
equilibrium
21
and non-equilibrium
22
headspace extraction. This
paper presents the steady state theory of analyte extraction via
adsorption by selected porous polymer fibres (PDMS/DVB,
Carbowax/DVB, Carbowax/TR). The theory does not apply to
Carboxen fibres.
Theory
Weak intermolecular interactions (and hydrophobic interactions
when sampling from water)
23
play the most important role in
analyte extraction by the porous polymer SPME coatings
available commercially. The number of surface sites where
adsorption can take place is limited. When all such sites are
occupied, no more analyte can be trapped (unless it can
condense into pores by the capillary condensation mecha-
nism).
24
This means that the dependence between the concen-
tration of the analyte in a sample and the amount of the analyte
extracted from this sample by a solid SPME coating cannot be
linear over broad concentration ranges. In addition, while
absorption is a non-competitive process, adsorption is by
definition competitive, and a molecule with higher affinity for
the surface can replace a molecule with lower affinity. Thus, the
amount of the analyte extracted by the fibre from a sample can
be significantly affected by sample matrix composition.
The following considerations pertain to PDMS–DVB, Carbo-
wax–DVB and Carbowax/TR coatings. No theory has been
developed yet for the Carboxen coating, for which capillary
condensation plays an important role. As a result, this coating
behaves differently than the other coatings. For example,
equilibration times for the DVB-based coatings are usually
quite short. In headspace extraction of tetraethyllead (TEL)
from water (25 mL sample in a 40 mL vial) these coatings reach
equilibrium in less than 30 min. On the other hand, the amount
of TEL extracted by the Carboxen coating increases with
increased extraction time under similar conditions even after
48 h. Such a long time cannot be explained by poor mass
transfer conditions—it can only result from slow filling of the
pores with the condensing analyte. Consequently, the assump-
tion that the analyte molecules can only attach themselves to
active sites on the coating surface is not valid for the Carboxen
coating.
The dependence between the equilibrium concentration of a
compound associated with the sorbent and its concentration in
the solution is commonly referred to as adsorption isotherm. It
will be illustrated later in this paper that Langmuir adsorption
isotherm well describes equilibrium analyte extraction by
PDMS/DVB and Carbowax/DVB coatings, therefore it has
been used to develop the theoretical description of the
process.
In the Langmuir model, the surface has a limited number of
adsorption sites that can be occupied by the sorbate. The
following assumptions apply: (1) the adsorbing molecule
adsorbs into an immobile state; (2) all sites are equivalent; (3)
each site can hold at the most one molecule of the adsorbate, and
(4) there are no interactions between adsorbate molecules on
adjacent sites so that the equilibrium constant is independent of
the coverage of the adsorbed species.
24
Assumption (3) means
that a monolayer of the adsorbate can be formed at the surface
at the most. Adsorption is treated as a reaction where a molecule
A reacts with an empty site, S, to yield an adsorbed complex
A
ad
:
A + S
) A
ad
(1)
At equilibrium, surface concentration of A in mol cm
22
, [A
ad
],
is described by the following equation:
[
]
[
]
[ ]
[ ]
A
S
A
A
ad
A
A
=
+
0
1
K
K
(2)
where [S
0
] is the total concentration of active sites on the
surface (maximum surface concentration of the analyte) in
mol cm
22
, K
A
is the adsorption equilibrium constant, and [A] is
the concentration of A in the matrix.
It would be cumbersome to use surface concentration
expressed in number of moles per cm
2
for the description of the
SPME process. However, if we assume that the sorbent has a
uniform pore size distribution and surface area throughout its
bulk, surface concentrations can be replaced by bulk concentra-
tions by multiplying both sides of eqn. (2) by the term
F/V
f
,
where
F is the surface area (in cm
2
). Such an assumption seems
reasonable in view of the fact that the fibre-to-fibre reproduci-
bility is usually very good for fibres originating from the same
batch. We can now define the concentration of the analyte on
the fibre C
fA
and the maximum concentration of active sites on
the coating C
f
max in the following way:
C
V
fA
ad
f
A
= [
]
F
(3)
C
V
f max
0
f
S
= [
]
F
(4)
We will also use the symbol C
∞
sA
instead of [A] to denote analyte
concentration in the sample at equilibrium. From these, we can
define the equilibrium concentration of the analyte on the fibre,
C
∞
fA
:
C
C
K C
K C
fA
f max
A
sA
A
sA
•
•
•
=
+
1
(5)
It is evident that C
∞
fA
is not a linear function of equilibrium
analyte concentration in the sample, except when the product
K
A
C
∞
sA
is much smaller than one. This may happen when either
the affinity of the analyte towards the coating is low, or its
concentration in the sample is very low. The reciprocal of this
equation yields:
1
1
1
C
C
C
K C
fA
f
f
A
sA
•
•
=
+
max
max
(6)
Therefore the plot of 1/C
∞
fA
vs. 1/C
∞
sA
should be a straight line
with a slope of 1/C
f max
K
A
and an intercept of 1/C
f max
.
Eqn. (5) is difficult to use in practice, since it requires
knowledge of the analyte concentration in the sample at
equilibrium. It is more practical to determine the dependence
between the initial concentration of the analyte in the sample
(C
0A
) and the amount extracted. Mass balance can be used for
this purpose:
C
0A
V
s
= C
∞
sA
V
s
+ C
∞
fA
V
f
(7)
From eqn. (5), equilibrium concentration of the analyte is:
C
C
K
C
C
f
sA
fA
A
fA
•
•
•
=
-
(
)
max
(8)
By combining eqns. (7) and (8), after a few rearrangements one
gets:
n
C V
K C
V V C
C
V
K V C
C
f
f
=
=
-
+
-
•
•
•
fA f
A
A s f
fA
s
A f
fA
0
(
)
(
)
max
max
(9)
644
Analyst, 1999, 124, 643–649

where n is the amount of the analyte extracted by the fibre at
equilibrium. Eqn. (9) is an iterative dependence, since equilib-
rium analyte concentration on the fibre (C
∞
fA
) appears on both its
sides. Nevertheless, it gives an insight into the nature of analyte
extraction with porous polymer coatings, as will be illustrated
later. It is in fact a quadratic equation, which can be solved
analytically. Of the two roots obtained, only the following has
a physical meaning:
n
C
K V
C V K
V
K
C
V
C V
K V C
V
C V
V
K
f
=
+
+
-
-
+
+
+
f max
A
0A s
A
s
A
f max f
0A s
A s
f max f
0A s
s
2
2
2
2
2
(
)
(
)
(10)
A discussion of this dependence is presented in the Results and
discussion section of this paper. In real life situations, one can
hardly assume that only one compound will be extracted by the
coating. Since adsorption is a competitive process, the presence
of other compounds must affect the amount of analyte A
extracted by the fibre (n
A
). In the following derivation, only one
competing compound is taken into account. The same reasoning
can be applied, however, to any number of compounds present
in the sample.
The concentration of analyte A on the fibre in the presence of
a competing compound B is given by the following equation:
C
C
K C
K C
K C
fA
f max
A
sA
A
sA
B
sB
1 +
•
•
•
•
=
+
(11)
where K
B
is the adsorption equilibrium constant for compound
B, and C
∞
sB
is the equilibrium concentration of B in a sample. If
more than two compounds were present in the sample, the
denominator would contain additional K
i
C
∞
si
terms. Mass
balance for A is again described by eqn. (7). A derivation
similar to that described above yields the following relation-
ship:
n
C V
K C V V C
C
K C
V
K V C
C
A
fA f
A
0A s f
f max
fA
B
sB
s
A f
f max
fA
=
=
-
+
+
-
•
•
•
•
(
)
(
)
(
)
1
(12)
Eqn. (12) can be solved in the same way as eqn. (9). The only
root with a physical meaning has the form:
n
C V
C
K V
C V K
V
K C
K
K
C
V
C V
K V
K C
C
V
C V
V
K C
K
s
A
fA f
f max
A f
0A s
A
s
B
sB
A
A
f max f
0A s
A s
B
sB
f max f
0A s
B
sB
A
=
=
+
+
+
+
-
-
+
+
+
+
+
•
•
•
•
(
)
(
)
(
)
(
)
(
)
1
2
2
1
1
2
2
2
2
2
(13)
Even though this dependence seems very complex, it can give
insight into the extraction process, as will be illustrated in the
Results and discussion section.
SPME extraction can be carried out by immersing the fibre in
the sample (direct extraction), or by exposing it to the sample
headspace. In fact, when volatile compounds are analysed,
headspace extraction is the preferred mode of operation.
19
Mathematical description of the headspace extraction process is
more complex than that of direct extraction, as in headspace
extraction one has to deal with equilibria involving three
phases: sample, its headspace, and the fibre coating. When the
fibre is exposed to the headspace, partitioning of analytes occurs
between the gas phase and the coating, as well as between the
sample and the gas phase. Mass balance for such a system
(containing one analyte only) can be written in the following
way:
C V
C V
C V
C V
0A s
sA s
hA h
fA f
=
+
+
•
•
•
(14)
where C
∞
hA
is the equilibrium concentration of the analyte in the
sample headspace, and V
h
is the headspace volume. Based on
the Langmuir model, equilibrium concentration of the analyte
on the fibre coating can be defined as:
C
C
K
C
K
C
fA
f
A
hA
A
hA
h
h
•
•
•
=
+
max
1
(15)
where the subscript h in K
A
h
denotes that this is the equilibrium
constant for adsorption of the analyte from the gas phase
(sample headspace), as opposed to the liquid phase. Equilibrium
concentration of the analyte in the sample headspace is
determined by dimensionless Henry’s law constant K
H
A
:
C
K
C
hA
H
sA
A
•
•
=
(16)
Let us denote the product of K
H
A
and K
A
h
as KA
A
. Substituting
eqns. (15) and (16) into eqn. (14), after a few rearrangements,
yields:
n
C V
K C V V C
C
V
V K
K V C
C
=
=
¢
-
+
+
¢
-
•
•
•
fA f
A
0A s f
f max
fA
s
h
H
A
f
f max
fA
A
(
)
(
)
(17)
Analytical solution of eqn. (17) yields:
n
C
K V
C V K
V
V K
K
K
C
V
C V
K V
C
V
C V
V K
V
V
C
V K
C
V
V K
K
=
¢
+
¢ +
+
¢
+
-
¢
-
+
¢
+
+
+
Ê
Ë
Á
ˆ
¯
˜
+
+
¢
f max
A
f
0A s
A
s
h
H
A
A
f max f
0A s
A
s
f max f
0A s
hA
H
f
s
f max
h
H
0A
s
h
H
A
A
A
A
a
2
2
2
2
2
2
(
)
(
)
(18)
Taking into account that usually the total volume of the system
(e.g., sample vial) is fixed, we can define a = V
h
/V
s
, and
eliminate V
h
by substituting it with aV
s
:
n
C
K V
C V K
V
aK
K
K
C
V
C V
K V
C
V
C V
aK
V C
aV K
C
V
aK
K
s
=
¢
+
¢ +
+
¢
+
-
¢
-
+
¢
+
+
+
+
+
¢
f max
A
f
0A s
A
s
H
A
A
f max f
0A s
A
s
f max f
0A s
H
f
f max
s
H
0A
H
A
A
A
A
a
(
)
(
)
(
)
(
)
1
2
2
1
2
2
2
2
2
(19)
When more than one compound is extracted from the sample
headspace, derivation similar to those above yields the
following equation for analyte A extracted by the fibre:
n
C V
K C V V C
C
V
K C
aV K
K C
K V C
C
A
fA f
A
0A s f
f max
fA
s
B
sB
s
H
B
sB
A
f
f max
fA
A
=
=
¢
-
+
¢
+
+
¢
+
¢
-
•
•
•
•
•
(
)
(
)
(
)
(
)
1
1
(20)
where KA
B
= K
Bh
K
H
B
.
The analytical solution of eqn. (20) is as follows:
n
C
K V
C V K
V
K C
aK
K
K
C
V
C V
K V
K C
C
V
C V
aK
V C
aV K
C
V
K
s
A
f max
A
f
0A s
A
s
B
sB
H
A
A
f max f
0A s
A
s
B
sB
f max f
0A s
H
f
f max
H
0A
s
A
A
A
=
-
¢
+
¢ +
+
¢
+
+
¢
¢
-
+
¢
+
¢
+
+
+
+
+
¢
•
•
(
)(
)
(
)
(
)
(
)
(
1
1
2
2
1
1
2
2
2
B
B
sB
H
A
a
C
aK
K
•
+
¢
) (
)
2
2
1
2
(21)
This dependence is very complicated, and it is not immediately
clear when looking at eqn. (21) how the particular terms affect
Analyst, 1999, 124, 643–649
645
the amount extracted. Nevertheless, it can be used relatively
easily to model equilibrium extraction conditions for various
sets of input variables, as will be illustrated in the Results and
discussion section.
Experimental
All the reagents were of analytical reagent grade. Benzene was
purchased from Caledon Laboratories (Ontario, Canada), while
i-propanol and 4-methyl-2-pentanone from Aldrich Chemical
Co. (Milwaukee, WI). SPME holder and fibres (PDMS–DVB
and Carbowax–DVB) were purchased from Supelco (Belle-
fonte, PA).
Aqueous standard solutions of benzene and 4-methyl-
2-pentanone were prepared from primary dilution standard
solutions of the analytes in methanol. Concentrations of the
primary dilution standard solutions were such that 25
mL of a
given solution added to 25 mL of water produced the desired
concentration of the aqueous standard. In this way, the amount
of methanol in each aqueous standard was constant. Aqueous
standard solutions were prepared in 40 mL amber vials
(Supelco). They were stirred during extraction with a digital
magnetic stirrer (VWR model HPS 400, VWR Scientific of
Canada, Ltd., Mississauga, ON) at 1200 rpm. Extraction was
carried out from sample headspace. Extraction times were set in
such a way that they were slightly longer than equilibration
times of the analytes. For benzene, extraction time was 2 min,
and for 4-methyl-2-pentanone it was 12 min.
All analyses were performed using a Varian Star 3500 GC
(Varian Associates, Sunnyvale, CA) equipped with a 30 m
3
0.25 mm
3 0.25 mm SPB-5 column (Supelco). The column was
equipped with a 1 m fused silica precolumn. Hydrogen at 20 psi
was used as the carrier gas. Injector temperature was held at
210 °C for SPME injections, and was temperature programmed
from 55–250 °C at 250 °C min
21
for syringe injections. Flame
ionization detector (FID) was held at 250 °C. Oven temperature
program for SPME injections was the following: 35 °C for 1
min, ramped to 120 °C at 15 °C min
21
, held for 1 min. For
syringe injections, the initial oven temperature was 55 °C.
Detector response factors were determined by injecting 0.5
mL of standard methanolic solutions of benzene (0.995
mg mL
21
) and 4-methyl-2-pentanone (0.887
mg mL
21
). The
same benzene solution was used for quality control injections
performed at least daily.
Results and discussion
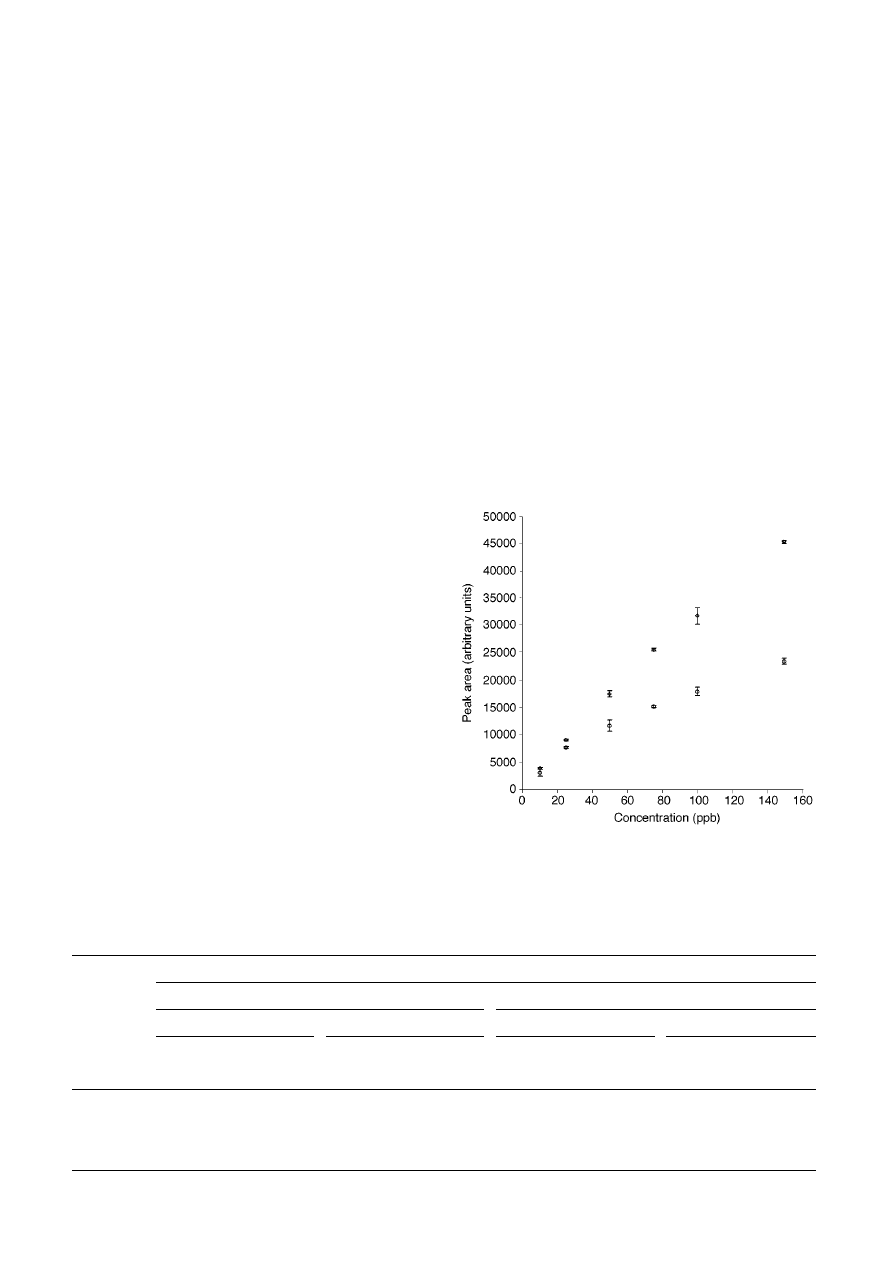
Fig. 2 presents calibration curves obtained for i-propanol in the
presence of 4-methyl-2-pentanone (methyl-isobutyl ketone;
MIBK).
25
Sampling was carried out from sample headspace
with a PDMS/DVB fibre [for details, see ref. (25)]. The affinity
of MIBK for the fibre coating was much higher than the affinity
of i-propanol. As long as MIBK concentration remained low (10
times lower than the concentration of i-propanol; points
represented by squares), the calibration curve remained linear
up to ~ 75
mg L
21
, and the deviation from linearity at higher
concentrations was not very significant. However, when MIBK
concentration at each point was equal to that of i-propanol
(circles), the dependence could be approximated by a straight
line only up to ~ 25
mg L
21
. Moreover, at higher MIBK
concentrations, displacement of i-propanol was evident. The
amount of i-propanol extracted from the sample at 150
mg L
21
was lower by almost 50% when MIBK concentration was also
150
mg L
21
, compared to the case when it was 15
mg L
21
. Fig. 2
illustrates therefore that the presence of interfering compounds
can affect both the amount extracted and the linear range of the
method for porous polymer fibres.
Table 1 illustrates the effect of the interfering compound on
the amount of the analyte extracted from the sample for the
PDMS–DVB and Carbowax–DVB fibres. In this experiment,
the concentration of the interfering compound was kept constant
for all the analyte concentration levels. It is evident from this
table that in all cases the presence of the interfering compound
caused a reduction in the amount of the analyte extracted by
both fibres. In general, the effect of MIBK on the extraction of
Table 1
The effect of an interfering compound on the amount of analyte extracted by the fibre. Extraction of benzene in the presence of MIBK, and
extraction of MIBK in the presence of benzene
Mass of analyte extracted by the fibre/ng
PDMS/DVB fibre
Carbowax/DVB fibre
Benzene
MIBK
Benzene
MIBK
Analyte con-
centration/
mg L
21
No
MIBK
3.5
mg L
21
MIBK
Dif-
ference
(%)
No ben-
zene
0.85
mg L
21
benzene
Dif-
ference
(%)
No
MIBK
5
mg L
21
MIBK
Dif-
ference
(%)
No ben-
zene
0.85
mg L
21
benzene
Dif-
ference
(%)
85
104
80
23
39
22
43
31
23
27
6
3
50
350
296
243
18
122
76
38
87
67
23
20
12
40
850
481
435
10
228
153
33
209
166
20
43
28
35
1700
792
704
11
343
249
27
292
218
25
69
51
26
3450
1097
1005
8
502
397
21
471
431
8
114
86
25
Fig. 2
Calibration curves for i-propanol in the presence of methyl-isobutyl
ketone (MIBK) (PDMS/DVB fibre, headspace sampling). Squares—MIBK
concentration 10
3 lower than i-propanol concentration; circles—MIBK
concentration equal to i-propanol concentration; error bars represent ± one
standard deviation of the measurement.
646
Analyst, 1999, 124, 643–649

benzene was less pronounced than the effect of benzene on the
extraction of MIBK (note that in benzene extraction MIBK
concentration was higher than benzene concentration in all but
the most concentrated samples). This can be easily explained
taking into account that MIBK revealed lower affinity to the
fibres examined than benzene did. As a result, benzene effect on
MIBK extraction was more significant even at lower concentra-
tions (0.85 mg L
21
).
Eqn. (6) predicts that the plot of 1/C
fA
∞
vs. 1/C
sA
∞
should be a
straight line. This was verified for headspace extraction of
methyl-isobutyl ketone (MIBK) and benzene. For the Carbo-
wax/DVB fibre, the dependences were linear, with R
2
values of
0.9992 and 0.9933 for MIBK and benzene, respectively. For the
PDMS/DVB fibre, the R
2
values were 1.000 and 0.9954,
respectively. The high R
2
values indicate that within the
concentration ranges examined, the Langmuir isotherm model
is suitable for the description of analyte adsorption on the fibres
examined. The slopes of the lines were proportional to
1/C
f max
KA
A
(where KA
A
= K
A
h
K
H
A
), while the intercepts to
1/C
f max
. The latter allowed estimation of C
f max
. For the
PDMS–DVB fibre, the estimated values were 33.3 and 14.3
mmol mL
21
for benzene and MIBK, respectively. For the
Carbowax/DVB fibre, those values were 16.8 and 5.0
mmol mL
21
. The differences between the estimates obtained for
the same fibres with two different compounds are not surprising
in the light of the fact that the fibres also extracted water. Even
though it had much lower affinity to those fibres than the
organic molecules, it was present in the headspace in concentra-
tions higher by orders of magnitude than the analytes of interest.
Thus, it was able to compete for the active sites on the surface,
and effectively reduced their number [see the discussion of eqn.
(12)]. Additionally, standard aqueous solutions contained also
methanol in concentrations much higher than those of the
analytes. In spite of its very good aqueous solubility, the amount
of methanol extracted by the fibres was significant. Of the two
analytes of interest, benzene had higher affinity to the coatings
examined, therefore the reduction in the effective number of
active sites was less significant for this compound.
Determination of the ‘true’ C
f max
value would require
conditions bearing little resemblance to those usually encoun-
tered in SPME. To make sure that only one compound is sorbed,
it would be necessary to expose the fibre to vacuum containing
pure vapors of an organic compound, since it cannot be
excluded that even permanent gases can cause effective
reduction of the number of active sites. For these reasons,
estimation of KA
A
was not carried out, since no meaningful
results were expected.
The form of eqn. (9) is very similar to that of the equation for
n when coatings extracting analytes by absorption rather than
adsorption are used:
19
n
KC
V V
V
KV
=
+
0A s f
s
f
(22)
where K is the partition coefficient of the analyte between the
sample and the coating. The main difference between eqn. (9)
and (22) is the presence of the fibre concentration term (C
f max
2 C
∞
fA
in the numerator and denominator of eqn. (9) (also, note
that the meaning of K
A
is entirely different than that of K : K
A
is
adsorption equilibrium constant, while K is the partition
coefficient). For very low analyte concentrations on the fibre, it
can be assumed that C
f max
> > C
∞
fA
. For this condition to be
fulfilled, analyte concentration in the sample and/or its affinity
for the fibre must be very low. When these requirement(s) are
met, a linear dependence should be observed. If, however, the
amount of the analyte on the fibre is not negligible compared to
the total number of active sites, the dependence cannot be linear
any more.
Eqn. (12) indicates that the amount of analyte A extracted
from the sample containing more than one compound (n
A
) must
be lower than n from eqn. (9), as there is an additional term in
the denominator of eqn. (12), which can only be greater than
one. The difference does not have to be dramatic if the second
term in the denominator of eqn. (12) is much larger than the first
one, which can occur when the interfering compound is either
present at a very low concentration, and/or is characterized by
low affinity to the coating. In all other cases, one can expect that
n
A
will be significantly lower than n.
What is less obvious when looking at equation eqn. (12) is the
fact that adsorption of interfering compounds affects also the
linear range of the calibration curve. The term C
∞
sB
is the
equilibrium concentration of B. Unless the volume of the
sample is very large, in which case the equilibrium concentra-
tion of B is practically equal to its initial concentration, C
∞
sB
depends on the initial concentration of B and A in the same
complex way in which C
∞
sA
depends on C
0A
and C
∞
sB
(thus C
0B
).
Incorporating this dependence into eqn. (12) would make it very
complex. Instead, we can picture this dependence in the
following way: when B adsorbs on the surface of the coating, it
reduces the number of adsorption sites available for A. This
means that, effectively, C
f max
is lower for A, hence the non-
linearity becomes significant at lower concentrations of A
compared to the case when the sample contains no interfering
compounds.
Compared to eqn. (9), eqn. (1) contains an additional term in
the denominator, V
h
K
H
A
. Since this term can only be equal to or
greater than 0, at equilibrium the amount of the analyte
extracted from the sample headspace can only be equal to or
lower than the amount extracted directly from the sample. It is
obvious therefore that sensitivity in headspace sampling is
usually lower than in direct sampling. To minimize the
sensitivity loss, headspace volume should be kept small. On the
other hand, headspace sampling eliminates many matrix-related
problems, and is usually faster.
19
Compared to SPME with
liquid coatings, eqn. (17) contains the same additional term as
eqn. (9), i.e., (C
f max
2 C
∞
fA
). The consequences are similar to
those described for eqn. (9). Linear response can be expected
only for equilibrium concentrations on the fibre that are much
lower than C
f max
.
From eqn. (20), it is clear that the presence of additional
compounds which are co-extracted from the headspace reduces
the amount of analyte A extracted by the fibre, unless those
compounds are present at very low concentrations in the sample
at equilibrium, and/or the product of their Henry’s law constant
and adsorption equilibrium constant for extraction from the gas
phase is very small. Again, it is not immediately obvious when
looking at this equation that additional compounds present in
the headspace affect also the linear range of the method. For
explanation of this phenomenon, see the discussion of eqn. (12)
above.
Fig. 3 illustrates the predicted (theoretical) dependence of the
amount of the analyte extracted by the fibre vs. the initial
concentration of the analyte in the sample for direct extraction
when a single analyte is present in the sample, for three different
equilibrium constant (K
A
) values. The plots were determined
using eqn. (10). At low analyte concentrations, the depend-
encies can be approximated by straight lines. At higher
concentrations they cease to be linear, and finally they level off
when all active sites on the fibre surface are occupied by the
analyte molecules. The shapes of the isotherms, and particularly
their linear ranges, depend strongly on the K
A
value. When it is
large (see the curve for K
A
= 1 000 000), the response remains
practically linear until the fibre becomes saturated with the
analyte. After this point, the curve levels off rather abruptly.
When K
A
is low (see the curve for K
A
= 10 000), the initial
quasi-linear range is narrower, but n changes with the initial
analyte concentration C
0A
in a broader concentration range.
Fig. 4 presents the theoretical dependence of the amount of
analyte n extracted by the fibre on the initial concentration of the
analyte in the sample for a single analyte and direct extraction,
Analyst, 1999, 124, 643–649
647
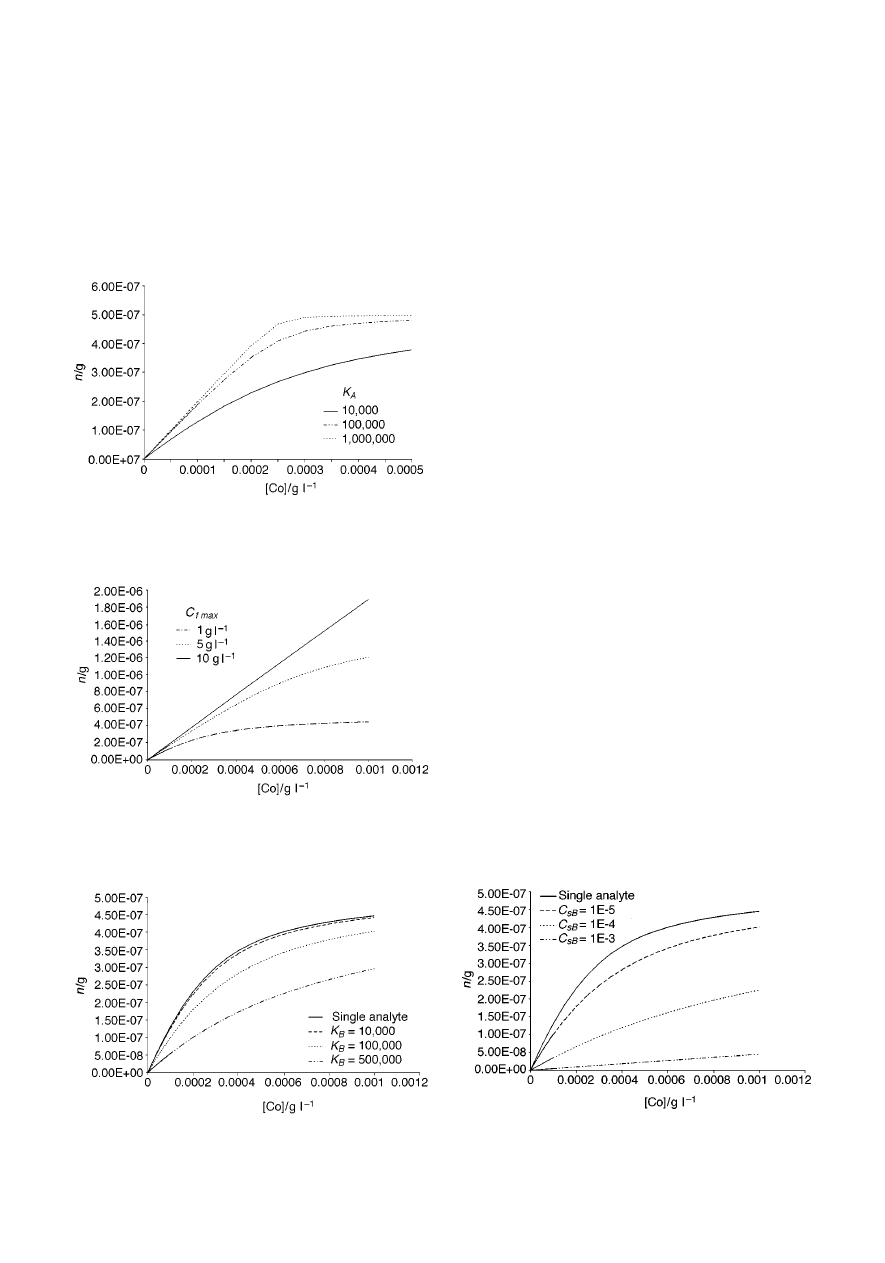
for three different C
f max
values. It is clear that the concentration
of active sites on the fibre has a profound effect on linearity of
the response. The higher the number of active sites, the broader
is the linear range of the isotherm. This is quite obvious when
looking at eqn. (9). When C
f max
is high, the value of the
difference (C
f max
2 C
∞
fA
) is very close to C
f max
for a broader
range of C
∞
fA
values than when C
f max
is low. For illustration
purposes, the C
f max
value estimated for the PDMS/DVB fibre
with benzene (33.3
mmol mL
21
) corresponds to ~ 2.6 g L
21
.
Fig. 5 presents the theoretical relationship between the
amount of analyte A extracted by the fibre and the initial
concentration of the analyte in the sample when two compounds
are present in the sample (direct extraction), for three different
K
B
values. It is intuitively obvious that when the interfering
compound has high affinity for the fibre coating, the displace-
ment effects are more pronounced. Indeed, Fig. 5 illustrates that
for the same C
A
, n
A
decreases when K
B
increases. When the
affinity for the fibre coating is similar for both compounds, the
displacement effect is not very significant, especially when the
concentration of the interfering compound(s) is low (see the
curve for K
B
= 10 000). On the other hand, when K
B
is high,
displacement is significant. It should be emphasized that, as
already mentioned in the discussion of eqn. (12), the curves in
Fig. 5 illustrate the effect of equilibrium concentration of the
interfering compound in the sample on the amount of analyte A
extracted by the fibre. When all other parameters are constant,
for a given (small) volume V
s
, the higher is the K
B
value, the
lower is the equilibrium concentration of B for the same initial
concentration C
0B
(i.e., more compound is extracted when the
affinity for the coating is higher). In order for C
∞
sB
to be the same
for the three curves in Fig. 5 corresponding to the case of two
compounds that undergo extraction, the initial concentration of
B would have to be higher for higher K
B
values. The curves do
not illustrate therefore directly what is the effect of the
interfering compound(s) when K
B
changes, while C
0B
remains
constant.
Fig. 6 illustrates a similar dependence for constant K
B
( = 100 000) and three different C
∞
sB
values. It should be noted
that in this case C
∞
sB
is proportional to C
0B
. It is clear from Fig. 6
that the amount of analyte A extracted by the fibre decreases
when the concentration of the interfering compound increases.
This is intuitively obvious, since at higher concentrations of
interfering compound(s), a larger fraction of adsorption sites is
occupied, therefore fewer sites are available for analyte A.
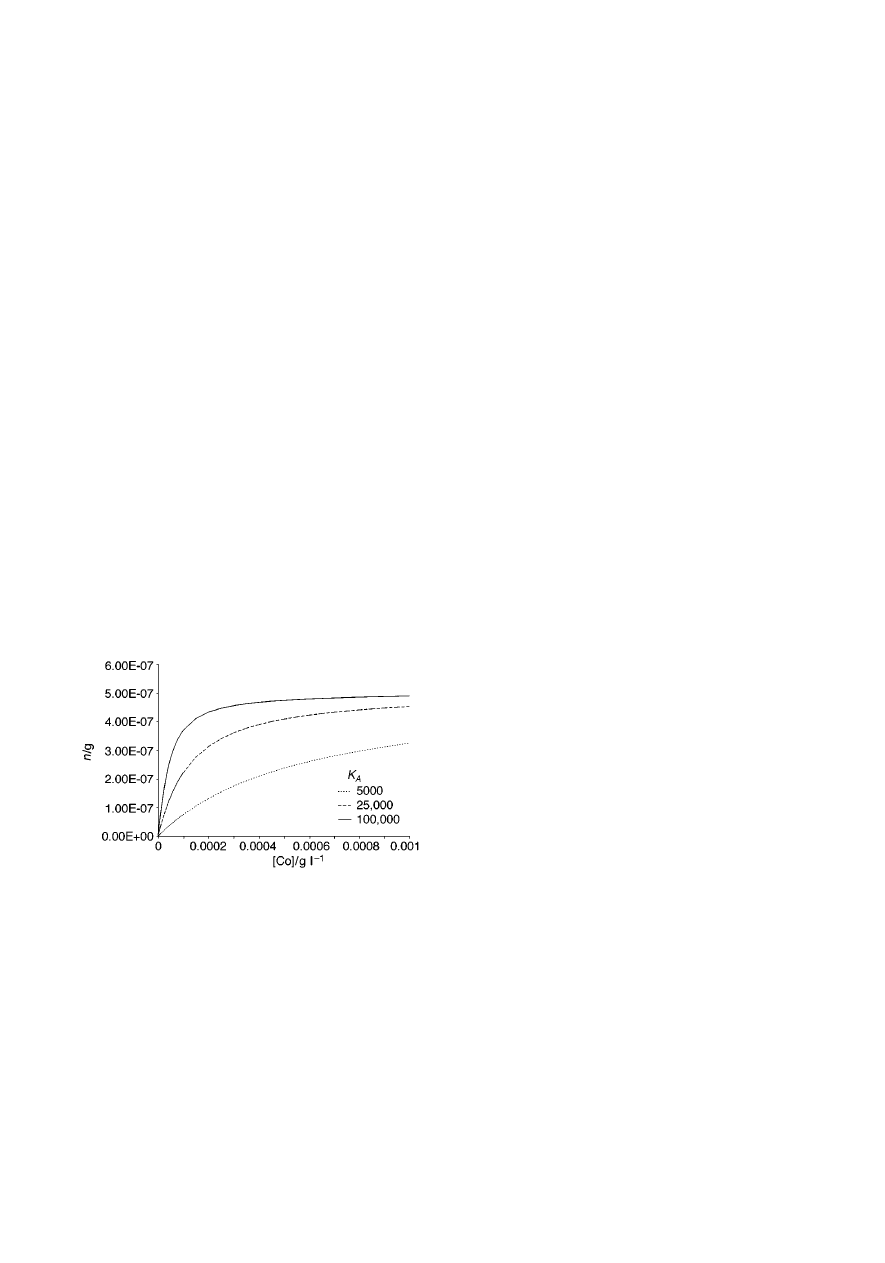
Fig. 7 presents relationships between the amount of the
analyte extracted by the fibre and the initial concentration of the
analyte in the sample for a single analyte extracted from
headspace. The total volume of the system (sample plus its
headspace) was set to 40 mL, with the sample volume of 15 mL.
Henry’s law constant value of K
H
= 1 was assumed for the
calculations. The amount extracted decreases with decreasing
K
A
value, and so does the initial linear range. The shapes of the
relationships do not change much when the sample volume is
increased or K
H
is decreased (not illustrated). The amount
extracted increases slightly when sample volume increases,
with the change being the most pronounced for analytes with the
lowest K
A
. The amount extracted increases also when K
H
decreases, due to the fact that lower K
H
value means that the
headspace capacity for the analyte is lower (i.e., at equilibrium
fewer analyte molecules are present in the headspace of the
sample, therefore more molecules are available for the coating
Fig. 3
Amount of analyte extracted by the fibre vs. initial concentration of
the analyte in the sample for a single analyte and direct extraction, for three
different equilibrium constants. Assumptions: C
f max
= 1.0 g L
21
, V
f
= 0.5
mL, V
s
= 2 mL.
Fig. 4
Amount of analyte extracted by the fibre vs. initial concentration of
the analyte in the sample for a single analyte and direct extraction, for three
different C
f max
values. Assumptions: K
A
= 10 000, V
f
= 0.5
mL, V
s
= 2
mL.
Fig. 5
Amount of analyte A extracted by the fibre vs. initial concentration
of the analyte in the sample when two compounds are present in the sample
(direct extraction), for three different K
B
values. Assumptions: C
f max
= 1.0
g L
21
, K
A
= 10 000, V
f
= 0.5
mL, V
s
= 2 mL, = 10
mg L
21
.
Fig. 6
Amount of analyte A extracted by the fibre vs. initial concentration
of the analyte in the sample when two compounds are present in the sample
(direct extraction), for three different C
∞
sB
values. Assumptions: C
f max
= 1.0
g L
21
, K
A
= 10 000, V
f
= 0.5
mL, V
s
= 2 mL, K
B
= 100 000.
648
Analyst, 1999, 124, 643–649
phase, since the total number of molecules in the system
remains constant).
The courses of the relationships between the amount of
analyte A extracted by the fibre and the initial concentration of
the analyte in the sample when two compounds are present in
the sample and extraction is carried out from sample headspace
are very similar to those presented in Fig. 5 for direct sampling,
therefore will not be discussed herein.
Conclusions
Adsorption is a competitive process, therefore matrix composi-
tion, as well as extraction conditions, all affect the amount of
analyte extracted by the fibre. This makes quantitative analysis
using solid coatings more difficult compared to liquid coatings.
The equilibrium theory developed for selected porous polymer
coatings (PDMS/DVB, Carbowax/DVB) presented here sheds
light on the effect of a number of experimental variables on the
amount of the analyte extracted by the fibre coating. The theory
applies also to Carbowax/TR coatings, which chemically are
Carbowax/DVB coatings. In general, porous polymer coatings
can be expected to perform well for relatively clean matrices or
matrices of constant composition, provided that the concentra-
tion of the analyte of interest is low (otherwise, the quasi-linear
range of the calibration curve can be easily exceeded and non-
linear calibration is required). Special strategies can be applied
when interfering compounds with high affinity to the coating
are present in the sample (see ref. 25). It should be remembered
that in most practical cases, one has to deal with systems where
more than one compound undergoes adsorption on the fibre
coating (e.g., the analyte of interest plus water, trace organics
accompanying the analyte, etc.)
Carboxen coating is a special case. It extracts analytes via
adsorption, therefore general description of the extraction
process is similar to that for porous polymer coatings. The main
difference is that the pores in Carboxen are small enough to
cause capillary condensation to occur. As a result, one cannot
talk about reaching equilibrium when Carboxen fibres are used.
Also, quite obviously, one of the basic assumptions of the
Langmuir isotherm model stating that the surface of the
adsorbent can be covered by a monomolecular layer of analyte
molecules at the most is not fulfilled, therefore the model
presented herein is not applicable to Carboxen coatings.
References
1
C. L. Arthur, L. M. Killam, S. Motlagh, M. Lim, D. W. Potter and J.
Pawliszyn, Environ. Sci. Technol., 1992, 26, 979.
2
B. L. Wittkamp and D. C. Tilotta, Anal.Chem. 1995, 67, 600.
3
C. L. Arthur, K. Pratt, S. Motlagh, J. Pawliszyn and R. P. Belardi,
J. High Resolut. Chromatogr., 1992, 15, 741.
4
J. J. Langenfeld, S. B. Hawthorne and D. J. Miller, Anal. Chem., 1996,
68, 144.
5
T. Nilsson, F. Ferrari and S. Facchetti, Proc. 18th Int. Symp. on
Capillary Chrom., H¨uthig Verlag, Germany, Riva del Garda, 1996,
p. 618.
6
D. Potter and J. Pawliszyn, Environ. Sci. Technol., 1994, 28, 298.
7
A. A. Boyd-Boland and J. Pawliszyn, J. Chromatogr., 1995, 704,
163.
8
R. Eisert, K. Levsen and G. Wuensch, J. Chromatogr., 1994, 683,
175.
9
P. Popp, K. Kalbitz and G. Oppermann, J. Chromatogr., 1994, 687,
133.
10
X. Lee, T. Kumazawa, T. Taguchi, K. Sato and O. Suzuki,
Hochudoku, 1995, 13, 122.
11
K. N. Graham, L. P. Sarna, G. R. B. Webster, J. D. Gaynor and
H. Y. F. Ng, J. Chromatogr., 1996, 725, 129.
12
T. Górecki, R. Mindrup and J. Pawliszyn, Analyst, 1996, 121,
1381.
13
K. Buchholz and J. Pawliszyn, Anal. Chem., 1994, 66, 160.
14
B. Schaefer and W. Engewald, Fresenius’ J. Anal. Chem., 1995, 352,
535.
15
L. Pan, M. Adams and J. Pawliszyn, Anal. Chem., 1995, 67, 4396.
16
T. Górecki and J. Pawliszyn, Anal. Chem., 1996, 68, 3008.
17
D. Louch, S. Motlagh and J. Pawliszyn, Anal. Chem., 1992, 64,
1187.
18
Z. Zhang and J. Pawliszyn, Anal. Chem., 1993, 65, 1843.
19
J. Pawliszyn, Solid Phase Microextraction, John Wiley & Sons, Inc.,
New York/Chichester/Brisbane/Toronto/Singapore, 1997, ch. 3, p.
43.
20
J. Ai, Anal. Chem., 1997, 69, 1230.
21
J. Ai, Anal. Chem., 1997, 69, 3260.
22
J. Ai, Anal. Chem., 1998, 70, 4822.
23
R. P. Schwarzenbach, P. M. Gschwend and D. M. Imboden,
Environmental Organic Chemistry, John Wiley, New York/Chiches-
ter/Brisbane/Toronto/Singapore, 1993, ch. 11, p. 255.
24
R. I. Masel, Principles of Adsorption and Reaction on Solid Surfaces,
John Wiley, & Sons, Inc., New York/Chichester/Brisbane/Toronto/
Singapore, 1996.
25
T. Górecki, P. Martos and J. Pawliszyn, Anal. Chem., 1998, 70(1),
19.
Paper 8/08487D
Fig. 7
Amount of analyte extracted by the fibre vs. initial concentration of
the analyte in the sample for a single analyte and headspace extraction, for
three different K
A
values. Assumptions: V
f
= 0.5
mL, C
f max
= 1 g L
21
, V
s
= 15 mL, V
h
= 25 mL, K
H
= 1.
Analyst, 1999, 124, 643–649
649
Wyszukiwarka
Podobne podstrony:
Design of porous polymeric scaffolds by gas foaming
In Pursuit of Gold Alchemy Today in Theory and Practice by Lapidus Additions and Extractions by St
więcej podobnych podstron