
Digital Object Identifier (DOI) 10.1007/s00193-002-0139-0
ShockWaves (2002) 12: 121–128
Spectral intensity measurement for soot formation of benzene
behind reflected shock waves
T. Tsuboi, K. Ishii, H. Omura
Department of Mechanical Engineering, Faculty of Engineering, Yokohama National University, 79-5 Tokiwadai, Hodogaya,
Yokohama 240-8501, Japan
Received 5 February 2002 / Accepted 13 February 2002
Published online 11 June 2002 – c
Springer-Verlag 2002
Abstract. Soot formation of benzene was observed using He-Ne laser extinction at 632.8 nm as well as the
visible and infrared thermal radiation at 0.63, 0.80, 1.12, 1.52, 2.3, 3.4, 3.9, 4.3
µ
m. From the light extinction
we determined the temperature-dependent soot formation rate. Also from the visible and infrared radiation
we calculated the temperature of soot particles and kcl-values which were dependent on the soot volume
concentration. The temperature dependence of soot formation rates below 2500 K was obtained in the
early part of soot formation and that above 1900 K was obtained in the later part of soot formation for
the cases of the laser extinction and the visible-infrared radiation intensities, respectively.
Key words: Soot formation, Benzene, IR-emission, Spectral intensity, Hottel-Broughton equation
1 Introduction
Soot formation has been studied from various standpoints.
Several groups observed soot formation and the optical in-
dex in burner flames (Bonne and Wagner 1965; D’Alessio
et al. 1972; Wersborg et al. 1975). Others (Frey and Corn
1967, Kham et al. 1971, Sj¨ogren 1973 and Kadota et al.
1977) observed the formation of soot or particulates in
diesel exhaust gas. On the other hand Radcliffe and Ap-
pleton 1971 and Park and Appleton 1973 observed the
oxidation or the O-atom reaction with soot. Shock tube
techniques were also applied for the basic study of soot
formation (Yoshizawa et al. 1979; Frenklach et al. 1983a;
Frenklach et al. 1983b; Johnson et al. 1983; Bauer and
Zhang 1983; B¨ohm et al. 1998). One of us (TT) observed
soot formation behind shock waves using visible and in-
frared He-Ne laser light extinction (Tsuboi et al. 1992).
The G¨ottingen group also used a near-infrared semicon-
ductor laser along with a visible He-Ne laser as the light
source (Tanke et al. 1998). Darzell and Sarofim were the
first group who obtained the complex index of soot par-
ticles (Darzell and Sarofim 1969), and other groups fol-
lowed after them to study the complex index experimen-
tally and theoretically Graham 1974, Chippett and Gray
1978. Wagner 1979 and Calcote 1981 gave overviews of
soot studies. Many of the measurements in flame and in
diesel exhaust gas were focused on technical applications.
Correspondence to: T. Tsuboi (e-mail: tsuboi@ynu.ac.jp)
An abridged version of this paper was presented at the 23rd
Int. Symposium on ShockWaves at Fort Worth, Texas, from
July 22 to 27, 2001
The shock tube measurements were performed for the el-
ementary study of soot formation and were used for the
visible and infrared laser absorption studies. In spite of
many attempts there are still unclear aspects of the soot
formation mechanism as well as the thermodynamic prop-
erties. One of the authors (T.T.) (Tsuboi et al. 1986) tried
to measure the average density of soot under the condition
of high temperature in a shock wave using infrared He-Ne
laser extinction and they (Tsuboi et al. 1992) calculated
also the latent heat and surface tension of phase change by
using a model of soot formation. Since the results of these
attempts were still uncertain, we have performed further
study. The previous workers observed the later part of the
light extinction signal as the soot signal, because the early
stage of the light extinction signals could include also the
molecules, which were produced as intermediates during
the soot formation process. We ventured to analyze the
early stage of light extinction of the soot formation pro-
cess by measuring the visible and infrared radiation inten-
sities, and the light extinction simultaneously. From these
measurements we could obtain the time histories of the
spectral intensities and calculated the concentration and
the temperature of the radiating particles, by using the
Hottel-Broughton equation.
2 Experimental apparatus,
and light extinction and emission
Experiments for soot formation were performed in a stain-
less shock tube with 100 mm diameter. The low pressure
122
T. Tsuboi et al.: Soot formation of benzene
section was 4200 mm long, while the high pressure sec-
tion was 2200 mm long. The leakage of the tube was 0.1
Pa/min. Further details of the shock tube can be seen in
Tsuboi et al. 1992.
He-Ne laser at 632.8 nm was used as the light source for
the light extinction measurements. The monochromatic
light extinction is described as follows:
I
I
0
= exp(−CextNL) .
(1)
Here, I
0
is the incident light intensity and I is the trans-
mitted light intensity through the column length L with
the concentration N of absorbing species, whose cross sec-
tion is Cext. This cross section Cext can be expressed as:
C
ext
=
36πV n
2
κ
Z
1
here, Z
1
= (n
2
+ n
2
κ
2
)
2
+ 4(n
2
− n
2
κ
2
) + 4 .
The variables n, κ are those of the complex index m =
n(1 − κi). In this paper we used n = 1.57, nκ = 0.44 at
632.8 nm (Darzell and Sarofim 1969). In the case that the
particle diameter is much smaller than the wavelength of
the light source, Eq. (1) can be recalculated
ln
I
I
0
= −36π
n
2
κ
Z
1
N
S
V
S
L
λ .
(2)
Here, N
S
is the number density of soot particles, V
S
is
the volume of one soot particle and the light path length
L = 10 cm. Therefore one could calculate the time history
of total soot volume per cm
3
, N
S
V
S
.
The visible and infrared emission intensities were mea-
sured at wavelengths of 0.63, 0.80, 1.12, 1.52, 2.3, 3.4,
3.9, and 4.3
µ
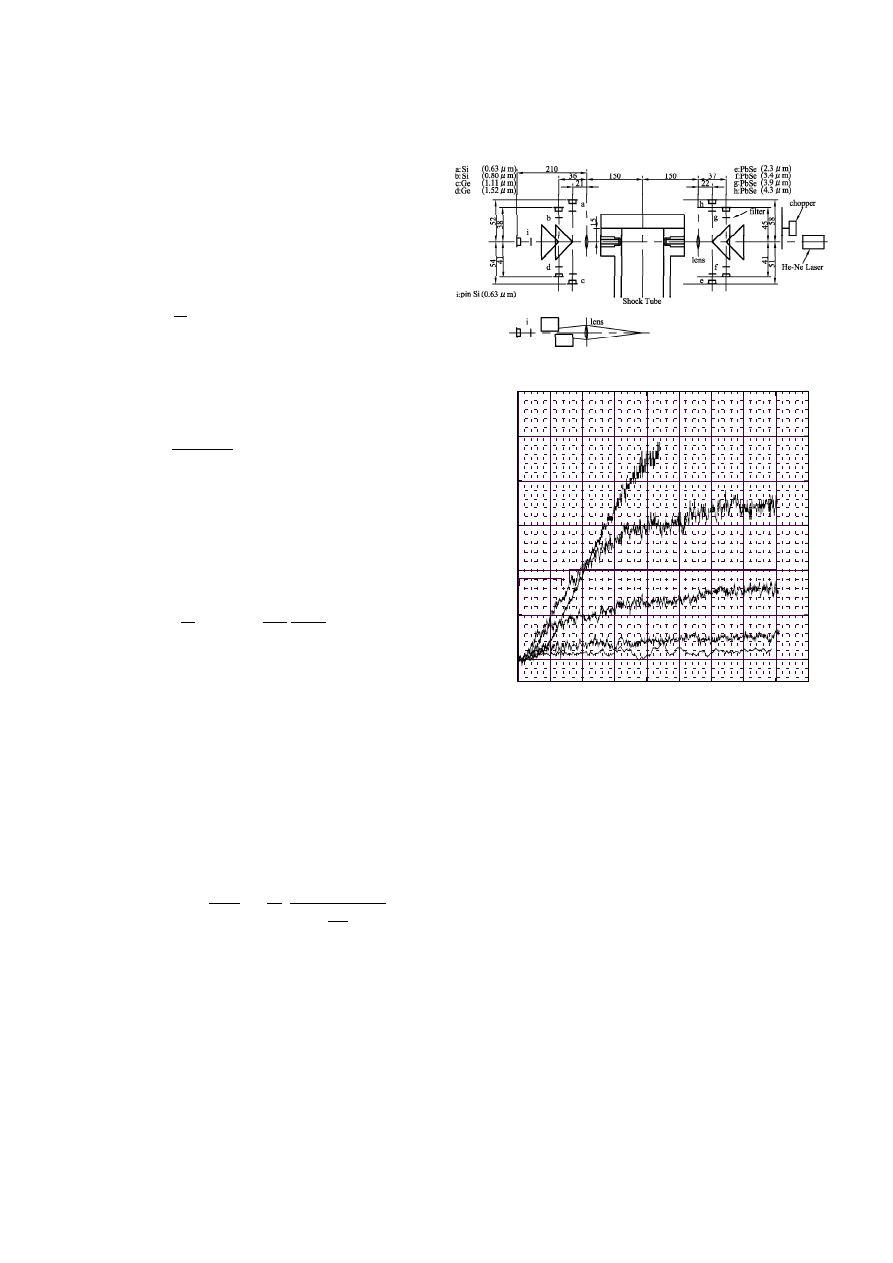
m using narrow band pass filters. Figure
1 shows the optical setup for measurement of the IR-
emission. Simultaneously, the He-Ne laser run from right
to left through the small gap between prism reflectors and
the light extinction was measured at place ”i” on the left
side. Using the Hottel-Broughton equation the spectral
intensity is described as follows:
I
λ
=
1 − exp
−
kcl
λ
0.95
1
λ
5
C
1
exp
C
2
λT
− 1
.
(3)
The best-fit I
λ
–λ of this equation gave the temperature
T and the kcl-value, which was proportional to the total
volume of soot N
S
V
S
.
3 Results
Soot formation behind reflected shock waves was followed
at temperatures 1400–4000 K in the density range between
1 and 8×10
−5
mol/cm
3
for mixtures between 0.5 and 1.0%
C
6
H
6
in argon. The measurements of laser light extinction
and visible-infrared radiation intensities were performed
simultaneously.
Fig. 1. Optical system for measurement of infrared emission
0
500
0
2
4
6
N
S
V
S
[x10
6
cm
3
/cm
3
]
Time t [
µ
s]
2100K
2230K
2290K
2340K
1940K
0.5 % C
6
H
6
ρ
= 2x10
–5
[mol/cm
3
]
Model 1
Model 2
Region1
Region2
Fig. 2. Soot volume profiles N
S
V
S
at various temperatures
3.1 Laser extinction
Figure 2 shows the profiles of total soot volume N
S
V
S
at
temperatures of 1940, 2100, 2230, 2290 and 2340 K. At
low temperatures the total soot volume increased rapidly
in the early part (region 1) of the reaction time and
the growth rate increased with increasing temperature
till about 2250 K, and in the later part (region 2) the
growth rate decreased. At high temperatures above about
2250 K the region 1 was shortened and could not be recog-
nized above 2300 K. The soot production rate decreased
with increasing temperature. These phenomena were
clearly observed especially in the later part (region 2) of
reaction time where the total soot volume increases lin-
early.
Previous workers (Frenklach et al. 1983a; Frenklach
et al. 1983b; Tanke et al. 1998) observed soot formation
mainly in the later part of the time history of light ex-
tinction. We tried to measure the early part of the time
history of soot formation, though there was some influ-
ence of species other than soot particles. For calculation
of soot production we made some assumptions (Tsuboi et
al. 1992):
N
S
V
S
= at
n
,
T. Tsuboi et al.: Soot formation of benzene
123
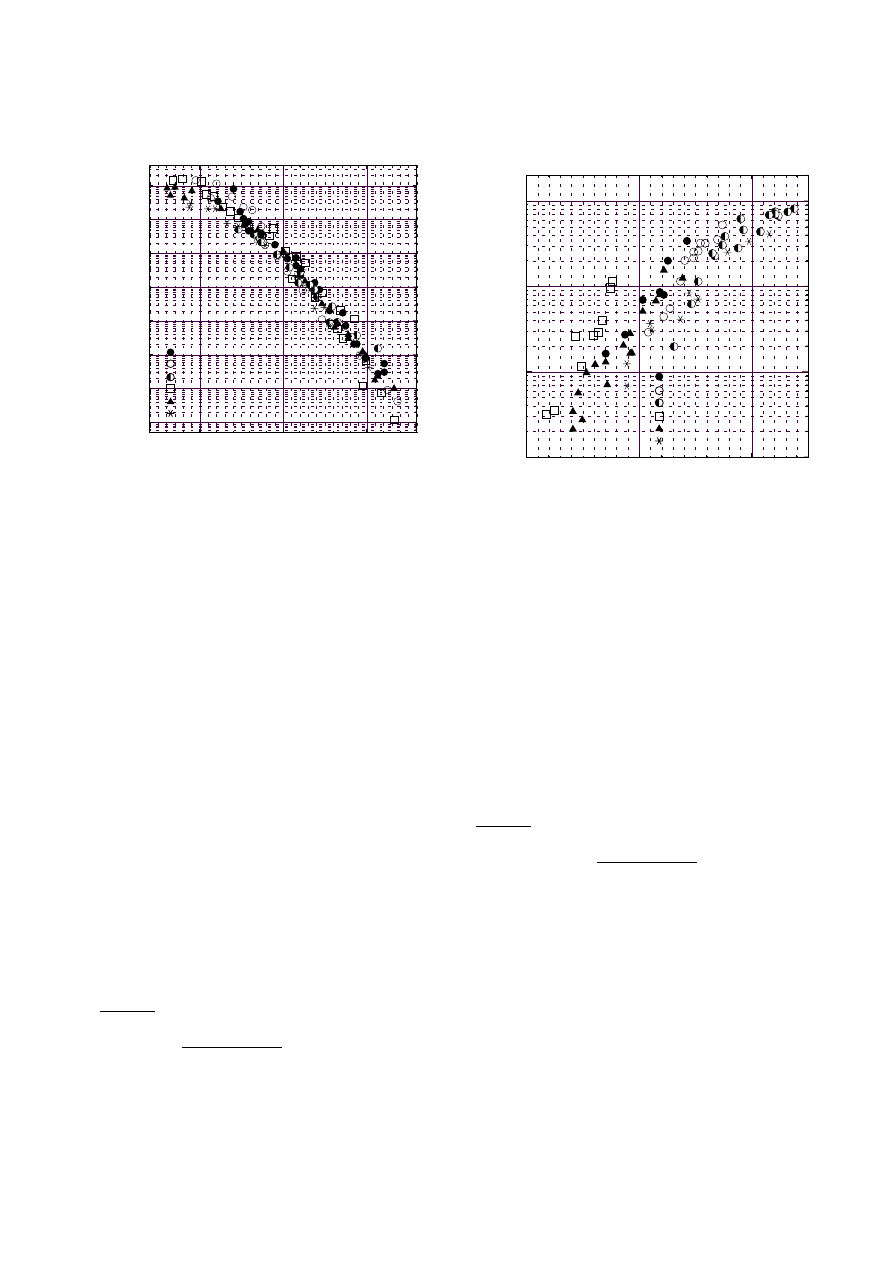
4
5
6
10
2
10
4
10
6
10
8
k
S
V
S
=[3xdN
S
V
S
/d(t
3
)][C
6
H
6
]
–
2.6
[Ar]
–
0.2
10
4
/T
5
[1/K]
: P
4
=1.4MPa(0.5%C
6
H
6
)
: P
4
=0.6MPa(0.5%C
6
H
6
)
: P
4
=0.3MPa(0.5%C
6
H
6
)
: P
4
=1.4MPa(1%C
6
H
6
)
: P
4
=0.6MPa(1%C
6
H
6
)
: P
4
=0.3MPa(1%C
6
H
6
)
cm
3
/
µ
s
–
3
(mol/cm
3
)
–
2.8
]
Fig. 3. Temperature-dependent reduced rates of soot forma-
tion at low temperature (region 1). Data were obtained from
the laser extinction signals
here N
S
and V
S
are the number density of the soot parti-
cles and the average volume of a soot particle, respectively.
That is: when the number density of soot whose volume
is V
S
i
is N
S
i
, the total soot volume per unit gas mixture
is
i
N
S
i
V
S
i
. The suffix S
i
is described as the i-th soot-
particle in the modeling. The variable N
S
V
S
is the total
volume of soot per unit gas volume. The variable t is time.
The variable n could be estimated from the experiment
and it was about 3 under our conditions.
The experimental results for the soot production is
shown by an equation:
k
S
V
S
1
= 3a = [3d(N
S
V
S
)/dt
3
][C
6
H
6
]
−2.6
[Ar]
−0.2
= [3d(I
0
/I)/dt
3
][C
6
H
6
]
−2.6
[Ar]
−0.2
/[36πn
2
κL/(Z
1
λ)] .
(4)
The definition of k
S
V
S
1
is given in Eq. (19). The pre-factor
3 came from the differential of dt
3
. The production rate in-
creased with increasing temperature and depended mainly
on the production rate of the intermediates B. Figure 3
shows such temperature dependent rates in reduced form.
The influence of benzene concentration on the soot pro-
duction rate was 2.6 and that of argon was 0.2. The val-
ues n, κ and Z
1
were the factors of wavelength-dependent
complex index of soot particles and the related variables.
Under 2000 K one could express the relation as follows:
3
d(N
S
V
S
)
dt
3
= (6 ± 5) × 10
23
[C
6
H
6
]
2.6±0.1
[Ar]
0.2±0.1
×exp
−
640000 ± 40000
RT
[cm
3
/cm
3
µ
s
3
] .
(5)
The overall activation energy contained the activation
energy (E
a
) due to chemical reactions and the activation
energy (E
b
= ∆G
∗
) due to phase change. The influence of
an activation energy (E
b
) due to this phase change on the
overall activation energy increased with increasing tem-
perature and the activation energy (E
b
) increased with
3
4
5
10
–1
10
0
10
1
10
2
[dN
S
V
S
/dt][C
6
H
6
]
–
2.6
[Ar]
1.7
[1/
µ
s(mol/cm
3
)
–
0.9
]
: P
4
=1.4MPa(0.5%C
6
H
6
)
: P
4
=0.6MPa(0.5%C
6
H
6
)
: P
4
=0.3MPa(0.5%C
6
H
6
)
: P
4
=1.4MPa(1%C
6
H
6
)
: P
4
=0.6MPa(1%C
6
H
6
)
: P
4
=0.3MPa(1%C
6
H
6
)
10
4
/T
5
[1/K]
Fig. 4. Temperature-dependent reduced rates of soot forma-
tion at high temperature (region 2). Data were obtained from
the laser extinction signals
increasing temperature, as described in Eq. (11). When
this activation energy (E
b
) increased, the rate of phase
change decreased. Therefore, the apparent activation en-
ergy of soot-particles production rate decreased with in-
creasing temperature especially above 2000 K. A large rate
of soot production was still observed shortly behind the
reflected shock wave between 2000 and 2200 K but the rate
became small after the early part of light extinction. How-
ever the rate did not go to zero. The soot was produced
slowly and the extinction signal increased linearly with
time. Figure 4 shows the temperature dependence in re-
duced form. The increasing rate decreased with increasing
temperature. The following expression was experimentally
determined:
d(N
S
V
S
)
dt
= (7 ± 6) × 10
−6
[C
6
H
6
]
2.6±0.2
[Ar]
−1.7±0.1
×exp
266000 ± 50000
RT
[cm
3
/cm
3
µ
s] . (6)
3.2 IR-emission
The above Eqs. (5) and (6) were obtained only from a sin-
gle absorption line (632.8 nm). Though it was previously
confirmed that these particles have the characteristic of
black body radiation Tsuboi et al. 1986, the time histo-
ries of spectral intensities of the particles were followed
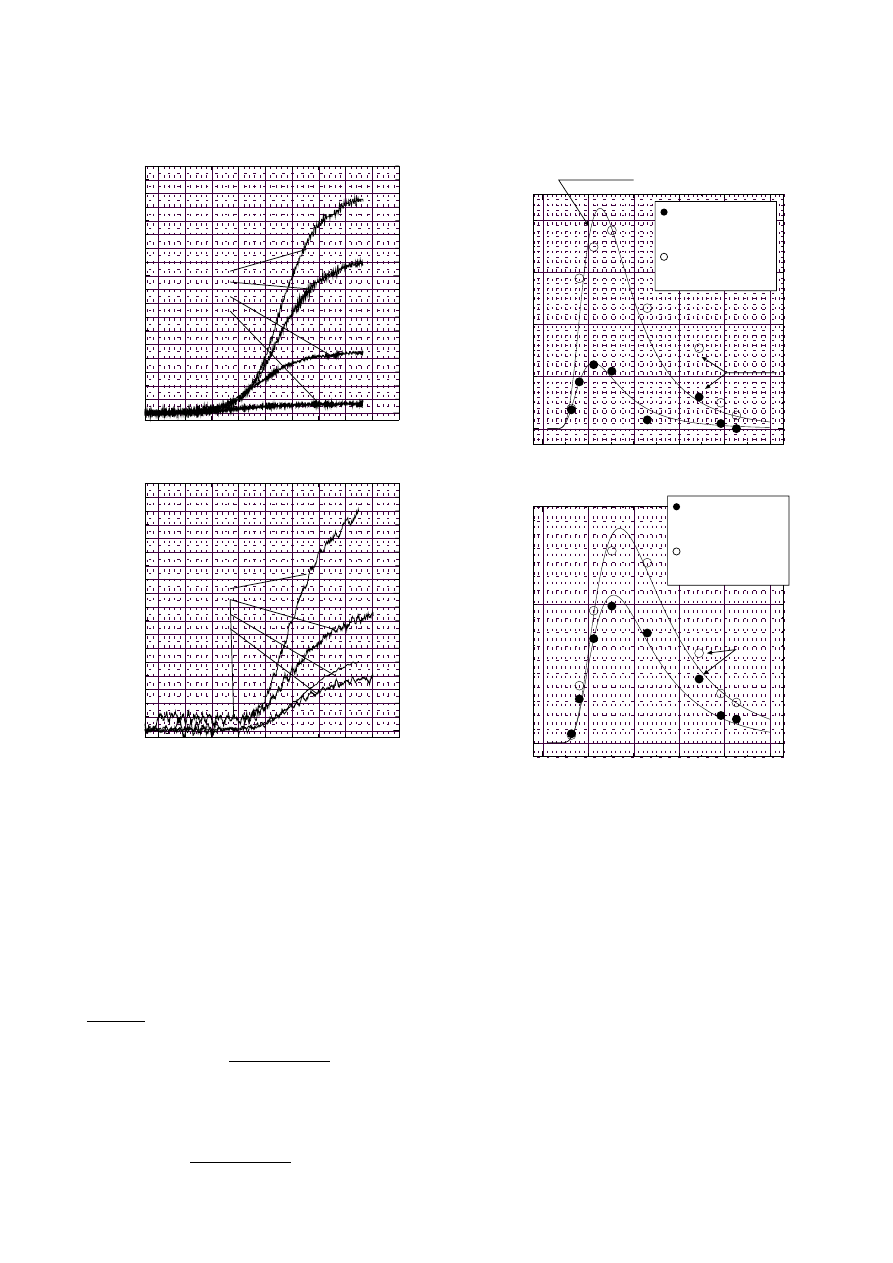
in order to obtain more information. Figure 5 shows the
time histories of monochromatic emissive powers. From
these spectra we could calculate the time histories of soot
temperature and of a term which was proportional to the
total soot volume, by using the Hottel-Broughton equa-
tion. Figure 6 shows the best-fit of the Hottel-Broughton
equation.
Figure 7 shows the kcl-value, which is proportional to
the volume density of soot at various temperatures. As
124
T. Tsuboi et al.: Soot formation of benzene
0
0.5
0
50
100
150
Time t [ms]
E
λ
kW/m
2
µ
m]
1 % C
6
H
6
in Ar
T
5
= 1780 K
ρ
5
= 3.46 x 10
–5
mol/cm
3
1.52
µ
m
1.12
µ
m
0.80
µ
m
0.63
µ
m
0
0.5
0
50
100
150
Time t [ms]
E
λ
kW/m
2
µ
m]
1 % C
6
H
6
in Ar
T
5
= 1780 K
ρ
5
= 3.46 x 10
–5
mol/cm
3
2.3
µ
m
3.4
µ
m
3.9
µ
m
4.3
µ
m
Fig. 5. Monochromatic emissive powers at 0.63, 0.80, 1.12,
1.52
µ
m and at 2.3, 3.4, 3.9, 4.3
µ
m
seen in the lower figure the sensitivities obtained from in-
frared signals were not as high as that of the light extinc-
tion of laser. The kcl profile was observed after the appear-
ance of N
S
V
S
-signal obtained by light extinction. There-
fore, for the empirical expression it was better to use the
variable τ (so-called induction period). Thus we defined,
as the increasing velocity of kcl, the rate 3d(kcl)/d(t−τ)
3
,
which was similar to the expression used in the analysis
of light extinction signals. The expression found was:
3
d(kcl)
d(t − τ)
3
= (2 ± 1) × 10
16
[C
6
H
6
]
1.8±0.1
[Ar]
0.7±0.2
×exp
−
280000 ± 40000
RT
[
µ
m
0.95
/
µ
s
3
](7)
τ = (4 ± 2) × 10
10
[C
6
H
6
]
−0.22±0.07
[Ar]
−0.74±0.12
× exp
−
240000 ± 40000
RT
[s] .
(8)
0
2
4
0
20
40
Wave length [
µ
m]
E
λ
[kW/m
2
µ
m]
E
λ
=
ε
λ.
E
b
λ
: t=0.30 [ms]
T
P
=2180 [K]
kcl=0.024 [
µ
m
0.95
]
: t=0.40 [ms]
T
P
=1950 [K]
kcl=0.169 [
µ
m
0.95
]
3.44
µ
m
0
2
4
0
100
Wave length [
µ
m]
E
λ
[kW/m
2
µ
m]
: t=0.50 [ms]
T
P
=1670 [K]
kcl=1.603 [
µ
m
0.95
]
: t=0.60 [ms]
T
P
=1660 [K]
kcl=4.983 [
µ
m
0.95
]
3.44
µ
m
Fig. 6. Best fit of Hottel-Broughton equation for calculation
of T
P
and kcl, obtained from Fig. 5
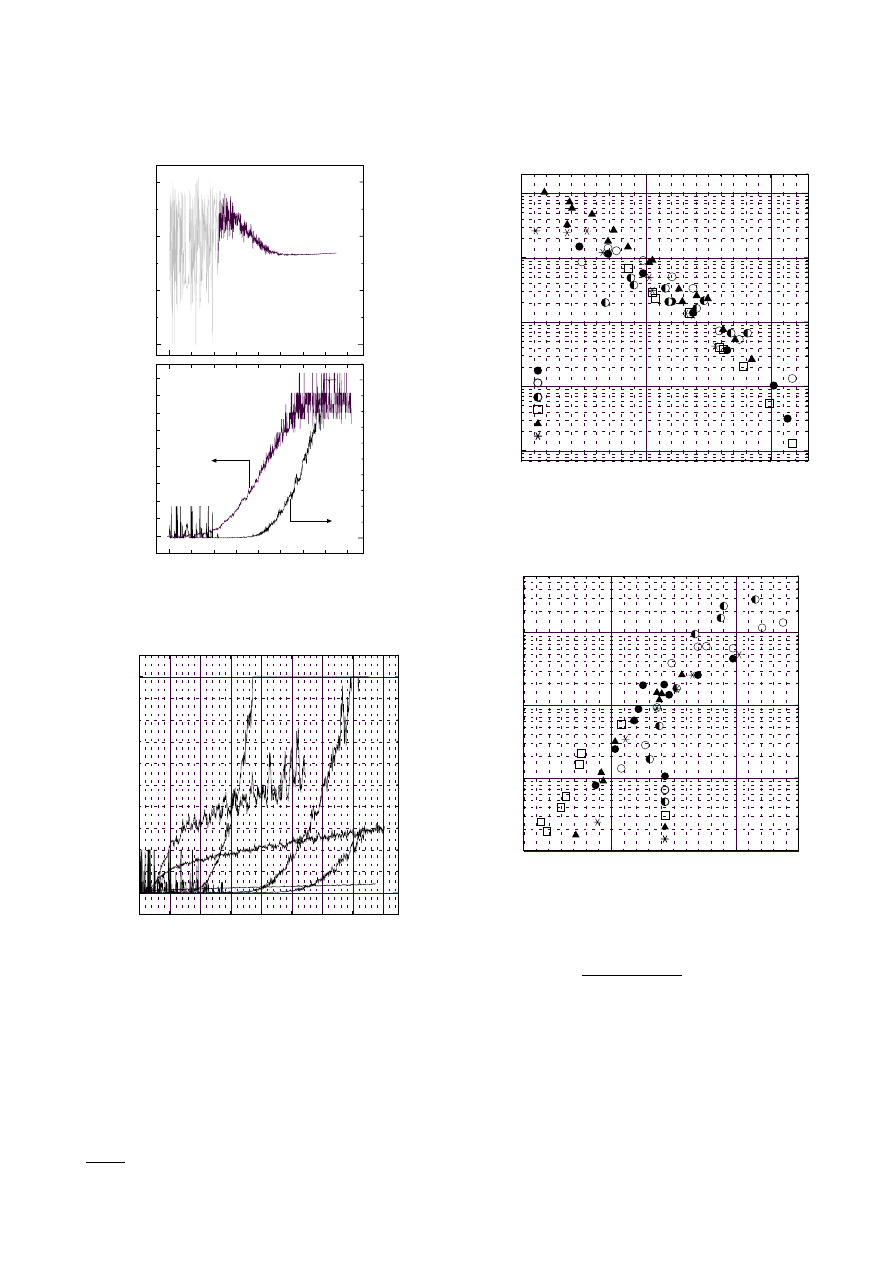
Figure 8 shows the kcl-value profiles at temperatures
1710, 1780, 1890, 2270, 2390 and 2540 K. These kcl-value
profiles were similar to the N
S
V
S
profiles in Fig. 2. At
low temperature the soot volume grew rapidly in the
early part of reaction time and the growth rate increased
with increasing temperature till about 2270 K, and in the
later part the growth rate decreased. At high temperature
above about 2270 K the region 1 in Fig. 2 was shortened
and could not be recognized above 2270 K. The soot pro-
duction rate decreased with increasing temperature. This
phenomenon was clear especially in the later part of reac-
tion time (the region 2 in Fig. 2) where the soot volume
increased linearly.
Figure 9 shows the reduced relation [d(kcl)/d(t−τ)
3
]×
[C
6
H
6
]
−1.8
[Ar]
−0.7
versus reciprocal temperature.
The profile of soot formation above 2200 K could not
be measured with our measuring system shortly behind
reflected shock waves, because the time constant of our
measuring system was large, while the reaction velocity
T. Tsuboi et al.: Soot formation of benzene
125
0
1000
2000
3000
0
0.2
0.4
0.6
0.8
0
5
0
10
T
P
[K]
kcl [
µ
m
0.95
]
Time [ms]
N
S
V
S
[x10
6
cm
3
/cm
3
]
1 % C
6
H
6
in Ar
T
5
= 1780 K
ρ
5
= 3.46x10
–5
mol/cm
3
Fig. 7. T
P
, kcl of soot particles calculated from Fig. 5 and
N
S
V
S
from light extinction
0
200
400
600
800
0
10
kcl [
µ
m
0.95
]
Time t [
µ
s]
1 % C
6
H
6
in Ar at P
4
=0.6MPa.
1710K
1780K
1890K
2270K
2390K
2540K
Fig. 8. Soot formation rates at temperatures 1710, 1780, 1890,
2270, 2390 and 2540 K
(soot production velocity) was much larger. However, the
slow increase of soot concentration was observed after this
fast soot production, which was similar to the light ex-
tinction experiment (Fig. 2). Figure 10 shows the reduced
temperature dependence, and the reduced relation is as
follows:
d(kcl)
dt
= (1.0 ± 0.6) × 10
8
[C
6
H
6
]
4.7±0.3
[Ar]
−2.8±0.1
4
5
6
10
6
10
8
10
10
: P
4
=1.4MPa(0.5%C
6
H
6
)
: P
4
=0.6MPa(0.5%C
6
H
6
)
: P
4
=0.3MPa(0.5%C
6
H
6
)
: P
4
=1.4MPa(1%C
6
H
6
)
: P
4
=0.6MPa(1%C
6
H
6
)
: P
4
=0.3MPa(1%C
6
H
6
)
10
4
/T
5
[1/K]
[dkcl/d(t
–
τ
)
3
][C
6
H
6
]
–
1.8
[Ar]
–
0.7
[
µ
m
0.95
/
µ
s
3
(mol/cm
3
)
–
2.5
]
Fig. 9. Temperature-dependent reduced rates of soot forma-
tion. Data were obtained from the thermal radiation at 0.63,
0.80, 1.12, 1.52
µ
m and at 2.3, 3.4, 3.9, 4.3
µ
m. Region 1
4
5
10
14
10
15
10
16
10
17
: P
4
=1.4MPa(0.5%C
6
H
6
)
: P
4
=0.6MPa(0.5%C
6
H
6
)
: P
4
=0.3MPa(0.5%C
6
H
6
)
: P
4
=1.4MPa(1%C
6
H
6
)
: P
4
=0.6MPa(1%C
6
H
6
)
: P
4
=0.3MPa(1%C
6
H
6
)
[dkcl/dt][C
6
H
6
]
–
4.7
[Ar]
2.8
[
µ
m
0.95
/
µ
s(mol/cm
3
)
–
1.9
]
10
4
/T
5
[1/K]
Fig. 10. Temperature-dependent reduced rates of soot forma-
tion. Data were obtained from the thermal radiation at 0.63,
0.80, 1.12, 1.52
µ
m and at 2.3, 3.4, 3.9, 4.3
µ
m. Region 2
×exp
343000 ± 50000
RT
[
µ
m
0.95
/
µ
s] .
(9)
4 Discussion
The soot formation process was followed by observing
both the light extinction and the visible and infrared ra-
diation. The technique to obtain the soot volume by mea-
suring the laser extinction was used by previous workers
(Frenklach et al. 1983a; Frenklach et al. 1983b; Tanke et
al. 1998; Tsuboi et al. 1986), though it was not certain
whether the measured signal was only due to soot. One of

126
T. Tsuboi et al.: Soot formation of benzene
us (TT) confirmed the visible and the infrared radiation
were the black body radiation in the later part of soot
formation (Tsuboi et al. 1986). As one technique to de-
cide whether the signal is due to soot, one can measure
the light signals at various wavelengths, simultaneously.
We tried to measure the visible and infrared radiation.
The radiation must have black body radiation, if it is due
to soot. Figure 6 shows that the spectral intensities are
similar to the black body radiation (Figs. 5,6).
In the wavelength region used for the soot measure-
ment there must be some absorption and emission due to
complex molecules beside soot particles. At 3.4
µ
m there
was emission due to benzene and related intermediates.
Therefore we omitted the emission signal at 3.4
µ
m for
calculation of the temperature and the kcl-value.
The temperature, which was calculated from emission
signals, was higher than that of equilibrium temperature
in the early stage of the formation. The nucleation of soot
is an exothermic reaction and the heat goes to argon as
the heat bath, i.e. heat conduction from soot particles to
argon. Therefore our measured temperature was probably
higher than the equilibrium temperature in the early stage
of the time history of soot.
The radiation signal appeared behind the laser extinc-
tion, since the sensitivity of the optical system for IR-
radiation was not as high as that of laser extinction, as
mentioned above. However, the inferred kcl-value showed
similar profile with the He-Ne-laser extinction. Therefore,
we decided one could measure the soot signal with our
optical systems.
The previous workers expressed their experimental re-
sults with the induction period, soot formation rate and
soot yield (Frenklach et al. 1983a; Frenklach et al. 1983b;
Tanke et al. 1998). In our experiments the rate of soot pro-
duction was still not zero in the region of the soot yield,
where the soot formation was defined to be practically
zero by previous workers. Furthermore, we observed the
early part of soot signals and took information from these
data.
For the soot formation mechanism in this region we at-
tempted to do the following modeling (Tsuboi et al. 1992)
and the expression obtained was compared qualitatively
with the experimental results:
(1) Benzene reaction and the production of one or some
complex species (clusters) B. The cluster B was not only
one species but they must be several species. These re-
actions must occur in the gas phase and there must also
some chain reactions.
n
1
A → B
l
( k
a
) .
(2) Phase change Bto soot S
1
(coagulation)
n
2
B → S
1
( k
b
) .
(3) Growth of soot particles
S
1
+ B → S
2
( k
1
)
S
2
+ B → S
3
( k
2
)
............
S
n
+ B → S
n+1
( k
n
) .
(4) Cohesion of soot particles
S
i
+ S
j
→ S
i+j
( k
c
) .
The rate of volume N
S
i
V
S
i
of soot particle S
i
are
d
d
t
(N
S
1
V
S
1
) = k
b
N
n
2
B
V
S
1
− k
1
N
B
N
S
1
V
S
1
d
d
t
(N
S
2
V
S
2
) = k
1
N
B
N
S
1
V
S
2
− k
2
N
B
N
S
2
V
S
2
d
d
t
(N
S
3
V
S
3
) = k
2
N
B
N
S
2
V
S
3
− k
3
N
B
N
S
3
V
S
3
.........
d
d
t
(N
S
n
V
S
n
) = k
n−1
N
B
N
S
n−1
V
S
n
− k
n
N
B
N
S
n
V
S
n
.
The total volume rate of soot particles is
d
dt
(N
S
V
S
) =
n
i=1
d
dt
(N
S
i
V
S
i
)
= k
b
N
n
2
B
V
S
1
+ N
B
V
B
n
i=1
k
i
N
S
i
.
(10)
Here, V
S
i
− V
S
i−1
= V
B
. The rate k
i
is equivalent to the
collision frequency between S
i
and B, which is given as
follows.
k
i
=
πd
2
S
i
B
σ
S
i
B
·
8kT
πµ
1/2
.
The rate k
b
is the rate constant of phase change to soot
from the gas phase of C-species and given in Tsuboi et al.
1992:
k
b
= k
b0
exp (−∆G
∗
/RT )
and
∆g =
16πγ
3
3∆H
v
(T
0
)
2
·
1
(1 − T/T
0
)
2
∆G
∗
= N
0
∆g .
(11)
Here, γ is the surface tension, ∆H
v
(T
0
) is the latent heat
of soot from gas phase at T
0
, ∆g and ∆G
∗
are the ac-
tivation energy to form the soot. Strictly speaking, ∆G
∗
is the activation energy to make the minimum soot par-
ticle (embryo) from the unstable species of the radius
r = 0. However the species Bhas already some size.
Therefore, one should consider that k
b
is proportional to
k
b0
exp (−∆G
∗
/RT ).
The rate of N
B
is
d
dt
N
B
= k
a
N
n
1
A
− k
b
N
n
2
B
−N
B
(k
1
N
S
1
+ k
2
N
S
2
+ · · ·k
n
N
S
n
) . (12)
When one uses the early part of soot formation, the first
term of Eq. (12) must be rate determining, then one ob-
tains,
d
dt
N
B
∼ k
a,0
e
k
r
t
N
n
1
A
.
(13)

T. Tsuboi et al.: Soot formation of benzene
127
If one takes only the first step of reactions for the forma-
tion of B-species, the over-all rate constant k
a
in Eq. (13)
can be constant. However, if one considers the period un-
til the beginning of soot formation, one probably must as-
sume that some chain reactions occur. Therefore k
a,0
e
k
r
t
had to be applied for the rate k
a
of over-all reactions which
produce the B-species. The second and the third terms in
Eq. (12) must be still small. If one integrates the equation
N
B
=
k
a,0
k
r
e
k
r
t
− 1
N
n
1
A
(14)
by considering V
S
1
= n
2
V
B
, Eq. (10) can be substituted
for Eq. (14).
d
dt
(N
S
V
S
) = n
2
k
b
N
n
2
B
V
B
1 +
N
B
V
B
n
i=1
k
i
N
S
i
n
2
k
b
N
n
2
B
V
B
. (15)
At the beginning of the reaction one can take the first
part of the Eq. (15), because probably, k
B
≈ k
i
, k
b
N
n
2
B
>
N
B
×
k
i
N
S
i
in the early stage of the soot formation, then
N
A
= constant and we obtain the following equation:
d
dt
(N
S
V
S
) = n
2
k
b
k
a
k
r
e
k
r
t
− 1
N
n
1
A
n
2
V
B
.
(16)
If one calculates the above equation further, then one can
obtain
d
dt
(N
S
V
S
) = n
2
k
b
k
n
2
a
t
n
2
N
n
1
n
2
A
V
B
N
S
V
S
=
n
2
n
2
+ 1
k
b
k
n
2
a
t
n
2
+1
N
n
1
n
2
A
V
B
(17)
for the time t ≈ 0 and at the time k
r
t > 1 one can obtain
d
dt
(N
S
V
S
) = n
2
k
b
k
a
k
r
n
2
e
2k
r
t
N
n
1
n
2
A
V
B
N
S
V
S
= n
2
k
b
1
2k
r
k
a
k
r
n
2
e
n
2
k
r
t
N
n
1
n
2
A
V
B
. (18)
The time history of N
S
V
S
, which is obtained from Eq. (2),
indicates that n
2
∼ 2. Using Eq. (17), one can obtain the
relation N
S
V
S
= a × t
3
, given in Eq. (4) and then one can
obtain 2 k
S
V
B
(= k
S
V
S
1
).
3d(N
S
V
S
)
dt
3
= 2k
b
k
2
a
V
B
N
2n
1
A
= 2k
S
V
B
N
2n
1
A
= k
S
V
S
1
N
2n
1
A
(19)
This expression is equivalent to the experimental expres-
sion with Eqs. (4), (5) and (7). The signals of infrared
emission to measure the kcl-value are less sensitive than
those of He-Ne laser light extinction. The time history of
NV
S
of He-Ne laser was in the region k
r
< 1 and one can
use Eq. (17). On the contrary the time history of kcl ob-
tained from infrared emission was in the region k
r
> 1 and
one can use Eq. (4).
This analysis could be used in the temperature region
under 2100 K. The time interval when the B-species was
produced decreased with increasing temperature. Then
one cannot explain the soot formation with Eqs. (17) and
(4). Above 2300 K the concentration N
B
might not be
time-dependent and can be constant. Namely,
N
B
= n
N
A
(= constant) .
(20)
Then one can obtain from Eq. (15)
d
dt
(N
S
V
S
) = k
b
N
n
2
B
V
Si
= k
b
n
N
A
n
2
V
Si
(21)
then
N
S
V
S
= k
b
n
N
A
n
2
V
S
i
t + C .
(22)
Here C is a constant at t = 0. This expression is equivalent
to Eqs. (6) and (9). The activation energy −∆G
∗
/RT of
the rate constant k
b
is strongly temperature-dependent.
With increasing temperature the energy increases until
T = T
0
. Therefore, the rate constant k
b
decreases with
increasing temperature. The negative temperature depen-
dence in Fig. 10 shows this effect. This effect can be seen
in Figs. 3, 9. Namely, the apparent activation energy of
soot formation rate decreased at above 2200 K.
Since this modeling is a rough estimation of soot for-
mation, it cannot be explained precisely, however one can
understand the temperature dependence of the soot for-
mation rate.
5 Conclusion
The time histories of soot volume, kcl-value and temper-
ature were followed by observing the light extinction of
He-Ne laser and the thermal radiation at 0.63, 0.80, 1.12,
1.52, 2.3, 3.4, 3.9, 4.3
µ
m. The following expressions were
obtained.
(1) From laser extinction:
under 2000 K in the early stage of soot formation,
3
d(N
S
V
S
)
dt
3
= (6 ± 5) × 10
23
[C
6
H
6
]
2.6±0.1
[Ar]
0.2±0.1
× exp
−
640000 ± 40000
RT
[cm
3
/cm
3
µ
s
3
]
above 2100 K in the later stage of soot formation,
d(N
S
V
S
)
dt
= (7 ± 6) × 10
−6
[C
6
H
6
]
2.6±0.2
[Ar]
−1.7±0.1
×exp
266000 ± 50000
RT
[cm
3
/cm
3
µ
s] .
(2) From thermal radiation:
under 2000 K in the early stage of soot formation,
3
d(kcl)
d(t − τ)
3
= (2 ± 1) × 10
16
[C
6
H
6
]
1.8±0.1
[Ar]
0.7±0.2
×exp
−
280000 ± 40000
RT
[
µ
m
0.95
/
µ
s
3
]
τ = (4 ± 2) × 10
10
[C
6
H
6
]
−0.22±0.07
[Ar]
−0.74±0.12
×exp
−
240000 ± 40000
RT
[s]

128
T. Tsuboi et al.: Soot formation of benzene
above 2100 K in the later stage of soot formation,
d(kcl)
dt
= (1.0 ± 0.6) × 10
8
[C
6
H
6
]
4.7±0.3
[Ar]
−2.8±0.1
×exp
343000 ± 50000
RT
[
µ
m
0.95
/
µ
s] .
Acknowledgements. This project is partially supported by
Joint Program of JSPS-NEDO Matching Fund (No.25) in 1999.
References
Bauer SH, Zhang LM (1983) ShockTube Pyrolysis of Poly-
cyclic Aromatics – Detection of Precursors. Proceedings
of the 14th International Symposium on ShockTubes and
Waves, pp. 654–661
B¨ohm H, Jander H, Tanke D (1998) PAH Growth and Soot For-
mation in the Pyrolysis of Acetylene and Benzene at high
Temperatures and Pressures: Modeling and Experiment.
27th Symposium (International) on Combustion, pp. 1605–
1612
Bonne U, Wagner HGg (1965) Untersuchung des Reaktions-
ablaufs in fetten Kohlenwasserstoff-Sauerstoff-Flammen.
III. Optische Untersuchungen an rußenden Flammen.
Berichte der Bunsengesellschaft f¨ur Physikalische Chemie
69:35–48
Calcote HF (1981) Mechanisms of Soot Nucleation in Flames-
A Critical Review. Combustion and Flame 42:215–242
Chippett S, Gray WA (1978) The Size and Optical Properties
of Soot Particles Combustion and Flame 31:149–159
D’Alessio A, Beretta F, Venitozzi C (1972) Optical Investiga-
tions on Soot Forming Methane-Oxygen Flames. Combus-
tion Science and Technology 3:263–272
Darzell WH, Sarofim AF (1969) Optical Constants of Soot and
Their Application to Heat-Flux Calculations.. Transactions
of the ASME, Journal of Heat Transfer (1969-2), pp. 100–
104
Frenklach M, Taki S, Likwok Cheong CK (1983a) Soot Particle
Size and Soot Yield in ShockTube Studies. Combus. Flame
51:37–43
Frenklach M, Taki S, Durgaprasad, Matula, RA (1983b) Soot
formation in shock-tube pyrolysis of acetylene, allene, and
1,3-butagiene. Combus. Flame 54:81–101
Frey JW, Corn M (1967) Physical and Chemical Characteris-
tics of Particulates in a Diesel Exhaust. American Indus-
trial Hygiene Association Journal, pp. 468–478
Graham SC (1974) The Refractive Indices of Isolated and of
Aggregated Soot Particles. Combustion Science and Tech-
nology 9:159–163
Johnson BE, Lester TW, Merklin JF, Sorenson CM (1983)
Soot from Benzene/Cyclohexane Pyrolysis. Proceedings of
the 14th International Symposium on ShockTubes and
Waves, pp. 648–653
Kadota T, Hiroyasu H, Farazandehmehr (1977) Soot Forma-
tion by Combustion of a Fuel Droplet in High Pressure
Gaseous Environments. Combustion and Flame 29:67–75
Kham IM, Wang CHT, Langridge BE (1971) Coagulation and
Combustion of Soot Particles in Diesel Engines. Combus-
tion and Flame 17:409–419
ParkC, Appleton JP (1973) Shock-Tube Measurements of Soot
Oxidation Rates. Combustion and Flame 20:369–379
Radcliffe SW, Appleton JP (1971) Shock-Tube Measurements
of Carbon to Oxygen Atom Ratios for Incipient Soot For-
mation with C
2
H
2
, C
2
H
4
and C
2
H
6
Fuels. Combustion Sci-
ence and Technology 3:255–262
Sj¨ogren A (1973) Soot Formation by Combustion of an At-
omized Liquid Fuel. 14th Symposium (International) on
Combustion, pp. 919–927
Tanke D, Wagner HGg, Zaslonko IS (1998) Mechanism of
the Action of Iron-Bearing Additives on Soot Formation
behind ShockWaves. 27th Symposium (International) on
Combustion, pp. 1597–1604
Tsuboi T, Kamei M, Kobayashi K, Ikuta Y, Katoh R (1986)
Optische Messungen der Dichte der von Azetylen gebilde-
ten Rußteilchen. Japan. J. Appl. Phys. 25:1165–1168
Tsuboi T, Kamei M, Kobayashi K, Ikuta Y (1992) ¨Uber Ruß-
bildung des Azetylenes hinter reflektierten Stoßwellen. J.
Phys. Soc. Japan 61:4643–4649
Wagner HGg (1979) Soot Formation in Combustion. 17th Sym-
posium (International) on Combustion, pp. 3–19
Wersborg BL, Fox LK, Howard JB (1975) Soot Concentration
and Absorption Coefficient in a Low-Pressure Flame. Com-
bustion and Flame 24:1–10
Yoshizawa Y, Kawada H, Kurokawa M (1979) A Shock-Tube
Study on the Process of Soot Formation from Acetylene
Pyrolysis. 17th Symposium (International) on Combustion,
pp. 1375–1381
Wyszukiwarka
Podobne podstrony:
Evidence for the formation of anhydrous zinc acetate and acetic
69 991 1002 Formation of Alumina Layer on Aluminium Containing Steels for Prevention of
Drilling Fluid Yield Stress Measurement Techniques for Improved understanding of critical fluid p
69 991 1002 Formation of Alumina Layer on Aluminium Containing Steels for Prevention of
Drilling Fluid Yield Stress Measurement Techniques for Improved understanding of critical fluid p
(IV)The effect of McKenzie therapy as compared with that of intensive strengthening training for the
The American Society for the Prevention of Cruelty
Party Games for Large Groups of Teenagers
[Pargament & Mahoney] Sacred matters Sanctification as a vital topic for the psychology of religion
International Convention for the Safety of Life at Sea
Shakespeare Measure for Measure
measure for measure EMH4YESHZ5NVWMNHLNGPH4YSGOZG4YFLFNETRGA
Broad; Arguments for the Existence of God(1)
36 495 507 Unit Cell Models for Thermomechanical Behaviour of Tool Steels
ESL Seminars Preparation Guide For The Test of Spoken Engl
więcej podobnych podstron