
An oxygen radical absorbance capacity-like assay that directly quantifies
the antioxidant’s scavenging capacity against AAPH-derived free radicals
Shunji Kohri
a
, Hirotada Fujii
a,*
, Shigeru Oowada
b
, Nobuyuki Endoh
c
, Yoshimi Sueishi
d
,
Miku Kusakabe
e
, Masashi Shimmei
f
, Yashige Kotake
g
a
School of Health Sciences, Sapporo Medical University, Sapporo, South-1 West-17, Chuo-ku, Sapporo, Hokkaido 060-8556, Japan
b
Division of Dialysis Center, Asao Clinic, Kawasaki, Kanagawa 215-0004, Japan
c
Wakasawan Energy Research Center, Tsuruga, Fukui 914-0192, Japan
d
Department of Chemistry, Faculty of Science, Okayama University, Okayama 700-8530, Japan
e
Department of Sports Education, Hokkaido University of Education, Iwamizawa, Hokkaido 068-8642, Japan
f
Radical Research, Hino, Tokyo 191-0061, Japan
g
Oklahoma Medical Research Foundation, Oklahoma City, OK 73104, USA
a r t i c l e
i n f o
Article history:
Received 9 September 2008
Available online 25 December 2008
Keywords:
Oxygen radical absorbance capacity
ORAC
AAPH
EPR
ESR
Spin trapping
Fluorescence
Free radical
Antioxidant
Scavenger
a b s t r a c t
A new method is proposed for the evaluation of oxygen radical absorbance capacity (ORAC). The current
fluorescence-based ORAC assay (ORAC–FL) is an indirect method that monitors the antioxidant’s ability
to protect the fluorescent probe from free radical-mediated damage, and an azo-radical initiator, AAPH
(2,2-azobis(2-amidinopropane) dihydrochloride), has been used as a thermal free radical source. The
new ORAC assay employs a short in situ photolysis of AAPH to generate free radicals. The electron para-
magnetic resonance (EPR) spin trapping method was employed to identify and quantify AAPH radicals. In
the presence of antioxidant, the level of AAPH radicals was decreased, and ORAC–EPR values were calcu-
lated following a simple kinetic formulation. Alkyl-oxy radical was identified as the sole decomposition
product from AAPH; therefore, we concluded that ORAC–FL is the assay equivalent to alkyl-oxy radical
scavenging capacity measurement. ORAC–EPR results for several antioxidants and human serum indi-
cated that the overall tendency is in agreement with ORAC–FL, but absolute values showed significant
discrepancies. ORAC–EPR is a rapid and simple method that is especially suitable for thermally labile bio-
logical specimens because the sample heating is not required for free radical production.
Ó 2008 Elsevier Inc. All rights reserved.
Although several methods have been proposed for the determi-
nation of the antioxidant’s free radical scavenging capacity
the oxygen radical absorbance capacity (ORAC)
assay is gaining
popularity in agricultural and nutritional sciences. The ORAC assay
is a method to determine the scavenging capacity of compounds
with antioxidant activity against free radicals that are produced from
the azo-radical initiator AAPH (2,2-azobis(2-amidinopropane) dihy-
drochloride)
. Laboratories from the US Department of Agriculture
(USDA) evaluated ORAC values for extracts of nearly 300 selected
fruits, vegetables, nuts, and so forth, and these values are listed on
the USDA’s website (
).
The fluorescence-based ORAC assay (hereafter referred to as
ORAC–FL) originated from Glazer’s laboratory; its principle was
to measure the antioxidant-mediated protection of the fluores-
cent protein b-phycoerythrin from free radical damage
Later, a confirmative study named this method as the ORAC
assay
. Recent ORAC methods adopted a low-molecular-
weight fluorescent compound, fluorescein, as a probe instead of
b
-phycoerythrin
. A vitamin E analog, trolox (
has been used as a standard antioxidant, and ORAC values are
expressed in trolox-equivalent units. When antioxidants are
present, the fluorescence decay time course shows a delay or
shift, and the magnitude of the shift was converted into ORAC
values with computer-aided analysis
.
The objective of this study was to develop an ORAC-like assay
that directly quantifies the antioxidant’s scavenging capacity
against AAPH-derived free radicals. This method employed the
electron paramagnetic resonance (EPR) spin trapping method,
and we named it ORAC–EPR. The spin trapping method is an estab-
lished technique for free radical identification and quantification,
where unstable free radicals are trapped and stabilized via free
0003-2697/$ - see front matter Ó 2008 Elsevier Inc. All rights reserved.
doi:10.1016/j.ab.2008.12.022
*
Corresponding author. Fax: +81 11 612 3617.
E-mail address:
(H. Fujii).
1
Abbreviations used: ORAC, oxygen radical absorbance capacity; AAPH, 2,2-
azobis(2-amidinopropane) dihydrochloride; USDA, US Department of Agriculture;
ORAC–FL, fluorescence-based ORAC assay; EPR, electron paramagnetic resonance;
ORAC–EPR, ORAC assay employing EPR spin trapping method; UV, ultraviolet; GSH,
glutathione; CYPMPO, 5-(2,2-dimethyl-1,3-propoxy cyclophosphoryl)-5-methyl-1-
pyrroline-N-oxide; DMSO, dimethyl sulfoxide; HFSC, hyperfine splitting constant;
AIBN, azobisisobutylnitrile.
Analytical Biochemistry 386 (2009) 167–171
Contents lists available at
Analytical Biochemistry
j o u r n a l h o m e p a g e : w w w . e l s e v i e r . c o m / l o c a t e / y a b i o
radical trapping compounds (spin traps)
. The stabilized
product (spin adduct or free radical adduct) is identified and quan-
tified with EPR spectrometry. ORAC–EPR determines the type and
level of AAPH-derived free radicals in the presence and absence
of antioxidants; therefore, a constant and reproducible amount of
free radicals from AAPH must be produced. Although ORAC–FL
used thermal decomposition to generate AAPH free radicals, we
employed in situ photolysis of AAPH and were able to produce a
reproducible amount of free radicals with ultraviolet (UV)/visible
light illumination. In the presence of antioxidant, the free radical
level was decreased due to the antioxidant’s scavenging activity,
and ORAC–EPR values can be calculated following a simple kinetic
equation. Using ORAC–EPR, we determined ORAC values for several
natural antioxidants and human serum, and we critically evaluated
the method in comparison with ORAC–FL.
Materials and methods
Materials
AAPH (
) was purchased from Wako Pure Chemicals (Osaka,
Japan). Ascorbic acid (vitamin C), N-acetylcysteine, glutathione
(GSH), caffeic acid, genistein, rutin, quercetin, catechin, uric acid,
trolox (
), and sodium phosphate were purchased from Wako
Pure Chemicals (Osaka, Japan). The spin trap CYPMPO (5-(2,2-di-
methyl-1,3-propoxy
cyclophosphoryl)-5-methyl-1-pyrroline-N-
oxide) (
) was obtained from Radical Research (Tokyo, Japan).
Blood was obtained from healthy adult volunteers according to the
protocol approved by the institutional human subject use commit-
tee at Sapporo Medical University.
A light illuminator (cat. no. RUVF-203SR, Radical Research) was
employed to produce free radicals from AAPH. The light source was
either a 200-W Xe arc lamp (San-ei Electronics, Osaka, Japan),
which delivers mainly visible light with a wavelength of 400 to
700 nm, or a 200-W Hg-Xe arc lamp (San-ei Electronics), which
delivers mainly UV light with a wavelength of 200 to 400 nm.
The illuminator was equipped with a quartz fiber-optic guide,
and its far end was mechanically fitted to the hole in front of the
EPR cavity. The illuminator is equipped with a computer-controlla-
ble mechanical shutter, and the illumination period can be set in
the range of 0.1 to 100 s with precision of ±0.01 s. The illumination
conditions were optimized so that AAPH was efficiently photode-
composed to generate free radicals
. The light source was se-
lected to avoid possible photodecomposition of antioxidants. We
used mainly attenuated Xe arc lamp light and illuminated it for
60 s to a sodium phosphate buffer solution (100 mM, pH 7) con-
taining 10 mM AAPH and 10 mM CYPMPO. When an Hg-Xe arc
lamp was used, the AAPH concentration was 1 mM and the illumi-
nation time was 5 s. Under these conditions, AAPH showed the EPR
signal with signal-to-noise ratio larger than 100 (
). Quercetin
and catechin are insoluble in buffer; therefore, 1% dimethyl sulfox-
ide (DMSO) phosphate buffer solution was used as a solvent. The
ORAC–EPR value for this solvent was approximately 0.001 relative
to CYPMPO; thus, the effect on final results was considered to be
negligible. For EPR measurements, a JEOL RE-1X X-band ESR spec-
trometer (Tokyo, Japan) equipped with 100 kHz field modulation
and Win-Rad operation software (Radical Research) was employed.
Typical spectrometer settings were as follows: field modulation
width, 0.1 mT; microwave power, 6 mW; field scan width/rate,
±7.5 mT/2 min; time constant, 0.1 s.
ORAC–EPR measurement
A typical ORAC–EPR procedure was as follows. A phosphate buf-
fer solution of AAPH, antioxidant, and CYPMPO was loaded into a
disposable borosilicate flat sample cell (Radical Research) and
placed inside the EPR cavity. In situ illumination was carried out,
and the EPR signal was recorded immediately after the illumina-
tion was stopped. The intensity of the selected EPR line was re-
corded as a function of antioxidant concentration and analyzed
following the procedures described in the next section.
Data analysis
The peak-to-peak intensity of the selected EPR line of the free
radical adduct was monitored in the presence or absence of the se-
lected antioxidant. The kinetic formulation of the competitive reac-
tion between the spin trap (CYPMPO in this case) and the
antioxidant against free radical has been published elsewhere
. Briefly, in the presence of the spin trap (ST) and the antioxi-
dant (AOx), the following free radical (R) scavenging reactions
should occur:
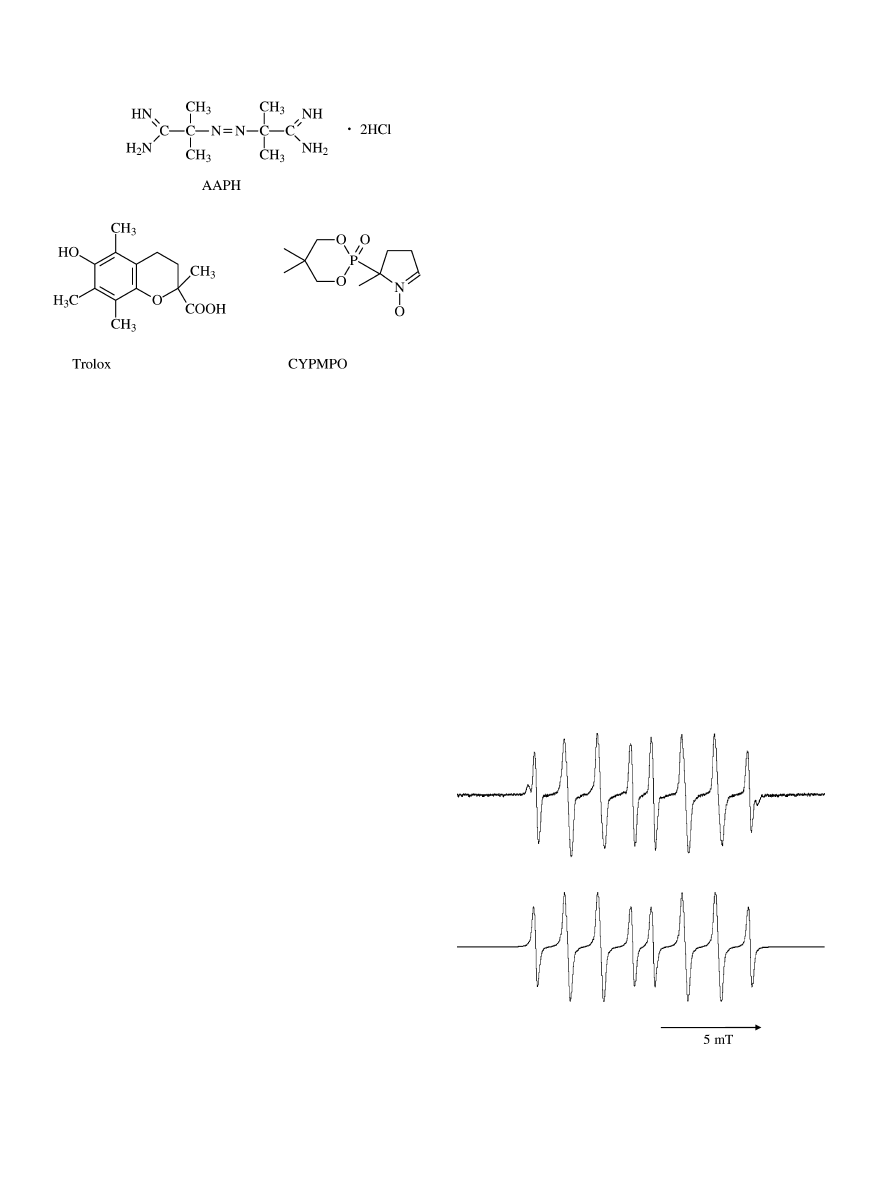
Fig. 1. Structures of AAPH, trolox, and CYPMPO.
Fig. 2. Top panel: EPR spectrum of CYPMPO free radical adduct. Aqueous solution of
AAPH (1 mM) and CYPMPO (10 mM) was illuminated with Hg-Xe arc for 5 s, and
the EPR spectrum was recorded. Bottom panel: Computer-simulated EPR spectrum
for the recorded spectrum. HFSCs used for the simulation were as follows:
A(H) = 1.24, A(N) = 1.40, and A(P) = 4.70. The free radical species was assigned to RO
radical adduct, where R is the H
2
N(HN)C-C(CH
3
)
2
- group (see Results section).
168
ORAC-like assay / S. Kohri et al. / Anal. Biochem. 386 (2009) 167–171

R þ ST ! R-adduct rate constan : tk
ST
ð1Þ
R þ AOx ! product rate constant : k
AOx
:
ð2Þ
When I
0
and I are the EPR peak heights in the presence of ST
alone and ST + AOx, respectively, the amount of the product in
Eq.
will be I
0
– I. Thus, I and I
0
I are proportional to k
ST
[R][ST]
and k
AOx
[R][AOx], respectively, and
ðI
0
IÞI ¼ k
AOx
=
½R½AOx=k
ST
½R½ST:
ð3Þ
Nearly negligible portions of ST and AOx will be consumed in
this reaction, we can safely replace [ST] and [AOx] with [ST]
0
and
[AOx]
0
, respectively, where []
0
denotes the initial concentration
of the component. Then Eq.
can be rewritten as
I
0
=
I 1 ¼ k
AOx
=
k
ST
½AOx
0
=
½ST
0
:
ð4Þ
In conclusion, a plot of I
0
/I – 1 against [AOx]
0
/[ST]
0
will give a
zero-crossing line with the slope of k
AOx
/k
ST
. When the same spin
trap and the free radical-generating condition are used, k
ST
be-
comes common for all antioxidants. If k
AOx
/k
ST
for each sample is
normalized using that of the standard trolox, the result will be ex-
pressed in trolox-equivalent units. Such ORAC–EPR values can be
directly compared with corresponding ORAC–FL values.
Results
Identification of free radicals produced from AAPH
An EPR spectrum shown in
(top) was obtained when an
aqueous solution containing AAPH and CYPMPO was photolyzed
with either an Xe arc or Hg-Xe arc lamp. Exactly the same spec-
trum pattern was recorded when the AAPH solution was heated
at 37 °C for 10 min (data not shown). The overall spectral intensity
was dependent on the AAPH concentration and the illumination or
heating time, but the spectral pattern did not depend on those con-
ditions. This spectrum was reproduced using computer spectrum
simulation (
, bottom), gaining the following hyperfine split-
ting constants (HFSCs): A(H) = 1.24 mT, A(N) = 1.36 mT, and
A(P) = 4.80 mT. Based on the comparison with HFSCs of AAPH rad-
ical adduct of the analogous spin trap DEPMPO
(A(H) = 1.27
mT, A(N) = 1.34 mT, and A(P) = 4.63 mT)
, the spectrum shown
in
is assignable to the alkyl-oxy (RO) radical adduct, where R
represents the H
2
N(HN)C–C(CH
3
)
2
-group.
ORAC–EPR values for compounds with antioxidant activity and human
serum
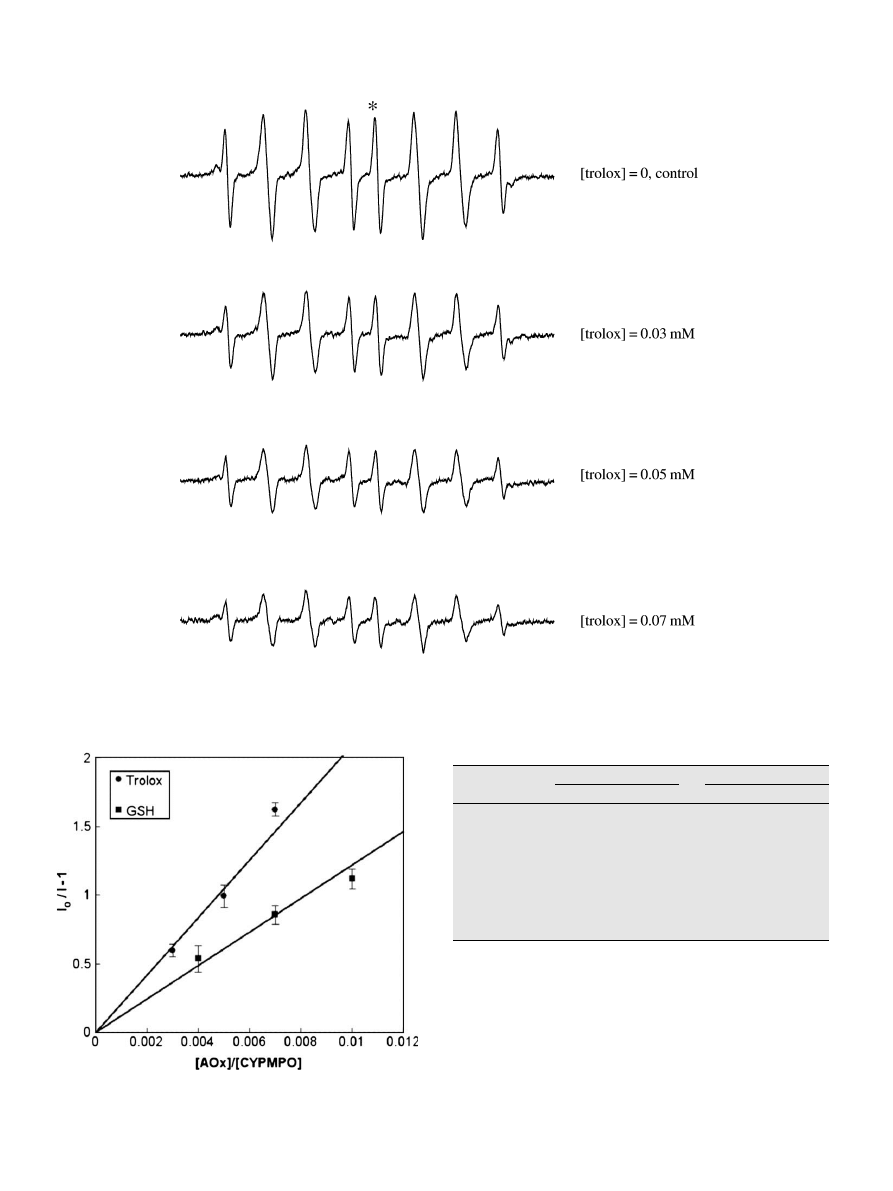
shows the dependence of EPR signal intensity when the
trolox concentration was increased stepwise. The intensity I
0
or I
of the line marked with an asterisk () in
was plotted accord-
ing to Eq.
(
). The slope of the line (i.e., k
TROLOX
/k
CYPMPO
)
passing through each point and the origin were calculated and
averaged, and the standard deviation was calculated. The k
TROLOX
/
k
CYPMPO
value was used to calculate trolox-equivalent ORAC–EPR
values. In
, the plot for the antioxidant GSH is also illustrated.
Trolox shows a larger slope than GSH, indicating that the ORAC–
EPR value of trolox is larger than that of GSH.
lists trolox-equivalent ORAC–EPR values of various anti-
oxidants. ORAC–FL analysis was performed for most of these anti-
oxidants using fluorescein (ORAC
FL
) or b-phycoerythrin (ORAC
PE
)
as the fluorescence probe. Those values are listed in
.
ORAC–EPR values for human serum are listed in
with pre-
vious ORAC–FL results. Because the amount of individual antioxi-
dant in serum is unknown, the numbers are shown in units of
millimolar (mM) trolox equivalent (i.e., mmol trolox equivalent/L
serum).
Discussion
The photochemical production of AAPH free radicals and the
EPR spin trapping technique were combined in ORAC–EPR, and
we obtained ORAC–EPR values for various antioxidants and hu-
man serum in a much shorter time than in ORAC–FL. The photol-
ysis of AAPH was so efficient that we were able to use a much
lower concentration (e.g., 1 or 10 mM) of AAPH than in ORAC–
FL (typically 75 mM)
; this may be beneficial in eliminating
the possibility of the solute aggregation. A possible drawback
of ORAC–EPR is photochemical decomposition of the sample
antioxidant. By using a relatively short illumination of Xe arc
light (wavelength longer than 400 nm), the photochemical
decomposition may be minimized. The use of Hg-Xe arc light
has made the illumination time very short (e.g., <5 s), and this
may be beneficial for thermally unstable specimens. Other mer-
its of ORAC–EPR include the simplicity of the analysis, whereas
in ORAC–FL computer-aided calculation was necessary
Moreover, the selection of experimental conditions in ORAC–
EPR was not strict. First, we obtained similar results (slopes)
by changing the absolute concentrations of the antioxidant and
the spin trap while keeping the ratio constant (
). Second,
the light intensity, illumination time, and AAPH concentration
can be modified within a reasonable range. Third, in contrast
to thermal ORAC–FL, the start and stop of AAPH radical produc-
tion was controllable simply by turning the light on and off.
Although we employed a commercially available illuminator, this
is not a critical requirement given that a suitable illuminator
could be improvised from a commercially available Xe arc lamp
and a mechanical shutter. Although the use of a new spin trap
(CYPMPO) facilitated data collection, this is not a critical factor
and other spin traps such as DEPMPO
could be used.
The discrepancy between ORAC–FL and ORAC–EPR (
) is not surprising given that, within ORAC–FL data, 1.9 to
3.5 times difference has been reported when the fluorescent probe
was switched from b-phycoerythrin (ORAC
PE
) to fluorescein (OR-
AC
FL
)
). A comparative study by Cao and Prior using
the two ORAC–FL assays indicated significant discrepancies be-
tween them
). The difference of ORAC–FL values
depending on the selection of the fluorescence probe indicates that
ORAC–FL values might not be antioxidant intrinsic constants, sug-
gesting that the direct comparison of ORAC–FL and ORAC–EPR val-
ues might not be meaningful. We believe that ORAC–EPR is
especially suitable for thermally labile biological specimens be-
cause the sample is not required to be heated for free radical pro-
duction as it is in ORAC–FL. Photochemical production of AAPH
radicals may be a less perturbing means of free radical production
than other methods such as heating and a metal ion-based free
radical generating system (e.g., the Fenton reaction).
Current ORAC assays are indirect methods that do not specify
the type of oxygen radicals to be scavenged by antioxidants. The
spin trapping technique has made possible the identification of
AAPH-derived oxygen radicals as alkyl-oxy (RO) radicals (
);
thus, we clearly define that ORAC–EPR is an evaluation method
for alkyl-oxy radical scavenging capacity. ORAC–FL is considered
as a scavenging assay for alkyl-peroxy (ROO) radicals, as described
in most publications
. This is because AAPH has been shown to
be an excellent lipid peroxidation agent in aqueous media
Indeed, in nonaqueous media, ROO radicals have been shown to be
spin-trapped in thermal decomposition of a lipid-soluble azo-rad-
ical initiator, azobisisobutylnitrile (AIBN)
. However, previous
spin trapping studies have shown that free radical species pro-
duced
in
the
thermal
decomposition
of
AAPH
were
RO
(H
2
N(HN)C-C(CH
3
)
2
-O) radicals but not ROO radicals
The same RO radicals were spin-trapped in the photolysis of AAPH
ORAC-like assay / S. Kohri et al. / Anal. Biochem. 386 (2009) 167–171
169
in this study (
), indicating that the AAPH-based ORAC assay is
likely to be the assay for RO radical scavenging capacity.
In summary, we have developed a rapid, simple, and depend-
able method to measure ORAC values of antioxidants and biologi-
cal specimens by using photochemical AAPH radical production
and EPR spin trapping. By selecting photochemical free radical pre-
cursors, this method may be applicable to the determination of the
antioxidant’s scavenging capacity against other oxygen radicals.
Fig. 3. Changes in the level of the alkyl-oxy adduct of CYPMPO as a function of the concentration of the antioxidant trolox. In situ Xe-arc light photolysis was carried out for
60 s to the sodium phosphate buffer (100 mM) solution of AAPH (10 mM), CYPMPO (10 mM), and various concentrations of trolox. The peak-to-peak intensity of the line
marked with an asterisk () was adopted as I
0
or I in Eq.
to calculate relative alkyl-oxy radical scavenging rates (k
AOx
/k
ST
).
Fig. 4. Plot of I
0
/I – 1 against [AOx]
0
/[CYPMPO]
0
, where I
0
and I denote EPR intensity
in the absence and presence of trolox or GSH. [AOx]
0
and [CYPMPO]
0
represent the
initial concentrations of each antioxidant and CYPMPO, respectively. The slopes of
the zero-crossing lines represent k
AOx
/k
ST
for trolox and GSH (
).
Table 1
ORAC–EPR of pure chemicals with antioxidant activity.
Compound
ORAC–EPR
k
AOx
/k
CYPMPO
vs. trolox
ORAC
FL
ORAC
PE
Trolox
210 ± 16
1
1
1
Caffeic acid
330 ± 4
1.6
4.37 ± 0.24
1.40 ± 0.09
Genistein
90 ± 5
0.43
5.93 ± 0.45
2.3 ± 0.16
Glutathione
120 ± 9
0.57
0.62 ± 0.02
0.32 ± 0.01
Rutin
300 ± 37
1.4
6.01 ± 0.25
1.95 ± 0.21
Quercetin
1500 ± 330
7.1
7.28 ± 0.22
2.07 ± 0.05
Catechin
150 ± 7
0.71
6.76 ± 0.22
2.57 ± 0.18
Vitamin C
2200 ± 1300
10
0.95 ± 0.02
0.43 ± 0.03
Uric acid
460 ± 25
2.2
N-Acetylcysteine
84 ± 11
0.40
a
From Ref.
b
ORAC–FL assay with the fluorescein probe.
c
ORAC–FL assay with the b-phycoerythrin probe.
d
From Ref.
170
ORAC-like assay / S. Kohri et al. / Anal. Biochem. 386 (2009) 167–171

Acknowledgments
The authors are grateful to Fumio Suzuki (Sapporo Biocluster
‘‘Bio-S”) for his helpful support and encouragement. This work
was supported by a grant from Sapporo Biocluster ‘‘Bio-S,” the
Knowledge Cluster Initiative of the Ministry of Education, Sports,
Science, and Technology (MEXT).
References
[1] D.D.M. Wayner, G.W. Burton, K.U. Ingold, S. Locke, Quantitative measurement
of the total, peroxyl radical-trapping antioxidant capacity of human blood
plasma by controlled peroxidation, FEBS Lett. 187 (1985) 33–37.
[2] A.N. Glazer, Fluorescence-based assay for reactive oxygen species: a protective
role for creatinine, FASEB J. 2 (1988) 2487–2491.
[3] T.P. Whitehead, G.H.G. Thorpe, S.R.J. Maxwell, Enhanced chemiluminescent
assay for antioxidant capacity in biological fluids, Anal. Chim. Acta 266 (1992)
265–277.
[4] N.J. Miller, C. Rice-Evans, M.J. Davies, V. Gopinathan, A. Milner, A novel method
for measuring antioxidant capacity and its application to monitoring the
antioxidant status in premature neonates, Clin. Sci. 84 (1993) 407–412.
[5] A. Ghiselli, M. Serafini, G. Maiani, E. Assini, A. Ferro-Luzzi, A fluorescence-based
method for measuring total plasma antioxidant capability, Free Radic Biol.
Med. 18 (1994) 29–36.
[6] I.F.F. Benzie, J.J. Strain, The ferric reducing ability of plasma (FRAP) as a
measure of ‘‘antioxidant power”: the FRAP assay, Anal. Biochem. 239 (1996)
70–76.
[7] T. Nomura, M. Kikuchi, A. Kubodera, Y. Kawakami, Proton-donative antioxidant
activity of fucoxanthin with 1, 1-diphenyl-2-picrylhydrazyl (DPPH), Biochem.
Mol. Biol. Intl. 42 (1997) 361–370.
[8] R.L. Prior, H. Hoang, L. Gu, X. Wu, M. Bacchiocca, L. Howard, M. Hampsch-
Woodill, D. Huang, B. Ou, R. Jacob, Assays for hydrophilic and lipophilic
antioxidant capacity (oxygen radical absorbance capacity (ORAC(FL))) of
plasma and other biological and food samples, J. Agric. Food Chem. 51
(2003) 3273–3279.
[9] R.J. DeLange, A.N. Glazer, Phycoerythrin fluorescence-based assay for peroxy
radicals: A screen for biologically relevant protective agents, Anal. Biochem.
177 (1989) 300–306.
[10] A.N. Glazer, Phycoerythrin fluorescence-based assay for reactive oxygen
species, Methods Enzymol. 186 (1990) 161–168.
[11] G. Cao, H.M. Alessio, R.G. Cutler, Oxygen-radical absorbance capacity assay for
antioxidants, Free Radic. Biol. Med. 14 (1993) 303–311.
[12] G. Cao, C.P. Verdon, A.H. Wu, H. Wang, R.L. Prior, Automated assay of oxygen
radical absorbance capacity with the COBAS FARA II, Clin. Chem. 41 (1995)
1738–1744.
[13] G. Cao, R.L. Prior, Comparison of different analytical methods for assessing
total antioxidant capacity of human serum, Clin. Chem. 44 (1998) 1309–1315.
[14] R.L. Prior, G. Cao, In vivo total antioxidant capacity: Comparison of different
analytical methods, Free Radic. Biol. Med. 27 (1999) 1173–1181.
[15] B. Ou, M. Hampsch-Woodill, R.L. Prior, Development and validation of an
improved oxygen radical absorbance capacity assay using fluorescein as the
fluorescent probe, J. Agric. Food Chem. 49 (2001) 4619–4626.
[16] D. Huang, B. Ou, M. Hampsch-Woodill, J.A. Flanagan, R.L. Prior, High-
throughput assay of oxygen radical absorbance capacity (ORAC) using a
multichannel liquid handling system coupled with a microplate fluorescence
reader in 96-well format, J. Agric. Food Chem. 50 (2002) 4437–4444.
[17] D. Huang, B. Ou, R.L. Prior, The chemistry behind antioxidant capacity assays, J.
Agric. Food Chem. 53 (2005) 1841–1856.
[18] R.L. Prior, X. Wu, K. Schaich, Standardized methods for the determination of
antioxidant capacity and phenolics in foods and dietary supplements, J. Agric.
Food Chem. 53 (2005) 4290–4302.
[19] C. López-Alarcón, E. Lissi, A novel and simple ORAC methodology based on the
interaction of Pyrogallol Red with peroxyl radicals, Free Radic. Res. 40 (2006)
979–985.
[20] E.G. Janzen, Spin trapping, Acc. Chem. Res. 4 (1971) 31–40.
[21] E.G. Janzen, Spin trapping, Methods Enzymol. 105 (1984) 188–198.
[22] G.R. Buettner, Spin trapping: ESR parameters of spin adducts, Free Radic. Biol.
Med. 3 (1987) 259–303.
[23] A. Krainev, D.J. Bigelow, Comparison of 2,2
0
-azobis(2-amidinopropane)
hydrochrolide (AAPH) and 2,2
0
-azobis(2,4-dimethylvaleronitrile) (AMVN) as
free radical initiators: A spin trapping study, J. Chem. Soc. Perkin Trans. 2
(1996) 747–754.
[24] G.R. Buettner, R.P. Mason, Spin-tapping methods for detecting superoxide and
hydroxyl free radicals in vitro and in vivo, Methods Enzymol. 186 (1990) 127–
133.
[25] C. Frejaville, H. Karoui, B. Tuccio, F. Le Moigne, M. Culcasi, S. Pietri, R. Lauricella,
P. Tordo, 5-(Diethoxyphosphoryl)-5-methyl-1-pyrroline-N-oxide: A new
efficient phosphorylated nitrone for the in vitro and in vivo spin trapping of
oxygen-centered radicals, J. Med. Chem. 38 (1995) 258–265.
[26] R.U. Rojas Wahl, L. Zen, S.A. Madison, R.L. DePinto, B.J. Shay, Mechanistic
studies on the decomposition of water soluble azo-radical initiators, J. Chem.
Soc. Perkin Trans. 2 (1998) 2009–2017.
[27] Y. Yoshida, N. Itoh, Y. Saito, M. Hayakawa, E. Niki, Application of water-soluble
radical initiator, 2,2
0
-azobis[2-(2-imidazolin-2-yl)propane] dihydrochloride, to
a study of oxidative stress, Free Radic. Res. 38 (2004) 375–384.
[28] E. Niki, Free radical initiators as source of water- or lipid-soluble peroxyl
radicals, Methods Enzymol. 186 (1990) 100–108.
Table 2
ORAC–EPR and ORAC–FL of human serum.
ORAC
FL
ORAC
PE
2.5 ± 0.3
7.8 ± 0.5
3.4 ± 0.3
Note. Values are in millimolar (mM) trolox-equivalent units ± SD.
a
Serum was obtained from 9 healthy volunteers (age range 25–62 years).
b
Data are from Table 5 in Ref.
(n > 3, age range unknown).
ORAC-like assay / S. Kohri et al. / Anal. Biochem. 386 (2009) 167–171
171
Document Outline
Wyszukiwarka
Podobne podstrony:
The Enigma of Survival The Case For and Against an After Life by Prof Hornell Norris Hart (1959) s
A novel procedure to measure the antioxidant capacity of yerba maté extracts
RHYS CHATHAM An Angel Moves Too Fast to See CD2lp (Table Of The Elements) TOE802toe802
52 9273 an 01 pl Laminat
Would you like to? an explorer or a writer
Bypass Capacitors, an Interview With Todd Hubing
Cecilia Tan & Bethany Zaiatz (ed) Like An Animal Erotic Tales of Werewolves [Circlet] (pdf)
Cecilia Tan & Sarah Desautels (ed) Like A Thorn An Anthology of BDSM Fairy Tales (pdf)
Khadja Nin Like an Angel
Don Juan said that human awareness was like an immense haunted house
Did language evolve like an eye Rudolf P Botha
Abba Like An Angel Passing Through My Room
abba like an angel passing through my room
W 4 S 52(APP 2)KOLORY I SYMBOLE
Wykład 5 An wsk cz II
Les Radicaux Libres 2
więcej podobnych podstron