
Migration, Accommodation
and Language Change
Language at the Intersection of Regional and
Ethnic Identity
Bridget L. Anderson

December 2007
MAC/MAL
Page-i
9780230_008861_01_prexviii
Migration, Accommodation and Language Change

December 2007
MAC/MAL
Page-ii
9780230_008861_01_prexviii
Palgrave Macmillan Studies in Language Variation
The study of language variation in social context, and the study of specific
language communities in detail, are central to the linguistic enterprise. In this
series we look for impressive first-hand fieldwork from speech communities
of various kinds, analysed within a range of frameworks, quantitative and
qualitative. All work reported in the series will raise important arguments
about methodologies for researching language in social context, with analysis
that challenges or extends current theory building.
Titles include:
Bridget L. Anderson
MIGRATION, ACCOMMODATION AND LANGUAGE CHANGE
Language at the Intersection of Regional and Ethnic Identity
Jonathan Marshall
LANGUAGE CHANGE AND SOCIOLINGUISTICS
Rethinking Social Networks
Daniel Schreier
ISOLATION AND LANGUAGE CHANGE
Contemporary and Sociohistorical Evidence from Tristan da Cunha English
Palgrave Macmillan Studies in Language Variation
Series Standing Order ISBN 1–4039–1198–3
(outside North America only)
You can receive future titles in this series as they are published by placing a
standing order. Please contact your bookseller or, in case of difficulty, write
to us at the address below with your name and address, the title of the series
and the ISBN quoted above.
Customer Services Department, Macmillan Distribution Ltd, Houndmills,
Basingstoke, Hampshire RG21 6XS, England

December 2007
MAC/MAL
Page-iii
9780230_008861_01_prexviii
Migration,
Accommodation and
Language Change
Language at the Intersection of Regional
and Ethnic Identity
Bridget L. Anderson
Old Dominion University

December 2007
MAC/MAL
Page-iv
9780230_008861_01_prexviii
© Bridget L. Anderson 2008
All rights reserved. No reproduction, copy or transmission of this
publication may be made without written permission.
No paragraph of this publication may be reproduced, copied or transmitted
save with written permission or in accordance with the provisions of the
Copyright, Designs and Patents Act 1988, or under the terms of any licence
permitting limited copying issued by the Copyright Licensing Agency,
90 Tottenham Court Road, London W1T 4LP.
Any person who does any unauthorized act in relation to this publication
may be liable to criminal prosecution and civil claims for damages.
The author has asserted her right to be identified
as the author of this work in accordance with the Copyright,
Designs and Patents Act 1988.
First published 2008 by
PALGRAVE MACMILLAN
Houndmills, Basingstoke, Hampshire RG21 6XS and
175 Fifth Avenue, New York, N.Y. 10010
Companies and representatives throughout the world
PALGRAVE MACMILLAN is the global academic imprint of the Palgrave
Macmillan division of St. Martin’s Press, LLC and of Palgrave Macmillan Ltd.
Macmillan is a registered trademark in the United States, United Kingdom
and other countries. Palgrave is a registered trademark in the European
Union and other countries.
ISBN-13: 9780230008861 hardback
ISBN-10: 0230008860 hardback
This book is printed on paper suitable for recycling and made from fully
managed and sustained forest sources. Logging, pulping and manufacturing
processes are expected to conform to the environmental regulations of the
country of origin.
A catalogue record for this book is available from the British Library.
Library of Congress Cataloging-in-Publication Data
Anderson, Bridget L., 1972
Migration, accommodation and language change : language at the
intersection of regional and ethnic identity / Bridget L. Anderson.
p.
cm. “ (Palgrave studies in language variation series)
Includes index.
ISBN-10: 0230008860 (alk. paper)
ISBN-13: 9780230008861
1. English language“Variation“United States.
2. English
language“Dialects“United States.
3. English language“Social
aspects“United States.
I. Title.
PE2841.A215 2008
427
.973“dc22
2007048692
10
9
8
7
6
5
4
3
2
1
17
16
15
14
13
12
11
10
09
08
Printed and bound in Great Britain by
CPI Antony Rowe, Chippenham and Eastbourne

December 2007
MAC/MAL
Page-v
9780230_008861_01_prexviii
This book, my first, is dedicated to my teachers: Walt
Wolfram, Lesley Milroy, Patrice Speeder Beddor, Erik
Thomas, Jose Benki, and Judith Irvine. Fieldwork, ethno-
graphy, vowels, methods, coarticulation, dialect contact,
language ideology I learned so much from all of you!

This page intentionally left blank

December 2007
MAC/MAL
Page-vii
9780230_008861_01_prexviii
Contents
List of Figures
xii
List of Tables
xiv
Acknowledgments
xvii
1
Introduction
1
2
Empirical and Theoretical Background
4
2.1
American English vowel shifts in progress
5
2.1.1
The Northern Cities Chain Shift
5
2.1.2
The Southern Shift
6
2.1.3
African American vowel systems
7
2.1.4
/ai/
9
2.1.5
The high and lower-high back vowels /u/
and /S/
11
2.2
Models of change
13
2.2.1
Internal and external factors in language
change
13
2.2.2
Language ideology: An overview
14
2.2.3
Dialect contact
16
3
The Sociolinguistic and Demographic Context for the
Study
18
3.1
Research site and demography of the area
18
3.2
History of migration to southeastern Michigan
21
3.2.1
Appalachian White migration to Detroit
21
3.2.2
African American migration to Detroit
24
3.3
Appalachian Whites and African American
Southern migrants in the Detroit area
26
3.4
Appalachian English
28
3.4.1
In the Southern Highlands
28
3.4.2
In Southeastern Michigan
31
vii

December 2007
MAC/MAL
Page-viii
9780230_008861_01_prexviii
viii
Contents
3.5
African American English
31
3.5.1
In the South
31
3.5.2
In Southeastern Michigan
32
3.6
Midwestern urban Whites
33
4
The Pilot Study
35
4.1
/ai/
35
4.1.1
Participants and methods of analysis for the
pilot study
35
4.1.2
The patterning of /ai/
36
4.2
Acoustic analysis of // and /æ/ for five
Appalachian White women, five African American
women, and five Northern White women
39
5
Field Techniques and Acoustic Methods
47
5.1
Study design
47
5.1.1
Speaker selection
47
5.1.2
Participant observation and
ethnography
49
5.1.3
Data analysis
50
5.1.4
Individual first versus community
first
51
5.2
Field methodology
53
5.2.1
Participants
53
5.2.2
Fieldwork and data collection
55
5.2.3
Recording procedures
57
5.3
Acoustic analysis
57
5.3.1
Temporal locations and measures
58
5.3.2
Spectral measures
58
5.4
Spectral comparisons
59
6
The High and Lower-High Back Vowels
65
6.1
Analysis of /u/
∼/i/ and /S/∼/G/ distances at
midpoint and offset
66
6.1.1
Methods for the statistical analysis
66
6.1.2
Descriptive overview of fronting patterns
67
6.1.2.1
African American, Appalachian,
and Midwestern White groups
68
6.1.2.2
African American and Appalachian
speakers
69

December 2007
MAC/MAL
Page-ix
9780230_008861_01_prexviii
Contents
ix
6.1.3
Statistical analysis of F
2
distances
75
6.1.4
Summary and significance of the F
2
distance
results
79
6.2
Context effects of consonants on preceding
vowels
80
6.2.1
Effects of following alveolar consonantal
context on vowel spectra
81
6.2.2
Effects of following labial consonantal
context on vowel spectra
83
6.2.3
Word-final context
84
6.2.4
Effects of following velar consonantal
context on vowel spectra
84
6.2.5
Summary
85
6.3
Rounding and backing
86
6.4
Nguyen’s (2006) real-time analysis of /S/ by social
status for Detroit African Americans and Nguyen
and Anderson’s (2006) comparisons of /S/ fronting
among African American and Midwestern Whites
in the Detroit area
87
6.5
Nguyen and Anderson’s (2006) comparisons of /u/
fronting among African American and Midwestern
Whites in the Detroit area
94
6.6
Conclusion
99
7
The Patterning of /ai/
102
7.1
Comparison by ethnicity, vowel,
and context
105
7.2
Speaker-by-speaker analysis
110
7.2.1
Data overview
110
7.2.2
Statistical analysis
111
7.2.2.1
Main effects
111
7.2.2.2
Interactions of vowel and
context
116
7.2.3
Comparison with a Midwestern White
speaker
122
7.2.4
Summary of speaker-by-speaker analysis
127
7.3
The patterning of /ai/ in Detroit African American
English reported by Nguyen (2006)
127
7.4
Conclusion
128

December 2007
MAC/MAL
Page-x
9780230_008861_01_prexviii
x
Contents
8
The Local and Supralocal Contexts for the Patterns of
Usage
129
8.1
Participant comments on Detroit and its
relationship to the suburbs
129
8.1.1
Residential segregation
130
8.1.2
“White Flight” out of Detroit
132
8.1.3
Suburbs
134
8.1.4
Poverty, scarcity of jobs, and crime
in Detroit
138
8.1.5
Riots
140
8.1.6
Coleman Young, first African American
Mayor of Detroit
142
8.2
Participant comments on migration, the South,
and Southern cultural practices
144
8.2.1
Reverse migration and purchasing property
in the South
145
8.2.2
Ties to the South: Trips and
relatives
149
8.2.3
Southern cultural practices in
Detroit
151
8.2.4
Relationship between Southern Whites and
Southern African Americans
156
8.2.5
Identification as “Southern” and “Hillbilly”
and differentiation between Southern
migrants and Midwestern Whites
159
8.2.6
Metapragmatic commentary on
language
162
8.3
Interpretation of the results for the patterns of use
presented in Chapters 6 and 7
164
8.3.1
/u/ and /S/
166
8.3.2
Comparison of groups for fronting
167
8.3.3
The (non)role of language ideology in the
patterning of the high and lower-high back
vowels
169
8.4
/ai/
171
8.4.1
Summary of major patterns for /ai/
172
8.4.2
/ai/ Glide-weakening and dialect
leveling
174

December 2007
MAC/MAL
Page-xi
9780230_008861_01_prexviii
Contents
xi
9
Conclusions and Implications
179
9.1
General commentary
179
9.2
Limitations and contributions of the study and
implications for sociolinguistic research
181
Bibliography
184
Index
193

December 2007
MAC/MAL
Page-xii
9780230_008861_01_prexviii
List of Figures
2.1
The Northern Cities Shift
5
2.2
Vowel configuration of the Southern Shift
7
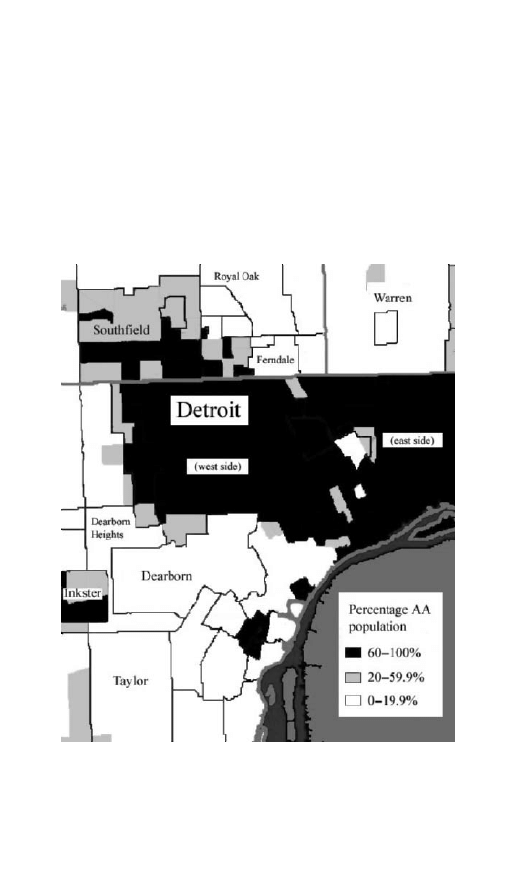
3.1
The location of fieldwork sites
19
4.1
Pre-voiceless /ai/ monophthongization by age and
gender for 27 Detroit AAE speakers
37
4.2
AAE /ai/ monophthongization by following
environment for 27 Detroit AAE speakers
37
4.3
The patterning of // for three speaker groups
41
4.4
The patterning of pre-oral /æ/ for three speaker groups
41
4.5
The patterning of pre-nasal /æ/ for three speaker groups
42
4.6
Detroit Appalachian // and pre-oral /æ/ by generation
42
4.7
Detroit African American //, pre-oral /æ/, and
pre-nasal /æ/ by generation
43
5.1
Locations of vowel onset (on), midpoint (mp) and
offset (off) in the word “teach” produced by Speaker 6
58
5.2
FFT spectrum centered at the midpoint of the vowel in
[K
h
Gds] “kids” (Speaker 6)
59
6.1
Midpoint F
1
and F
2
(in Hz) of /i/, /G/, /u/, /S/, and /o/
(pre-alveolar context) in Hz for the AA and AP speakers
in this study and the reference group (RG) of 48
women
68
6.2
Midpoint F
1
and F
2
(in Hz) for /i/, /G/, /u/, and /S/ in
all contexts measured for the AA and AP speakers
69
6.3
Offset values of /i/, /G/, /u/, and /S/ (in Hz) in all
contexts measured for the AA and AP speakers
70
6.4
F
2
measurements of /S/ tokens among White speakers
90
6.5
/S/ F
2
estimated coefficients at onset
92
6.6
/S/ F
2
estimated coefficients at offset
92
6.7
Estimates of context-based differences in /S/ fronting
93
6.8
Mean African American /u/ F
2
measures at midpoint
and offset for word boundary, labial, and alveolar
following contexts
95
xii

December 2007
MAC/MAL
Page-xiii
9780230_008861_01_prexviii
List of Figures
xiii
6.9
Mean White /u/ F
2
measures at midpoint and offset for
word boundary, labial, and alveolar following contexts
97
6.10 Estimated marginal means of /u/ F
2
measures at
midpoint
98
6.11 Estimated marginal means of /u/ F
2
measures at offset
99
7.1
F
1
and F
2
values (in Hz) for /?/ and /ai/ for Speaker 4,
an African American female born in 1974
115
7.2
F
1
and F
2
values (in Hz) for /?/ and /ai/ for Speaker 6,
an African American female born in 1967
116
7.3
F
1
and F
2
values (in Hz) for /?/ and /ai/ for Speaker 7,
an Appalachian female born in 1931
117
7.4
F
1
and F
2
values (in Hz) for /?/ and /ai/ for Speaker 8,
an Appalachian female born in 1960
117
7.5
F
1
and F
2
values (in Hz) for /?/ and /ai/ for Speaker 12,
an Appalachian female born in 1965
118
7.6
F
1
and F
2
values (in Hz) for /?/ and /ai/ for Speaker 1,
an African American female born in 1927
120
7.7
F
1
and F
2
values (in Hz) for /?/ and /ai/ for Speaker 2, an
African American female born in 1936
121
7.8
F
1
and F
2
values (in Hz) for /?/ and /ai/ for Speaker 11
(an Appalachian female born in 1936), who shows
across-the-board /ai/ glide-weakening
122
7.9
F
1
and F
2
values (in Hz) for /?/ and /ai/ for Speaker 3,
an African American female born in 1971
123
7.10 F
1
and F
2
values (in Hz) for /?/ and /ai/ for Speaker 5,
an African American female born in 1974
123
7.11 F
1
and F
2
values (in Hz) for /?/ and /ai/ for Speaker 9,
an Appalachian female born in 1951
124
7.12 F
1
and F
2
values (in Hz) for /?/ and /ai/ for Speaker 10,
an Appalachian female born in 1949
124
7.13 F
1
and F
2
values (in Hz) for /?/ and /ai/ for Speaker 13,
a Midwestern White female born in 1967
125

December 2007
MAC/MAL
Page-xiv
9780230_008861_01_prexviii
List of Tables
3.1
Figures of 2000 census for White and African American
residents for the Appalachian fieldwork sites
20
4.1
Number and % of [a:] versus [ai] realizations of /ai/ by
following phonetic environment
38
4.2
Comparison of Detroit AAE with other varieties for
monophthongal realizations of pre-voiceless /ai/
39
4.3
Summary of vowel patterns by generation and speaker
group
44
4.4
Individual and group averages (in Hz) for F
1
and F
2
values for //
44
4.5
Individual and group averages (in Hz) for F
1
and F
2
values for pre-oral /æ/
45
4.6
Individual and group averages (in Hz) for F
1
and F
2
values for pre-nasal /æ/
46
5.1
Speaker sample for the acoustic study
54
5.2
Total number of tokens per vowel pair
59
5.3
Tokens of /S/ and /G/ per speaker and per following
environment
61
5.4
Tokens of /u/ and /i/ per speaker and per following
environment
62
5.5
Tokens of /ai/ and /?/ according to speaker and
following environment
63
6.1
F
2
of /i/ and /u/ and F
2
/i/
∼/u/ distance at midpoint
and offset (in Hz) by ethnicity and following
environment
71
6.2
F
2
of /G/ and /S/ and F
2
/G/
∼/S/ distance at midpoint
and offset (in Hz) by ethnicity and following
environment
73
6.3
ANOVA of main effects and interactions for /u/
∼/i/
midpoint F
2
distance
76
6.4
ANOVA of main effects and interactions for /u/
∼/i/
offset F
2
distance
76
6.5
ANOVA of main effects and interactions for /S/
∼/G/
midpoint F
2
distance
76
xiv

December 2007
MAC/MAL
Page-xv
9780230_008861_01_prexviii
List of Tables
xv
6.6
ANOVA of main effects and interactions for /S/
∼/G/
offset F
2
distance
77
6.7
Tukey post-hoc analysis on the environment factor
for /u/
∼/i/ midpoint F
2
distance
77
6.8
Tukey post-hoc analysis on the environment factor
for /u/
∼/i/ offset F
2
distance
78
6.9
Estimated marginal means for /S/
∼/G/ F
2
distance at
midpoint, by ethnicity and context
78
6.10
Estimated marginal means for /S/
∼/G/ F
2
distance at
offset, by ethnicity and context
79
6.11
Duration of /u/ and /S/ (in ms) by ethnicity in the
pre-alveolar context
82
6.12
F
2
measurements of /S/ tokens among Detroit White
female speakers
89
6.13
/S/ Comparisons between Detroit White and Detroit
African American participants
90
6.14
Results from a multivariate model, with examination
of interactions between speaker group and following
context while controlling for individual speaker
effects and preceding place of articulation
91
6.15
Estimated coefficients that result from the
multivariate analysis
93
6.16
Following places of articulation for /u/ F
2
by ethnic
group
95
6.17
The results of four ANOVA analyses, one for both the
midpoint and offset measures for African American
and White speakers, along with Scheffe post-hoc tests
96
6.18
Multivariate analysis testing place of articulation,
speaker ethnicity, and the interaction of the two
predictors at midpoint and offset
98
7.1
F
1
movement (in Hz) from midpoint to offset for
/?/ and /ai/ by ethnicity and context
106
7.2
F
2
movement (in Hz) from midpoint to offset for
/?/ and /ai/ by ethnicity and context
107
7.3
ANOVA of main effects and interactions for F
1
movement
108
7.4
ANOVA of main effects and interactions for F
2
movement
108

December 2007
MAC/MAL
Page-xvi
9780230_008861_01_prexviii
xvi
List of Tables
7.5
Estimated marginal means for F
1
midpoint-to-offset
movement (in Hz) by ethnicity and vowel
109
7.6
Estimated marginal means for F
2
movement by
ethnicity and vowel
109
7.7
Estimated marginal means for duration by ethnicity,
vowel, and environment
109
7.8
Previously reported patterns of /ai/ glide-weakening
in varieties of American English
111
7.9
Average F
1
and F
2
midpoint-to-offset movement (in
Hz) by vowel and context for individual AA speakers
112
7.10
Average F
1
and F
2
midpoint-to-offset movement in
Hz by vowel and context for individual AP speakers
113
7.11
Main effects of vowel on F
1
and F
2
midpoint-to-offset
movement
114
7.12
Main effects of voicing context on F
1
and F
2
midpoint-to-offset movement
115
7.13
Estimated marginal means for F
1
movement by
environment and vowel for Speaker 1
118
7.14
Estimated marginal means for F
2
movement by
environment and vowel for Speaker 1
119
7.15
Estimated marginal means for F
1
movement by
environment and vowel for Speaker 2
119
7.16
Estimated marginal means for F
2
movement by
environment and vowel for Speaker 11
119
7.17
Average F
1
and F
2
movement (in Hz) by vowel and
context for Midwestern White Speaker 13
125
7.18
Estimated marginal means (in Hz) for F
2
movement
by environment and vowel for Midwestern White
Speaker 13
126
7.19
Summary of /ai/ patterning by speaker
126

December 2007
MAC/MAL
Page-xvii
9780230_008861_01_prexviii
Acknowledgments
My first thanks goes to the participants in this study, who opened up
their homes to me and made this research possible. My second thanks
goes to my teachers, to whom I have dedicated this book. In partic-
ular, Walt Wolfram, Lesley Milroy, Pam Beddor, and Erik Thomas
have all uniquely contributed to my development as a scholar and
have guided me through graduate school and beyond. I am blessed
with the best mentors the universe has to offer! I also want to mention
Michael Montgomery. My work has benefited very much from his
advice through the years, as well as his excellent example. Michael,
I am your biggest fan!
My mother assisted a great deal with the fieldwork with the
Appalachian migrants. My parents have been very supportive of my
crazy academic lifestyle, including the very long time I spent writing
this book. My dear friend Tom Welker helped me reformat the charts
and graphs, with all their phonetic fonts, and has my eternal grat-
itude. The presence of Jen Nguyen, my long-time collaborator, is felt
throughout this book. In particular, being able to extensively cite our
2006 paper, which employed the same methods used in this book,
made the analysis much deeper and richer. Jen, if I could give you a
“best collaborator” award, I would!
I also want to mention some of my colleagues at Old Dominion
University. Joanne Scheibman, in particular, spent many hours
discussing ethnography and language ideology with me. Joanne is one
of those rare people who is so insightful, and so careful in terms of
her analysis and thinking, that I felt the need to write down almost
everything she told me. I have pages of notes from conversations with
her about this book. I also want to mention Janet Bing, who is one of
the lights in my professional life. I also want to mention my Chair,
David Metzger, and my Dean, Chandra de Silva. Their support during
my whole time at Old Dominion, but especially while I was writing
this book, is gratefully acknowledged! Dean de Silva provided funding
for a fieldwork coordinator for my Tidewater Voices project while this
book was in the final stages, so that I could focus on finishing it. I am
xvii

December 2007
MAC/MAL
Page-xviii
9780230_008861_01_prexviii
xviii
Acknowledgments
fortunate to have found such a supportive environment, where I can be
free in my scholarship and in my thinking.
I thank the external reviewer for this book for insightful comments
and helpful advice. I also thank John Baugh for his feedback on
the language ideological analysis at the Perspectives on Language
Variation Symposium at St Louis University in Fall 2005. His advice
resulted in a richer ethnographic analysis. I thank Mark Arehart for
his assistance with the statistical analysis.
Finally, I thank my editor, Jill Lake, who I first met when I presented
the very first bit of this work (from the pilot study!) in Bristol at the
University of the West of England at the Sociolinguistics Symposium
2000. Jill, I want you to know how much your support and encour-
agement all these years has meant to me, and I thank you for your
interest in this work. Jill, your personal qualities, in addition to your
professional qualities, make you a rare and special person. I want you
to know that I will never forget your many kindnesses! I also thank
Melanie Blair for her hard work and support during this process. How
blessed I am that she and Jill were the editorial team for my first book!

November 2007
MAC/MAL
Page-1
9780230_008861_02_cha01
1
Introduction
In the early decades of the twentieth century, large numbers of
African American and White Southerners migrated from the rural
South to the urban Midwest to work in factories (Berry 2000).
Although these two migrant groups are separated by ethnicity, they
share a regional affiliation with the South as well as Southern
cultural characteristics (Anderson 2003). This situation provides an
unique opportunity to examine ways in which the interaction of
ethnicity and regional affiliation gives rise to systematic patterns of
language variation and change and phonetic restructuring as a result
of language contact. Patterns of use have been shown by sociolin-
guistic researchers to provide a window into group solidarity and
ethnic identity, as well as to index social and linguistic relations
within and among groups. A dramatic example of such indexicality
is provided in the Midwestern cities by the distinctiveness of African
American English (AAE) from Midwestern White varieties.
This investigation of the dialect contact situation between African
American and Appalachian White Southern migrant groups and their
descendants in the Detroit metropolitan area provides an explan-
ation of the continuing distinctiveness of Southern migrant vowel
patterns from those of Midwestern Whites in the city. Linguistic
effects of large-scale migration for these two Southern groups across
three generations of speakers are described and compared to the
surrounding dialect norms of Midwestern Whites, through acoustic
analysis of portions of the vowel systems.
The aims of this study are as follows. First, the study provides
a description of portions of the vowel systems of six Detroit
1

November 2007
MAC/MAL
Page-2
9780230_008861_02_cha01
2
Migration, Accommodation and Language Change
African American and six Appalachian Southern migrant participants.
Second, it provides a detailed analysis of the changes taking place in
the vowel systems and attempts to contextualize the phonetic data
both historically, with reference to the data collected by Wolfram in
1969, and within an account of local language ideology. Third, the
results are evaluated with reference to current models of change in
vowel systems, especially the principles of internal change proposed
by Labov (1994). The effects of leveling in this dialect contact situ-
ation are also addressed. Finally, the relationship between internal
constraints on and external motivations for language change is
examined in a framework that is sensitive to contextual, or coarticu-
latory, effects from the following consonant on patterns of use.
The methodology is a combination of techniques used in vari-
ationist sociolinguistics and acoustic phonetics. The fieldwork with
the African American participants and one of the Appalachian
Southern migrant participants took place in inner city Detroit and in
the adjacent inner suburbs of Warren, Taylor, Royal Oak, and Dear-
born Heights with the rest of the Appalachian White participants.
Data was extracted from 60 minutes of sociolinguistic interviews for
each participant for the acoustic analysis, the methods of which are
described in Chapter 5.
I analyze the acoustic results with particular reference to local
language ideologies and ideological stances which emerged during
the data collection phase of the study. I argue in Chapter 8 that vowel
changes are internally constrained but subject to ideological inter-
vention. Specifically, I argue that the fronting of /u/ and /S/ is part
of a widespread phonetic change taking place in many varieties of
English around the world and no longer provide a “crucial site” (Phil-
lips 2000: 233) used to express a local orientation for the Southern
migrant participants in this study. In contrast, glide-weakened /ai/
functions as a socially salient ethnolinguistic boundary marker that
is rich in local meaning. The results from the acoustic study indicate
that, for middle-aged and younger African American participants,
glide-weakening has expanded its territory to include the progressive
pre-voiceless context. I associate both the fronting of the high
and lower-high back vowels and pre-voiceless /ai/ glide-weakening,
changes which have only recently been reported for African American
speakers, with changes in the sociolinguistic landscapes of speakers
following migration from the rural South to the urban Midwest. The

November 2007
MAC/MAL
Page-3
9780230_008861_02_cha01
Introduction
3
social group which became most relevant—the group from which
African American and Appalachian participants saw themselves as
most distinctive—were White Midwesterners. Furthermore, both
groups display orientations to the South in culturally important ways.
A linguistic alignment to a Southern norm which does not clearly
distinguish between AAE and White Southern varieties therefore can
be described in relation to the complex attitudes and ideologies
emerging after migration.
This book consists of nine chapters. Chapter 2 surveys the work
on language variation and change which underpins the study.
Chapter 3 describes the research site, the history of migration of
Southern migrants to Southeastern Michigan, and gives overviews
of Appalachian English and AAE in both Southern and Midwestern
(urban) contexts. Chapter 4 describes the pilot study. Chapter 5
describes field techniques, sociolinguistic methods, and acoustic
methods. Chapter 6 gives the acoustic results for the high and lower-
high vowels, and Chapter 7 gives the results for the low vowels.
Chapter 8 situates the acoustic results within local and supralocal
contexts, and situates the patterns of use revealed by the acoustic
analysis with reference to local language ideologies which emerged
during the fieldwork phase of the study. Chapter 9 discusses the limit-
ations and contributions of the study and also gives an assessment
of the broader implications of the study.

November 2007
MAC/MAL
Page-4
9780230_008861_03_cha02
2
Empirical and Theoretical
Background
In this chapter I discuss the empirical and theoretical issues that
inform this study. Several questions and intellectual problems guided
this research. First, I was skeptical of the claim that African Amer-
icans do not participate in any of the large-scale vowel rotations
in American English (e.g. Labov 1994, 2001; Bailey and Thomas
1998; Thomas 2001). Wolfram (2007) characterizes the assump-
tion that “ regionality in African American English is invariably
trumped by the trans-regional, common core of shared vernacular
traits” as a myth and also labels this assumption as the “exotic variety
syndrome.” It is important to investigate the extent to which speakers
of AAE do or do not participate in contemporary vowel changes
in American English. To this end, I investigated the patterning of
/u/ and /S/ for the Southern migrant participants in this study.
Fronting of these vowels is widespread in American English (see
Section 2.1.5). I also examine a more local change for the African
American participants in this study, the glide-weakening of /ai/ in the
pre-voiceless context, a change that—until recently—was associated
with progressive Southern White, but not African American, varieties.
Second, I wanted to employ a framework which used local categories
relevant to speakers rather than categories imposed by the researcher.
Third, I investigate the relationship between internal constraints on
and external motivations for language change in a framework that is
sensitive to the influences of coarticulation. Socioacoustic work that
considers context effects such as coarticulation is also rare.
The structure of the chapter is as follows. Section 2.1 describes
vowel changes in progress in American English, including work on
4

November 2007
MAC/MAL
Page-5
9780230_008861_03_cha02
Empirical and Theoretical Background
5
the Northern Cities Chain Shift (NCS), the Southern Shift, African
American vowel systems, /ai/ glide-weakening, and fronting of the
high and lower-high back vowels. Section 2.2 discusses socially
oriented frameworks which can help illuminate patterns of vowel
changes.
2.1 American English vowel shifts in progress
Following Labov (1991), the major American English dialects have
been frequently described in terms of three major vowel rotations:
the NCS, the Southern Shift, and a vowel system which merges /?/
and /M/.
2.1.1 The Northern Cities Chain Shift
The NCS is reported as operating in the region stretching from
Western New England to the northern tier of Pennsylvania, Northern
Ohio, Indiana, Illinois, Michigan, and Wisconsin (Wolfram and
Schilling-Estes 1998: 237). Several linguistic researchers (e.g. Labov
1994; Wolfram and Schilling-Estes 1998; Gordon 2001) describe the
shift as being most evident in the larger metropolitan areas. Wolfram
and Schilling-Estes (1998) and Labov (1991) also observe that younger
speakers in the metropolitan areas show the most advanced stages of
these changes.
Labov (1994) describes the raising of /x/ as the oldest change in
the NCS and the fronting of /?/ and the lowering and fronting of /M/
as “midrange” changes, and suggests that the three changes therefore
constitute a drag chain (Labov 1994: 195). Other changes include
the lowering of /G/ and /C/ (not shown in Figure 2.1), which Labov
æ
ɑ
ɔ
ε
i
Figure 2.1
The Northern Cities Shift (after Labov 1994: 191)

November 2007
MAC/MAL
Page-6
9780230_008861_03_cha02
6
Migration, Accommodation and Language Change
(1994: 195) describes as “most likely” forming another drag chain.
Finally, the backing of /C/ and /Ç/ forms another link, which Labov
describes as a push chain. Labov illustrates the pattern of the NCS as
follows. The arrows indicate directions of vowel movement within
articulatory space.
The defining characteristic of a chain shift is that each “slot” in the
vowel space left empty by a vowel which has moved to another spot
will be filled by another vowel participating in the chain rotation.
Labov (1994) reports that the NCS is the most complex chain shift yet
recorded within one subsystem, involving six members of the English
vowel system in one continuous and connected pattern. Labov (1994)
cites early evidence for the NCS throughout the Northern dialect
area as mapped by Kurath and McDavid in 1961 and Marckwardt
in 1957, and notes that the shift was first explicitly proposed in an
unpublished paper by Fasold in 1969.
Section 2.1.2 describes the Southern Shift, which is reported to be
in progress in White varieties in the American South. One question
this study will attempt to answer is why the African American and
Appalachian White Southern migrants in this study are not parti-
cipating in the vowel patterns associated with the NCS but appear
to be participating in sound changes currently in progress in the
American South such as glide-weakening of pre-voiceless /ai/ and also
in changes which are widespread in American English such as the
fronting of the high and lower-high back vowels. Particularly, why
are the Southern migrant speakers who are Detroit-born apparently
participating in these sound changes?
2.1.2 The Southern Shift
The Southern Shift, pictured in Figure 2.2, constitutes a series of
sound changes that are said to have moved to virtual completion
in Southern White varieties (Bailey and Thomas 1998: 304). Thomas
(2001: 1) describes the Southern Shift as involving the fronting of
/u/, /S/, and /o/; lowering of the nucleus of /e/ and sometimes the
nuclei of /i/ and /u/; fronting and raising of /G/ and /C/, and either
the monophthongization or glide-reduction of /ai/ to [a:] or [a
æ
.
Some Southern varieties such as those spoken on the outer banks of
North Carolina show backing and raising for the /ai/ nucleus, where
it is realized as [ÇG] (Schilling-Estes 1996). Thomas (2001: 106) notes
that the fronting of /u/ is an old Southern feature, citing Kurath

November 2007
MAC/MAL
Page-7
9780230_008861_03_cha02
Empirical and Theoretical Background
7
/
i
/
/
/
/
oi
/
/
υ
/
/
ε
/
/
o
/
/
ɔ
/
/e
/
[a:]
←
/ai
/
/
u
/
i
Figure 2.2
Vowel configuration of the Southern Shift (adapted from Labov,
1991)
and McDavid (1961). Thomas also describes the fronting of the /o/
nucleus as a recent change. Labov suggests that the fronting of /o/
has no connection with chain shifting but operates in coordination
with the fronting of /u/, lagging “considerably behind it” (1994: 208).
Stockwell and Minkova (1999: 7) describe the vowel changes
involved in the Southern Shift differently and argue that these vowel
changes should not be presented as part of a chain shift. Fridland
(1999) also suggests that the Southern Shift is a set of changes
affecting subsystems rather than a unitary chain shift.
2.1.3 African American vowel systems
Labov (1991) describes the AAE system as incompatible with any of
the three major vowel rotations in American English (the two vowel
shifts described above plus a pattern which merges /?/ and /M/), thus
constituting a “fourth dialect.” Labov (1998: 147) suggests that AAE
is best viewed as a koiné which developed when speakers migrated to
the North and Midland urban areas. According to this scenario, some
features of Southern phonology were lost and the system leveled
to a general Northern African American phonology in which some
features of Southern phonology are retained as optional markers of
style. Labov does not, however, analyze Northern AAE as a contact
variety.

November 2007
MAC/MAL
Page-8
9780230_008861_03_cha02
8
Migration, Accommodation and Language Change
Many researchers agree that AAE norms are diverging from those
of White dialects. Thomas (2001: 166) suggests, “for the most
part, assimilation to Southern White vernaculars seems to be old-
fashioned in African American speech, and younger African Amer-
icans are moving toward nationwide norms for African Americans.”
Wolfram and Schilling-Estes also point out that there is little evid-
ence that the NCS is spreading to AAE speakers in metropolitan areas
affected by this shift (1998: 180). Graff et al. (1986), Labov and Harris
(1986), and Labov (1991, 2001) describe African American vowels as
not affected by sound changes occurring in White varieties. Gordon
(2000) found the same pattern in Gary, Indiana. Thomas (2001) also
reports a pattern in which African Americans do not participate in
contemporary White vowel changes. Bailey and Thomas (1998: 95)
also suggest that African American speakers are not participating in
any of the changes associated with the Southern Shift (except for
the glide-weakening of /ai/ in restricted contexts) or the NCS. Several
researchers, then, have suggested that African American speakers
are not participating in large-scale contemporary vowel changes in
American English.
There is some evidence, however, that African Americans do in
fact participate in sound changes which are typically associated
with White varieties. Thomas (1993) found that African Americans
in Columbus, Ohio, showed accommodation to some local vowel
changes, including the fronting of /o/. Deser (1990) found that
Detroit African Americans were participating in some local White
vowel patterns. Jones and Preston (in press) and Jones (MS) reported
raising of /æ/ but not fronting of /?/ (both changes associated with
the NCS, see Section 2.1.1) among African American women in
Lansing, Michigan. Wolfram et al. (2000) and Wolfram and Thomas
(2002) found that older African Americans in the rural coastal
community of Hyde County, North Carolina, showed assimilation to
the local White vowel systems.
As noted above, Wolfram (2007) strongly cautions against treating
AAE as a unitary, homogenous variety that shows no regional and
other kinds of intra-variety variation. The analysis presented in
Chapters 6 and 7 will demonstrate that the African American parti-
cipants in this study show evidence of at least three patterns of use
typically associated with White speakers—the fronting of the high
and lower-high back vowels /u/ and /S/ and the glide-weakening of

November 2007
MAC/MAL
Page-9
9780230_008861_03_cha02
Empirical and Theoretical Background
9
pre-voiceless /ai/—and it underscores the importance of recognizing
that non-Whites can and do participate in both supralocal, wide-
spread vowel changes as well as more regionally based changes.
2.1.4 /ai/
/ai/ realizations are salient markers of regional and ethnic iden-
tity in American English (Anderson 1998, 1999, 2002; Wolfram and
Schilling-Estes 1998; Plichta and Preston 2003); pre-voiced monoph-
thongal [a:] and glide-weakened variants such as a
æ
are character-
istic of both Southern American English and AAE. Bailey and Thomas
(1998: 104) point out that originally Southern White varieties were
diphthongal for variants of /ai/ and suggest that the innovation
and spread of monophthongal and glide-weakened variants may
have been the result of influence from early AAE. Tillery and Bailey
(2003: 168), citing Bailey and Thomas (1998) and Thomas (2001),
describe glide-weakened /ai/ as a change which developed after 1875
in Southern White varieties.
The work of Bailey et al. (1996), Bailey and Thomas (1998),
Bernstein and Gregory (1993, 1994), and others indicates that /ai/ is
monophthongized or glide-weakened throughout the South by both
contemporary White and African American speakers in all contexts
except before voiceless obstruents. Bailey and Thomas (1998: 104)
report that this feature has been shared by African American and
Southern White dialects for at least the past 100 years, but that glide-
weakening of /ai/ before voiceless obstruents is a relatively recent
change specific to some Southern White systems, such as Appalachian
and Texas varieties of English. Wolfram and Schilling-Estes (1998:
180) also describe the glide-weakening of /ai/ in pre-voiceless contexts
as characteristic of some Southern White, but not AAE, dialects.
Although recent work by Mallinson et al. (2001) and Childs (2005)
on AAE in the Smoky Mountains of Western North Carolina and
Fridland (2004) in Memphis suggests that actual language behavior
with respect to /ai/ glide-weakening may be more complex than
these generalizations suggest, the vowel appears to be treated as a
stereotypical marker of ethnic identity (Wolfram and Schilling-Estes
1998; Thomas 2001; Wolfram and Thomas 2002). Based on extensive
community language studies in rural North Carolina conducted by
the North Carolina Language and Life team at North Carolina State

November 2007
MAC/MAL
Page-10
9780230_008861_03_cha02
10
Migration, Accommodation and Language Change
University, Wolfram and Schilling-Estes (1998: 75) comment on the
social salience of Southern variants of /ai/:
Southerners are more readily identified as Southerners by their /ai/
vowels than by any other single dialect feature, and Southerners
themselves have come to take pride in their distinctive pronun-
ciations as a badge of their unique regional identity and cultural
heritage.
Wolfram (personal communication) reports that African Americans
in the South use a high rate of glide-weakened /ai/ in pre-voiceless
contexts in imitations of White speech, and recent work by his
own research group confirms the social salience of Southern vari-
ants of /ai/ in the South (Wolfram and Thomas 2002). Southern
variants of /ai/, however, are also socially salient outside the South.
Plichta and Preston’s (2003) perceptual study of /ai/ demonstrates
that Midwestern Whites rate glide-weakened tokens as character-
istic of Southern speech. These researchers describe Southern variants
of /ai/ as “one of the principal caricatures of US regional speech.”
Preston (1996) shows that Southern speech is described as “incor-
rect” by listeners from around the country. Stimuli in that perceptual
and attitudinal study included words containing the socially salient
glide-weakened variant of /ai/ in addition to other Southern features.
I will argue in Chapter 8 that /ai/ provides a crucial site for the
expression of local language ideologies. Phillips (2000: 233) describes
“crucial site” as a term used to “ convey the sense that more
important or powerful ideological work is being done in some forms
of cultural activities than in others.” The notion reflects the tendency
for “ some kinds of linguistic practices (as) more likely to be
talked about in metapragmatic commentary than others” (233). As
noted above, the use of the Southern glide-weakened variant of /ai/
is socially salient, both in the South and elsewhere. This feature of
my own Appalachian speech was frequently commented on during
the four years I lived in Michigan.
Midwestern Whites show a different trajectory of change for /ai/
than Southerners, which is also socially salient. Eckert (1996) reports
backing and raising of the nucleus of pre-voiceless /ai/ (“Cana-
dian Raising”) for suburban Detroit White adolescents. She describes
“extreme” raising for /ai/ as being highly socially salient. Eckert’s

November 2007
MAC/MAL
Page-11
9780230_008861_03_cha02
Empirical and Theoretical Background
11
work on /ai/ makes it clear that Detroit Whites in her study show
very different realizations of /ai/ than the Southern migrant parti-
cipants in this study. We shall also see in Chapter 7 that the Detroit
White female participant in my sample shows a high degree of diph-
thongization for /ai/, which is in contrast to the glide-weakening
evident in the patterns of use by the Detroit Southern migrant parti-
cipants. Several researchers have described /ai/ as showing massive
variation among different groups of speakers in the Detroit area
(Deser 1990; Eckert 1996; Edwards 1997), which suggests that it serves
as an important linguistic boundary marker in Detroit.
When compared to other vowels /ai/ is unusual in terms of the
complexity of its phonetic and phonological dimensions. According
to Labov, /ai/ is unusual in that it may occupy either peripheral
or non-peripheral space, resulting in great synchronic variability
and complex diachronic movement. Labov suggests that peripheral
vowels show different movement patterns than non-peripheral
vowels (1991, 1994), but there is some disagreement as to what
exactly constitutes peripherality. According to Labov, “in general
long vowels are located at the periphery of the vowel space ” (1994:
173). Short, or lax vowels, according to this scenario, are more cent-
ralized. The concept of peripherality is important to Labov’s (1994)
claims about chain shifting. Stockwell and Minkova (1997: 2) argue
that what Labov characterizes as peripheral diphthongs are actu-
ally non-peripheral and vice-versa. Labov (1994) also suggests that
monophthongization of /ai/ sets off a vowel rotation for the front
vowels, in which /i/ and /G/ are reversed, as well as /e/, and //, as
part of the Southern Shift.
This section described /ai/ glide-weakening as a local change
specific to Southern and African American varieties of English. The
next section turns to a more global change in English vowel systems,
fronting of the high and lower-high back vowels.
2.1.5 The high and lower-high back vowels /u/ and /S/
In his discussion of vowel variants in New World Englishes, Thomas
(2001: 32) describes /S/ as backed in many dialects but fronted in
Southern White speech. Thomas characterizes /u/, like /S/, not only
as showing variation mainly for the front/back dimension but also
as showing variation for the direction of the offglide (33). He does
not discuss the details of variation for the offglide. He describes

November 2007
MAC/MAL
Page-12
9780230_008861_03_cha02
12
Migration, Accommodation and Language Change
widespread fronting of /u/ among Whites, citing his own studies of
central Ohio (Thomas 1993), Habick’s study of central Illinois (1980,
1993), Labov’s (1994) study of Philadelphia, Luthin’s study of Cali-
fornia (1987), Ash’s study of the Inland Upper North (1996), and
Clarke et al.’s study of New England and Canada (1995). African Amer-
icans, however, are generally said not to participate in widespread
vowel changes in American English, including the fronting of /u/ and
/S/ (Labov 1994, 2001; Wolfram and Schilling-Estes 1998; Thomas
2001).
Thomas describes /u/ and /S/ fronting as “not predominant in
African American speech ” and notes that “ avoidance of it may
have become an identity marker ” for them (2001: 34). Thomas
points out, however, that “a few African Americans” show these
changes, including five African American speakers in his study of New
World Englishes (34). Although sociolinguists tend to characterize
/u/ and /S/ fronting as characteristic of White, but not Black speech,
recent studies in both urban and rural areas in and out of the South
such as Detroit (Anderson et al. 2002), Memphis, TN (Fridland 2003),
the rural Smoky Mountains of North Carolina (Childs 2005), and
rural Hyde County, NC (Wolfram and Thomas 2002), report fronting
of /u/, as well as /S/, for African American speakers. Apparently, at
least some African Americans in diverse locales are participating in
these widespread changes, which are not limited to Whites. More
generally, Labov (1994, 2001) suggests that African Americans do
not participate in any of the large-scale vowel rotations in American
English.
Johnson (2003: 118) describes fronted /u/ as a feature of General
American English. However, fronting of /u/ and /S/ is not restricted
to American varieties of English. Stockwell and Minkova (1997: 294)
point out that fronting of these vowels has also been documented
for Southern British English and Australian English. Anderson and
Milroy (MS) also discuss this change as being “socially and geograph-
ically widespread” and point out that it is well documented not
only in American and British varieties of English, but also in New
Zealand English (see also MacMahon 1998: 461; Trudgill et al. 2000).
Fronting of the high and lower-high back vowels appears to be a
global phenomenon in English. I will argue in Chapter 8 that the
global nature of this change does not make it a good candidate for

November 2007
MAC/MAL
Page-13
9780230_008861_03_cha02
Empirical and Theoretical Background
13
constituting a crucial site (see Section 2.1.4) for the articulation and
negotiation of local identity.
Section 2.1 described work on vowel shifts in American English,
including the Northern Cities Shift, the Southern Shift, the high
and lower-high back vowels, and /ai/. Internally motivated change
(described below) is generally discussed in terms of these shifts in
work on American English vowel systems, and the AAE system is
usually dismissed in this literature as not affected by them.
2.2 Models of change
2.2.1 Internal and external factors in language change
Language change is often described as resulting from internal factors
(Labov 1994), from external factors (Labov 2001), or from a combin-
ation of internal and external factors (Fridland 2003; Watt 2000,
among others). Campbell (1999: 286) describes internal “causes” of
change as “ based on what human speech production and percep-
tion is and is not capable of Internal causes include both physical
and psychological factors. ” Campbell describes external causes of
change as arising from “ largely outside the structure of language
itself and outside the human organism ” and including “expressive
uses of languages ” (287). Anderson and Milroy (MS) note that
variationist research seldom attempts to integrate socially motivated
and intrasystemic factors in accounts of language change.
Labov analyzes internal factors (1994) and social factors (2001)
separately, and describes the interface between language and society
as “narrow.” He further comments on the “relative segregation of
social and structural elements in language” (2001: 29). Labov, then,
views the interaction of internal and external factors as limited. Labov
(1994) argues that large-scale vowel rotations of the kind discussed in
Section 2.1 are structured by language-internal principles. He postu-
lates a set of principles based on a survey of a large number of chain
shifts. The thrust of his proposal is that chain shifts result from vowel
systems’ tendency to preserve symmetry (1994: 115–54).
I will suggest in Chapter 8 that, rather labeling some changes
as internal and others as external, a given change should be
examined in terms of internal constraints and external motivations.
In other words, the interplay between internal and external factors is

November 2007
MAC/MAL
Page-14
9780230_008861_03_cha02
14
Migration, Accommodation and Language Change
important to consider in investigations of change. Specifically, after
discussing the question of which aspects of vowel changes reported
in Chapters 6 and 7 are susceptible to being ideologized and which, if
any, are not, I will argue that some types of vowel changes (such as /ai/
glide-reduction) provide a crucial site for linguistically indexing social
oppositions, while others (such as the fronting of /u/ and /S/) do not.
In this view, there is no dichotomy between “internal” and “external”
types of changes such as those proposed by Labov (1994, 2001).
Instead, I specify how each vowel change is shaped by both internal
and external factors; underpinning this view is an assumption that
vowel realizations need to be treated multidimensionally as physical,
cognitive, and social. Specifically, we shall see in Chapters 6 and 7
that the fronting of /u/ and /S/ is contextually constrained while /ai/
glide-weakening is not. In Chapter 8, I advocate an approach that
is sensitive to the influences of coarticulation on sound change and
argue that vowel changes are internally constrained but subject to
ideological intervention. Context effects, in this case, coarticulation
with the following consonant, are examples of internal constraints
on changes which are also, depending on the social context, subject
to ideological intervention.
Section 2.2.3 describes a language ideological framework developed
by linguistic anthropologists, which I will make reference to in the
interpretation and conclusions given in Chapter 8.
2.2.2 Language ideology: An overview
Silverstein (1992, 1996), Woolard and Schieffelin (1994), Kroskrity
(2000), Irvine and Gal (2000), and others treat language ideolo-
gies as conceptual schemes that are used to interpret and under-
stand language variation. Irvine and Gal (2000: 35) characterize these
conceptual schemes as ideological because “they are suffused with
the political and moral issues pervading the particular sociolinguistic
field and are subject to the interests of their bearers’ social posi-
tion.” Woolard (1998: 3) describes language ideology as “representa-
tions, whether explicit or implicit, that construe the intersection of
language and human beings in a social world ” and as “ a medi-
ating link between social forms and forms of talk. ” Silverstein
(1979: 193) defines language ideology as “ sets of beliefs about
language articulated by users as a rationalization or justification of

November 2007
MAC/MAL
Page-15
9780230_008861_03_cha02
Empirical and Theoretical Background
15
perceived language structure or use.” Kroskrity (2000: 21) explicitly
comments on the connection of language ideology with speakers:
Language users’ ideologies bridge their sociocultural experience
and their linguistic and discursive resources by constituting those
linguistic and discursive forms as indexically tied to features
of their sociocultural experience. These users, in constructing
language ideologies, are selective both in the features of linguistic
and social systems that they do distinguish and the linkages
between systems that they construct.
In short, language ideologies are beliefs about language and interpret-
ations of its relationships with its social and cultural setting. Language
itself, as well as beliefs about it, is viewed as inherently socially and
culturally positioned. Analyses of the group of scholars discussed
above address and refine the role of social identity in structuring
language change. The situation of AAE and Appalachian English in
Detroit is well suited to an analysis in a language ideological frame-
work which addresses and integrates the roles of social structure and
of speaker attitudes in shaping the direction of language change.
Irvine and Gal (2000: 47) revisit Labov’s (1963) study of Martha’s
Vineyard to show how such an analysis might work:
Contrasts among ethnic groups of islanders (Yankees, Portuguese,
and Indians) in the 1930s were replaced by a contrast between
islanders and mainlanders in the 1960s. Islander phonology
diverged ever more sharply from mainland forms after the devel-
opment of the tourist industry made that contrast more socially
significant than local, intra-island differences. Although Labov did
not explore the content of language ideology giving rise to these
changes, the case seems to beg for just this type of analysis and
illustrates language change as an ideologically fueled process of
increasing divergence. We can call the divergence ideologically
mediated because it depended on local images of salient social
categories that shifted over time.
In Chapter 8, I will argue that “local images of salient social categories
that (shift) over time” (Irvine and Gal 2000: 47) are important

November 2007
MAC/MAL
Page-16
9780230_008861_03_cha02
16
Migration, Accommodation and Language Change
to consider in the analysis of the vowel changes reported for the
Southern migrant participants in Chapters 6 and 7.
Language ideologies are manifested not only in reactions and atti-
tudes to varieties (like AAE) or linguistic forms (such as /ai/ glide-
weakening or high and lower-high back vowel fronting) used by
salient social groups (such as Southern migrants), but in patterns
of language use. Anderson and Milroy (MS) note that this exten-
sion of the scope of ideological analysis from language attitudes to
include patterns of use distinguishes the approach of Irvine, Gal, and
their colleagues from most sociolinguistic work on language ideo-
logies (Lippi-Green 1997, for example). Anderson and Milroy (MS)
suggest that ideologies change as “ particular groups shift in and
out of salience in the sociolinguistic landscape at different times and
places.” Changing ideologies can yield different patterns of use and
are thus an important component of processes of language change.
2.2.3 Dialect contact
The dialect contact framework specified by Trudgill (1986) adds
an important dimension to the discussion of the dynamics driving
language change in the aftermath of speaker mobility and migration,
and I shall make reference to it in Chapter 8. Labov’s approach to
phonological change does not examine the effects of dialect contact
(Labov 2001: 20).
Thomason (2001: 62) defines contact-induced change as “ any
linguistic change that would have been less likely to occur
outside a particular contact situation. ” In her discussion of
linguistic “predictors” of contact-induced change, Thomason notes
that “speakers’ attitudes can and sometimes do produce excep-
tions to most generalizations ” (2001: 77). In this regard,
she points out, language change is unpredictable: “even the most
‘natural’ structural changes—common changes that occur frequently
in diverse languages all over the world—often do not happen”
(77). Thomason’s view of speaker attitudes disrupting or redirecting
contact-induced change suggests that there is an interplay of some
sort between internal and external factors in language change. One
goal of this study is to specify the interaction between internal and
external factors for the vowel changes described in Chapters 6 and 7.
One frequently occurring process which is the result of language
contact in the aftermath of migration and mobility is dialect leveling,

November 2007
MAC/MAL
Page-17
9780230_008861_03_cha02
Empirical and Theoretical Background
17
a process which involves the eradication of variants within and
also between systems (Trudgill 1986: 98). Leveling is likely to occur
following large-scale migrations such as those of the African American
and Appalachian Southern migrants in this study. Chapter 8 discusses
a change in Detroit AAE in terms of allophonic leveling.
This chapter described the empirical and theoretical background to
the study, focusing respectively on American English vowel shifts in
progress and socially oriented models of language change. Chapter 3
turns to the sociolinguistic setting of the research.

November 2007
MAC/MAL
Page-18
9780230_008861_04_cha03
3
The Sociolinguistic and
Demographic Context for the
Study
This chapter describes the research site of the study. It also discusses
the migration history of African American and Appalachian White
migrants to Detroit as well as the relationship between these two
groups. I also discuss work on the phonological characteristics
of the three varieties involved in this language contact situation.
Research on Appalachian English and AAE, both in the South and in
Southeastern Michigan, is reviewed along with work on Midwestern
White vowel systems in the Detroit area.
3.1 Research site and demography of the area
African American and Southern White migrant groups migrated
from the South to Detroit at about the same time and for similar
economic reasons (discussed in Section 3.2). This shared history and
subsequent contact raise a number of interrelated issues concerning
the extent to which the two groups share phonological systems asso-
ciated with the South, their level of participation (if any) in the
socially and geographically pervasive series of vowel rotations known
as the Northern Cities Shift (NCS), and possible interacting effects
of ethnicity, regional affiliation, and dialect contact on patterns of
language use.
One difference in the histories of the two groups is that eventually
many of the Appalachian Whites were able to immerse themselves
in the general White population, moving out of the city and into
“blue collar” inner suburbs (Sugrue 1996: 246). In contrast, while
there are some African Americans in the suburbs, the city of Detroit is
18
November 2007
MAC/MAL
Page-19
9780230_008861_04_cha03
Sociolinguistic and Demographic Context for the Study
19
overwhelmingly populated by African Americans (U.S. Census 2000).
Detroit has a long history of violent racial conflicts (Farley et al.
2000). Farley et al. (2000) describe Detroit as an extremely segregated
metropolis, an area divided primarily along White and Black racial
lines. Figure 3.1 shows the metropolitan Detroit area by percentage
of African American residents. The 2000 Census figures for the city
of Detroit show that it is 82% African American and 12% White. The
inner suburbs, in stark contrast, are predominately White. Relevant
Figure 3.1
The location of fieldwork sites (adapted from a map provided by
Wayne State University Center for Urban Studies, http://www.cus.wayne.edu/)

November 2007
MAC/MAL
Page-20
9780230_008861_04_cha03
20
Migration, Accommodation and Language Change
Table 3.1
Figures of 2000 census for White and African American residents
for the Appalachian fieldwork sites
Inner suburb
White (%)
African American (%)
Dearborn Heights
92
2
Royal Oak
95
2
Warren
91
3
Taylor
86
9
figures from the 2000 Census of Population for the suburbs, where
all but one of Appalachian speakers studied in this study are resident,
are given in Table 3.1, and the locations are shown in Figure 3.1.
Figures are provided for the year 2000 because these figures are the
most relevant in terms of the time of data collection for the study;
fieldwork was carried out from 1999 to 2002.
SEMCOG (1994) describes the demographic differences between
the outer and the inner suburbs of Detroit as well as the inner city.
Residents of the outer suburbs have a high socioeconomic status.
Their populations are predominantly White, wealthy, and likely to
have extensive formal education. These residents occupy expensive
homes, are mobile, and are more likely to be professionals than are
residents in any other part of the Detroit metropolitan region. The
inner suburbs, including Warren, Taylor, Royal Oak, and Dearborn
Heights (where all but one of the Appalachian participants in this
study reside), are not as affluent as the rich outer suburbs, but they
are more economically stable than the inner city. All the African
American participants are Detroit residents.
One of the largest technically skilled workforces in the country
populates the “blue collar” inner suburbs (SEMCOG 1994; Farley et al.
2000). Demographic data for housing tenure from the 2000 Census
shows that significantly more families own their homes in the inner
suburbs than in the city. In Detroit about half of the units were occu-
pied by renters. In contrast, 85% of residents in Dearborn Heights,
70% in Royal Oak, 71% in Taylor, and 80% in Warren own their
homes. The Detroit White participant lives in Wyandotte. Although
it is an outer suburb, it is predominantly working class (Elias MS;
Frekko MS; SEMCOG 1994). The 2000 Census data show that 73% of
Wyandotte residents own their homes.

November 2007
MAC/MAL
Page-21
9780230_008861_04_cha03
Sociolinguistic and Demographic Context for the Study
21
3.2 History of migration to southeastern Michigan
Large numbers of Southerners migrated to southeastern Michigan
in the early decades of the twentieth century to work in factories
which offered higher wages than could be found in the South, which
was still largely agrarian. The Great Southern Migration began during
World War I and continued unabated through the 1960s (Sugrue
1996). Recognizing the magnitude of this migration from the South,
commentators have called Detroit a “magnet” for African American
and White Southern migrants (Sugrue 1996: 12, 212).
3.2.1 Appalachian White migration to Detroit
Southern Highlanders migrated to Detroit in large numbers (Hartigan
1999; Berry 2000) from the Appalachian Mountains of West Virginia,
Kentucky, Tennessee, and North Carolina, a region that was histor-
ically isolated from the rest of the South. The economic picture of
the rural South was (and is) grim. Farmers with small acreage and
subsistence farmers grew increasingly marginalized from mainstream
industrialized America in the last three decades of the nineteenth
century, and industrial capitalism’s rise was “ inversely related to
subsistence agriculture’s demise” (Berry 2000: 15). Historian Chad
Berry, the grandson of Southern migrants, describes the importance
of kinship ties in the migration process: “ the highways that led
northward were built on kinship, a factor that often determined
where a migrant went as well as where he or she lived (and)
worked” (Berry 2000: 6–7). The urban Midwest offered economic
incentives to migrants, but the South was home to important cultural
values such as those of homeland, family, community, and religious
affiliation.
Appalachian migrants began arriving in Detroit as early as World
War I (Berry 2000: 12). Elmer Akers was one early writer who invest-
igated early Southern migrants to the Detroit area, and he describes
the difficulties they encountered:
(the) characteristic of mind and personality, combined with a piti-
fully meager education and almost total unfamiliarity with the
ways and demands of a high-speed industrial society makes their
difficulties of accommodation to Detroit almost insuperably great.
(Akers 1936: 7)

November 2007
MAC/MAL
Page-22
9780230_008861_04_cha03
22
Migration, Accommodation and Language Change
Akers conducted interviews with businessmen, employment agency
representatives, landlords, and grocers in Detroit and with Southern
migrants themselves. His main observation is that Southern Whites
do not assimilate to Northern culture or lifestyles and as a result they
face considerable hostility in securing work and locating housing.
Several management officials in charge of hiring whom Aker inter-
viewed stated that they did not often hire Southern Whites because
of their frequent trips back down South. An official involved in the
hiring process at a Detroit auto factory responds thus:
They are rovers, a transient group of people And they are pretty
slow. They have no drive, most of them. They don’t establish resid-
ence here and try to get ahead. It got so we wouldn’t hire them at
all, toward the last—toward 1929. I got tired of seeing Southerners.
You can tell a Southerner as soon as he opens his mouth, you
know, if not by his appearance. I would tell them “I don’t want
you fellows from the South. You don’t stick to your job. The first
thing we know you are gone back South”. (Akers 1936: 41)
Southern Whites also faced housing discrimination. Many of the
landlords who were interviewed in the 1930s stated they did not like
to rent to them. One merchant explained to Akers that the Southern
Whites “affect(ed) property values and neighborhood qualifications
very much as do Negroes” and pointed out that many would not rent
to them for this reason (Akers 1936: 14).
Akers (1936) also describes the way Southern White migrants integ-
rated as a distinctive group in Detroit rather than blending into the
Midwestern White community:
Again and again we got the impression that the Southern Whites
were in the neighborhood but not of it, in the city but not in
any sense a real part of it. Many women we talked with knew no
Northern women, and their communal life was entirely a matter of
informal associations with other Southern White women. (Akers
1936: 63)
they are not concerned about what Northerners think of them.
Status seemed to be almost wholly a matter of in-group relations
among most of those we interviewed. (Akers 1936: 65)

November 2007
MAC/MAL
Page-23
9780230_008861_04_cha03
Sociolinguistic and Demographic Context for the Study
23
Akers also comments, “Socially the Southern Whites are a self-
contained group. This statement is quite as true as it would be of any
group of immigrants from a foreign country, if not more so” (Akers
1936: 65).
Early Southern White migrants in Detroit appear to have faced
considerable hostility from the general population at the beginning
of the migration period. Akers reports that many of the Northern
Whites he interviewed stated frankly that they did not like Southern
Whites or want them in their neighborhoods or at their places of work
(Akers 1936: 73). Given the hostility of Detroit Whites to the arrival
of Southern Whites, as well as the importance of strong kinship ties
and rural cultural values to these migrants, it is not surprising that
they formed and maintained close ties with other Southern Whites in
Detroit, even if they did not migrate from the same hill, “holler,” or
even state. As Berry (2000: 136) points out, this kind of group forma-
tion is one of the strongest indicators that Southern White migrants
called on their past once in the North and hence demonstrated an
important type of minority behavior (see also Stewart 1996).
Although these early migrants faced severe discrimination in
employment and housing and were not welcomed by their Northern
neighbors, later generations of Southern White migrants appear to
have found the Detroit area more hospitable. Between 1945 and 1960,
migration from the rural South increased dramatically, resulting in
one of the largest internal migrations in U.S. history. Berry (2000:
104) describes four important characteristics of this migration. It
occurred not just from Appalachia, but also from nearly all areas of
the Upland South. Southern migrants were quite visible in the North
due to their massive numbers, unique cultural characteristics, and
distinctive dialects. Kinship ties played a crucial role in migration.
Berry describes these kinship ties as “very broad, including not only
kin but also friends whom they could call and depend on for
support once in the North” (120). Berry also reports that Southern
migrants began to be more economically successful during the years
of 1945–1960.
Several researchers comment on the distinctive cultural charac-
teristics which Southern migrants retained after relocating to the
Midwest. Berry (2000: 134) comments, “Even those migrants who
were most ‘assimilated’ never completely ceased to be Southern.”
He also reports that Southern migrants often formed community

November 2007
MAC/MAL
Page-24
9780230_008861_04_cha03
24
Migration, Accommodation and Language Change
and neighborhood clubs in Detroit and showed a significant degree
of “cultural retention” of Southern traditions such as the Southern
Baptist religion and Bluegrass music.
3.2.2 African American migration to Detroit
African Americans migrated to Detroit primarily from the Deep
South and old plantation areas—Alabama, Mississippi, Georgia, South
Carolina, and the Piedmont and coastal regions of North Carolina;
however, some African American migrants did come from the non-
plantation regions of the South, such as the Southern Appalachian
mountains and Texas. All the African American participants in
this study reported their migration was from the former plantation
areas of the South. Sugrue (1996: 23) describes the period between
1916 and 1929 as the “Great Migration” of African Americans
to Midwestern industrial centers such as Detroit. This migration
continued unabated into the 1950s as more African Americans from
the South joined friends and relatives already living in Detroit (30).
Like the Appalachian White migration, the African American migra-
tion was also predominately kin-based, following a similar pattern of
chain migration. Another important similarity shared by Appalachian
Whites and African American Southern migrants is that both groups
typically migrated from rural areas (Marks 1989; Berry 2000).
Detroit’s history of racial conflicts includes two severe riots. The
first of these, in which both African Americans and Midwestern
Whites participated, occurred in 1943. African American residents
also rioted in 1967. There were several factors which contributed
to the Detroit riots. African Americans were subject to residential,
economic, and social segregation in the Detroit area. Sugrue (1996)
describes the residential segregation of African Americans in detail:
White Detroiters invented communities of race in the city that
they defined spatially Whiteness, and by implication, Black-
ness, assumed a material dimension, imposed on the geography
of the city (234).
During the period of school desegregation, White neighborhood
“civic” groups were formed for the purpose of keeping African
American families out of their neighborhoods. These neighborhood
groups sprang up throughout many of the suburbs (Sugrue 1996).

November 2007
MAC/MAL
Page-25
9780230_008861_04_cha03
Sociolinguistic and Demographic Context for the Study
25
Farley et al. (2000), cited in Anderson and Milroy (MS), also describe
the historical and current residential segregation of African Americans
in Detroit.
Following the urban riots of the 1960s [in Detroit], the Kerner
Commission bleakly described what they thought the future held
if the government failed to address the nation’s fundamental racial
inequalities: a nation divided into largely black and impover-
ished central cities surrounded by largely white and prosperous
suburban rings . They were wrong about New York, Los Angeles,
Washington and other locations, since immigration from Asia and
Latin America changed the composition of many central cities.
And the Kerner Commission did not foresee the substantial shift of
African Americans to the suburbs that began in the 1980s. But they
were right about Detroit: economic changes since 1970, combined
with continuing racial polarization and the longstanding move-
ment of Whites—but not Blacks—to the suburbs, make Detroit the
polarized metropolis they predicted. (Farley et al. 2000: 51–52)
Why has the segregation of African Americans persisted so long in
Detroit? Farley et al.’s (2000) large-scale sociological survey of Detroit,
which investigated employer hiring practices and attitudes toward
the integration of African Americans into White neighborhoods,
showed that many Whites in the Detroit area still hold negative
stereotypes about African Americans:
Despite strong endorsement of the ideals of equal treatment for
all races, the remnants of traditional racial stereotypes are still
present in the thinking of many Detroit area Whites. The majority
endorses the idea that Blacks are not easy to get along with and
prefer more than Whites to live on welfare. (245)
Sugrue (1996), Farley et al. (2000), and SEMCOG (1994) all conclude
that Detroit African Americans typically have worse jobs, lower
incomes, and poorer housing than Whites and predominantly live in
the city rather than the suburbs.
This section demonstrates that there are important similarities in
the migration histories of Appalachian White and African American
Southern groups and the discrimination they encountered in Detroit.

November 2007
MAC/MAL
Page-26
9780230_008861_04_cha03
26
Migration, Accommodation and Language Change
Section 3.3 describes reports by a number of researchers on the
relations between these migrant groups in the Detroit area.
3.3 Appalachian Whites and African American Southern
migrants in the Detroit area
In addition to the commonalities described in Sections 3.2.1 and
3.2.2, the evidence reviewed in this section suggests that African
American and Appalachian White Southern migrants and their
descendants share a number of important cultural characteristics
with each other. Edwards (1997) reports that Detroit African
Americans frequently visit relatives in the South, and Berry’s (2000)
analysis of oral history among White migrants shows the same
pattern of frequent and extended visits with friends and family in the
South. Recall also that both the African American and Appalachian
White migrations from the South to Detroit were largely kin-based.
As discussed below, White and Black Southern migrants lived in
close proximity to each other, at least through the 1950s and 1960s.
In contrast, as already discussed in Section 3.2, Northern Whites
were extremely resistant to African Americans moving into their
neighborhoods.
Akers (1936) provides excerpts of interviews he conducted with
White Southern migrants in Detroit which suggest that even these
early White migrants may have been accommodating of African
Americans. For example, Akers asked one Southern family what
they disliked about Detroit. A high-school-age boy, seconded by his
parents, said:
the people up here think we don’t like it because the Negroes
are given equal rights with White people. But I don’t think that’s
so What we don’t like is that you northerners seem to think the
foreigners have more right to work and to a place here than the
Southerners do. (74)
Akers attributes such attitudes to non-Americans having achieved a
more secure and more prosperous niche in the city’s industrial and
social economy than either African Americans or White Southerners.
A more recent account of relations between Southern Whites and
African Americans is provided by the anthropologist John Hartigan,

November 2007
MAC/MAL
Page-27
9780230_008861_04_cha03
Sociolinguistic and Demographic Context for the Study
27
who conducted ethnographic fieldwork among Southern Whites
in the Briggs and Corktown communities on the Southwest side
of Detroit from July 1992 through February 1994. He reports that
Whites in these neighborhoods never assimilated into mainstream
Midwestern White culture, and describes close relationships between
these Southern Whites and Blacks. Hartigan also comments on the
importance of class in the construction of White racial identity:
The clarity of the category (hillbilly) primarily stands out in rela-
tion to the degree of assimilation into mainstream White middle
class culture. The term’s primary contrast inscribed the differ-
ence between Whites who assimilated successfully in this northern
industrial town and those who retained behaviors or lived in
conditions that were somehow improper for Whites. It seemed to
me that it was the hillbillies’ very close proximity to Blacks that
often heightened this sense of impropriety. (Hartigan 1999: 89–90)
In addition to describing close relationships with African Americans,
some participants in Hartigan’s study also described the 1967 riot in
regional rather than racial terms. One native-born Northern White
woman comments on how this riot marked the culmination of two
decades of White and Black Southern migration which “forever trans-
formed” her neighborhood:
you had Northern people acting like they (the Southerners) were
invading their territory; they were up in arms, and they fought
each other. But there are more Southerners here now than there
is anything else. That’s because the Northerners just went further
north (after the riot). (Hartigan 1999: 49–50)
Hartigan concludes that Southern Whites and African Americans in
his fieldwork sites treat each other as individuals and react in terms
of occupational, social, cultural, and regional characteristics rather
than in terms of race.
Berry (2000) reports that when he asked Southern Whites what
they disliked most about Detroit they frequently mentioned Northern
Whites but, significantly, never African Americans. Hartigan asked
his participants the same question. One participant who had retired
from the workforce responds thus:

November 2007
MAC/MAL
Page-28
9780230_008861_04_cha03
28
Migration, Accommodation and Language Change
Most of the hillbillies do not like Yankees to start with. We were
true Southerners even though we worked in Detroit. We still had
to stick together even though we lived in Yankeeland and worked
for Yankees. We didn’t like Yankees. That’s our heritage. (Hartigan
1999: 139–140)
Both African American and Appalachian Southern White migrants
brought a Southern rural culture to Detroit which was discordant
with the Northern urban culture.
Unlike the inner city participants in Hartigan’s study, the majority
of Southern migrants in the greater Detroit area, according to Sugrue
(1996), did not remain in inner city enclaves but rather dissolved into
the suburban landscape:
Hillbillies, as they were labeled, were frequently blamed for racial
tension in the city, but their role was greatly exaggerated. Most
of them dispersed throughout the metropolitan area, and quickly
disappeared into the larger White population. (Sugrue 1996: 212)
Berry (2000) also comments on the eventual economic success of
many Southern White migrants. However, Berry argues that these
migrants nevertheless show a great deal of “cultural retention” of
rural, Southern cultural traditions (Berry 2000: 136).
This section discussed the shared cultural and regional orient-
ation of White and African American Detroit Southern migrants.
Although the groups have much in common in these respects, African
Americans, unlike Southern Whites, have never been able to immerse
themselves into the general White suburban population, no matter
what their socioeconomic status is.
The next section discusses sociophonetic work on the varieties of
English spoken by the two groups in the context of Appalachian
and African American varieties of English in the South and local
Midwestern White vowel norms.
3.4 Appalachian English
3.4.1 In the Southern Highlands
Appalachian English in the Southern Highlands, an area which
stretches along the Appalachian mountain range from West Virginia

November 2007
MAC/MAL
Page-29
9780230_008861_04_cha03
Sociolinguistic and Demographic Context for the Study
29
to Northern Georgia in the American South, is relatively under-
researched. As Hazen and Fluharty (2001) stress, there is more than
one variety of English spoken in a region which spans portions of six
states. The vowel rotation traditionally cited as characteristic of the
dialects of the Southern Highlands, the Southern Shift, was described
in Section 2.1.2.
Wolfram and Christian (1976) investigated Appalachian English in
Mercer and Monroe counties in West Virginia. With respect to phon-
ological variation, they focus mainly on consonantal features such as
consonant cluster reduction (CCR), intrusive t in clusters like oncet for
“once,” and /l/ deletion hep for “help.” They also discuss unstressed
syllable deletion maters for “tomatoes.” For vowels, they describe glide-
reduction for /ai/ and the pre-nasal merger of [G] and []. Although
consonant features are certainly important in describing the phono-
logical patterns of any variety, this study will focus on portions of the
vowel system which are implicated in the Southern Shift.
Anderson (1998, 1999) investigated /e/, /o/, /ai/, and /oi/ in
Appalachian English in Graham County, North Carolina, in the heart
of the Great Smoky Mountains. The results of that acoustic study
showed that all 30 White participants adopted realizations of /e/
and /o/ which follow the pattern for the Southern Shift described in
Section 2.1.2. /oi/ showed a low, back nucleus and glide toward the
high front portion of the vowel space. /ai/ is discussed further below.
Hazen and Fluharty (2001) found that “traditional” Appalachian
dialect features, including /ai/ monophthongization and ungliding,
were dying out among young West Virginians, but it is important
to note that many of their speakers are suburban rather than rural,
and several of them are what these researchers call “first-generation”
Appalachians since they have in fact moved to the Appalachian
region from the North. Here I treat the designation “Appalachian” as
an ethnic category (see further Hartigan 1999; Stewart 1996), rather
than as a designation for people who simply live in a given area (such
as Northerners who live among ethnic Appalachian populations). It
is the traditional Appalachian features which are of relevance to this
study, rather than the modern leveled suburban dialect described by
Hazen and Fluharty.
I will discuss /ai/ in detail here because it is an important marker
of regional identity in the South. Hall (1942: 43) describes a pattern
of glide-weakening for his data from the Smoky Mountains of North
Carolina, indicating that /ai/ is most often realized as [a:] in all

November 2007
MAC/MAL
Page-30
9780230_008861_04_cha03
30
Migration, Accommodation and Language Change
phonetic environments. In fact, he notes that the tendency in general
Southern American speech at that time was to monophthongize /ai/
in voiced environments, such as ride [ra:d], but to retain the diph-
thong in voiceless environments, such as in light [lait]. This pattern
did not, however, hold true for Highland Southern English in the
Smoky Mountains, where a glide-weakened variant, [a:], was preferred
in all phonetic environments (Hall 1942: 43). Kurath and McDavid
(1961) found evidence of glide-weakening for the word twice in
Western North Carolina and for the words nine and might in Macon
County, which borders Graham County. The data for the word might
provided by the LAMSAS office at the University of Georgia indicates
that /ai/ was nearly monophthongal in Western North Carolina in
both pre-voiced and pre-voiceless environments in the 1930s and that
diphthongal pre-voiceless /ai/ was already a relic form in this area.
Wolfram and Christian (1976: 64) found that Appalachian English
speakers in their study of two counties in West Virginia particip-
ated in the glide-reduction of /ai/, and they determined the order,
from most to least favorable, for following phonetic environments
for this feature to be pause > voiced obstruent > voiceless obstruent.
This ordering falls in line with the traditional constraint pattern for
general Southern American English and is in contrast to Hall’s (1942)
observation that the /ai/ glide was reduced in all following phon-
etic environments in the Smoky Mountain region of Western North
Carolina.
Williams (1992: 14) also describes /ai/ in Appalachian English as
glide-weakened, and although he cites the classic example of the
general Southern American pronunciation of [a:s] for ice, he does
not discuss the effect of following phonetic environment on the
patterning of the variable. Pederson (1983: 73) indicates that /ai/
for seventy East Tennessean informants is realized most often as a
monophthong and, less frequently, as a short diphthong. He further
notes that /ai/ is typically monophthongal before voiceless conson-
ants, as in write or light, for all age and social groups of the region (75).
Acoustic data for /ai/ for Whites in Graham County, North
Carolina, presents a similar picture of present-day Smoky Mountain
English, which is largely glide-reduced for /ai/ in all following phon-
etic environments (Anderson 1997, 1998, 1999). In fact, all the 30
White participants in that project showed categorically weakened
variants in all phonetic environments.

November 2007
MAC/MAL
Page-31
9780230_008861_04_cha03
Sociolinguistic and Demographic Context for the Study
31
In summary, with the exception of the work of Wolfram and
Christian (1976) and Hazen and Fluharty (2001) in West Virginia,
researchers have found a pattern of glide-reduction for /ai/ in all
phonetic contexts in Appalachia, including the salient pre-voiceless
environment. This important pattern, a relatively recent develop-
ment in the lowland South but a change at completion in some
varieties of Appalachian English, is relevant to the discussion of the
acoustic analysis of /ai/ presented in Chapter 7.
The next section discusses sociolinguistic work on the dialects of
Appalachian migrants and their descendants in Ypsilanti, Michigan,
a town about 30 miles to the west of Detroit.
3.4.2 In Southeastern Michigan
Evans et al. (2000) and Evans (2001) investigated /æ/-raising, an
NCS feature, among Appalachian descendants in Ypsilanti, Michigan.
They found that Ypsilanti Appalachian speakers adopted the local
raised pronunciation for this vowel, leading Evans (2001) to conclude
that the descendants of Appalachian migrants in Ypsilanti acquired a
new Midwestern identity at the expense of their previously regionally
based Southern Appalachian identity. In contrast, the results of my
own work show that the Detroit area Appalachian participants retain
and maintain both regional Appalachian speech patterns and a social
and cultural orientation to the Southern Highlands (see Chapters
4 and 8). It is unclear why Appalachian Whites in Detroit would
show less accommodation to Midwestern White linguistic norms
than Appalachian Whites in Ypsilanti.
Next I turn to descriptions of AAE, both in the South and in the
urban Midwest.
3.5 African American English
Descriptions by researchers of AAE vowel systems were reviewed in
Section 2.1.3. This section considers reports on AAE in the Southern
United States and in the Detroit and Lansing areas of Michigan.
3.5.1 In the South
According to Labov (1994), African Americans do not participate in
the changes associated with the Southern Shift. Likewise, Thomas

November 2007
MAC/MAL
Page-32
9780230_008861_04_cha03
32
Migration, Accommodation and Language Change
concludes that “in general the African American avoidance of sound
changes that have occurred in White vernaculars holds true in the
South” (2001: 170). However, there are reports that AAE speakers do
participate in some sound changes traditionally described as char-
acteristic of White varieties. For example, Fridland (2001) found
that her entire all-female sample of AAE speakers in Memphis,
TN, showed evidence of the Southern Shift (see Section 2.1.2 for
a description of the Southern Shift). They showed reversal for
/e/ and // and the fronting of /u/. Fridland concludes that the
Southern Shift is better characterized as regionally based than as
ethnically based, contrary to Labov’s (1991, 1994) treatment of
this series of vowel changes (see Section 2.1.2). Wolfram (2007)
cautions against treating AAE as a homogeneous trans-regional
variety.
3.5.2 In Southeastern Michigan
Edwards (1997) investigated the persistence of Southern features in
Detroit speech. He noted that /ai/ was monophthongized for the
African American participants in his study but did not distinguish it
by different following phonetic contexts in his analysis. He described
monophthongal [a:] as an important feature of group identity for
working-class speakers in his study.
Detroit AAE has also been examined with regard to presence or
absence of features associated with the NCS. Deser (1990) analyzed
the vowel systems of 18 speakers from the Shuy et al.’s (1968)
sample. She attempted to determine whether these speakers showed
/æ/-raising but was unable to discern clear patterns (Deser 1990: 109).
Gordon (2001: 91) points out that it is difficult to draw conclusions
from Deser’s results. For example, Deser makes the claim that younger
speakers’ productions are more “Northern-like” than those of teen-
agers and adults, but her sample is skewed by the fact that several of
these speakers’ families are not in fact Southern migrants. Rather, they
were already resident in Detroit prior to the Great Black Migration
from the rural South. Deser also noted, however, that children with
Southern African American parents appeared to monophthongize
/ai/, producing in some cases 100% monophthongization. I will
return to this important observation in Chapter 8.
Jones (MS) investigated the speech of African Americans in Lansing,
Michigan, a city 55 miles northwest of Detroit, and found evidence

November 2007
MAC/MAL
Page-33
9780230_008861_04_cha03
Sociolinguistic and Demographic Context for the Study
33
of recent Southern sound changes. She reports that older speakers
in her sample show fronting for /u/ and /S/ along with lowering
of /e/, all of these being Southern Shift features. In contrast, Jones
reports minimal evidence for two women of an NCS feature, fronting
for /?/, and concludes that her results “may indicate a conservative
trend among Northern AAE speakers or a reaffirmation of the group’s
Southern identity” (24).
Jones and Preston (in press) investigated pre-oral /æ/-raising and
/?/-fronting among African American females in Lansing. They
found that eight out of nine speakers showed raising for /æ/, but
they found no fronting for /?/. They conclude that /æ/-raising is a
local linguistic norm which “ has nothing to do with the African
American identity of Lansing speakers ” (16). They note further
that “it seems that AAE speakers may choose to adopt and adapt
certain local features, which may grant them a regional label ,
yet they also possess strictly AAE features ”(32). Interestingly, the
patterns reported by Jones and Preston for African Americans in
Lansing are quite different for those which will be reported in later
chapters for Detroit African Americans. It seems that Lansing and
Detroit differ with respect to the assimilation of African Americans
to Midwestern White vowel norms.
3.6 Midwestern urban Whites
As discussed in Section 2.1.1, the NCS is a series of vowel changes
reported to be in operation in the Midwest, particularly in the urban
centers. Eckert (1987, 1988, 1989, 1991, 2000) investigated the NCS
in two Detroit suburbs, engaging in two years of participant obser-
vation in two high schools. Eckert (2000) found that the older NCS
changes (the raising of /æ/ and fronting of /?/) correlated only
with gender, with the girls leading in the use of advanced variants.
Eckert (2000) also reported patterns for /ai/, which is socially salient
in Detroit. Although Eckert found some /ai/ monophthongization
among adolescent boys, it did not occur before pre-voiceless conson-
ants. Eckert found that this context strongly favored the raising and
backing of the /ai/ nucleus, i.e. [i]; this realization of /ai/ showed no
social stratification among the White teenagers in Eckert’s study, but
it indexes a very sharp distinction with Detroit African Americans.
In fact, Eckert (2000: 136) characterized /ai/ raising and backing as a

November 2007
MAC/MAL
Page-34
9780230_008861_04_cha03
34
Migration, Accommodation and Language Change
“newer variable” which is more advanced in areas closer to the urban
center. This feature, also called “Canadian raising,” is widespread in
the Midwest. I will return to this point in Chapter 8.
Popular attitudes toward local varieties of English are also relevant
to this study. Niedzielski (1999: 80–81) reports that White speakers in
Detroit report that they are speakers of “standard” speech. Based on
the results of their extensive sociological surveys, Farley et al. (2000:
223) describe the same attitude: “Among Whites in Metro Detroit
(the city plus the inner suburbs) there is still a widespread belief
that Whites speak the (English) language better than Blacks.” Such
language ideologies are important to my analysis in Chapter 8.
This chapter discussed the research sites where data for this study
was collected and described the migration histories and cultural
orientations of Detroit Appalachian White and African American
Southern migrants. It also reviewed the relevant sociolinguistic work
on Appalachian English, AAE, and Detroit suburban White varieties.

November 2007
MAC/MAL
Page-35
9780230_008861_05_cha04
4
The Pilot Study
A three-year pilot study informed the design of the study reported
in Chapters 5, 6, and 7. The pilot analyzes /ai/ for 27 Detroit AAE
speakers (Section 4.1). In addition, the patterning of // and /æ/ is
described in Section 4.2 for five of the Detroit AAE speakers, five
Detroit Appalachian English speakers, and five Midwestern Whites
(Anderson and Milroy 2001a,b; Anderson 2002). I conducted ethno-
graphic interviews (described in Section 5.1) with 20 of the African
American speakers and 2 of the Appalachian White speakers. Data
for the seven additional African Americans comes from a corpus of
conversations between Detroit inner city African American mothers
and their children, provided by speech pathologists Holly Craig and
Julie Washington at the University of Michigan. Data from three addi-
tional Appalachian White and all of the Midwestern White speakers
was collected by Susan Frekko, a linguistic anthropology graduate
student at the University of Michigan. The research site for this study
was described in detail in Chapter 3. Data collection procedures are
those used in the main study, and are discussed in Section 5.2.
4.1 /ai/
4.1.1 Participants and methods of analysis for the pilot study
Data from 27 AAE speakers were collected by two different inter-
viewers, an African American speech-language pathologist and
myself. The speakers were 3 older adults (a man aged 81 and two
women aged 70 and 62), 16 younger adults (14 women with an age
range of 20–45 and 2 men, aged 42 and 25), and 4 girls and 4 boys
35

November 2007
MAC/MAL
Page-36
9780230_008861_05_cha04
36
Migration, Accommodation and Language Change
aged 4–7. As noted above, I conducted interviews with all of the
adults and one of the girls. Data from the other seven children was
extracted from the corpus provided by speech pathologists Craig
and Washington. This corpus contains spontaneous conversation
between Detroit African American mothers and their children and
was collected in 1995 for the purpose of assessing dialect acquisition
of AAE. Because the patterns reported below are consistent between
my interviews and the corpus, it is unlikely that they were due to
radical interviewer effect. Although this is not a sample organized
systematically by age and gender, the data from both sources
together cover a wide age range.
The sociolinguistic interviews I conducted lasted about 60–70
minutes, and the conversations collected by the speech-language
pathologist lasted 45–60 minutes. The interviews that I conducted
were organized around the talk of participants on the topic of life
in contemporary Detroit. My own Southern origins and vernacular
Appalachian dialect were helpful in gaining access to the community,
and I developed close ties with several key participants. All of these
interviews were conducted in participants’ homes in the West Side of
Detroit and recorded using a Sony portable minidisk recorder (model
MZ-R30) and a Sony microphone (model ECM-MS957). Tokens of
/ai/ were analyzed impressionistically for presence or absence of a
full diphthong. Following Eckert (2001), non-diphthongal tokens
were categorized as monophthongal and showed a fronted nucleus
and either no glide or a very weak glide. This categorical distinc-
tion between diphthongal and monophthongal /ai/ is a limitation
of the pilot study that will be addressed in Chapter 7, where I treat
“monophthongized” variants gradiently as glide-weakened.
4.1.2 The patterning of /ai/
The results of the impressionistic analysis of /ai/ show that the canon-
ical AAE pattern of diphthongization in pre-voiceless contexts (see
Section 2.1.4) emerges in the systems of the three elderly speakers.
Figure 4.1 shows that /ai/ monophthongization in the crucial pre-
voiceless context is rare for the two older women, and does not occur
for the older man. However, the monophthongized variant reported as
characteristic of some White varieties of Southern English has spread
to pre-voiceless obstruent contexts for the younger adults and chil-
dren. A robust pattern of distribution is shown in Figure 4.1, in that
speakers under 45 years of age contrast with older African Americans
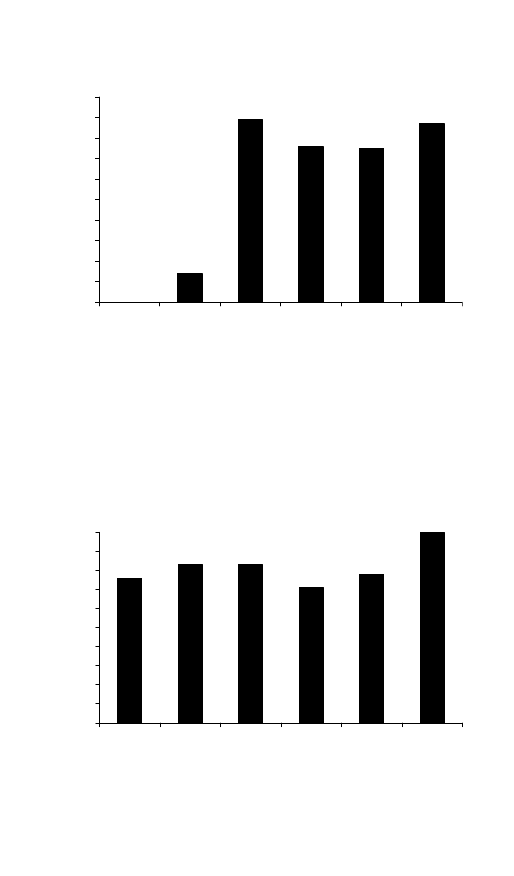
November 2007
MAC/MAL
Page-37
9780230_008861_05_cha04
The Pilot Study
37
0
10
20
30
40
50
60
70
80
90
100
% Monophthongized
Older man
Men 20–45
Boys 4–7
Older
women
Women
20–45
Girls 4–7
Figure 4.1
Pre-voiceless /ai/ monophthongization by age and gender for 27
Detroit AAE speakers (token n
= 483) (Anderson 2002)
in using the monophthongized variant at a high level (between 75%
and 89%). The distribution of both diphthongized and monophthong-
ized variants for all speakers in a range of phonetic contexts (the input
for Figures 4.1 and 4.2) is shown in detail in Table 4.1.
Figure 4.2 shows the percentage of monophthongized variants for
all speakers by phonetic environment. Before word-final glottalized
0
10
20
30
40
50
60
70
80
90
100
% Monophthongized
Lateral
Voiceless
obstruent
Pause
Nasal
Voiced
obstruent
Final
glottalized
/d/
Figure 4.2
AAE /ai/ monophthongization by following environment for 27
Detroit AAE speakers (token n
= 1241) (Anderson 2002)

November 2007
MAC/MAL
Page-38
9780230_008861_05_cha04
38
Migration, Accommodation and Language Change
Table 4.1
Number and % of [a:] versus [ai] realizations of /ai/ by
following phonetic environment. Speakers are grouped by age and gender
(Anderson 2002)
Speaker
groups
Liquid
Nasal
Vd. Obs.
Vl. Obs.
#
___d#
a:
ai
a:
ai
a:
ai
a:
ai
a:
ai
a:
ai
Older
man n
= 1
1
0
17
0
18
3
0
14
5
2
%[a:]
[100]
100
86
0
71
N/A
Older
women
n
= 2
13
1
21
11
27
11
6
38
9
6
8
0
%[a:]
92
67
71
14
60
100
Men
20–45
n
= 2
17
0
27
1
46
4
67
8
17
1
12
0
%[a:]
100
96
92
89
94
100
Women
20–45
n
= 14
20
15
95
18
135
24
202
65
52
14
26
0
%[a:]
57
84
85
76
79
100
Boys 4–7
n
= 4
1
1
8
1
10
1
39
13
11
2
4
0
%[a:]
[50]
89
91
75
85
100
Girls 4–7
n
= 4
1
0
7
5
12
8
27
4
4
3
2
0
%[a:]
[100]
58
60
87
57
[100]
Total
n
= 27
53
17
175
36
248
51
341
142
98
28
52
0
%[a:]
76
83
83
71
78
100
obstruents, as in [sa:=d] “side,” a characteristic AAE variant of word-
final /d/ (see Bailey and Thomas 1998; Anderson 2001), /ai/ is typic-
ally monophthongal. The other environments vary from each other
only slightly, and levels of use are all in excess of 70%. This distri-
bution, together with the age-related pattern shown in Figure 4.1,

November 2007
MAC/MAL
Page-39
9780230_008861_05_cha04
The Pilot Study
39
Table 4.2
Comparison of Detroit AAE with other varieties for monoph-
thongal realizations of pre-voiceless /ai/
Pre-voiced [a:]
Pre-voiceless [a:]
Detroit AAE
Yes (Anderson 2002)
Yes (Anderson 2002)
Southern Appalachian
White
Yes (Anderson 1999;
Thomas 2001)
Yes (Anderson 1999;
Thomas 2001)
Southern White
varieties in the former
plantation regions of
the South
Yes (Thomas 2001;
Wolfram and Thomas
2002, and others)
Traditional pattern; no
progressive varieties;
yes (Thomas 2001)
AAE in the South
Yes (Thomas 2001;
Wolfram and Thomas
2002; Childs 2005, and
others)
AAE in Texana (Childs
2005); incipient
fronting in Memphis
(Fridland 2004); Hyde
County (Wolfram and
Thomas 2002)
Northern White
No
No
suggests that the spread of [a:] to the pre-voiceless context is a change
in progress close to completion in Detroit AAE.
In summary, the data presented in Figure 4.2 show that the younger
speakers in this sample contrast sharply with older speakers in their
use of glide-reduced variants of /ai/ in the pre-voiceless obstruent
context. Wolfram’s work in Detroit suggests that this change started
within the last 30 years or so, since /ai/ was diphthongal in this
context for African American Detroiters in the sixties (Nguyen 2006),
as in AAE generally. Table 4.2 provides a summary of the patterning
of /ai/ in relevant varieties.
Although /ai/ was analyzed impressionistically and treated categor-
ically in the pilot study, it will be analyzed acoustically and treated
gradiently in the main study.
4.2 Acoustic analysis of // and /æ/ for five Appalachian
White women, five African American women, and five
Northern White women
The pilot study also investigated the patterning of // and /æ/ in
nasal and non-nasal environments for 15 female speakers. // and

November 2007
MAC/MAL
Page-40
9780230_008861_05_cha04
40
Migration, Accommodation and Language Change
/æ/ were chosen because they are part of the Northern Cities Shift
(NCS) for Northern Detroit Whites. // is described as backed and/or
lowered for Northern Whites (something like [tÇst] for “test”), and
/ae/ is raised ([bt] for “bat”) (Labov 1994; Wolfram and Schilling-
Estes 1998). Nasal and non-nasal environments are compared for the
latter vowel because, according to Bailey and Thomas (1998), /æ/-
raising occurs before nasals for African American groups generally and
is not part of the NCS. They also report that it began in the nineteenth
century in AAE, when most African Americans lived in the South.
These researchers do not discuss the phonetic factors that condition
this change. For //, only pre-obstruent tokens were analyzed.
Participants in this phase of the pilot study include: (i) 2
first-generation and 3 second-/third-generation Appalachian White
Southern migrant women, (ii) 2 first-generation and 3 second/
third-generation African American Southern migrant women, and
(iii) 5 Northern White women (for purposes of comparison). All 15
participants reside in inner Detroit or in its adjacent suburbs. The first-
generation speakers are both in their seventies. The second-/third-
generation speakers and the Northern White women are in the age
range of 30–55 years.
The Praat program was again used for the acoustic analysis. Acoustic
measurements of 5–10 tokens of // and /æ/ for each speaker were
taken from casual conversation for the first 3 formants and vowel
duration. Formant measurements were taken from fast Fourier trans-
form (FFT) spectra centered at vowel midpoint of each vowel token
using a 25-ms Gaussian window and were corroborated by 10-pole
linear predictive coding (LPC) spectra (autocorrelation). Normaliza-
tion of formant values is a controversial procedure (Johnson 1989)
that arguably allows one to compare the vowel qualities of speakers
with substantially differently sized vocal tracts, particularly men
versus women and adults versus children. Because all the speakers
discussed here are adult women, normalization was not deemed
necessary, so Figures 4.3–4.7 give unnormalized formant values in
Hertz.
Figure 4.3 gives the patterning of // for thee speaker groups and
shows that the Northern Whites cluster toward the bottom right of
the vowel space, indicating that their // is generally lower and back
relative to that of the Appalachians and African Americans. Figure 4.4
shows the patterning of pre-oral /æ/. The Northern White participants
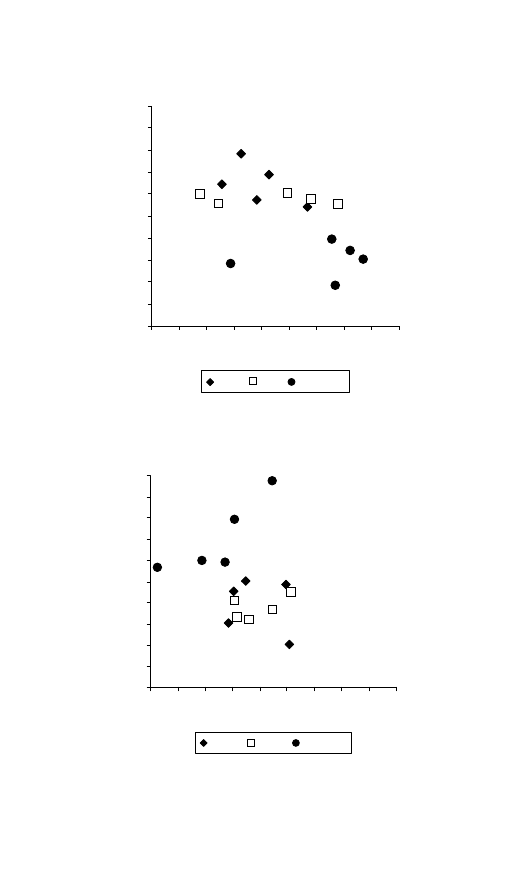
November 2007
MAC/MAL
Page-41
9780230_008861_05_cha04
41
400
450
500
550
600
650
700
750
800
850
900
1500
1600
1700
1800
1900
2000
2100
2200
2300
2400
F
2
F
1
AA
AP
N. White
Figure 4.3
The patterning of // for three speaker groups. F
1
and F
2
averages
are given in Hz. Each symbol represents the average F
1
/F
2
values for each of
the five speakers of that group
400
450
500
550
600
650
700
750
800
850
900
1500
1600
1700
1800
1900
2000
2100
2200
2300
2400
F
2
F
1
AA
AP
N. White
Figure 4.4
The patterning of pre-oral /æ/ for three speaker groups. F
1
and F
2
averages are given in Hz. Each symbol represents the average F
1
/F
2
values for
each of the five speakers of that group
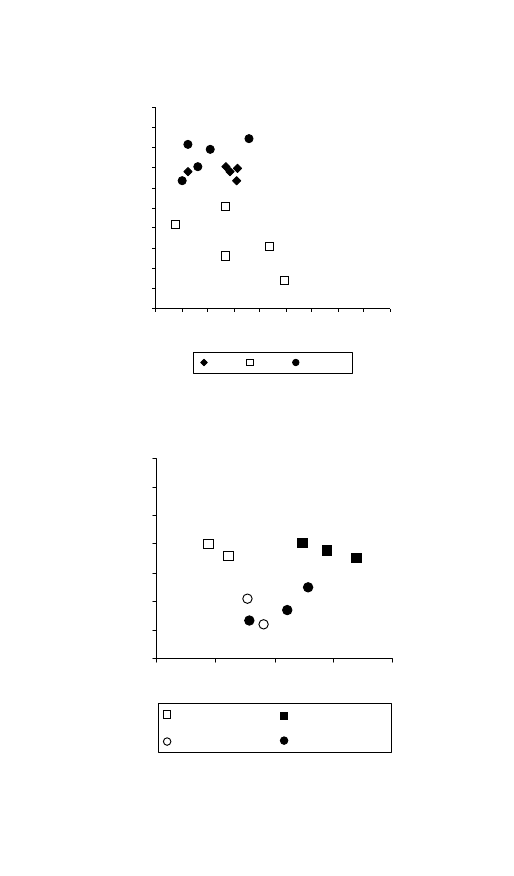
November 2007
MAC/MAL
Page-42
9780230_008861_05_cha04
42
400
450
500
550
600
650
700
750
800
850
900
1500
1600
1700
1800
1900
2000
2100
2200
2300
2400
F
2
F
1
AA
AP
N. White
Figure 4.5
The patterning of pre-nasal /æ/ for three speaker groups. F
1
and F
2
averages are given in Hz. Each symbol represents the average F
1
/F
2
values for
each of the five speakers of that group
450
500
550
600
650
700
750
800
1600
1800
2000
2200
2400
F
2
F
1
/
E
/: 1st gen
/
E
/: 2nd
/3rd
/æ [-nas]
/: 1st gen
/æ [-nas]
/: 2nd/3rd
Figure 4.6
Detroit Appalachian // and pre-oral /æ/ by generation. F
1
and F
2
averages are given in Hz. Each symbol represents the average F
1
/F
2
values for
each of the five speakers of that group
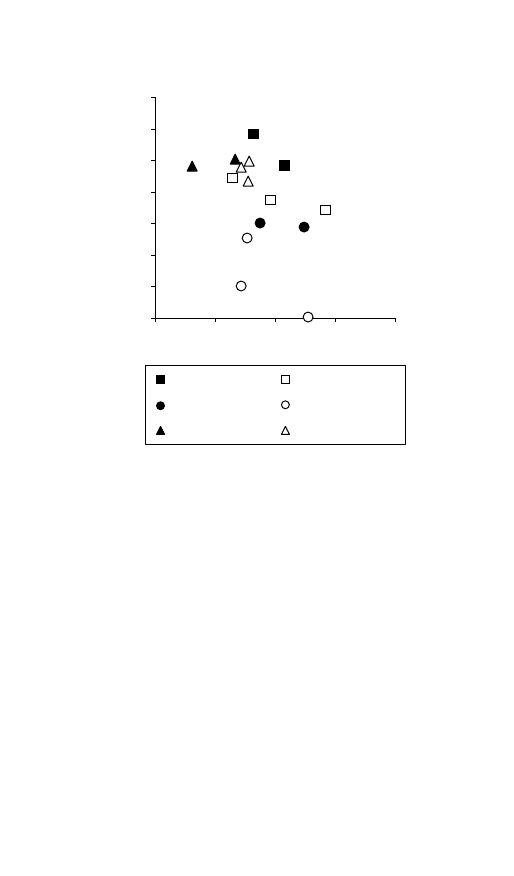
November 2007
MAC/MAL
Page-43
9780230_008861_05_cha04
The Pilot Study
43
450
500
550
600
650
700
750
800
1600
1800
2000
2200
2400
F
2
F
1
/
E
/: 1st gen
/
E
/: 2nd/3rd
/æ [-nas]
/: 2nd/3rd
/æ [-nas]
/: 1st gen
/æ [+nas]
/: 1st gen
/æ [+nas]
/: 2nd/3rd
Figure 4.7
Detroit African American //, pre-oral /æ/, and pre-nasal /æ/ by
generation. F
1
and F
2
averages are given in Hz. Each symbol represents the
average F
1
/F
2
values for each of the five speakers of that group
have raised /æ/. Comparisons with Figure 4.3 indicate that these
speakers’ /æ/ (measured at midpoint) is higher and more fronted in
the vowel space than their //. African American and Appalachian
White migrant groups do not show this pattern. Pre-nasal /æ/ is
shown in Figure 4.5. Here we see that the African American parti-
cipants do show raising of pre-nasal /æ/. They cluster directly below
the Northern Whites. The Appalachian Whites do not show this
pattern of raising of /æ/.
Figure 4.6 gives the F
1
/F
2
results for Detroit Appalachian //
and /æ/ by generation. First-generation and second-/third-generation
speakers do not show differences in raising, though the first-
generation speakers generally use more fronted realizations of both
vowel qualities. Figure 4.7 is a similar display of the data for the
African American participants. The first-generation speakers tend to

November 2007
MAC/MAL
Page-44
9780230_008861_05_cha04
44
Migration, Accommodation and Language Change
have lower F
1
values than the second-/third-generation speakers, and
pre-nasal /æ/ is higher in the vowel space than pre-oral /æ/.
Table 4.3 summarizes the vowel patterns by generation and speaker
group. Tables 4.4, 4.5, and 4.6, provided here for reference, show the
Table 4.3
Summary of vowel patterns by generation and speaker group
Lowered or
backed //
Raised
pre-oral /æ/
Raised
pre-nasal /æ/
1st gen. AP migrant
No
No
No
2nd/3rd gen. AP migrant
No
No
No
1st gen. AA migrant
No
No
Yes
2nd/3rd gen. AA migrant
No
No
Yes
NORTHERN WHITE
Yes
Yes
Yes
Table 4.4
Individual and group averages (in Hz) for F
1
and F
2
values for //.
Standard deviations are shown in parenthesis
Speaker
F
1
F
2
Midpoint
Offset
Midpoint
Offset
AA1
629 (81)
625 (74)
1832 (131)
1726 (132)
AA2
578 (97)
570 (110)
2144 (206)
2098 (245)
AA3
509 (81)
519 (108)
2787 (202)
2069 (194)
AA4
557 (97)
565 (91)
1971 (241)
1855 (165)
AA5
614 (78)
599 (55)
2017 (243)
1930 (215)
AA group
577 (48)
576 (40)
2150 (373)
1936 (154)
AP1
611 (54)
602 (67)
1820 (148)
1793 (192)
AP2
621 (76)
553 (113)
2155 (218)
2100 (288)
AP3
597 (57)
582 (49)
1905 (145)
1924 (186)
AP4
599 (57)
631 (60)
2224 (157)
1927 (237)
AP5
624 (82)
617 (92)
1723 (135)
1707 (130)
AP group
610 (12)
597 (31)
1965 (216)
1890 (150)
MW1
758 (34)
791 (59)
2112 (179)
1960 (235)
MW2
703 (49)
664 (54)
1743 (141)
1772 (123)
MW3
748 (20)
643 (81)
1630 (253)
1622 (222)
MW4
729 (49)
696 (48)
1677 (190)
1695 (109)
MW5
807 (58)
751 (119)
1733 (193)
1658 (76)
MW group
749 (39)
709 (62)
1779 (192)
1941 (134)

November 2007
MAC/MAL
Page-45
9780230_008861_05_cha04
The Pilot Study
45
Table 4.5
Individual and group averages (in Hz) for F
1
and F
2
values for
pre-oral /æ/. Standard deviations are shown in parenthesis
Speaker
F
1
F
2
Midpoint
Offset
Midpoint
Offset
AA1
798 (79)
716 (143)
1891 (129)
1893 (177)
AA2
749 (133)
686 (126)
2114 (177)
2096 (164)
AA3
649 (95)
510 (113)
2051 (179)
1989 (221)
AA4
656 (80)
621 (57)
1904 (178)
2091 (233)
AA5
674 (82)
644 (78)
2095 (104)
2071 (164)
AA group
682 (46)
635 (79)
2011 (106)
2028 (87)
AP1
676 (96)
606 (61)
1885 (145)
1822 (143)
AP2
740 (113)
653 (103)
2763 (167)
2064 (261)
AP3
733 (86)
722 (77)
2084 (144)
2037 (153)
AP4
695 (49)
689 (64)
2093 (153)
2154 (153)
AP5
715 (57)
715 (58)
1955 (223)
1911 (223)
AP group
712 (27)
677 (48)
2156 (351)
1998 (131)
MW1
616 (46)
602 (51)
2374 (123)
2245 (354)
MW2
504 (141)
574 (146)
2093 (270)
1853 (335)
MW3
601 (52)
588 (61)
2213 (125)
2085 (112)
MW4
411 (123)
478 (149)
1955 (273)
1779 (244)
MW5
604 (47)
574 (49)
2127 (218)
1944 (127)
MW group
547 (88)
563 (49)
2152 (155)
1981 (186)
individual and group F
1
and F
2
averages. Recall from above that each
average per speaker is based on 10–15 tokens.
Lowering of // and raising of /æ/ were selected primarily as features
diagnostic of the Northern Cities Shift. However, raising of /æ/ in
nasal environments specifically is a feature reported for contem-
porary AAE (Bailey and Thomas 1998) rather than a feature of NCS.
Unsurprisingly, the five White Northerners follow the expected NCS
pattern. All African American speakers also show a pattern of raising
of /æ/ in nasal environments, but again, consistent with the find-
ings of Labov (1994), Wolfram and Schilling-Estes (1998), and others,
these speakers do not participate in other // and /æ/ patterns char-
acteristic of the NCS. Nor do the Appalachian speakers show any
sign of NCS participation with respect to these vowels. Their // and
/æ/ patterns converge with those of the African Americans, but the

November 2007
MAC/MAL
Page-46
9780230_008861_05_cha04
46
Migration, Accommodation and Language Change
Table 4.6
Individual and group averages (in Hz) for F
1
and F
2
values for
pre-nasal /æ/. Standard deviations are shown in parenthesis
Speaker
F
1
F
2
Midpoint
Offset
Midpoint
Offset
AA1
551 (116)
543 (125)
2087 (162)
2009 (334)
AA2
582 (83)
555 (75)
2091 (307)
2095 (354)
AA3
548 (115)
514 (121)
2132 (155)
2067 (207)
AA4
559 (83)
561 (61)
2277 (123)
2015 (193)
AA5
561 (101)
530 (119)
2115 (253)
1967 (236)
AA group
560 (13)
541 (19)
2140 (79)
2031 (51)
AP1
830 (144)
746 (62)
1906 (99)
1753 (50)
AP2
738 (42)
744 (47)
2013 (191)
1958 (124)
AP3
692 (30)
672 (26)
2324 (104)
2254 (149)
AP4
768 (6)
791 (14)
2133 (69)
2094 (437)
AP5
646 (75)
700 (49)
2134 (224)
1810 (150)
AP group
735 (71)
731 (46)
2102 (156)
1974 (205)
MW1
548 (150)
469 (163)
2239 (130)
2172 (75)
MW2
478 (257)
475 (250)
2042 (238)
2100 (153)
MW3
583 (49)
577 (29)
2299 (210)
1998 (166)
MW4
504 (118)
487 (147)
2191 (264)
1910 (231)
MW5
493 (71)
520 (85)
2276 (242)
1987 (153)
MW group
521 (43)
506 (45)
2209 (102)
2033 (103)
African Americans remain distinct from both Appalachian and White
Northern groups with respect to their patterns of raising /æ/ in pre-
nasal environments, thus indexing a linguistic boundary.
These data supplement the work on /ai/ reported above. Taken
together, these pilot findings suggest that there are ongoing changes
in the Detroit African American community which have the effect
of distinguishing AAE speakers from White Northern speakers, but
aligning them with speakers of some Southern varieties of English
including the varieties spoken by Appalachian migrants to Detroit.
The changes in question, which appear to have taken place over the
last 40 years or so in the period since Wolfram carried out his work in
Detroit, are (i) the fronting of the high and lower-high back vowels
and (ii) the glide-weakening of /ai/ before voiceless obstruents.

November 2007
MAC/MAL
Page-47
9780230_008861_06_cha05
5
Field Techniques and Acoustic
Methods
This chapter describes the data collection and acoustic analysis, and
the balance I have struck between sociolinguistic and phonetic types
of methods. Whereas sociolinguists generally collect and analyze
tokens taken from the spontaneous speech (or, sometimes, word-
lists or reading passages) of many speakers, phoneticians typically
collect more data from fewer speakers in a tightly controlled labor-
atory setting. Laboratory phoneticians often control for linguistic
context and therefore do not use spontaneous speech. In this
study, I followed the sociolinguistic practice of using spontaneous
conversation collected in the field, but I obtained and analyzed as
many tokens as possible across a range of phonetic contexts in an
attempt to achieve a balanced corpus of tokens for the acoustic
analysis. Section 5.1 provides an overview of sociolinguistic methods,
including speaker selection, data collection, and data analysis. Section
5.2 describes the field methods used in this project, and Section 5.3
describes the methods for the acoustic analysis.
5.1 Study design
5.1.1 Speaker selection
The approach to speaker selection is a judgment sample which used
a “snowball” technique. L. Milroy (1987a) describes the judgment
sample as a procedure for which the researcher identifies partic-
ular types of speakers (based on demographic factors, for example)
while planning a study and then attempts to locate and record such
47

November 2007
MAC/MAL
Page-48
9780230_008861_06_cha05
48
Migration, Accommodation and Language Change
speakers during the fieldwork phase of the study. Citing Wolfram
(1969, 1974) and Milroy (1987b), she points out that relatively small
judgment samples have yielded robust results for large-scale urban
studies. Labov (1994, 2001), for example, used a judgment sample
for his study of Philadelphia. Judgment samples have also been used
successfully in studies of rural areas in North Carolina by Wolfram
and his associates (e.g. Wolfram and Thomas 2002). Chambers (1995)
describes random samples as impractical and comments that there
seems to be consensus in the field that judgment samples are adequate
for sociolinguistic studies.
Milroy and Gordon describe the snowball, or friend-of-a-friend,
technique: “the researcher simply asks the subject to recommend
other people who might be willing to participate in the study” (2003:
32). These researchers also note that an advantage of this technique
is that it reduces the occurrence of the interviewer being rejected
by potential participants. For this study, I asked participants (at the
end of the interviews) if they could recommend other friends or
family members who would be willing to help with the project. These
leads were then followed up by my contacting these individuals,
telling them about the project, and naming the other participant who
recommended them. This technique was very successful in garnering
interviews.
In addition to adopting and refining an approach to speaker selec-
tion, a researcher also has to determine how many speakers are
needed. Although a larger number of speakers can lead to more robust
results than a study with fewer speakers, there is a danger of doing a
shallow analysis of many speakers. When looking at detailed phon-
etic data, more robust results may be obtained by analyzing many
tokens over a range of phonetic contexts for a small number of speakers
than by examining, for example, 5–10 tokens for a large number of
speakers. Gordon (1997: 80) discusses the dilemma that sociophon-
etic researchers face as they design studies. He describes a “breadth–
depth continuum”; at one end lie studies that involve a large number of
participants or research sites but a small amount of data/tokens; at the
other end lie studies that provide a thorough and detailed account of
fewer participants or research sites. The approach I take, which is closer
to the latter, is described in Section 5.1.3. The next section describes
the fieldwork technique of participant observation and discusses
some of the characteristics of ethnography.

November 2007
MAC/MAL
Page-49
9780230_008861_06_cha05
Field Techniques and Acoustic Methods
49
5.1.2 Participant observation and ethnography
The friend-of-a-friend method used here for the data collection has
been used successfully by Milroy (1987b) and Wolfram and his asso-
ciates, among others. It is ethnographic in nature and involves parti-
cipant observation. The benefit of this approach is that it allows the
researcher to minimize the observer effect. A participant observer has
some sort of tie to the relevant community, and a key principle of
this approach to fieldwork, and interviewing in particular, is to allow
the “interviewees” to initiate topics and control the direction of the
conversation. I tried to obtain demographic information in the inter-
views that I conducted, but I did not use a pre-determined set of ques-
tions. I attempted to let the participants direct the conversation as
much as possible. Participant observation is time-consuming because
it requires the researcher to establish personal ties in the community
which must be cultivated (Eckert 2000; Milroy and Gordon 2003).
One must visit and participate in community get-togethers, build
and maintain friendships, and engage in other time-intensive activ-
ities. Milroy and Gordon describe an important benefit of participant
observation; it “ works well in small, well-delineated communities
where suspicions about outsiders might inhibit other approaches to
data collection” (2003: 70). For this study, the benefits of participant
observation outweighed the limitations.
Studies which utilize participant observation often take an ethno-
graphic approach (Eckert 2000, for example). One potential benefit
of using an ethnographic approach is the possibility for the research
to yield evidence of “local” categories, which eliminates the need to
rely on preconceived and, often, controversial non-local categories
such as social class (see Eckert 2000 for further discussion). As Eckert
(2000: xiv) points out, the fundamental principle of ethnography is to
“discover rather than impose.” She highlights the need for researchers
to discover and interpret relevant participant (i.e. local) categories,
which requires consideration of practices which are meaningful to
particular communities or groups. Eckert comments specifically on
the main difference between approaches to fieldwork which utilize
surveys with more ethnographic approaches: “ while survey field-
work focuses on filling in a sample, ethnographic fieldwork focuses
on finding out what is worth sampling” (2000: 69). One local category
that emerged early in the fieldwork for this study was “Southern.”

November 2007
MAC/MAL
Page-50
9780230_008861_06_cha05
50
Migration, Accommodation and Language Change
Many migrant participants, both White and Black as well as Southern-
born (first generation) and Detroit-born (second/third generation),
identified themselves as “Southern,” and I observed a wide range of
Southern cultural practices. As we shall see in Chapter 8, I argue that
an enduring Southern regional identity for both the African Amer-
ican and the White migrant groups plays an important role in the
vowel patterns analyzed in this study.
5.1.3 Data analysis
L. Milroy discusses an assumption that many sociolinguistic studies
embody concerning variants of a variable, namely that they “ lie
on a single phonetic continuum that corresponds to a social
continuum” (1987a: 118). One problem with this type of analysis
is that important information may be lost, especially for multidi-
mensional and interacting factors. For example, acoustic properties
such as formant frequencies are determined by overlapping articu-
latory movements. Second, many variationist studies do not attend
to phonetic detail (but see a collection of papers edited by Foulkes
and Docherty 1999 as well as Beckford 1999 and Thomas 1995, 2001),
but instead use exclusively impressionistic approaches. Fine-grained
phonetic detail is important to consider in investigations of phon-
ological change because it can yield information about changes at
stages between actuation and complete or nearly complete change, as
suggested by J. Milroy (1992). More specifically, acoustic analysis can
account for gradient variants that impressionistic coding may miss.
The process of gradual linguistic change can only be understood
by examining frequencies of use of forms that vary across continual
phonetic dimensions. This type of modeling thus requires gradient,
not binary, observations. In the early and middle stages of sound
change, phonetic variants of a variable may be in competition (Milroy
1992). For example, the data reported in Anderson (2001) show two
competing phonetic forms for word final /d/ in Detroit AAE: [=] (with
no oral closure) and [=d] (with oral closure). These variants appear
to be alternate realizations in Detroit AAE, and a fully glottal variant
may be replacing the canonical supralaryngeal realization of /d/ in
this dialect. In these cases, consideration of the phonetic details of
the glottalization process is necessary in order to uncover the detailed
information needed to trace a subtle shift from one stage of change
to another. And it is these understudied stages that may provide new

November 2007
MAC/MAL
Page-51
9780230_008861_06_cha05
Field Techniques and Acoustic Methods
51
insight into the actuation of sound change and its early progress in
establishing a new variant.
Impressionistic reports can also be influenced by categorical percep-
tion (e.g. Repp 1982) and a failure to use the appropriate phonetic
transcription. For example, it is not always possible to determine
impressionistically whether a word-final voiceless stop such as /t/
is released or not (see further Foulkes and Docherty 1999). Such
features are important to consider, for example, in discussions of
complex phonological processes such as lenition. Instrumental phon-
etic research is crucial to testing the generalizations based on impres-
sionistic studies of language variation.
It is especially important to take a gradient approach in the treat-
ment of socially salient /ai/, one of the most socially meaningful
vowels of American English (Wolfram and Schilling-Estes 1998), and
glide-reduced variants are iconic markers of Southern and African
American varieties. As Thomas (1995, 2001) observes, the duration
of the glide varies considerably between fully diphthongal vari-
ants, nuclei with short offglides, and completely monophthongal
variants. Categorizing tokens of /ai/ as strictly monophthongal or
diphthongal may be misleading because it potentially eliminates
important information about the duration and direction of the glide.
It is for these reasons that I take a gradient approach for the analysis
of the vowels in this study. The next section discusses approaches to
data analysis in sociolinguistics.
5.1.4 Individual first versus community first
I take as a starting point the in-depth analysis of a small number
of speakers, rather than a more superficial analysis (acoustically
speaking) of many speakers. Examining individual speakers in detail
will contribute to a growing movement toward what has been termed
a “sociolinguistics of speakers” (Milroy 1992: 164–165; Johnstone
2000). As J. Milroy (1992) points out, the chief focus of Labovian
sociolinguistics is not so much speakers but systems. Labov (2001:
33–34) argues against granting individual speakers a special place in
sociolinguistic analysis:
The behavior of the individual speaker cannot be understood
until the sociolinguistic pattern of the community as a whole
is delineated The concept of the speech community and not

November 2007
MAC/MAL
Page-52
9780230_008861_06_cha05
52
Migration, Accommodation and Language Change
the idiolect is the primary object of linguistic investigation The
individual speaker can only be understood as the intersection
of the linguistic patterns of all the social groups and categories
that define that individual. Linguistic analysis cannot recognize
individual phonologies The individual does not exist as a
linguistic object.
Taking a different view of the relevance of individual speakers to
linguistic research, Johnstone (2000: 420) argues that the linguistics
of language cannot achieve explanatory adequacy without a
linguistics of individual speakers. She points out that “ variationist
sociolinguistics (typically treats) individuals (as) operational-
ized bundles of demographic facts, and an individual‘s linguistic
behavior is seen as determined by these facts Correlation is
treated as if it were causation. ” (414).
Recognizing the relevance of “individual phonologies” does not
negate the importance of speech communities or preclude the vari-
ationist enterprise. Johnstone (2000) argues that traditional Labovian
sociolinguistic analysis of systems rather than speakers can only be
enriched by greater understanding of the linguistic behavior of indi-
viduals, especially if individuals use language variation as a resource
for expressing identity and if some changes originate in such expres-
sion. In other words,
Thinking about variation from the individual outward rather than
from the social inward means thinking about how individuals
create unique voices by selecting and combining the linguistic
resources available to them (417).
One can view speakers as repositories of social facts and “hosts to
particular phonological systems” (as characterized in Watt 1998), or
as agents who actively create and recreate identities and organize
their own social behavior (Eckert 2000, Johnstone 2000), continu-
ally making sociolinguistic choices during speech production. While
acknowledging the vital importance of large-scale studies of speech
communities, the methodology in this study aims to supple-
ment these more traditional approaches by employing a bottom-
up approach that carefully describes particular cases, namely the

November 2007
MAC/MAL
Page-53
9780230_008861_06_cha05
Field Techniques and Acoustic Methods
53
phonetic behavior of specific individuals. The next section describes
the field methods.
5.2 Field methodology
5.2.1 Participants
The pilot study discussed in Chapter 4 revealed the African Amer-
ican and Appalachian White Southern migrant communities to be
self-defined groups that maintain clear boundaries from Midwestern
Whites. Building on these results, this study examines targeted
portions of the vowel systems of 12 first- and second-/third-
generation Appalachian White and African American migrant
women.
As discussed in Section 5.1.1, selection of participants combined
the friend-of-a-friend method and the judgment sample. Participants
were categorized as first generation if they moved to the Detroit
area from the South after the age of 18. Second-/third-generation
speakers were either born and raised in Michigan or moved with their
parents when they were less than five years old. Second- and third-
generation migrants are not differentiated because what is crucial
is that speakers in both groups attended school in Michigan and
were exposed to Midwestern speech patterns in school and during
local activities. In contrast, first-generation speakers moved from the
South to relocate to the Detroit area after their dialect patterns were
presumably already established. Although adults can and sometimes
do adopt some phonetic features of a second dialect after migration
(e.g. Munro et al. 1999), first-generation speakers presumably had
well-established phonetic and phonological norms at the time of
their move to Detroit (Chambers 1992).
Demographic information for participants is given in Table 5.1.
The “core” sample consists of five second-/third-generation women
from each of the Appalachian White and African American groups.
For purposes of comparison, the core sample is supplemented by data
gathered from one first-generation speaker from the African Amer-
ican group and one from the Appalachian White group, as well as
one Midwestern White woman. The central comparison in this study
is between the African American and Appalachian White Southern
migrant groups. The role of the Midwestern White participant is

November 2007
MAC/MAL
Page-54
9780230_008861_06_cha05
54
Migration, Accommodation and Language Change
Table 5.1
Speaker sample for the acoustic study
Speaker
Ethnicity
Year
of
birth
Generation
Group (G),
Individual
(I), or
Dyad (D)
Fieldworker
1
AA
1927
1
D
BA, TD
2
AA
1936
2
I
BA, SF
3
AA
1971
3
D
BA
4
AA
1974
3
D
BA
5
AA
1974
3
G
BA
6
AA
1967
3
I
BA
African American participants N
= 6
7
AP
1931
1
I
BA
8
AP
1960
2
I
SF
9
AP
1951
2
D
BA
10
AP
1949
2
I
BA, MA
11
AP
1936
2
I
BA
12
AP
1965
3
D
BA
Appalachian White participants N
= 6
13
MW WHITE
1967
N/A
G
SF
Midwestern White participants N
= 1
Total participants N
= 13
AA
= African American; AP = Appalachian White; MW White = Midwestern White;
BA
= Myself; MA = White Male fieldworker; SF = White Female fieldworker; TD = African
American female fieldworker.
simply to establish a basis of comparison for the analysis of individual
speakers; the Hillenbrand et al. (1995) study is also used this way (see
Section 5.4). The ambient Midwestern White dialect is quite different
(see further Eckert 1988, 1989, 1991, 1996, 2000, 2001) from the
AAE and Appalachian White dialects, which are similar in important
respects (see further Edwards 1997; Hartigan 1999). African American
participants are Detroit residents. With the exception of Speaker 8,
the Appalachian White participants live in the inner suburbs. Speaker
13, a Midwestern White, also lives in an inner suburb. The fieldwork
sites were discussed in Chapter 3.

November 2007
MAC/MAL
Page-55
9780230_008861_06_cha05
Field Techniques and Acoustic Methods
55
5.2.2 Fieldwork and data collection
The fieldwork methods and data collection procedures used in the
pilot study were also used for the main study (see Section 4.1).
I carried out the fieldwork in the African American and Appalachian
communities, with two exceptions (see Table 5.1). Susan Frekko,
a graduate student in anthropology, conducted the fieldwork in
the Midwestern White community and interviewed one of the
Appalachian White participants. Tamika Davis, an African American
Detroit resident, participated in an interview I conducted with one of
the African American participants. Linguistics graduate student Mark
Arehart also participated in an interview with one of the Appalachian
White participants.
I began fieldwork in a Detroit West Side African American
community in the winter of 1999. I developed close ties with several
key participants and participated in a wide range of activities in
the community, such as family get-togethers, holidays, parties, and
meals. I engaged in relatively unstructured ethnographic observation
to obtain a general sense of relevant attitudes, norms, and commu-
nicative conventions. One of the first African American participants
introduced me to several of her friends and family that wanted
to participate in the study. When I set up interviews, I told parti-
cipants that I was interested in learning about the everyday lives of
Detroit residents and wanted to record conversations in Motown at
the turn of the century. The resultant conversations centered around
the topics of everyday life, changes in Detroit, family history, and
ties to the South. Fieldwork with African American participants was
concluded in Fall 2001.
Fieldwork with the Appalachian participants began in the winter
of 2001 and concluded in the spring of 2002. My initial contacts
with this community were made through letters to the editors of
newspapers in the Smoky Mountains of North Carolina, where I grew
up. I asked readers to contact me or members of my family (who
still reside in the Smokies) if they had relatives in the Detroit
area. This contact information easily led to interviews with the
Appalachian participants, a process that was doubtless facilitated
by my Appalachian (specifically Smoky Mountain) origins. Like the
African American participants, I told these participants that I was
interested in the everyday lives of Southern migrants in Detroit and

November 2007
MAC/MAL
Page-56
9780230_008861_06_cha05
56
Migration, Accommodation and Language Change
wanted to record conversations in Motown at the beginning of a
new century. All the Appalachian participants self identified as being
from the Smoky Mountains of Western North Carolina (even if it
was in fact their parents or grandparents who migrated) except for
one participant (8), whose parents migrated from rural West Virginia,
interviewed by Susan Frekko. The topics in the Frekko interview were
similar to the topics that came up in the interviews that I conducted
(see below).
Table 5.1 shows that third parties were present in some of the inter-
views. The husbands of Speakers 1 and 3, who are also of Southern
origin, participated in the interviews with their wives. Speaker 5 was
interviewed along with two of her friends, who were also the descend-
ants of Southern migrants. Speaker 9’s mother, a Southern migrant,
participated in her interview. Speaker 12’s husband, a Midwest-
erner, participated in her interview; this is the only interview with a
Southern migrant that also included a Midwesterner. However, data
for Speaker 12 did not deviate in any significant way from that of the
other participants.
As noted above, although I tried to obtain demographic informa-
tion in the interviews that I conducted, I did not use a pre-determined
set of questions. I started interviews by asking participants to give
their years of birth. I then asked when their families moved up
from the South. At this point in the interview, participants were
encouraged to direct the conversation as much as possible. All the
Southern migrant participants, both White and African American,
described their families’ migration histories as well as the difficulties
they encountered in Detroit. Each participant described culturally
important activities such as extended visits down South, family
reunions, differences and similarities between the South and Detroit,
and preparation and enjoyment of Southern food. In short, each of
the participants expressed cultural orientations to and a regional affil-
iation with the South, even if she was Detroit-born; these cultural
orientations will be described in Chapter 7.
Each participant described her work during the interview. Speakers
1, 8, and 9 are housewives. Speaker 2 is a retired gerontologist.
Speakers 4 and 5 are college students, and Speaker 5 also works part-
time in an automobile factory. Speaker 6 is an ad representative at a
Christian radio station. Speakers 7 and 10 are retired factory workers.
Speaker 9 is a factory worker who was laid off at the time of the inter-

November 2007
MAC/MAL
Page-57
9780230_008861_06_cha05
Field Techniques and Acoustic Methods
57
view. Speaker 13, the Midwestern White participant, is a secretary.
All the speakers except for the college students own their homes.
In addition to the college students, Speaker 2 has an undergraduate
degree from Wayne State University. However, her vowel patterns
are very similar to those of the other older African American speaker
(Speaker 1).
It is important to note that none of the speakers’ vowel data
departed from group norms in any significant way. For the analysis
of /u/ and /S/, both Black and White Southern migrant participants
show strikingly similar patterns of fronting. Even age was not statist-
ically significant for fronting (see further Chapter 6).
For /ai/, the two older African American speakers show the tradi-
tional pattern for /ai/ described in the literature as typical of
African American systems. The younger African American speakers
also showed striking similarities for patterning of /ai/. They, along
with the Appalachian White speakers, show glide-weakening in the
progressive pre-voiceless context (see further Chapter 7). In other
words, the data do not suggest that any of the speakers deviate from
group norms for the variables in this study. To the contrary, there is
relative uniformity across the data set, even across ethnic lines, for
these Southern migrant participants.
5.2.3 Recording procedures
Interviews were audio-recorded using a Sony portable minidisk
recorder (model MZ-R30) and a Sony microphone (model ECM-
MS957). Care was taken in all the interviews to ensure the best
acoustic environment possible under the circumstances; for example,
fans were shut off, kitchens avoided, and carpeted rooms used if
available.
5.3 Acoustic analysis
The recordings were digitized at a sampling rate of 22 kHz and lowpass
filtered at 11 kHz. As in the pilot study, the Praat program was used for
the acoustic analysis. I extracted a subset of the stressed vowel tokens
from 60 minutes of casual conversation for each participant. Sections
5.3.1 and 5.3.2 describe the two types of acoustic measures used
in this study. Vowels before consonants which triggered substantial

November 2007
MAC/MAL
Page-58
9780230_008861_06_cha05
58
Migration, Accommodation and Language Change
coarticulatory effects, specifically nasals, /l/ and /Ã/, were excluded in
order to reduce the size of the data set and simplify the analysis.
5.3.1 Temporal locations and measures
Measurements were taken at two temporal locations in each vowel
centered at vowel midpoint and 25 ms from the vowel offset.
Figure 5.1 shows an example of manual placement of markers for
vowel onset, midpoint, and offset. Vowel onset and offset were
based on waveform displays, with vowel onset identified as the first
recognizable quasiperiodic pitch pulse of the vowel and offset as
the last recognizable quasiperiodic pitch pulse of the vowel (at the
zero crossings).
5.3.2 Spectral measures
In addition to vowel duration measures, frequency measures for the
first, second, and third formants (F
1
, F
2
, F
3
) were taken for each vowel.
Formant measurements were taken from FFT spectra, using a 0.025-s
Gaussian window for analysis. I chose FFT analysis with a relatively
wide window size because it provided a clear “snapshot” (Johnson
2003) of the formant frequencies. Measurements were taken by posi-
tioning cursors at the center of the highest amplitude harmonic
excited by a given formant. Figure 5.2 shows an FFT spectrum of /G/
midpoint with the first three formants marked by arrows.
off
on
mp
Figure 5.1
Locations of vowel onset (on), midpoint (mp) and offset (off) in
the word “teach” produced by Speaker 6
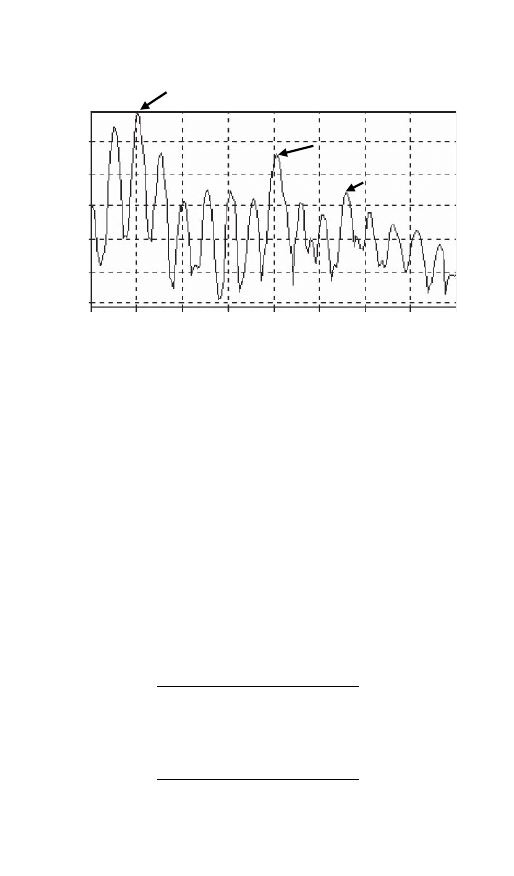
November 2007
MAC/MAL
Page-59
9780230_008861_06_cha05
Field Techniques and Acoustic Methods
59
80
90
100
110
70
60
Sound pressure le
vel (dB/Hz)
Frequency (Hz)
0
500
1000
1500
2000
2500
4000
3000
3500
Figure 5.2
FFT spectrum centered at the midpoint of the vowel in [K
h
G
ds]
“kids” (Speaker 6). Locations of the first three formants, which are measured
in Hz, are marked with arrows
5.4 Spectral comparisons
This study analyzes /i G u S o ? ai/ for the speakers listed in
Table 5.1. I am primarily interested not in absolute formant frequen-
cies, but rather in relative formant values of (potentially) spectrally
similar vowels, in view of possible fronting of /u/ and /S/ and glide-
weakening of /ai/. Table 5.2 gives the average number of tokens
per speaker and the average number of tokens per vowel, per phon-
etic environment, per speaker. The large standard deviations can be
attributed to a number of factors. Tokens were taken for each speaker
Table 5.2
Total number of tokens
per vowel pair
Tokens of ai/
?
1729
Tokens of I/
S
1569
Tokens of i/u
1664
Tokens of o
897
Total
5859

November 2007
MAC/MAL
Page-60
9780230_008861_06_cha05
60
Migration, Accommodation and Language Change
from one hour of conversation. However, some speakers were inter-
viewed alone while others were interviewed as part of a dyad or small
group (see Section 5.3). Therefore some speakers yielded more tokens
than others. There was also variation in the number of tokens per
phonetic environment, which was due to the unpredictable nature
of spontaneous conversation. Even when topics of conversation are
similar, there are often differences for the occurrences of particular
lexical items and token types. For example, some vowels (such as
/S/) occur less commonly than other vowels (such as /G/). While one
speaker may use the word “book” and “took” five times each, another
may produce much fewer tokens of pre-velar /S/.
Measurements were taken at two temporal locations, described
above, for each of the 5859 vowel tokens. No more than five instances
per speaker of any given lexical item were included in the analysis.
The analysis of /u/ and /S/ focuses on the F
2
distances between
/u/ and /S/ and /i/ and /G/, respectively. All four vowels are typic-
ally classified in the high region: /u/ and /i/ as high and /S/ and /G/
as lower-high. Members of the vowel pairs /u/–/i/ and /S/–/G/ differ
little in F
1
, which correlates primarily with vowel height. However,
members of these pairs differ in F
2
. Front-back tongue body position
affects F
2
, as does lip rounding (particularly for back vowels) (Stevens
1998: 273). Vowels that are more front and less rounded have relat-
ively high F
2
frequencies and small F
2
–F
3
separation. Vowels that are
rounded and back have relatively low F
2
frequencies and a large F
2
–F
3
separation.
Fronting of /u/ and /S/ was quantified for each speaker by calcu-
lating the difference between the average F
2
values of /u/ and /S/ and
their front counterparts /i/ and /G/ (see further Anderson 2003). Using
the average distance between front and back counterparts, rather than
the absolute F
2
measure of the back vowels, allows for cross-speaker
comparisons. If a hypothetical Speaker A has a significantly smaller
F
2
distance between /i/ and /u/ than Speaker B, then Speaker A can
be said to have a more fronted /u/. Note that this measure does not
categorize Speaker A’s /u/ as “front” and Speaker B’s as “back.” It is
strictly a relative measure that allows one to describe the vowels as
more or less front. The comparison assumes that /i/ and /G/ are both
stable front vowels. Otherwise, the shorter distance could indicate
backing of /i/ or a combination of /i/ backing and /u/ fronting. Since
all speakers are women, it is assumed that their overall F
1
/F
2
spaces

November 2007
MAC/MAL
Page-61
9780230_008861_06_cha05
Field Techniques and Acoustic Methods
61
Table 5.3
Tokens of /
S
/ and /
G
/ per speaker and per following environment
Speaker
/
S
/ alv
/
S
/ velar
/
G
/ alv
/
G
/ velar
Total
1
8
11
58
18
95
2
25
6
69
30
130
3
17
10
72
23
122
4
25
5
88
35
153
5
28
9
93
20
150
6
30
13
61
27
131
7
27
13
74
25
139
8
21
6
70
28
125
9
30
12
84
32
158
10
25
13
99
31
168
11
17
10
58
14
99
12
15
10
44
30
99
268
118
870
313
1569
alv
= pre-alveolar; velar = pre-velar.
are comparably sized. However, it is important to note that the use
of distance measures renders normalization, which is highly contro-
versial (Johnson 1989), unnecessary.
For /u/, distances were calculated separately for three environ-
ments (pre-labial, pre-alveolar, and word-final) at midpoint and
offset. The pre-velar environment was not examined due to an insuf-
ficient number of tokens. Each speaker therefore has six different
/u/ fronting scores (three contexts and two temporal locations).
For /S/, there were only two environments, pre-alveolar and pre-
velar, resulting in four /S/ fronting scores (two contexts and two
temporal locations). Pre-labial /S/ was not examined due to too few
tokens, and word-final /S/ is phonotactically disallowed in English.
Table 5.3 gives the breakdown of tokens of /S/and/G/ by speaker
and following environment, and Table 5.4 gives these same figures
for /u/ and /i/.
Group comparisons of pre-alveolar tokens of /u/ and /S/produced
by the African American and Appalachian White groups are also made
with those reported for a reference group of 48 Midwestern White Kala-
mazoo women in the Hillenbrand et al. (1995) study. This group is
included to provide a benchmark rather than to serve as a third group;

November 2007
MAC/MAL
Page-62
9780230_008861_06_cha05
62
Migration, Accommodation and Language Change
Table 5.4
Tokens of /u/ and /i/ per speaker and per following environment
Speaker
/u/ alv
/u/ wb
/u/ lab
/i/ alv
/i/ wb
/i/ lab
Total
1
8
15
4
15
31
20
93
2
14
29
8
60
20
30
161
3
20
16
6
22
37
12
113
4
30
26
11
39
22
44
172
5
24
35
11
54
34
43
201
6
13
38
9
61
34
20
175
7
19
28
7
28
21
16
119
8
21
26
11
36
27
13
134
9
19
30
10
27
20
19
125
10
22
28
13
22
31
29
145
11
19
23
9
30
24
16
121
12
21
22
8
23
20
11
105
230
316
107
417
321
273
1664
alv
= alveolar; wb = pre-pausal or pre-word boundary; lab = pre − labial.
as noted in Section 5.2.1, the central comparisons in this study are
between Appalachian White and African American Southern migrant
participants because of the linguistic similarities between these two
groups that were revealed in the pilot study (see Chapter 4). Data
from Speaker 13 (the Detroit White) is used to examine contrasting
/ai/ realizations while the Hillenbrand et al. participants are used
to examine contrasting patterns of high and lower-high back vowel
fronting. Only pre-alveolar tokens were amenable to comparisons
between these two Southern migrant groups and the Kalamazoo
women because Hillenbrand et al. limited their measurements to this
environment (h_d) at midpoint. A limitation of this comparison is
that data for the Southern migrants comes from spontaneous conver-
sation while data from the Hillenbrand et al.’s study is taken from
word lists. In addition, Hillenbrand et al. screened participants by
recording a 5–7-minute conversation with one of the experimenters
which was later reviewed. Participants who showed “ any system-
atic departure from general American English” were not included in
the subsequent acoustic study. Thus, an important difference between
my study and the Hillenbrand et al.’s study is that I am interested in
“vernacular” rather than “Standard” (or mainstream) vowel produc-
tions. However, as noted above, the most important comparisons
for the purposes of this study are between the African American

November 2007
MAC/MAL
Page-63
9780230_008861_06_cha05
Field Techniques and Acoustic Methods
63
Table 5.5
Tokens of /ai/ and /
?
/ according to speaker and following
environment
Speaker
/ai/ vd
/ai/ vless
/
?
/ vd
/
?
/ vless
Total
1
31
39
18
9
108
2
53
68
36
42
229
3
24
40
17
7
96
4
33
56
46
21
166
5
33
38
49
36
176
6
45
30
26
17
132
7
28
29
22
23
112
8
22
23
36
21
116
9
23
33
24
15
121
10
54
23
29
25
159
11
17
21
20
21
98
12
21
19
20
18
98
13
43
22
26
12
118
427
441
369
267
1729
vd
= pre-voiced; vless = pre-voiceless; wb = pre-pausal or pre-word boundary.
and Appalachian White Southern migrant speakers. The Hillenbrand
et al. speakers are simply included as a non-fronting reference group.
Participants in the Hillenbrand et al. study read lists containing 12
vowels, including /u/, /i/, /S/, /G/, and /o/, and one token of each
vowel from each participant was analyzed in terms of F
1
, F
2
, and
F
3
measures taken at vowel midpoint. Despite the differences in the
study design for this study and the study design used in Hillenbrand
et al., the comparison is useful for showing the difference between
fronted and backed variants of /u/ and /S/. Chapter 6 shows that
while the Southern migrants show fronted variants of these back
vowels, the Hillenbrand et al. speakers do not.
The analysis of /ai/ quantifies diphthongization by comparing
F
1
and F
2
movement in /ai/, which exhibits varying degrees
of diphthongization, with F
1
and F
2
movement in /?/, which
is used as a reference because it is expected to show little,
if any, diphthongization. The differences between midpoint and
measurements taken 25 ms before the end of the offset in F
1
and
F
2
were calculated for /?/ and /ai/. The nature of the patterning
in terms of voicing context is examined because previous studies
have described strong contextual effects for monophthongization

November 2007
MAC/MAL
Page-64
9780230_008861_06_cha05
64
Migration, Accommodation and Language Change
and glide-weakening of /ai/ based on the voicing of the following
consonant (see Section 2.2 for a summary; see also Thomas 2001).
Data from the participants in the Hillenbrand et al. (1995) study
were not included in the group comparisons, as they were for the
analysis of /u/ and /S/, because /ai/ was not analyzed in that study.
However, data from Speaker 13, a Detroit Midwestern White woman,
is included in the discussion of individual speakers. Table 5.5 gives
the breakdown of /ai/ and /?/according to speaker and following
environment.

November 2007
MAC/MAL
Page-65
9780230_008861_07_cha06
6
The High and Lower-High Back
Vowels
This chapter reports the acoustic findings for /u/ and /S/, which are
examined in relation to the front vowels, /i/ and /G/. Fronting is
quantified by examining /u/
∼/i/ and /S/∼/G/ F
2
distances (see further
Section 5.4). Section 6.1 describes the fronting patterns of /u/ and
/S/ of the African American (AA) and Appalachian White (AP) groups
with attention to contextual effects. Section 6.2 analyzes the effects of
consonantal context, considering the interactions of context, Vowel
quality, vowel duration, and their effects on fronting. Section 6.3
discusses the combined effects of rounding and backing. Section 6.4
discusses Nguyen’s (2006) real-time analysis of /S/ by social status for
Detroit AAs. Section 6.5 presents the results of Nguyen and Anderson’s
(2006) comparisons of /u/ fronting among AA and Midwestern White
speakers in the Detroit area. The chapter concludes with a summary and
emphasizes the importance of considering the role of phonetic context
when examining vowel changes in American English.
Systematic analysis of context reveals patterns that would not
otherwise be evident. Specifically, analysis of contexts which should
(and should not) trigger fronting based on coarticulatory effects from
following consonantal contexts reveals a pattern which demonstrates
the need to consider the role of contextual conditioning in vowel
changes. For /u/
∼/i/ and /S/∼/G/ F
2
distances, both the AA and AP
Southern migrant groups show small distance measures (i.e. more
fronting) for pre-alveolar variants throughout the vowel (i.e. at both
vowel midpoint and offset). Another consistent pattern was that pre-
labial /u/ was consistently more back (larger /u/
∼/i/ F
2
distances) for
both groups. The only significant difference by ethnicity for the F
2
65

November 2007
MAC/MAL
Page-66
9780230_008861_07_cha06
66
Migration, Accommodation and Language Change
distance scores between the phonologically front and phonologically
back vowels is that the AP speakers show a more back pre-velar /S/
than the AA speakers.
Section 6.1 describes the patterns of fronting for the AA and AP
Southern migrant groups by ethnicity, vowel, and following phonetic
context at midpoint and offset.
6.1 Analysis of /u/
∼/i/ and /
S
/
∼/
G
/ distances at midpoint
and offset
This section (1) provides a quantitative account of /u/ and /S/
fronting, (2) determines to what extent, if any, the AA and AP speakers
have similar patterns of fronting, and (3) determines the nature of
the vowel patterning in terms of following consonantal context. The
patterning of /u/ and /S/ for the Southern migrant speakers is also
compared to a reference group of speakers whose formant frequency
values are reported by Hillenbrand et al. (1995) (see Section 5.4)
Hillebrand et al.’s speakers have backed variants and thus provide
a benchmark for fronting. The following section describes the data
and methods. Section 6.1.2 provides a descriptive overview of the
patterns by ethnicity, vowel, and context, and Section 6.1.3 gives a
statistical analysis of these patterns.
6.1.1 Methods for the statistical analysis
The dataset for this portion of the study was described in Section 5.3
and a token list provided in Tables 5.5 and 5.6. The spectral compar-
isons discussed in this chapter are described in Section 5.4. F
2
distance
measures between front and back counterparts allow the analyst to
quantify fronting. A back vowel can only be judged as “fronted”
when it is examined in relation to its phonologically front coun-
terpart. In addition, analyzing F
2
values alone (without reference to
their front counterparts) is problematic because of the normaliza-
tion problem; formant values vary across individual speakers due
to variations in vocal tract size. A comparison of the relation-
ship between two elements within an individual speaker’s system
renders normalization unnecessary (see Section 5.4 and Anderson
2003).
Fronting of /u/ and /S/ was quantified for each speaker by calcu-
lating the difference between the average F
2
values of /u/ and /S/

November 2007
MAC/MAL
Page-67
9780230_008861_07_cha06
The High and Lower-High Back Vowels
67
and their front counterparts /i/ and /G/. For /u/
∼/i/, distances were
calculated separately for three environments (pre-labial, pre-alveolar,
and word-final) at midpoint and offset. Each speaker therefore has
six different /u/ fronting scores (three contexts and two temporal
locations). For /S/, there were only two environments, pre-alveolar
and pre-velar, resulting in four /S/ fronting scores (two contexts and
two temporal locations). A high value for an F
2
distance is diagnostic
of a backed variant while a low value is diagnostic of a fronted
variant.
Testing for main effects and interactions of ethnicity and environ-
ment was conducted using General Linear Model (GLM) analysis of
variance (using the SPSS statistical analysis program, version 11.0) for
each of the four F
2
distance values (/u/
∼/i/ and /S/∼/G/ at midpoint
and offset). Age was not included in the main analysis of fronting
of /u/ and /S/ because several tests showed that it was not a signi-
ficant factor and could therefore be omitted. The first test of age was
to separate the F
2
values of the two oldest speakers in each group
from the four youngest. I conducted a GLM analysis of variance at
midpoint and offset for F
2
distances using the factors of age, ethni-
city, and environment. The age factor had no significant main effect
and did not participate in any significant interactions for midpoint
or offset F
2
distances of either vowel pair.
The second method of testing age was a three-way classification of
the speakers according to whether they are first-, second-, or third-
generation migrants. The results of the analysis using this alternative
classification were the same, with no significant main effect on F
2
distances for generation and no significant interactions. With 12 total
speakers, it is best not to multiply the cross-classifications unneces-
sarily, and these tests show that age can be safely omitted. F
2
distance
values are therefore separated into groups on the basis of ethnicity
only.
6.1.2 Descriptive overview of fronting patterns
First, I compare data from the AA and AP speakers with those of the
reference group of 48 female speakers from Hillenbrand et al. (1995)
(see Section 5.4). Then I compare in more detail the AA and AP groups
by vowel (/u/
∼/i/ and /S/∼/G/) and context at both midpoint and
offset.
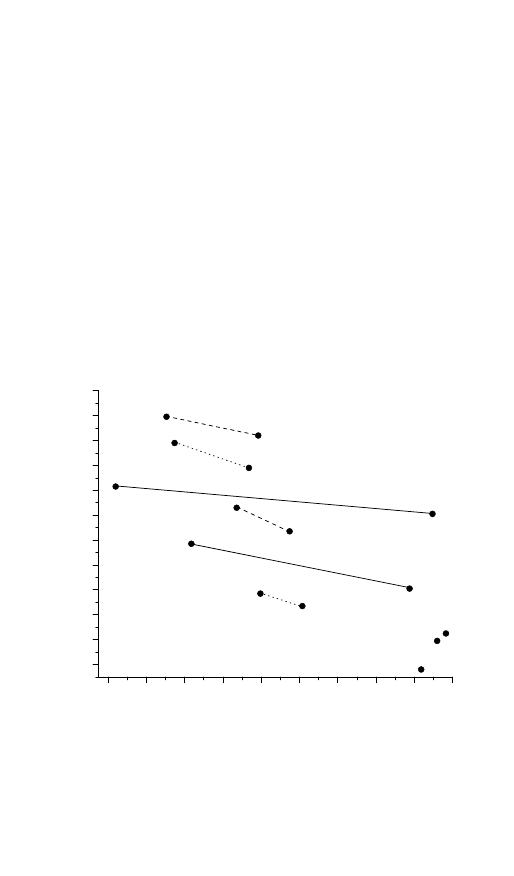
November 2007
MAC/MAL
Page-68
9780230_008861_07_cha06
68
Migration, Accommodation and Language Change
6.1.2.1 African American, Appalachian, and Midwestern White groups
Figure 6.1 shows F
1
and F
2
midpoint values in the pre-alveolar context
for the three groups of speakers. Only pre-alveolar tokens are included
in this plot because Hillenbrand et al. limited their measurements to
this environment (h_d) at midpoint. The lines in Figure 6.1 connect
front and back counterparts for each group of speakers and the
numbers are F
2
differences between them. /o/ provides a common
reference area for the back of the vowel spaces for all of the groups.
The figure shows that pre-alveolar /u/ midpoint is fronted for all the
Detroit Southern migrant speakers regardless of ethnicity. In contrast,
Hillenbrand et al. found that the 48 women in their study had an
average /i/ F
2
midpoint value of 2761 Hz and /u/ value of 1105 Hz
(standard deviation was not reported), which is a distance of 1656 Hz,
several times greater than the 480 Hz pre-alveolar midpoint distance
1000
2800
580
560
540
520
500
480
460
440
420
400
380
360
u
u
i
i
F
1
F
2
AA
=
480
AP
=
389
AA
=
275
AP
=
219
RG
=
1140
RG
=
1656
i
u
o AA
o AP
o RG
2600
2400
2200
2000
1800
1600
1400
1200
υ
υ
υ
i
i
i
Figure 6.1
Midpoint F
1
and F
2
(in Hz) of /i/, /
G
/, /u/, /
S
/, and /o/ (pre-alveolar
context) in Hz for the AA and AP speakers in this study and the reference
group (RG) of 48 women from Hillenbrand et al. (1995). The lines connect
front and back vowel counterparts and the numbers are distance in F
2
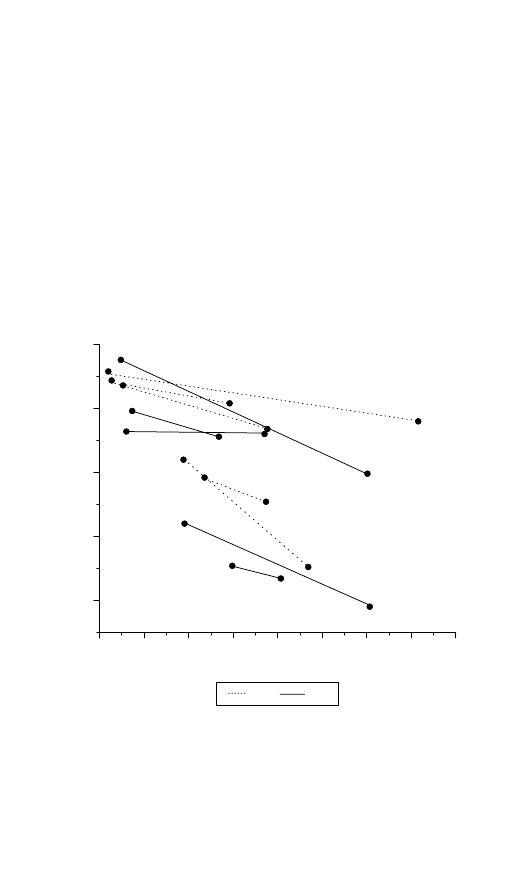
November 2007
MAC/MAL
Page-69
9780230_008861_07_cha06
The High and Lower-High Back Vowels
69
found here among the Detroit AA speakers and the 389 Hz for the AP
speakers. The Detroit speakers also show a different pattern than the
Hillenbrand et al. speakers for pre-alveolar /S/. The female speakers in
Hillenbrand et al.’s study (1995) have a midpoint distance of 1140 Hz,
while the Detroit AA speakers show a distance of only 275 Hz and the
Detroit AP speakers show a distance of 219 Hz. High F
2
values for /S/
and /u/ and small F
2
distances for /S/
∼/G/ and /u/∼/i/ indicate fronted
variants for the AA and AP groups relative to the vowel productions
of the speakers in Hillenbrand et al.’s study.
6.1.2.2 African American and Appalachian speakers
Fronting of /u/ and /S/ is sensitive to the following phonetic environ-
ment for both Southern migrant groups. Figure 6.2 shows midpoint
2600
550
500
450
400
350
i
u wb
u alv
u lab
u wb
u alv
u lab
F
2
F
1
AA
AP
i
2400
2200
2000
1800
1600
1400
1200
1000
υ alv
υ vel
υ alv
υ vel
i
i
Figure 6.2
Midpoint F
1
and F
2
(in Hz) for /i/, /
G
/, /u/, and /
S
/ in all contexts
measured for the AA and AP speakers. The lines connect front and back vowel
counterparts in each environment. The dotted line represents AA speakers and
the solid line, AP speakers alv
= pre-alveolar, lab = pre-labial, wb = word-final,
vel
= pre-velar.
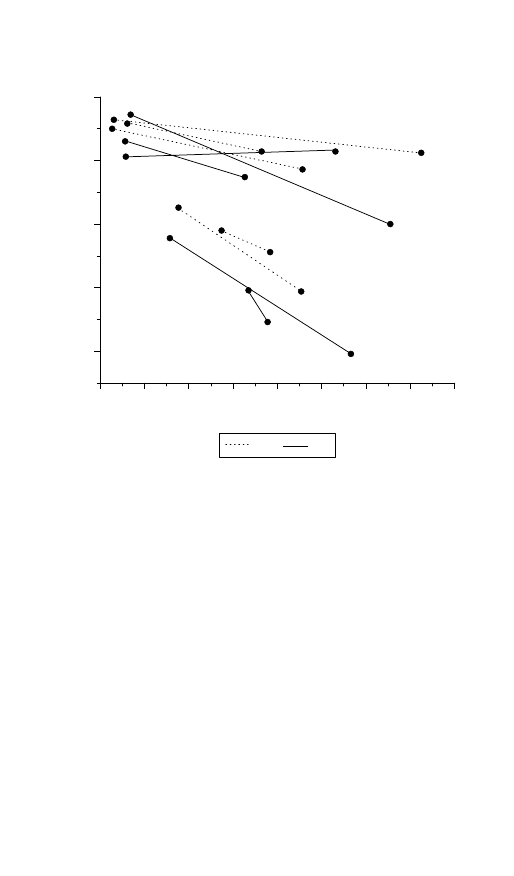
November 2007
MAC/MAL
Page-70
9780230_008861_07_cha06
70
Migration, Accommodation and Language Change
i
υ alv
υ vel
u wb
u alv
u lab
υ alv
υ vel
u wb
u alv
u lab
AA
AP
i
2600
F
2
2400
2200
2000
1800
1600
1400
1200
1000
550
500
450
400
350
F
1
i
i
Figure 6.3
Offset values of /i/, /
G
/, /u/, and /
S
/ (in Hz) in all contexts measured
for the AA and AP speakers. The lines connect front and back vowel counter-
parts in each environment. The dotted line represents AA speakers and the
solid line, AP speakers. alv
= pre-alveolar, lab = pre-labial, wb = word-final,
vel
= pre-velar
values in all contexts for the AA and AP speakers, and Figure 6.3 shows
the offset values. Tables 6.1 (/u/ and /i/) and 6.2 (/S/ and /G/) show
F
2
mean values and distance from the front vowels at midpoint and
offset by ethnicity and environment. Examination of the figures show
that pre-alveolar /u/ is farther toward the front of the vowel envelope
at midpoint and offset, while pre-labial /u/ was consistently further
back at midpoint and offset, regardless of ethnicity (observations that
will be subject to statistical tests in the following section). As already
seen in Figure 6.1, the fronting of pre-alveolar /u/ reported here for
the speakers of Southern origin is not found for the reference group of
female speakers in the Hillenbrand et al. (1995) study; those speakers
show a much larger F
2
distance measure between pre-alveolar /u/ and

November
2007
MAC/MAL
Page-71
9780230_008861_07_cha06
71
Table 6.1
F
2
of /i/ and /u/ and F
2
/i/
∼/u/ distance at midpoint and offset (in Hz) by ethnicity and following environment
(N
= number of speakers)
Environment
Ethnicity
Midpoint
distance
Offset
distance
/i/ midpoint
/u/ midpoint
/i/ offset
/u/ offset
Word-final
AA
Mean
700
859
2547
1846
2545
1686
Stdev
357
380
204
317
188
366
N
6
6
6
6
6
6
AP
Mean
620
945
2479
1859
2484
1539
Stdev
145
314
182
212
140
238
N
6
6
6
6
6
6
Labial
AA
Mean
1374
1388
2543
1169
2539
1152
Stdev
342
285
223
201
173
166
N
6
6
6
6
6
6

November
2007
MAC/MAL
Page-72
9780230_008861_07_cha06
72
Table 6.1
(Continued)
Environment
Ethnicity
Midpoint
distance
Offset
distance
/i/ midpoint
/u/ midpoint
/i/ offset
/u/ offset
AP
Mean
1107
1172
2504
1397
2462
1290
Stdev
377
358
201
317
169
275
N
6
6
6
6
6
6
Alveolar
AA
Mean
480
597
2496
2016
2468
1871
Stdev
200
238
131
216
136
282
N
6
6
6
6
6
6
AP
Mean
389
540
2453
2064
2487
1948
Stdev
324
231
181
184
178
185
N
6
6
6
6
6
6

November
2007
MAC/MAL
Page-73
9780230_008861_07_cha06
73
Table 6.2
F
2
of /
G
/ and /
S
/ and F
2
/
G
/
∼/
S
/ distance at midpoint and offset (in Hz) by ethnicity and following environment
(N
= number of speakers)
Environment
Ethnicity
Midpoint
distance
Offset
distance
/I/ midpoint
/
S
/ midpoint
/I/ offset
/
S
/ offset
Alveolar
AA
Mean
275
219
2127
1852
2052
1833
Stdev
175
106
186
121
177
113
N
6
6
6
6
6
6
AP
Mean
219
87
2004
1785
1931
1844
Stdev
157
199
171
159
225
141
N
6
6
6
6
6
6
Velar
AA
Mean
560
552
2222
1662
2245
1692
Stdev
164
262
195
167
217
246
N
6
6
6
6
6
6
AP
Mean
832
817
2218
1386
2285
1468
Stdev
225
220
96
234
109
223
N
6
6
6
6
6
6

November 2007
MAC/MAL
Page-74
9780230_008861_07_cha06
74
Migration, Accommodation and Language Change
/i/. For /S/, the pre-alveolar environment shows more fronting than
pre-velar. Pre-velar tokens are further back in the vowel space than
alveolars for both groups, but the AA speakers show more fronting
for this environment than the Appalachian speakers. Below I describe
these patterns in more detail.
For /u/ midpoint (Figure 6.2, Table 6.1), the pre-labial environment
shows a greater F
2
distance between front and back pairs than either
pre-alveolar or word-final pairs. The AA speakers show a mean F
2
distance of 1374 Hz at midpoint for pre-labial contexts and the AP
speakers show a mean F
2
distance of 1107 Hz, compared to 480 Hz
and 389 Hz in the pre-alveolar context. Word-final /u/ falls in the
middle, with the AA speakers showing a mean F
2
distance of 700 Hz,
and the AP speakers 620 Hz. The same pattern occurs at the offset
(see Figure 6.3 and Table 6.1), with pre-labial showing the largest F
2
distance (1388 Hz for AA, 1172 Hz for AP), followed by word-final
(859 Hz and 945 Hz), followed by pre-alveolar (597 Hz and 540 Hz).
In the pre-labial environment, neither group shows much difference
between midpoint and offset F
2
distances (a 14 Hz difference for the
AA group and a 65 Hz difference for the AP group). In the pre-alveolar
environment, both groups show a tendency to be less fronted at offset
than at midpoint (the AA group by 117 Hz; the AP group by 151 Hz).
The same pattern of movement toward the back of the vowel space
occurs in the word-final environment: the AA group’s difference is
139 Hz and the AP group’s is 325 Hz.
The results for /G/ and /S/ at midpoint and offset by following
phonetic environment and ethnicity are summarized in Table 6.2
and Figure 6.3. The F
2
distance between pre-alveolar /G/ and /S/ is
275 Hz at midpoint and 219 Hz at offset for the AA speakers and
219 Hz and 87 Hz for the AP speakers. Pre-velar F
2
distances are
greater: 560 Hz (midpoint) and 552 Hz (offset) for the AA speakers
and 832 Hz (midpoint) and 817 Hz (offset) for the AP speakers.
Although both groups show less fronted variants for pre-velar than
for pre-alveolar contexts, the AA group shows more pre-velar fronting
than the AP group, a result to be discussed in greater detail in the
following section. The AA and AP groups show a pattern in which
the F
2
distance measure decreases from midpoint to offset (i.e. the
offset is more fronted than the midpoint) due to the effect of the
following consonantal context. The AA group shows that F
2
moves
forward in the vowel envelope by 56 Hz, and the AP group shows F
2

November 2007
MAC/MAL
Page-75
9780230_008861_07_cha06
The High and Lower-High Back Vowels
75
movement toward the front of the vowel envelope of 132 Hz. The
AA and AP speakers show differences for F
1
in that AP speakers have
lower vowels (indicated by higher F
1
values) than the AA speakers, a
pattern for which I lack an explanation at this point.
6.1.3 Statistical analysis of F
2
distances
As mentioned above, testing for main effects and interactions of
ethnicity and environment was conducted using a GLM analysis
of variance for /u/
∼/i/ F
2
distance and /S/
∼/G/ F
2
distance at the
midpoint and offset, resulting in four tests. The results are shown
in Tables 6.3–6.6. Whereas all four tests showed significant main
effects for context, none showed a main effect for ethnicity. The signi-
ficant main effects for context were as follows: for /u/
∼/i/ midpoint
F
2
distance, F(2,35)
= 22.541, p < 0.001; /u/∼/i/ offset F
2
distance,
F(2,35)
= 16.251, p < 0.001; /S/∼/G/ midpoint F
2
distance, F(1,23)
=
36.415, p < 0.001; /S/
∼/G/ offset F
2
distance, F(1,23)
= 40.462, p <
0.001. The non-significant main effects for ethnicity were as follows:
/u/
∼/i/ midpoint F
2
distance, F(1,35)
= 2.084, p < 0.159; /u/∼/i/ offset
F
2
distance, F(1,35)
= 0.371, p < 0.547; /S/∼/G/ midpoint F
2
distance,
F(1,23)
= 2.114, p < 0.161; /S/∼/G/ offset F
2
distance, F(1,23)
= 0.628,
p < 0.438. For /u/ midpoint and offset, there is also no significant
interaction between ethnicity and environment (midpoint F(2,35)
=
0.357, p < 0.702; offset F(2,35)
= 0.729, p < 0.491), indicating that
ethnicity is not a significant factor in the fronting of /u/. For /S/,
there is a significant interaction both for midpoint (F(1,23)
= 4.882,
p < 0.039) and offset (F(1,23)
= 5.630, p < 0.028), so to compare ethni-
cities it is necessary to look within environments. First, I will discuss
main effects of environment for both vowels, then the interactions
for /S/.
For /u/, Tukey post-hoc analyses show that pre-labial F
2
distance
for midpoint (Table 6.7) was significantly greater than both pre-
alveolar, with a marginal mean difference of 806 Hz, and word-final
F
2
distances, with a marginal mean distance of 580 Hz (midpoint:
p < 0.001), while pre-alveolar and word-final contexts did not differ
significantly from one another (marginal mean difference of 226 Hz).
For the offset F
2
distances (Table 6.8), pre-labial was significantly
greater than word-final, with a marginal mean difference of 378 Hz
(p < 0.014), which was also significantly greater than pre-alveolar,
with a marginal mean difference of 334 Hz (p < 0.031). For /S/,

November 2007
MAC/MAL
Page-76
9780230_008861_07_cha06
76
Table 6.3
ANOVA of main effects and interactions for /u/
∼/i/ midpoint F
2
distance
Dependent variable: midpoint distance
Source
Type III sum
of squares
df
Mean square
F
Sig.
CONTEXT
4 146 857056
2
2 073 428528
22541
0000
ETH
191 698028
1
191 698028
2084
0159
CONTEXT
∗
ETH
65 747722
2
32 873861
0357
0702
Error
2 759 525500
30
91 984183
Total
28 974 2850
36
Corrected total
7 163 828306
35
Table 6.4
ANOVA of main effects and interactions for /u/
∼/i/ offset F
2
distance
Dependent variable: offset distance
Source
Type III sum
of squares
df
Mean square
F
Sig.
CONTEXT
3 044 838722
2
1 522 419361
16251
0000
ETH
34 720111
1
34 720111
0371
0547
CONTEXT
∗
ETH
136 621722
2
68 310861
0729
0491
Error
2 810 428000
30
93 680933
Total
36 272 9420
36
Corrected total
6 026 608556
35
Table 6.5
ANOVA of main effects and interactions for /
S
/
∼/
G
/ midpoint F
2
distance
Dependent variable: midpoint distance
Source
Type III sum
of squares
df
Mean square
F
Sig.
CONTEXT
1 207 362042
1
1 207 362042
36415
0000
ETH
70 092042
1
70 092042
2114
0161
CONTEXT
∗
ETH
161 868375
1
161 868375
4882
0039
Error
663 117167
20
33 155858
Total
7 435 105000
24
Corrected total
2 102 439625
23

November 2007
MAC/MAL
Page-77
9780230_008861_07_cha06
The High and Lower-High Back Vowels
77
Table 6.6
ANOVA of main effects and interactions for /
S
/
∼/
G
/ offset F
2
distance
Dependent variable: offset distance
Source
Type III sum
of squares
df
Mean square
F
Sig.
CONTEXT
1 697 612042
1
1697612042
40462
0000
ETH
26 334375
1
26334375
0628
0438
CONTEXT
∗
ETH
236 215042
1
236215042
5630
0028
Error
839 112500
20
41955625
Total
7 003 525000
24
Corrected total
2 799 273958
23
Table 6.7
Tukey post-hoc analysis on the environment factor for /u/
∼/i/
midpoint F
2
distance
Dependent variable: midpoint distance
Tukey HSD
(I) context
(J) context
Mean
difference
(I
− J)
Std. error
Sig.
95%
Confidence
interval
Lower
bound
Upper
bound
Word-final
Labial
−580
∗
124
0000
−885
−275
Alveolar
226
124
0180
−80
531
Labial
Word-final
580
∗
124
0000
275
885
Alveolar
806
∗
124
0000
501
1111
Alveolar
Word-final
−226
124
0180
−531
80
Labial
−806
∗
124
0000
−1111
−501
Based on observed means.
∗
The mean difference is significant at the 0.05 level.
there were only two environments, pre-alveolar and pre-velar, so the
Tukey post-hoc test is not applicable. As noted previously and seen
in Table 6.2, the pre-velar F
2
distance was greater than pre-alveolar
at both midpoint (by 285 Hz for the AA group and 613 Hz for the
AP group) and offset (333 Hz for AA, 730 Hz for AP). In general then,
for /u/, pre-alveolar and word-final tokens are more fronted (with
the pre-alveolar environment showing a greater degree of fronting

November 2007
MAC/MAL
Page-78
9780230_008861_07_cha06
78
Migration, Accommodation and Language Change
Table 6.8
Tukey post-hoc analysis on the environment factor for /u/
∼/i/
offset F
2
distance
Dependent variable: midpoint distance
Tukey HSD
(I) context
(J) context
Mean
difference
(I
− J)
Std. error
Sig.
95%
Confidence
interval
Lower
bound
Upper
bound
Word-final
Labial
−378
∗
125
0014
−686
−70
Alveolar
334
∗
125
0031
26
642
Labial
Word-final
378
∗
125
0014
70
686
Alveolar
712
∗
125
0000
404
1020
Alveolar
Word-final
−334
∗
125
0031
−642
−26
Labial
−712
∗
125
0000
−1020
−404
Based on observed means.
∗
The mean difference is significant at the .05 level.
than word-final), and pre-labial is backed. For /S/, pre-alveolar tokens
show fronting while pre-velar tokens are more backed.
Comparison of ethnicities within environments for /S/-/G/ F
2
distance was analyzed using the estimated marginal means and 95%
confidence intervals shown in Tables 6.9 and 6.10. For the midpoint
in the pre-alveolar context, the AA group’s F
2
distance was just
56 Hz greater than the AP group, and each mean is contained in the
Table 6.9
Estimated marginal means for /
S
/
∼/
G
/ F
2
distance at midpoint, by
ethnicity and context
Dependent variable: midpoint distance
95% Confidence interval
Ethnicity
Context
Mean
Std. error
Lower bound
Upper bound
AA
Alveolar
275
74337
120
430
Velar
560
74337
404
715
AP
Alveolar
219
74337
64
374
Velar
832
74337
677
987

November 2007
MAC/MAL
Page-79
9780230_008861_07_cha06
The High and Lower-High Back Vowels
79
Table 6.10
Estimated marginal means for /
S
/
∼/I/ F
2
distance at offset, by
ethnicity and context
Dependent variable: offset distance
95% Confidence interval
Ethnicity
Context
Mean
Std. error
Lower bound
Upper bound
AA
Alveolar
219
83622
44
393
Velar
552
83622
378
727
AP
Alveolar
87
83622
−88
261
Velar
817
83622
642
991
other group’s confidence interval. In the pre-velar context, however,
the AA group’s /S/
∼/G/ F
2
distance was 272 Hz less than the AP
group. Although each group’s mean is beyond the other’s confidence
interval, the ends of the intervals overlap somewhat, with 715 Hz
as the upper bound on the AA group’s estimate and 677 Hz as the
lower bound on the AP group’s estimate. So, although the difference
for the /S/
∼/G/ F
2
distance between the groups is greater within the
pre-velar context, the difference is not great enough to be deemed
significant in itself. For offset /S/
∼/G/ F
2
distance, in the pre-alveolar
environment the AA group had a greater distance than the AP group
by 132 Hz, and each mean is contained within the other group’s
confidence interval. In the pre-velar environment, however, the AA
group had a smaller /S/
∼/G/ F
2
distance than the AP group by 265 Hz.
The pattern is the same as at midpoint, with the AA’s upper bound of
727 Hz overlapping with the AP’s lower bound of 642 Hz. The overall
interaction pattern is that the AA group has slightly greater /S/
∼/G/
F
2
distance values in the pre-alveolar context and the AP group has
much larger F
2
distance values in the pre-velar context, even though
the differences were not significant when considered individually.
6.1.4 Summary and significance of the F
2
distance results
Fronting of /u/ and /S/ among the Detroit AA and AP Southern
migrant speakers is sensitive to the following phonetic environment.
Pre-alveolar /u/ midpoint is farther toward the front of the vowel
envelope than pre-labial /u/ for the AP and AA speakers regardless of
ethnicity. The pre-alveolar /u/
∼/i/ and /S/∼/G/ F
2
distance measures
were compared to the values reported in Hillenbrand et al. (1995); the

November 2007
MAC/MAL
Page-80
9780230_008861_07_cha06
80
Migration, Accommodation and Language Change
female speakers in that study show large values for the F
2
distances
on the order of four times those found for the AA and AP women in
this study. In other words, the AA and AP Southern migrant groups
show contextually conditioned patterns of fronting for the high back
vowels, while the reference group from the Hillenbrand et al. study
does not show patterns of fronting. Patterns of fronting with regard to
context effects from the following consonant are examined in more
detail in Section 6.2.
6.2 Context effects of consonants on preceding vowels
This section discusses following consonantal effects on vowel quality
and duration and their role in distinguishing between ethnicities.
Context effects are the result of coarticulation. The acoustic effects
of coarticulation are lawful and predictable, arising out of acoustic–
articulatory relations. Given the lawful nature of patterns of coartic-
ulation, different dialects would not be expected to show opposite
directions of shifts based on context effects. However, as cross-
linguistic work on coarticulation suggests (e.g. Beddor et al. 2002),
different dialects may well show different degrees for the progression
of contextually conditioned shifts. Analysis of context effects may
yield important information about the progression of sound change
across individual speakers as well as dialects. However, context
effects are not always analyzed in socioacoustic work on Amer-
ican English vowel systems. Following phonetic environment has
important effects on the patterning of the vowels for the speakers
in this study. Context effects from the following consonant on the
vowels /u/ and /S/ are assessed at two temporal locations: vowel
midpoint and 25 ms before the end of the offset.
There are good reasons for taking formant measurements at both the
midpoint and offset portions of the vowel. Watt (1998) discusses the
tendency in socioacoustic work on vowel systems to take measurements
only at a “steady state” in an attempt to avoid heavily coarticu-
lated onsets and offsets. However, the situation is not so straightfor-
ward as this. Watt (1998: 29–30) points out that perceptual research
has shown that listeners make use of a range of information distrib-
uted throughout the duration of segment and especially for vowels
at the heavily coarticulated boundary and transition zones between
vowels and consonants (Ohala 1992). Childs (2005), Thomas (2001),

November 2007
MAC/MAL
Page-81
9780230_008861_07_cha06
The High and Lower-High Back Vowels
81
Bailey and Thomas (1998), and Wolfram and Thomas (2002) are excep-
tions in that offset as well as midpoint formant frequency readings are
taken for diphthongs. Another notable exception is Beckford (1999),
who examines onset, midpoint, and offset measurements.
Information extracted at vowel midpoint may not be as perceptu-
ally salient as information in the portions of the segment that show
the greatest context effects, namely consonantal formant transitions
at onset and offset. Strange (1999: 163) summarizes the results of
an earlier study (Strange et al. 1979) thus: “ vowels produced in
several CVC contexts were identified more accurately than vowels
produced in isolation (#V#) by the same panel of talkers.” Strange
(1999: 165) argues, in fact, that “ vowel targets in syllable centers
are neither sufficient nor necessary for the accurate perception of
coarticulated vowels.” Ohala (1981: 189) also finds that
some of the most important acoustic cues for primary place of
articulation and certainly for secondary place of articulation are
F
2
and F
3
transitions spreading from onset and offset of the
consonant into preceding and following vowels and that such
formant transitions may last 30–60 ms—that is, for a good propor-
tion of the average vowel.
In light of the results reported by Strange and her colleagues, it
may be the case that the trend in sociophonetic work on Amer-
ican English vowel systems to rely on F
1
and F
2
measurements
only at a single temporal location, usually described as the vowel
nucleus (Labov 1994) or “steady state” (Fridland 2003) portion of
the vowel, is problematic because these formant frequencies may not
be as information-rich (perceptually) as portions of the signal which
contain formant transitions associated with consonantal context
effects. These formant transitions between vowels and consonants
should also be examined.
6.2.1 Effects of following alveolar consonantal context on
vowel spectra
As noted by Stevens (1998: 355), a constriction in the alveolar region
causes a “ modest narrowing in the anterior or oral region and
a widening in the posterior or pharyngeal region. The raising of the
tongue tip to form a constriction causes a tapering of the area function

November 2007
MAC/MAL
Page-82
9780230_008861_07_cha06
82
Migration, Accommodation and Language Change
behind the constriction point. ” When a high front vowel such as
/i/ precedes an alveolar, the tongue body does not have to move far
in order to make the constriction. According to Stevens, acoustically
this event results in a slight downward movement for F
1
and F
2
(356).
In contrast, a high back rounded vowel such as /u/ differs from its
front counterpart for F
2
values and tongue body position (356). /u/
is produced with a “narrowing in the pharyngeal region,” and one
acoustic consequence of this configuration is a low F
2
value (356).
The constriction is moved from a backed position toward a more
fronted position in the oral cavity in order to execute an alveolar
consonant, which has a relatively high F
2
value (Johnson 2003: 143).
Fronting of pre-alveolar /u/ is likely in part the result of context
effects on the vowel from the following consonant. The overall pre-
alveolar F
2
distances for /u/ and /i/ were smaller than those for the
other contexts: 480 Hz (AA) and 389 Hz (AP) at midpoint and 597 Hz
(AA) and 540 Hz (AP) at offset (Table 6.1). Vowel duration is an
important factor to consider in discussions of context effects from the
following consonant on vowel quality. Stevens (1998: 572) notes that
tongue body movement from a back vowel into a fronted position
such as that necessary for the production of an alveolar takes about
100 ms. He also points out that vowels which are less than 200–
300 ms may show coarticulatory effects from adjacent consonants
throughout their duration. The overall mean duration of 144 ms for
pre-alveolar tokens of /u/ (Table 6.11) suggests that context effects
Table 6.11
Duration of /u/ and /
S
/ (in ms) by
ethnicity in the pre-alveolar context
Ethnicity
Vowel
Mean
Stdev
N
AA
/u/
148
64
97
/
S
/
136
86
75
Total
143
74
172
AP
/u/
135
43
43
/
S
/
119
68
36
Total
127
56
79
Total
/u/
144
58
140
/
S
/
131
81
111
Total
138
69
251

November 2007
MAC/MAL
Page-83
9780230_008861_07_cha06
The High and Lower-High Back Vowels
83
from the following alveolar consonant at both midpoint and offset
are a reasonable explanation for fronting of /u/ in this environment.
F
2
values must rise as the articulators move into position to form
a constriction for an alveolar consonant, and it is possible that the
following contextual effects have an impact on vowel quality at least
as early as midpoint.
Lower-high vowels such as /S/and/G/ show acoustic patterns similar
to /u/ and /i/, respectively, when the articulators move into position
to execute an alveolar consonant (Stevens 1998: 282). The overall
pre-alveolar F
2
distances for /S/ and /G/ were 275 Hz (AA) and 219 Hz
(AP) at midpoint and 219 Hz (AA) and 87 Hz (AP) at offset. For /S/, the
overall pre-alveolar mean duration was 131 ms, hence context effects
on /S/from the following alveolar are probable at both midpoint and
offset. Pre-alveolar /u/ and /S/ glide toward the back of the vowel
envelope rather than toward the front for nearly all of the speakers;
the front-back differences are larger at offset than midpoint because
there is a decrease in F
2
for back vowels at offset. I will return to
this issue in the discussion of the combined effects of backing and
rounding in Section 6.3.
6.2.2 Effects of following labial consonantal context on vowel
spectra
The overall pre-labial F
2
distances for /u/ and /i/ were 1374 Hz (AA)
and 1107 Hz (AP) at midpoint and 1388 Hz (AA) and 1172 Hz (AP)
at offset (Table 6.1). The distance measures between /i/ and /u/ are
much greater in pre-labial contexts at both midpoint (AA 1374 Hz,
AP 1107 Hz) and offset (AA 1388 Hz, AP 1172 Hz) than in pre-alveolar
(midpoint: AA 480 Hz, AP 389 Hz; offset: AA 597 Hz, AP 540 Hz)
and word-final (midpoint: AA 700 Hz, AP 620 Hz; offset: AA 859 Hz,
AP 945 Hz). A greater F
2
distance measure indicates a more backed
variant of /u/. The phonetic characteristics of the labial environ-
ment tend to inhibit fronting. Labial consonants show low values
for F
2
and back vowels do as well. Stevens (1998: 341) describes both
labials and back vowels as showing close spacing of the first two
formants and notes that the F
2
movement of a back vowel into a
labial consonant is small (341). The articulatory configuration of a
back vowel such as /u/ can be modeled by two coupled tubes (one
corresponding to the front cavity and one to the back) “ with
the closely spaced first two formants associated roughly with these

November 2007
MAC/MAL
Page-84
9780230_008861_07_cha06
84
Migration, Accommodation and Language Change
two sections” (342). There is little movement necessary when a back
vowel transitions into a labial consonant (and vice versa) because the
“ low-frequency back-cavity resonance remains almost unchanged
as the labial constriction changes the front-cavity resonance” (342).
Context effects on /u/ from the following labial consonant account
for the relative backness of these variants for both Southern migrant
groups as compared to pre-alveolar tokens. The mean durations for
pre-labial tokens were 156 ms (AA) and 128 ms (AP), values small
enough to allow for potential influence from adjacent consonants
through a large percentage of the segment (Stevens 1998).
6.2.3 Word-final context
The patterning of word-final variants suggests that context effects
from the following consonant are conditioning the fronting of /u/
rather than fronting being the result of speakers aiming at an inten-
tional vowel target. Overall F
2
distances for word-final /u/ and /i/
(Table 6.1) were 700 Hz (AA) and 620 Hz (AP) at midpoint and 859 Hz
(AA) and 945 Hz (AP) at offset. These distance values between front
and back counterparts fall between those reported for the pre-alveolar
and pre-labial contexts, providing further support for an explana-
tion for patterns of fronting and backing which appeals to following
context effects. Alveolar environments promote fronting, and labial
ones inhibit it—both for the AA and AP groups; it makes sense that
the F
2
of final vowels, which show no following contextual effects,
falls between these two extremes.
6.2.4 Effects of following velar consonantal context on vowel
spectra
Recall that this environment was not included in the analysis of /u/
due to an insufficient number of tokens. The overall pre-velar distance
measures (F
2
distances between /S/ and /G/, Table 6.2) were 560 Hz
(AA) and 832 Hz (AP) at midpoint and 552 Hz (AA) and 817 Hz (AP)
at offset. Note that the F
2
differences between midpoint and offset
are slight, and that the distances are several times larger than the pre-
alveolar distances of 275 Hz (AA) and 219 Hz (AP) at midpoint and
219 Hz (AA) and 87 Hz (AP) at offset. The mean durations for each
group are 105 ms (AA) and 101 ms (AP), values which are low enough
for there to be coarticulation between the vowel and the following

November 2007
MAC/MAL
Page-85
9780230_008861_07_cha06
The High and Lower-High Back Vowels
85
consonant at least as early as midpoint (Stevens 1998). The phonetic
characteristics of velars are described below.
Stevens discusses important differences for velars with respect to
alveolars and labials: the position of the constriction is farther from
the lips, the length of the constriction is greater for a velar than it is
for an alveolar or labial, and the rate of change (increase or decrease)
of the cross-sectional area at the closure is less for a velar than it is for
an alveolar or a labial (1998: 365). In order to form a velar, the tongue
body is raised to form a closure against the soft palate or the posterior
portion of the hard palate (365). The lowest resonant frequency of
the cavity which is in front of the constriction will be associated with
either F
2
or F
3
, and one of the resonant frequencies of the back cavity
will be “relatively close” to the front-cavity resonance. This configur-
ation results in a proximity of F
2
and F
3
(365–366), the well-known
“velar pinch.” In addition, Stevens notes that the spectrum amplitude
of the peak for a velar is “comparable” to that of the F
2
value of the
following vowel (373). Specifically, there is “ considerable vari-
ability in the position of the constriction depending on the front-
back tongue position of the (flanking) vowel ” (374). Thus, a velar
consonant shows a more fronted tongue body position (and thus a
higher F
2
value) when flanked by a front vowel such as /G/ than for a
back vowel such as /S/ (374).
As noted above, the mean durations for this environment are suffi-
ciently small enough for there to be context effects from the following
consonant at least as early as midpoint for both Southern migrant
groups. The phonetic characteristics of velars which are reviewed
above make it clear that a velar constriction following a back vowel
inhibits fronting. Both the AP and the AA groups show backing for
this variant, and context effects from the following consonant are a
reasonable explanation for this pattern.
6.2.5 Summary
Context effects on preceding vowels play a role in the fronting of the
pre-alveolar variants of /u/ and /S/ and in the backing of pre-labial
/u/ and pre-velar /S/. Formant values for word-final variants expec-
tedly fall in the middle, suggesting that fronting is conditioned by
following consonantal context rather than resulting from an inten-
tional vowel target. As noted above, context effects are expected to
follow lawful and predictable paths as they progress through varieties.

November 2007
MAC/MAL
Page-86
9780230_008861_07_cha06
86
Migration, Accommodation and Language Change
However, varieties may show differences in rates of changes which
are conditioned by context effects. For the most part, the AA and AP
groups show strikingly similar context effects on fronting from the
following consonant. The only ethnic difference for context effects
is that the AA group shows a smaller /S/
∼/G/ F
2
distance (i.e. more
fronting) for the pre-alveolar variant than the AP group. As noted
above, the context effects of velars following a back vowel inhibit
fronting. The AP group, then, shows greater context effects from the
following consonant for this variant than the AA group although
both groups show less fronting for this variant than for the pre-
alveolar variant. Average durations of these vowels are short enough
to allow following contextual effects at least as early as midpoint.
6.3 Rounding and backing
As shown in Section 6.1, both ethnicities have fronted pre-alveolar
variants of /u/ and /S/. So far I have discussed the distances in F
2
values between front and back counterparts in terms of fronting
versus backing. However, there is another factor, rounding, which
by adding length to the vocal tract can also influence F
2
values. Lip
rounding and backing of the tongue body both lower F
2
and can be
implemented independently or simultaneously. One-way differenti-
ation between phonologically front and back vowels and between
fronted and backed variants of /u/ and /S/ can therefore be achieved
is through a combination of rounding and backing. Stevens describes
how rounding and a backed tongue body position can work together
to achieve a more robust acoustic effect for /u/: “ a stable acoustic
characteristic for a high back vowel with a maximally low F
2
can best
be achieved by rounding the lips as well as displacing the tongue
body backward ” (1998: 279–280). Stevens describes how a fronted
tongue body position raises F
2
values:
As the tongue body is displaced forward while maintaining a
narrowing in the lower pharynx, the frequency of the second
formant will increase to a maximum value when the configuration
is such that the natural frequency of the short section consisting
of the larynx tube and the lower pharynx becomes roughly equal
to the second natural frequency of the remainder of the vocal tract
anterior to the constricted pharyngeal region. (Stevens 1998: 276)

November 2007
MAC/MAL
Page-87
9780230_008861_07_cha06
The High and Lower-High Back Vowels
87
Lip rounding and a backed tongue body position can thus enhance
one another in order to differentiate the high back vowel /u/ from
its front counterpart /i/. Stevens (1998: 282–283) and Ladefoged
(1996: 131–134) describe the semi-high vowel /S/ as showing similar
acoustic patterns of tongue body displacement and rounding as /u/,
although the degree of rounding is less than that for /u/. Rounding
also lowers F
2
(Stevens 1998: 292). Conversely, spreading of the
lips, along with fronting the tongue body, results in an increase in
F
2
. Because rounding and backing have the same acoustic effect of
lowering F
2
, it is not possible to determine their relative magnitudes
from acoustic data alone. It is possible that the fronted variants of /u/
and /S/ are realized through unrounding of the canonically rounded
back variants, through tongue body movement alone (in which case
they remain rounded), or through a combination of the gestures of
both the tongue body and the lips. The question of how speakers
produce these variants thus remains open for future research that
incorporates articulatory data.
6.4 Nguyen’s (2006) real-time analysis of /
S
/ by social
status for Detroit African Americans and Nguyen and
Anderson’s (2006) comparisons of /
S
/ fronting among
African American and Midwestern Whites in the Detroit
area
Nguyen (2006) analyzed /S/ fronting for both contemporary Detroit
AAE data and a subset of Shuy, Wolfram, and Riley’s Detroit AAE
corpus collected in 1966. She examined fronting differences between
velar and alveolar tokens of /S/ by social status. Her results show
that, for the 1966 corpus, only the higher status speakers have a
context-based difference in fronting, while among contemporary
speakers, this context difference has spread across the whole social
status spectrum. More specifically, both the 1966 high-status speakers
and contemporary speakers of all social status levels show context-
based patterns of fronting for /S/ in which pre-alveolar tokens are
significantly more fronted than pre-velar tokens, the same pattern of
phonetic conditioning reported for my results above. Nguyen high-
lights that the effect of social status on fronting has changed over
time, a change which was also sensitive to phonetic conditioning:
“ high status speakers fronted pre-alveolar tokens /S/ significantly

November 2007
MAC/MAL
Page-88
9780230_008861_07_cha06
88
Migration, Accommodation and Language Change
more than they fronted pre-velar tokens, and more than low status
speakers fronted in either context” (2006: 153). Nguyen claims that
high back vowel fronting is a change in progress in Detroit AAE, her
results “ show(ing) that pre-alveolar and pre-velar /S/ are differ-
ently correlated with social categories and even change differently
over time, suggesting that /S/ fronting is a change in progress rather
than a completed change” (166). Further, women appear to be leading
the change; contemporary women show more fronting than both the
1966 female speakers and more fronting than men in either year of
recording (162). The most relevant pattern from Nguyen’s analysis of
/S/ fronting in real time and with regard to social status for the current
study is that her results, like those reported in this volume, show very
strong phonetic context effects. She offers the following summary
of the interaction of context effects, social status of speakers, and
change over time:
The pre-alveolar contexts appear to have undergone a change; in
1966, the highest status speakers had /S/ values that were much
more fronted in pre-alveolar contexts than pre-velar contexts,
while the lowest status speakers equally backed pre-alveolar and
pre-velar /S/ values. Among contemporary speakers, this status
difference has disappeared and the difference between the pre-
alveolar and pre-velar /S/ is nearly as large among all (contem-
porary Detroit AAE) speakers as it was only among high status
speakers in 1966. (152)
Nguyen’s detailed analysis of change over time in Detroit AAE lends
support to my claim that high-back vowel fronting is phonetic in
nature—governed by coarticulatory context effects. Specifically, pre-
alveolar contexts promote fronting for both /u/ and /S/, a good
example of anticipatory coarticulation. I will argue in Chapter 8 that
many phonetic changes are contextually conditioned, at least in the
early stages of change.
Nguyen (2006) did not analyze /u/. However, Nguyen and
Anderson (2006) compare patterns of fronting for both /u/ and /S/ for
six contemporary Detroit AA and Detroit White speakers. Echoing the
results reported for the current study as well as for Nguyen (2006), we
found that patterns of fronting were also contextually conditioned
for the six White speakers in the study.

November 2007
MAC/MAL
Page-89
9780230_008861_07_cha06
The High and Lower-High Back Vowels
89
Table 6.12
F
2
measurements of /
S
/ tokens among Detroit White female
speakers (Nguyen and Anderson 2006)
N
F2 at
midpoint
Stdev at
midpoint
F2 at offset
Stdev at
offset
Pre-alveolar
112
1644
279
1692
268
Pre-velar
39
1362
205
1379
191
Difference
282
∗∗
313
∗∗
∗∗
These context-based differences are significant at a level of p < 0001.
Similar to Nguyen (2006) and to the current study, the tokens of
/S/ that are analyzed by Nguyen and Anderson (2006) are restricted to
two following contexts: pre-alveolar and pre-velar. While this vowel
does occur in other contexts, tokens of these lexical items occur
too infrequently to be included. Our primary research question was
whether or not there is a difference in following context for these
vowels among White speakers in Detroit area. Table 6.12 provides
the F2 means for White speakers by following context.
The “difference” total in the last row of Table 6.12 is the difference
in Hz between the average measurement of pre-alveolar and pre-velar
tokens at each respective point of measurement. These significance
levels were found using t-tests, or univariate statistical tests. Using a
distance measure renders normalization unnecessary and allows for
quantitative comparisons across individual speakers as well as groups.
The bar graph in Figure 6.4 provides a visual display of the data in
Table 6.12.
Table 6.12 and Figure 6.4 show that pre-alveolar tokens show higher
F2 values than the pre-velar tokens at both midpoint and offset.
The next level of analysis for Nguyen and Anderson compared the
contextual differences for /S/ fronting for the White speakers to that
of contemporary AA speakers.
Context-based difference in /S/ fronting is greater at the offset
than at the midpoint. This is the expected pattern because the offset
measure is closer to the actual following consonant and is thus
expected to show greater coarticulatory context effects. Table 6.13
shows that /S/ fronting measures differ significantly by context for
each of the three groups included. The context-based difference,
however, appears to be somewhat smaller for contemporary AA
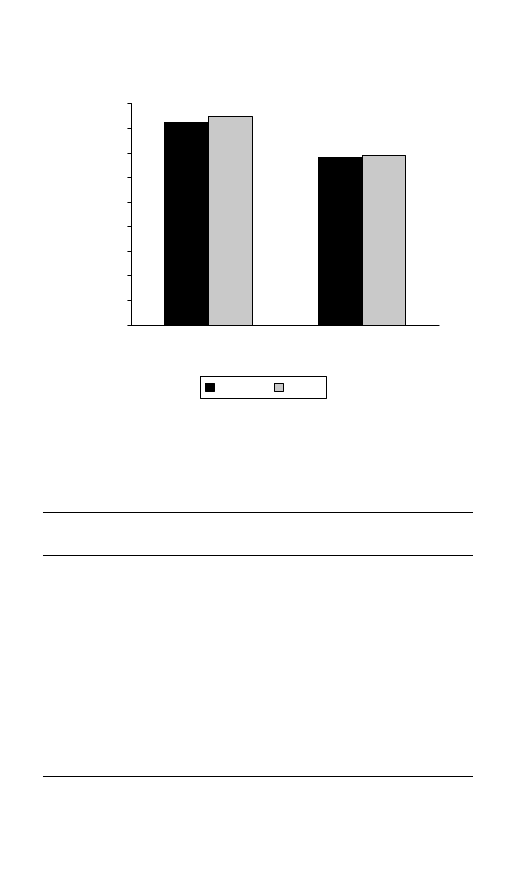
November 2007
MAC/MAL
Page-90
9780230_008861_07_cha06
90
0
200
400
600
800
1000
1200
1400
1600
1800
Pre-alveolar
Place of articulation of following consonants
F
2
of /
υ
/ (in Hz)
Midpoint
Offset
Pre-velar
Figure 6.4
F
2
measurements of /
S
/ tokens among White speakers (Nguyen
and Anderson 2006)
Table 6.13
/
S
/ Comparisons between Detroit White and Detroit African
American participants (Nguyen and Anderson 2006)
N
F
2
at
midpoint
Stdev at
midpoint
F
2
at offset
Stdev at
offset
White speakers
Pre-alveolar
112
1644
279
1692
268
Pre-velar
39
1362
205
1379
191
Difference
282
∗∗
313
∗∗
African American Speakers – Contemporary
Pre-alveolar
191
1515
273
1561
276
Pre-velar
93
1275
204
1305
211
Difference
240
∗∗
256
∗∗
African American Speakers – 1966
Pre-alveolar
182
1476
247
1515
241
Pre-velar
69
1328
196
1298
190
Difference
148
∗∗
217
∗∗
∗∗
These context-based differences are significant at a level of p < 0001.

November 2007
MAC/MAL
Page-91
9780230_008861_07_cha06
The High and Lower-High Back Vowels
91
Table 6.14
Results from a multivariate model, with examination of inter-
actions between speaker group and following context while controlling for
individual speaker effects and preceding place of articulation (Nguyen and
Anderson 2006)
Predictor
Midpoint
significance
level
Offset
significance
level
Intercept
0000
0000
Preceding place of articulation
0000
0000
Following place of articulation
0000
0000
Speaker group
0071
0388
Preceding place
∗
Speaker group
0000
0000
Following place
∗
Speaker group
0003
0072
“Speaker group” refers to three groups—White speakers, contemporary AA speakers, and
1966 AA speakers.
speakers, and smaller yet for the 1966 speakers, than the context-
differences for White speakers. The actual extent to which context-
based /S/ fronting differs across the three groups can be better assessed
by a multivariate model, which has the power to allow examination
of interactions between speaker group and following context while
controlling for individual speaker effects and preceding place of artic-
ulation.
Table 6.14 shows that two interaction terms were included in each
statistical model. They test whether the preceding place of articula-
tion and the following place of articulation have a different effect
on production patterns across speaker groups. The significance levels
indicate that they do (with the exception of the following place for
speaker group at the offset at p
= 0.072).
Nguyen and Anderson (2006) focused particularly on the differ-
ences for following place of articulation. Context has a significantly
different effect on different groups at the midpoint measure, and
approaches a significant difference at the offset measure. Our next
question, then, was: What differing effect does context have across
these groups? In other words, which speaker group’s /S/ fronting is
more and less affected by the following context?
The line graphs in Figures 6.5 and 6.6 show F2 measures by
following place of articulation and speaker group.
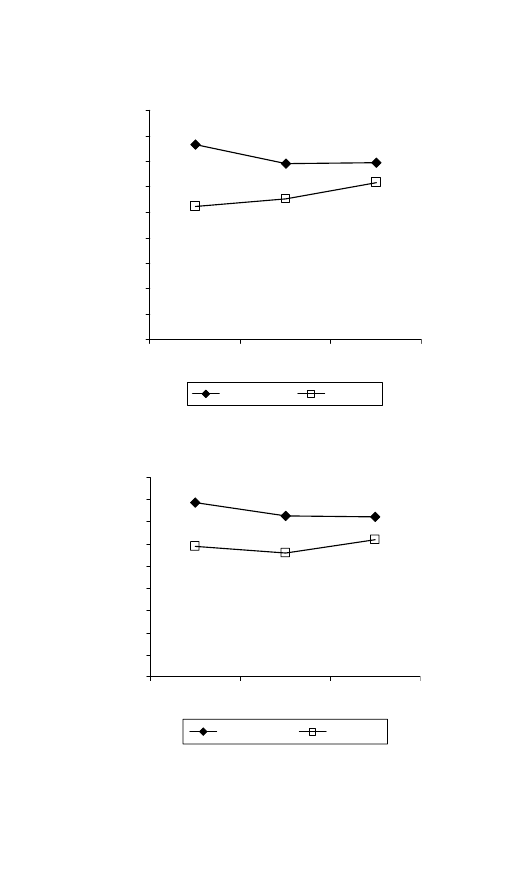
November 2007
MAC/MAL
Page-92
9780230_008861_07_cha06
92
0
200
400
600
800
1000
1200
1400
1600
1800
Estimated F
2
of /
υ
/ (in Hz)
Pre-alveolar
Pre-velar
White
AA–1966
AA–
contemporary
Figure 6.5
/
S
/ F
2
estimated coefficients at onset (Nguyen and Anderson 2006)
Pre-Alveolar
Pre-Velar
White
AA–1966
AA–
contemporary
0
200
400
600
800
1000
1200
1400
1600
1800
Estimated F
2
of /
υ
/ (in Hz)
Figure 6.6
/
S
/ F
2
estimated coefficients at offset (Nguyen and Anderson 2006)
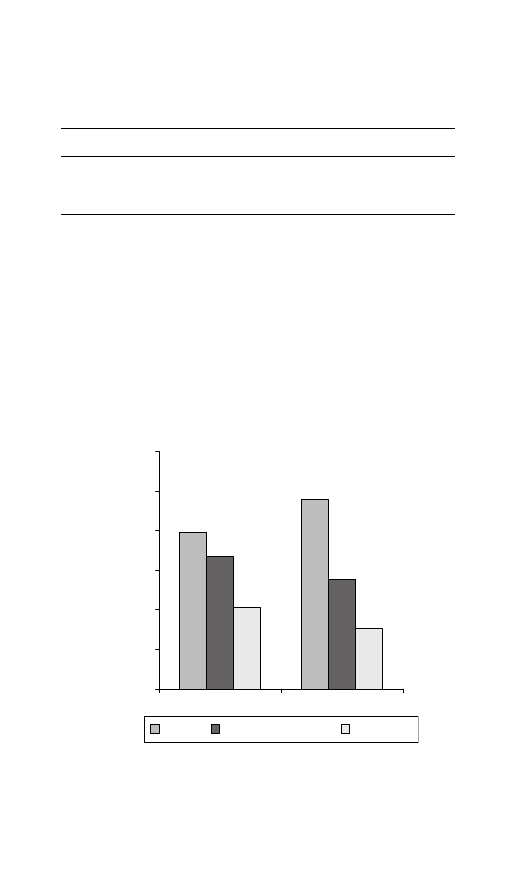
November 2007
MAC/MAL
Page-93
9780230_008861_07_cha06
The High and Lower-High Back Vowels
93
Table 6.15
Estimated coefficients that result from the multivariate
analysis (Nguyen and Anderson 2006)
Group
Difference at midpoint
Difference at offset
White
480
396
AA—Contemporary
276
334
AA—1966
155
207
Table 6.15 presents estimated coefficients that result from the
multivariate analysis. In this analysis, the group of White speakers
serves as the baseline, with which the context-based difference of AA
speakers is compared.
Figure
6.7
is
a
bar
graph,
displaying
the
estimated
mean differences in Table 6.15. As mentioned above, the
multivariate models for /S/ fronting indicated that the following
context at vowel offset had different effects on the three
speaker
groups
included
in
Nguyen
and
Anderson
(2006).
0
100
200
300
400
500
600
Estimated F
2
difference of /
υ
/ based on
following context (in Hz)
White
AA—contemporary
AA—1966
Midpoint
Offset
Figure 6.7
Estimates of context-based differences in /
S
/ fronting (Nguyen and
Anderson 2006)

November 2007
MAC/MAL
Page-94
9780230_008861_07_cha06
94
Migration, Accommodation and Language Change
From the tables and figures above, it is clear that in the Detroit area,
White speakers have a greater context-based difference than contem-
porary AA speakers, who, in turn, have a greater context-based
difference than AAs from 1966.
A very clear picture of context-based fronting of /S/ emerges in
the comparison between Nguyen (2006), Nguyen and Anderson
(2006), and the current study. To summarize the patterns: Nguyen
(2006) reports context-based fronting for Wolfram’s 1966 middle-
class Detroit AA speakers in which pre-alveolar tokens are more
fronted than pre-velar ones. The same pattern holds for her contem-
porary sample of Detroit AAs spanning the entire social status spec-
trum. The current study reports the same pattern for both Detroit AA
Southern migrant participants as well as AP Southern migrant parti-
cipants, and Nguyen and Anderson (2006) show that this pattern
also exists in the speech of White Detroiters. /S/ fronting may be
unrelated across the different communities in the Detroit area, or it
may be a result of dialect contact. The question may be resolved by
examining the patterns of fronting among Wolfram’s 1966 White
speakers, which is open for future research.
6.5 Nguyen and Anderson’s (2006) comparisons of /u/
fronting among African American and Midwestern
Whites in the Detroit area
In addition to the contextually conditioned fronting of /S/ discussed
above, Nguyen and Anderson (2006) also compare context-based
patterns of fronting for /u/ for contemporary Detroit AA speakers and
Detroit Whites. Table 6.16 and Figures 6.8 and 6.9 show F2 values
at the midpoint and offset by speaker group and following phonetic
context. The tables and figures demonstrate that /u/ fronting, like the
results for /S/ fronting reported above, is contextually conditioned for
both the Detroit AA participants and the Detroit White participants.
The results of four ANOVA analyses, one for both the midpoint
and offset measures for AA and White speakers, along with Scheffe
post-hoc tests, are displayed in Table 6.17.
Table 6.17 shows that among AA speakers, tokens with all three
types of following consonants are significantly different from one
another. Among White speakers, however, pre-labial tokens are signi-
ficantly less fronted than tokens in other contexts; however, at both
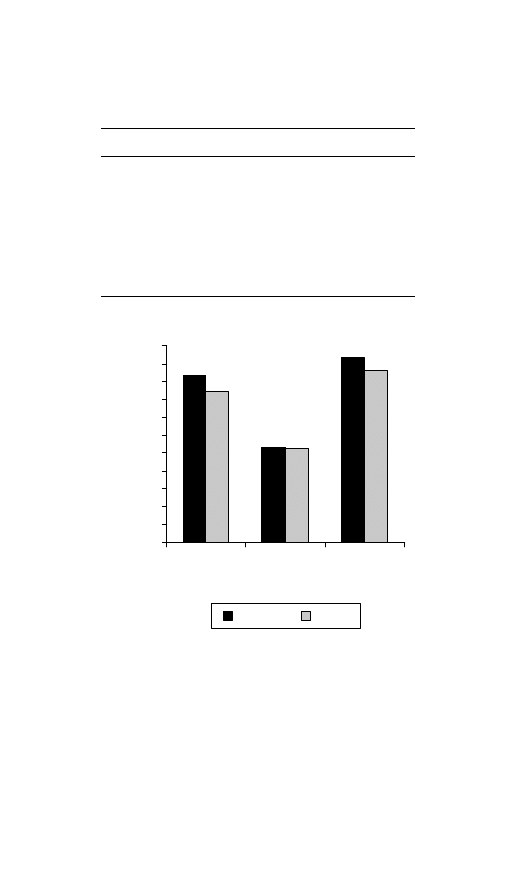
November 2007
MAC/MAL
Page-95
9780230_008861_07_cha06
The High and Lower-High Back Vowels
95
Table 6.16
Following places of articulation for /u/ F
2
by
ethnic group (Nguyen and Anderson 2006)
N
Midpoint
Offset
African American
Word boundary
130
1868
1693
Labial
35
1060
1051
Alveolar
95
2065
1916
White
Word boundary
68
1859
1753
Labial
25
1296
1301
Alveolar
22
1897
1805
0
200
400
600
800
1000
1200
1400
1600
1800
2000
2200
F
2
of /u
/ (in Hz)
Following place of articulation
Midpoint
Offset
Word
boundary
Labial
Alveolar
Figure 6.8
Mean African American /u/ F
2
measures at midpoint and offset for
word boundary, labial, and alveolar following contexts (Nguyen and Anderson
2006)
midpoint and offset, the pre-word boundary and pre-alveolar tokens
do not differ significantly from one another.
Finally, multivariate analyses, in which following place of articula-
tion, speaker ethnicity, and the interaction of these two predictors are

November 2007
MAC/MAL
Page-96
9780230_008861_07_cha06
96
Table 6.17
The results of four ANOVA analyses, one for both the midpoint
and offset measures for African American and White speakers, along with
Scheffe post-hoc tests (Nguyen and Anderson 2006)
Ethnicity
Dependent
variable
Following
place
Following
place
Mean
difference
(I
−J)
Sig.
African
American
Midpoint
Word
boundary
Labial
80889
∗
0000
Alveolar
−19668
∗
0002
Labial
Word
boundary
−80889
∗
0000
Alveolar
−100557
∗
0000
Alveolar
Word
boundary
19668
∗
0002
Labial
100557
∗
0000
Offset
Word
boundary
Labial
64168
∗
0000
Alveolar
−22265
∗
0001
Labial
Word
boundary
−64168
∗
0000
Alveolar
−86432
∗
0000
Alveolar
Word
boundary
22265
∗
0001
Labial
86432
∗
0000
White
Midpoint
Word
boundary
Labial
56324
∗
0000
Alveolar
−3889
0894
Labial
Word
boundary
−56324
∗
0000
Alveolar
−60213
∗
0000
Alveolar
Word
boundary
3889
0894
Labial
60213
∗
0000
Offset
Word
boundary
Labial
45161
∗
0000
Alveolar
−5234
0822
Labial
Word
boundary
−45161
∗
0000
Alveolar
−50395
∗
0000
Alveolar
Word
boundary
5234
0822
Labial
50395
∗
0000
∗
The mean difference is significant at the 0.05 level.
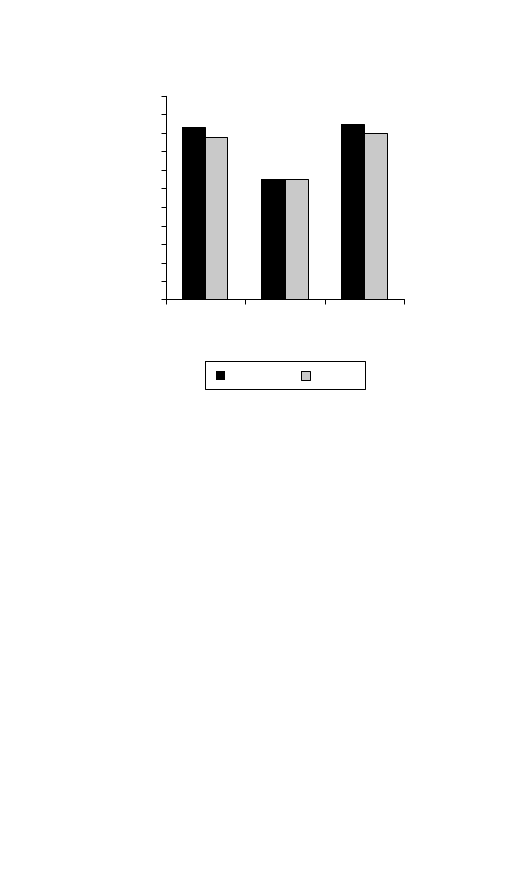
November 2007
MAC/MAL
Page-97
9780230_008861_07_cha06
The High and Lower-High Back Vowels
97
Following place of articulation
Midpoint
Offset
Word
boundary
Labial
Alveolar
0
200
400
600
800
1000
1200
1400
1600
1800
2000
2200
F
2
of /u
/ (in Hz)
Figure 6.9
Mean White /u/ F
2
measures at midpoint and offset for word
boundary, labial, and alveolar following contexts (Nguyen and Anderson
2006)
included for each point of measurement, yield the results presented
in Table 6.18.
The significance levels in Table 6.18 indicate that following place of
articulation is a highly significant predictor of /u/ fronting. Speakers’
ethnicity, however, is less a significant predictor; it appears that at
both midpoint and offset measures, the difference between AA and
White speakers is accounted for by the differing effects that the
following place of articulation has on each group. At midpoint and
offset, the effect of the following context is significantly different
for speaker group. To illustrate how the different speaker groups are
affected by the following contexts, Nguyen and Anderson (2006)
present the graphs (Figures 6.10 and 6.11) of the estimated marginal
means that result from the multivariate analyses.
Nguyen and Anderson (2006) demonstrate that the multivariate
models, like the earlier descriptive statistics, show that pre-labial /u/
tokens are backed when compared to pre-word boundary and pre-
alveolar tokens, and pre-alveolar tokens show the highest degree
of fronting. Further, these graphs reveal that following place of
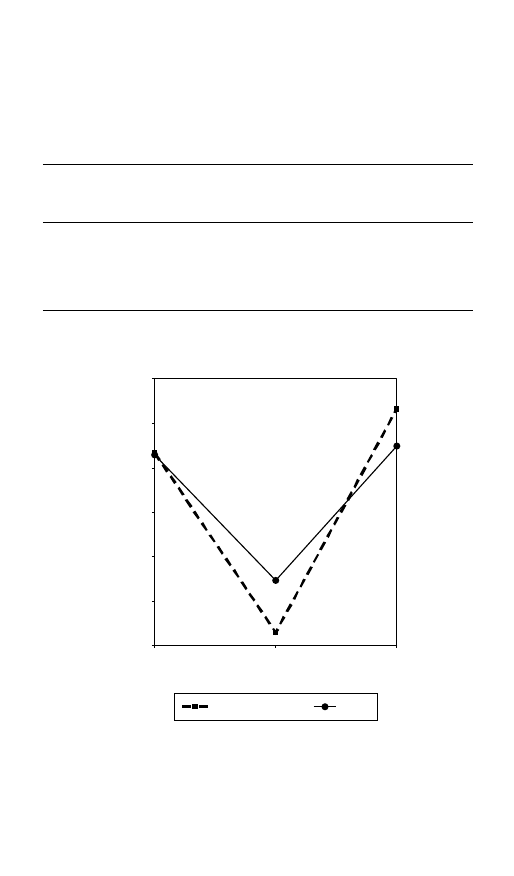
November 2007
MAC/MAL
Page-98
9780230_008861_07_cha06
98
Table 6.18
Multivariate analysis testing place of articulation, speaker ethni-
city, and the interaction of the two predictors at midpoint and offset (Nguyen
and Anderson 2006)
Predictor
Midpoint
significance
level
Offset
significance
level
Intercept
0000
0000
Following place of articulation
0000
0000
Speaker ethnicity
0690
0214
Following place
∗
Speaker
ethnicity
0013
0050
Following place of articulation
Alveolar
Labial
Word boundary
Estimated marginal means
2200
2000
1800
1600
1400
1200
1000
African American
White
Figure 6.10
Estimated marginal means of /u/ F
2
measures at midpoint
(Nguyen and Anderson 2006)
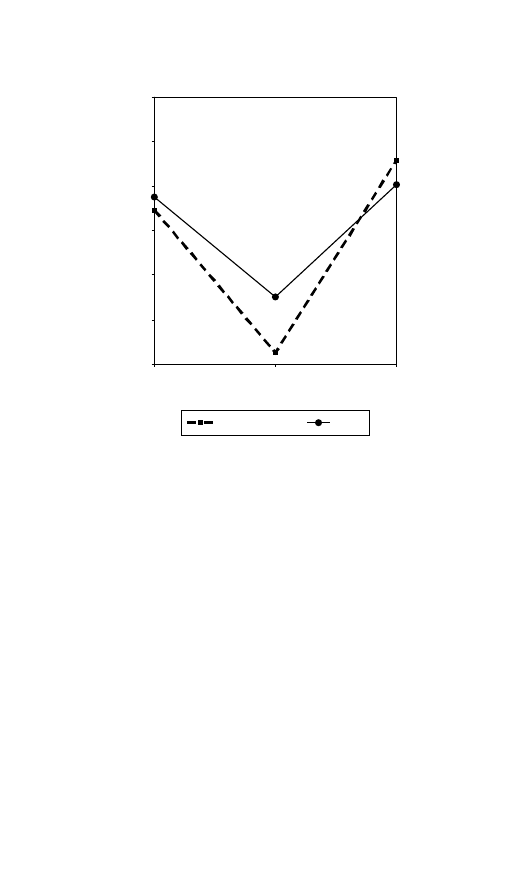
November 2007
MAC/MAL
Page-99
9780230_008861_07_cha06
The High and Lower-High Back Vowels
99
Following place of articulation
Alveolar
Labial
Word boundary
Estimated marginal means
2200
2000
1800
1600
1400
1200
1000
African American
White
Figure 6.11
Estimated marginal means of /u/ F
2
measures at offset (Nguyen
and Anderson 2006)
articulation has greater context effects on production of /u/ for AA
speakers than for White speakers. In other words, at both places
of measurements, AA speakers’ pre-labial tokens are further back
and pre-alveolar tokens further front than those produced by White
speakers. Thus, the significant interaction of ethnicity and following
context, found in both multivariate models, can be interpreted as
following context having a greater effect on the /u/ tokens of AA
speakers than on those of White speakers.
6.6 Conclusion
Using systematic spectral measures taken at vowel midpoint and
offset, and using methods and statistical techniques sensitive to vowel
context, I have found fronted variants of /u/ and /S/ for all six of the
AA speakers analyzed here, a small-scale but robust counterexample
to the common assertion that these variants characterize White, but

November 2007
MAC/MAL
Page-100
9780230_008861_07_cha06
100
Migration, Accommodation and Language Change
not Black, speech (see further Section 2.1.4). More generally, these
results provide evidence that at least some AAs do participate in wide-
spread vowel rotations in American English, which have traditionally
been described as restricted to White varieties (e.g. Labov 1994, 2001;
Bailey and Thomas 1998). Finally, I have shown that the AA and AP
production data studied here pattern together with similar fronted
realizations of pre-alveolar /u/ and /S/, compared with backed realiz-
ations of a comparison group of speakers, whose data is reported in
Hillenbrand et al. (1995). The only significant difference by ethnicity
among the Southern migrants was that the AA speakers on average
had a more fronted pre-velar/S/ than the Appalachians.
Similarly to the context-based patterns of fronting reported for the
current study, contextually conditioned patterns of /S/ fronting are
also evident in the study of Detroit AA speech conducted by Nguyen
(2006) and another study conducted by Nguyen and Anderson
(2006). As discussed above, Nguyen (2006) reports context-based
fronting for Wolfram’s 1966 middle-class Detroit AA speakers in
which pre-alveolar tokens are more fronted than pre-velar ones,
while the 1966 working-class AA speakers show no fronting at all.
Her contemporary sample of Detroit AAs spanning the entire social
status spectrum shows the same pattern of contextually conditioned
fronting in which pre-alveolar environments show more fronting
than pre-velar environments. The current study reports the same
pattern of contextually conditioned fronting of /S/ for both Detroit
AA Southern migrant participants as well as AP Southern migrant
participants. Nguyen and Anderson (2006) show that this pattern
also exists in the speech of White Detroiters.
Unfortunately, Nguyen (2006) did not analyze /u/. Patterns
of /u/ fronting are also contextually conditioned in both the
current study as well as those reported by Nguyen and Anderson
(2006). For the Detroit AA and AP Southern migrant participants
in the current study, pre-alveolar /u/ is fronted relative to the
position of pre-labial tokens of /u/, which are backed, and pre-
word-boundary tokens, which fall in the middle of the two
extremes of the front-back dimension of the vowel space. The
same pattern is reported in Nguyen and Anderson (2006), which
compares patterns of /u/ fronting for Detroit AA and Detroit White
speakers; both groups of speakers show contextually-conditioned
fronting in which pre-labial /u/ tokens are backed when compared

November 2007
MAC/MAL
Page-101
9780230_008861_07_cha06
The High and Lower-High Back Vowels
101
to pre-word boundary and pre-alveolar tokens, and pre-alveolar
tokens showing the highest degree of fronting. However, following
place of articulation has greater context effects on production of /u/
for the Detroit AA speakers than for the Detroit White speakers. In
other words, at both midpoint and offset, the AA participants showed
pre-labial tokens further back and pre-alveolar tokens further front
for the F
2
acoustic space than tokens produced by White speakers. In
other words, following context has a greater effect on the /u/ tokens
of AA speakers than on those of White speakers.
Contextually conditioned change progresses in an orderly fashion
through environments: for example, pre-alveolar> pre-final> pre-
labial for the fronting of /u/. Following environments whose acoustic
and articulatory characteristics promote the change would show more
advanced variants than environments which do not. For example,
pre-alveolar contexts are amenable to fronting of the back vowels.
Alveolar consonants are produced with a fronted tongue body; the
acoustic consequence of this gesture is a high F
2
. Back vowels, in
contrast, show a backed tongue body and low F
2
. The constriction
must move forward in the front/back dimension of the articulatory
space to produce an alveolar consonant after a back vowel. Labial
consonants, which show a backed tongue body (and low F
2
), inhibit
fronting. The tongue body shows little or no movement going from
a back vowel into a labial constriction.
For /S/, it is not surprising (from a coarticulatory point of view) that
pre-alveolar environments promote fronting while pre-velar envir-
onments inhibit it. A velar consonant shows a more fronted tongue
body position (and thus a higher F
2
value) when flanked by a front
vowel such as /G/ than for a back vowel such as /S/ (Stevens 1998: 374).
More generally, the results presented in this chapter suggest that
context effects cannot be ignored in investigations of vowel variation
and change in American English. Conversational data is produced
rapidly, and coarticulation makes this motor activity fluent and effi-
cient. Coarticulation binds articulatory gestures into words, phrases,
narratives, and other speech events.

November 2007
MAC/MAL
Page-102
9780230_008861_08_cha07
7
The Patterning of /ai/
/u/ and /S/, discussed in Chapter 6, do not seem to be as socially
salient as /ai/ in varieties of American English (see Section 2.1.4).
In this chapter I analyze speakers’ productions of /ai/ and /?/, both
between groups and on a speaker-by-speaker basis. The first goal is to
quantify diphthongization by comparing F
1
and F
2
movement in /ai/,
which exhibits varying degrees of diphthongization, with F
1
and F
2
movement in /?/, which is used as a reference because it is expected
to be relatively monophthongal (Anderson 2003; forthcoming). The
second goal is to determine to what extent, if any, the African Amer-
ican (AA) and Appalachian White (AP) speakers have similar patterns
of diphthongization and glide-weakening for /ai/, and to determine
the nature of the patterning in terms of voicing context. Section 7.1
presents a group comparison that excludes the older speakers of each
ethnicity. Section 7.2 investigates the patterns for all speakers indi-
vidually, including a comparison with a Midwestern White speaker,
and Section 7.3 summarizes the patterning of /ai/ for the AA parti-
cipants in this study.
Chapter 2 reviewed the literature on the /ai/ diphthong and charac-
terized it as socially salient. To summarize the patterns of realization
for /ai/ that are relevant to this chapter, glide-weakening before voice-
less consonants (“pre-voiceless contexts”)—for example [la:t] “light,”
[sa:t] “sight”—is typically described as a more recent change (Thomas
2001: 37) restricted to some Southern White varieties spoken in areas
not part of the former plantation regions of the South, such as the
Smoky Mountains of Western North Carolina (Anderson 1998, 1999;
Childs 2005) and rural areas of Texas (Thomas 2001: 133–160). The
102

November 2007
MAC/MAL
Page-103
9780230_008861_08_cha07
The Patterning of /ai/
103
traditional pattern in which the /ai/ glide is weakened in pre-voiced
and word-final contexts but robust in pre-voiceless contexts reported
for the White varieties conservative for the /ai/ variable in the former
plantation regions of the South is also the canonical pattern reported
in the literature for AAE. Thomas (2001: 37) characterizes this pattern
as “presumably older” than the pattern of glide-weakening in all
phonetic contexts.
Although glide-weakening of /ai/ in the important pre-voiceless
context is generally not considered to be a feature of AAE, recent
reports suggest it is a change in progress in AAE. Several recent studies
of /ai/ in AAE report glide-weakening in the pre-voiceless context
(Mallinson et al. 2001; Anderson 2002, 2003; Anderson and Frid-
land 2002; Fridland 2004; Childs 2005). The results presented in this
chapter provide additional evidence that this change is not restricted
to Southern White varieties of English as is generally claimed. Indeed,
I will argue in Chapter 8 that /ai/ glide-weakening in the pre-
voiceless phonetic context appears to be a change in progress in
Detroit AAE.
Several different types of methods are utilized in variationist studies
of /ai/. Impressionistic reports dominate sociolinguistic descrip-
tions of /ai/ (Eckert 1996; Edwards 1997; Schilling-Estes 2000;
Anderson 1997, 2002, and others). These studies treat /ai/ in a binary
fashion as either monophthongal or diphthongal. However, Thomas
(2001) points out that the length of the glide varies considerably
between fully diphthongal variants, nuclei with short offglides, and
completely monophthongal variants, which suggests that potentially
important gradient information may be missed if /ai/ is treated as a
binary variable.
Methods for acoustic studies of /ai/ vary. Anderson’s (1999) study
of Snowbird Cherokee English took F
1
and F
2
measurements at vowel
midpoint and 25 ms from the end of the vowel offset. Thomas (2001)
took measurements of the first two formants at “25 to 45 ms from
the beginning of the vocoid for the nucleus and between 25 and 45
ms from the end of the glide” for non-Texas speakers. For the Texas
speakers, his readings were taken “ in the center of steady states,
or where F
2
changed trajectory if no steady state was present (but not
closer than 25 ms to the end of the vocoid)” (12). Thomas (2000)
investigated the effects of voicing on the first two formants of /ai/
and reported that measurements were taken from a window 45–25 ms

November 2007
MAC/MAL
Page-104
9780230_008861_08_cha07
104
Migration, Accommodation and Language Change
before the end of the diphthong. For Wolfram and Thomas’s (2002)
study of Hyde County vowels, Thomas took F
1
and F
2
measurements
from a 20 ms window at vowel midpoint for monophthongs and, for
diphthongs, at 25–45 ms from the beginning as well as the end of
the diphthong. Fridland (2004) took F
1
and F
2
measurements “ by
examining LPC peaks, spectrograms, energy and pitch of the signal to
determine steady state or central tendency” and extracted “repres-
entative LPC values of both nuclear and glide segments. ” Frid-
land essentially looked at the signal displayed in a spectrogram to
decide where to take her measurements: “Generally, glide readings
were taken at the maximal point of expected glide direction before
any following environmental transition.” Unfortunately, not estab-
lishing precise temporal locations for measurements makes it difficult
to replicate studies or to cross-compare results.
Although each of the acoustic studies described above reports
varying degrees of diphthongization, none of them describes the
length and direction of glide movement for F
1
and F
2
in a precise
manner. For example, Fridland (2004) analyzes gradient variants of
/ai/, but her methods of analyzing glide length and direction are
based on impressionistic observations of spectrograms rather than a
replicable procedure based on precise temporal locations in the signal.
She categorized monophthongal tokens as those “ show(ing) only
steady state readings throughout the segment,” and claims to “fully
account for the glide target range in the data” by examining two
categories of “shortened glides.” By visually inspecting the acoustic
signal in a spectrogram, she tabulated “glide targets that fell between
100 and 200 Hertz of the nucleus” as “short” and “glide targets
which had readings which fell within 100 Hertz of the nucleus” as
“very short.” Glides which showed “much greater extension from the
nucleus (300 to 500 Hertz)” were described as “full.” One potential
difficulty with this method is that measurements taken directly from
a spectrogram display are not precise because of spectral smearing
(Johnson 2003: 43–44). Although Fridland’s work has much advanced
the understanding of /ai/ glide-weakening in American English, she
does not analyze or report whether tokens showed glide movement
in F
1
, F
2
, or both and does not confirm her impressionistic interpret-
ations of vowel plots with statistical results.
This chapter outlines a consistent procedure used to measure dura-
tion and identify temporal locations at which to take measurements

November 2007
MAC/MAL
Page-105
9780230_008861_08_cha07
The Patterning of /ai/
105
for each token of /ai/. Movement in F
1
and F
2
from midpoint to offset
is quantified, and the results are subjected to statistical analysis.
7.1 Comparison by ethnicity, vowel, and context
The differences between formant frequency measurements taken at
midpoint and 25 ms before the end of the offset in F
1
and F
2
were
calculated (see Chapter 5 for an account of the acoustic methods) for
tokens of /?/ and /ai/ from the four youngest speakers in the AP and
AA groups. The two older speakers are excluded from this part of the
analysis because the goal is to examine patterns of use by following
phonetic context. The older speakers show a pattern of following
voice conditioning for /ai/ glide-weakening while middle-aged and
younger speakers do not. Although /?/ is less diphthongal than /ai/,
some movement in F
1
and F
2
is expected due to coarticulation with
the following consonant. A completely glide-weakened or monoph-
thongal /ai/ should show no more movement than /?/, whereas a
diphthongal /ai/ will show movement resulting from both phonetic
context and some degree of movement into the second element of
the diphthong (usually a low, mid, or high front vowel depending
on the degree of weakening). Tables 7.1 and 7.2 show the change in
Hz from midpoint to offset in F
1
and F
2
for both vowels, ethnicities,
and voiced versus voiceless contexts.
Two GLM analyses of variance were conducted (for F
1
and F
2
move-
ment) with three independent factors: vowel (/?/ and /ai/), ethni-
city (AA and AP), and context (voiced and voiceless). That different
numbers of tokens were measured for the different combinations of
vowels and environments is not a problem for the GLM procedure,
which works with both balanced and unbalanced models. Tables 7.3
and 7.4 show the main effects for vowel, ethnicity, and context, and
the interactions.
For F
1
, the significant main effect for vowel (p < 0.001) shown in
Table 7.3 demonstrates that movement for /ai/ (mean 139 Hz, stdev
141 Hz) was significantly greater than that for /?/ (mean 68 Hz, stdev
133 Hz) overall. There was also a significant main effect for environ-
ment (p < 0.001), with change from midpoint to offset for pre-voiced
vowels (mean 125 Hz, stdev 145 Hz) being greater than that for pre-
voiceless vowels (mean 92 Hz, stdev 136 Hz). Although there was
no significant main effect for ethnicity, ethnicity had a significant

November 2007
MAC/MAL
Page-106
9780230_008861_08_cha07
106
Migration, Accommodation and Language Change
Table 7.1
F
1
movement (in Hz) from midpoint to offset for /
?
/ and /ai/ by
ethnicity and context. A positive value indicates raising
Ethnicity
Vowel
Context
Mean
Stdev
N
AA
/
?
/
Voiced
91
148
113
Voiceless
64
140
105
Total
78
144
218
/ai/
Voiced
164
141
135
Voiceless
106
118
164
Total
132
132
299
AP
/
?
/
Voiced
69
113
110
Voiceless
37
109
80
Total
56
112
190
/ai/
Voiced
160
148
120
Voiceless
136
159
98
Total
149
153
218
Total
/
?
/
Voiced
80
132
223
Voiceless
53
128
185
Total
68
131
408
/ai/
Voiced
162
144
255
Voiceless
117
135
262
Total
139
141
517
interaction with vowel (p < 0.05), so it is necessary to investigate
differences by ethnicity within vowels. The differences in F
1
move-
ment by ethnicity within vowels can be seen in Table 7.5, which
shows the estimated marginal means for the interactions of these
factors. Movement for /ai/ is not significantly different by ethnicity,
as the mean AA movement falls within the 95% confidence interval
of the mean AP movement, and vice versa. For /?/, the AA mean of
77 Hz, with the confidence interval [59, 95], is higher than the AP
mean of 53 Hz (C.I. [34, 73]). Although each group’s mean is beyond
the other group’s interval, the AA group’s lower bound of 59 Hz is
exceeded by the AP’s upper bound of 73 Hz. The difference between
the group means (24 Hz) is thus not very substantial. The interesting
result for this study, however, is not the (slight) difference in F
1
for
/?/ by environment and ethnicity, but rather the lack of a difference
in F
1
for /ai/.
For F
2
, there was a significant main effect for vowel (p < 0.001),
which means that overall movement for /ai/ (mean –179 Hz, stdev

November 2007
MAC/MAL
Page-107
9780230_008861_08_cha07
The Patterning of /ai/
107
Table 7.2
F
2
movement (in Hz) from midpoint to offset for /
?
/ and /ai/ by
ethnicity and context. A negative value indicates fronting
Ethnicity
Vowel
Context
Mean
Stdev
N
AA
/
?
/
Voiced
−59
223
113
Voiceless
−46
143
105
Total
−53
189
218
/ai/
Voiced
−139
195
135
Voiceless
−164
211
164
Total
−153
204
299
AP
/
?
/
Voiced
−29
195
110
Voiceless
−33
179
80
Total
−31
188
190
/ai/
Voiced
−214
230
120
Voiceless
−215
238
98
Total
−215
233
218
Total
/
?
/
Voiced
−44
210
223
Voiceless
−40
160
185
Total
−42
189
408
/ai/
Voiced
−174
215
255
Voiceless
−183
223
262
Total
−179
219
517
218) was significantly greater than that for /?/ (mean –47 Hz, stdev
187). There was no main effect for environment, nor did environ-
ment participate in any significant interactions. Voicing, therefore,
does not appear to influence fronting, at least not on a group basis.
Later, we will see that this does not hold for every individual. As with
F
1
, there was a significant interaction between vowel and ethnicity
(p < 0.01). Estimated marginal means are shown as before in Table 7.6.
In this case, the difference lies with /ai/ rather than /?/. The AA
group’s mean of –52 Hz (C.I. [–80, –25]) is significantly less (in abso-
lute value) than that of the AP group’s mean of –215 Hz (C.I. [–242,
–187]), which means that the AP group’s /ai/ was overall more diph-
thongal in F
2
than the AA group’s /ai/.
I also investigated differences in duration by ethnicity, vowel, and
context. A GLM analysis showed significant interactions among all
three of these factors (F(1,908)
= 4.322, p < 0.038), with estimated
marginal means shown in Table 7.7. In order from longest to shortest

November 2007
MAC/MAL
Page-108
9780230_008861_08_cha07
108
Table 7.3
ANOVA of main effects and interactions for F
1
movement
Dependent variable: F
1
mid-off
Source
Type III sum
of squares
df
Mean square
F
Sig.
ETHNICITY
6 841535
1
6 841535
0374
0541
VOWEL
1 290 306553
1
1 290 306553
70592
0000
CONTEXT
273 902455
1
273 902455
14985
0000
ETHNICITY
∗
VOWEL
78 018610
1
78 018610
4268
0039
ETHNICITY
∗
CONTEXT
11 641470
1
11 641470
0637
0425
VOWEL
∗
CONTEXT
7 675967
1
7 675967
0420
0517
ETHNICITY
∗
VOWEL
∗
CONTEXT
22 212485
1
22 212485
1215
0271
Error
1 6761 2525
917
18 278356
Total
2 9117 2040
925
Corrected
total
1 8390 5531
924
Table 7.4
ANOVA of main effects and interactions for F
2
movement
Dependent variable: F
2
mid-off
Source
Type III sum
of squares
df
Mean square
F
Sig.
ETHNICITY
96871482
1
96 871482
2303
0129
VOWEL
4439337901
1
4 439 337901
105544
0000
CONTEXT
3754814
1
3 754814
0089
0765
ETHNICITY
∗
VOWEL
396369467
1
396 369467
9424
0002
ETHNICITY
∗
CONTEXT
623095
1
623095
0015
0903
VOWEL
∗
CONTEXT
16876140
1
16 876140
0401
0527
ETHNICITY
∗
VOWEL
∗
CONTEXT
24192667
1
24 192667
0575
0448
Error
385702208
917
42 061309
Total
564260330
925
Corrected
total
433993601
924

November 2007
MAC/MAL
Page-109
9780230_008861_08_cha07
109
Table 7.5
Estimated marginal means for F
1
midpoint-to-offset movement (in
Hz) by ethnicity and vowel
Ethnicity
Vowel
Mean
Std. error
95% Confidence interval
Lower bound
Upper bound
AA
/
?
/
77
9163
59
95
/ai/
135
7856
119
150
AP
/
?
/
53
9933
34
73
/ai/
148
9204
130
166
Table 7.6
Estimated marginal means for F
2
movement by ethnicity and
vowel
Ethnicity
Vowel
Mean
Std. error
95% Confidence interval
Lower bound
Upper bound
AA
/
?
/
−52
13900
−80
−25
/ai/
−152
11917
−175
−128
AP
/
?
/
−31
15068
−61
−1
/ai/
−215
13962
−242
−187
Table 7.7
Estimated marginal means for duration by ethnicity, vowel, and
environment
Ethnicity Vowel Context Mean Std. error
95% Confidence interval
Lower bound Upper bound
AA
/
?
/
Voiced
181
6634
168
194
Voiceless
161
6882
147
174
/ai/
Voiced
222
6069
210
234
Voiceless
137
5506
127
148
AP
/
?
/
Voiced
141
6723
127
154
Voiceless
136
7884
121
152
/ai/
Voiced
157
6754
144
171
Voiceless
128
7312
114
143

November 2007
MAC/MAL
Page-110
9780230_008861_08_cha07
110
Migration, Accommodation and Language Change
vowels, both groups have the same ranking: pre-voiced /ai/ > pre-
voiced /?/ > pre-voiceless /?/ > pre-voiceless /ai/. There is a signi-
ficant difference between the groups, however. For the AA group,
each vowel is significantly shorter than the previous one in the
list, with differences of 41 ms, 20 ms, and 24 ms, respectively. For
the AP group, however, pre-voiceless /?/ is not significantly shorter
than pre-voiced /?/ (5 ms), and pre-voiceless /ai/ is not signific-
antly shorter than pre-voiceless /?/ (8 ms). In other words, voicing
context has much stronger conditioning effects on vowel duration
for the AA group than for the AP group. Another contrast is that
the AA group has significantly longer /ai/ in the pre-voiced envir-
onment (222 ms, C.I. [210, 234]) than the AP group (157 ms, C.I.
[144, 171]), but not in the pre-voiceless environment, where the
difference was only 9 ms. I do not have an explanation for these
patterns and a more detailed analysis of duration is open for future
analysis.
7.2 Speaker-by-speaker analysis
This section analyzes the ways in which individual speakers instan-
tiate patterns of glide-weakening/diphthongization discussed in the
previous section and in the literature. In mainstream varieties of
American English, /ai/ is diphthongized across the board. In tradi-
tional Southern White and AA varieties, /ai/ is glide-weakened in pre-
voiced contexts and diphthongized in pre-voiceless contexts. In some
AP and progressive Southern White varieties, /ai/ is glide-weakened
across the board. Table 7.8 summarizes these patterns.
7.2.1 Data overview
The dataset is the same as in the previous section, except for the
inclusion of all six AA speakers and all six AP speakers. For each vowel,
the relevant dependent variables are F
1
movement (F
1
frequency at
midpoint minus that at offset) and F
2
movement (F
2
frequency at
midpoint minus that at offset). In this speaker-by-speaker analysis,
the independent variables are vowel (/ai/ or /?/) and context (voiced
or voiceless). Average movement, standard deviations, and n for each
speaker in F
1
and F
2
are shown in Tables 7.9 (AA speakers) and 7.10
(AP speakers).

November 2007
MAC/MAL
Page-111
9780230_008861_08_cha07
The Patterning of /ai/
111
Table 7.8
Previously reported patterns of /ai/ glide-weakening in varieties of
American English
Pre-voiced /ai/
glide-weakening
Pre-voiceless /ai/
glide-weakening
Mainstream American English
No
No
Traditional Southern White
Yes
No
African American
Yes
Only recently reported
∗
Appalachian White
Yes
Yes
Progressive Southern White
Yes
Yes
∗
Anderson (2002, 2003); Anderson and Fridland (2002); Fridland (2004); Mallinson et al.
(2001); Childs (2005).
7.2.2 Statistical analysis
For each speaker, two GLM analyses of variance were conducted, one
for F
1
movement and one for F
2
movement, in order to test for main
effects and interactions of vowel and context. In the discussion that
follows, I report only the significant results.
7.2.2.1 Main effects
First, I discuss main effects for vowel. A significant main effect by
vowel means that movement for /ai/ was significantly greater than
that for /?/ across phonetic contexts (voiced and voiceless). If there is
no main effect for vowel and no significant interaction with context,
then there was no significant difference at all in movement between
/ai/ and /?/. Such a speaker could be classified as showing across-the-
board /ai/ glide-weakening. If there was no significant main effect
but a significant interaction between vowel and context, then one
has to examine vowels within voicing context and voicing context
within vowels. Such interactions are examined later.
All speakers except for 1 (AA), 3 (AA), and 11 (AP) show a significant
main effect for vowel in F
1
movement (Table 7.11). Speaker 1’s F
1
values had significant interactions between vowel and voicing, which
will be addressed later. F
1
movement for Speakers 3 and 11 had no
significant interaction, so at this point we can conclude that for
these two speakers there is no significant difference in F
1
movement
between /?/ and /ai/.
For F
2
movement, all speakers except 9 (AP) and 11 (AP) showed
significant main effects of vowel, with more movement for /ai/ than

November 2007
MAC/MAL
Page-112
9780230_008861_08_cha07
112
Table 7.9
Average F
1
and F
2
midpoint-to-offset movement (in Hz) by vowel
and context for individual AA speakers
Speaker
Vowel
Context
F
1
movement
F
2
movement
Mean
Stdev
N
Mean
Stdev
N
1
/
?
/
Voiced
12739
131741
18
−7950 186897
18
Voiceless
6111
110370
9
6167
135156
9
Total
10530
126925
27
−3244 181821
27
/ai/
Voiced
8094
79739
31
−1400 118507
31
Voiceless
12697
96111
39
−27195 237004
39
Total
10659
91554
70
−15771 231723
70
2
/
?
/
Voiced
5819
80173
37
2041
172069
37
Voiceless
4253
83210
38
5005
116472
38
Total
5025
81554
75
3543
146319
75
/ai/
Voiced
15881
97647
53
−35866 196287
53
Voiceless
20090
83746
68
−39176 211679
68
Total
18246
92126
121
−37726 204903 121
3
/
?
/
Voiced
4865
136866
17
535
140514
17
Voiceless
9871
92619
7
−6700
89327
7
Total
6325
125735
24
−1575 130174
24
/ai/
Voiced
9396
107416
24
−9783 169617
24
Voiceless
7233
101816
40
−18110 189244
40
Total
8044
103639
64
−14988 185268
64
4
/
?
/
Voiced
9376
113259
21
−7181 139112
21
Voiceless
6039
126155
46
−5076 138754
46
Total
7085
122400
67
−5736 138159
67
/ai/
Voiced
15876
155053
33
−11945 174965
33
Voiceless
9530
121145
56
−20075 226117
56
Total
11883
137350
89
−17061 211298
89
5
/
?
/
Voiced
12853
162196
49
−8839 278117
49
Voiceless
9337
145215
35
−4137 137627
35
Total
11388
155423
84
−6880 230293
84
/ai/
Voiced
19433
159821
33
−19545 265940
33
Voiceless
14708
142839
38
−9692 207354
38
Total
16904
151738
71
−14272 239806
71
6
/
?
/
Voiced
4435
137131
26
−3577 203482
26
Voiceless
29
167302
17
−3235 189140
17
Total
2693
149436
43
−3442 195644
43
/ai/
Voiced
18302
119616
45
−13407 153362
45
Voiceless
11773
77040
30
−15753 204240
30
Total
15691
108951
75
−14345 174546
75

November 2007
MAC/MAL
Page-113
9780230_008861_08_cha07
113
Table 7.10
Average F
1
and F
2
midpoint-to-offset movement in Hz by vowel
and context for individual AP speakers
Speaker
Vowel
Context
F
1
movement
F
2
movement
Mean
Stdev
N
Mean
Stdev
N
7
/
?
/
Voiced
12874
122151
23
2161
155143
23
Voiceless
5000
125733
25
3396
149181
25
Total
8773
128984
48
2804
150565
48
/ai/
Voiced
17604
152890
28
−4354
168868
28
Voiceless
13148
131153
29
−4848
164502
29
Total
15337
142744
57
−4605
165184
57
8
/
?
/
Voiced
12411
120193
36
−5103
210904
36
Voiceless
4914
85733
21
−6667
164884
21
Total
9649
113952
57
−5679
193824
57
/ai/
Voiced
25705
186023
22
−35032
304940
22
Voiceless
15230
164711
23
−28500
292059
23
Total
20351
181340
45
−31693
296851
45
9
/
?
/
Voiced
3567
107090
24
−11783
250100
24
Voiceless
5307
152010
15
−3927
245914
15
Total
4236
124611
39
−8762
248271
39
/ai/
Voiced
14778
101246
23
−18852
196279
23
Voiceless
15936
201613
33
−16158
236655
33
Total
15461
166682
56
−17264
219486
56
10
/
?
/
Voiced
2283
95394
29
824
128129
29
Voiceless
1292
93047
25
016
115789
25
Total
1824
93557
54
450
121494
54
/ai/
Voiced
12241
113311
54
−20493
204811
54
Voiceless
14048
130910
23
−24300
243199
23
Total
12781
118254
77
−21630
216059
77
11
/
?
/
Voiced
3111
119467
18
−5328
141340
18
Voiceless
1175
114457
20
4520
99188
20
Total
2092
115676
38
−145
129282
38
/ai/
Voiced
1576
120567
17
−3824
158657
17
Voiceless
229
93267
21
−7590
90028
21
Total
832
105044
38
−5905
125007
38
12
/
?
/
Voiced
7719
90596
21
5895
122222
21
Voiceless
4326
115376
19
−3505
208134
19
Total
6107
103186
40
1430
172959
40
/ai/
Voiced
16824
184073
21
−12405
180652
21
Voiceless
7142
60039
19
−18916
127694
19
Total
12225
146414
40
−15498
159204
40

November 2007
MAC/MAL
Page-114
9780230_008861_08_cha07
114
Migration, Accommodation and Language Change
Table 7.11
Main effects of vowel on F
1
and F
2
midpoint-to-offset movement
Ethnicity
Speaker
df
F
1
movement
F
2
movement
F
Sig.
F
Sig.
AA
1
(1,96)
0167
0.684
9033
0.003
2
(1,195)
101958
0.000
226449
0.000
3
(1,87)
0110
0.741
6101
0.016
4
(1,155)
5064
0.026
10014
0.002
5
(1,154)
5750
0.018
4605
0.033
6
(1,117)
28451
0.000
9670
0.002
AP
7
(1,104)
5987
0.016
5525
0.021
8
(1,101)
16821
0.000
26946
0.000
9
(1,94)
11278
0.001
3779
0.055
10
(1,130)
31582
0.000
45002
0.000
11
(1,75)
0233
0.631
3501
0.065
12
(1,79)
4699
0.033
21275
0.000
for /?/. Speaker 9 had no significant interactions, so vowel has no
influence on her F
2
movement. Speaker 11 had a significant inter-
action for F
2
movement, to be addressed in the next section. In
summary, all of the speakers either had a significant main effect of
vowel in F
1
or F
2
movement, or had a significant interaction in F
1
or F
2
. There was no speaker who had no main effect of vowel for F
1
and F
2
and no interaction, that is, no speaker for whom we can yet
conclude that there was no difference whatsoever by vowel.
Table 7.12 summarizes the results for the main effect of voicing
context, summing across /ai/ and /?/. A significant main effect means
that there was a significant overall difference in movement between
voiced and voiceless contexts, regardless of the vowel. For F
1
, five
speakers had such effects (4, 6, 7, 8, and 12) and each of them had a
greater midpoint-to-offset change in voiced contexts. These speakers’
vowel plots are shown in Figures 7.1–7.5. Another five speakers’
vowels (3, 5, 9, 10, and 11) showed no significant main effect and no
interaction, so for these we can conclude that voicing context had
no influence on movement for F
1
, regardless of vowel. The vowels
of Speakers 1 and 2 had no significant main effect, but a significant
interaction, so raising varied with context in one vowel but not the
other, to be examined later. For F
2
, only Speaker 12’s vowels showed a
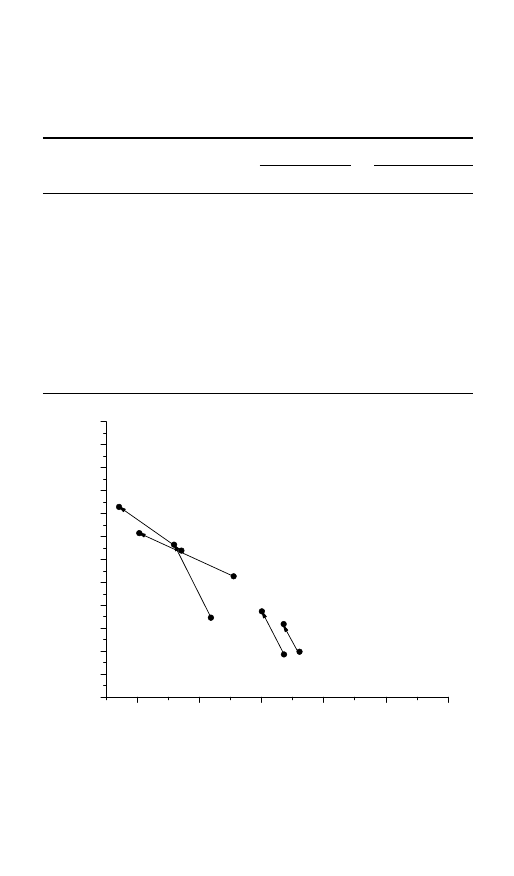
November 2007
MAC/MAL
Page-115
9780230_008861_08_cha07
115
Table 7.12
Main effects of voicing context on F
1
and F
2
midpoint-to-offset
movement
Ethnicity
Speaker
df
F
1
movement
F
2
movement
F
Sig.
F
Sig.
AA
1
(1,96)
0182
0.671
1714
0.194
2
(1,195)
1061
0.304
0004
0.950
3
(1,87)
0248
0.620
00130
0.081
4
(1,155)
4757
0.031
0931
0.336
5
(1,154)
2734
0.100
3689
0.057
6
(1,117)
5186
0.025
0078
0.781
AP
7
(1,104)
5488
0.021
0014
0.906
8
(1,101)
9746
0.002
0248
0.619
9
(1,94)
0199
0.657
1130
0.291
10
(1,130)
0041
0.840
0460
0.499
11
(1,75)
0408
0.525
1151
0.287
12
(1,79)
5653
0.020
4740
0.033
2200
1000
950
900
850
800
750
700
650
600
550
500
450
400
F
2
F
1
ai vl
ai vd
ai wb
ɑ
vd
ɑ vl
2000
1800
1600
1400
1200
Figure 7.1
F
1
and F
2
values (in Hz) for /
?
/ and /ai/ for Speaker 4, an African
American female born in 1974. Arrows indicate midpoint-to-offset movement.
Values are shown by voiced (vd), voiceless (vl), and word-final (wb) contexts.
F
1
movement is greater in pre-voiced contexts
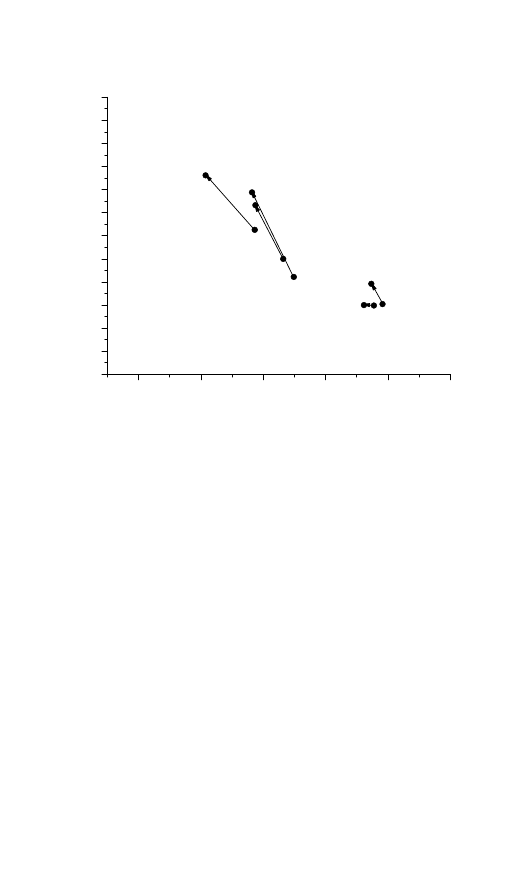
November 2007
MAC/MAL
Page-116
9780230_008861_08_cha07
116
Migration, Accommodation and Language Change
1000
950
900
850
800
750
700
650
600
550
500
450
400
F
1
F
2
ai vl
ai vd
ai wb
ɑ vd
ɑ vl
2200
2000
1800
1600
1400
1200
Figure 7.2
F
1
and F
2
values (in Hz) for /
?
/ and /ai/ for Speaker 6, an African
American female born in 1967. Values are shown by voiced (vd), voiceless
(vl), and word-final (wb) contexts. F
1
movement is greater in pre-voiced
contexts
significant main effect, with more movement in the voiceless context.
All of the other speakers except 1 and 11 have no significant main
effect and no interactions, so for those nine, voicing does not affect F
2
movement regardless of vowel. For Speakers 1 and 11, F
2
movement
varies by context differently by vowel.
7.2.2.2 Interactions of vowel and context
Here I examine the pattern for speakers whose vowels showed signi-
ficant vowel/context interactions: Speakers 1, 2, and 11. Speaker 1’s
vowels had significant interactions for both F
1
(F(1,96)
= 5.592,
p < 0.020) and F
2
(F(1,96)
= 20.016, p < 0.001). Speaker 2’s vowels
had significant interactions only for F
1
(F(1,195)
= 5.069, p < 0.025).
Speaker 11 had significant interactions only for F
2
(F(1,75)
= 5.768,
p < 0.019). Tables 7.13–7.16 show estimated marginal means for
movement by context and vowel.
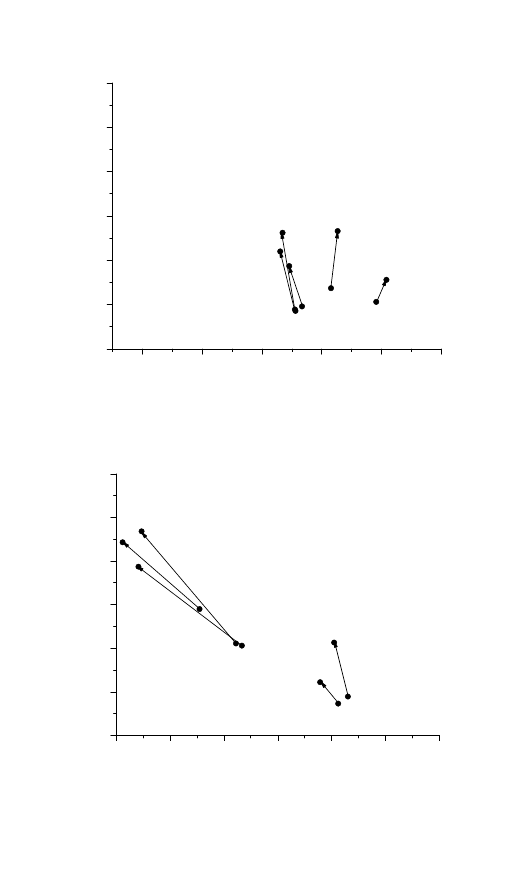
November 2007
MAC/MAL
Page-117
9780230_008861_08_cha07
117
2200
1000
900
800
700
600
500
400
F
2
F
1
ai vl
ai vd
ai wb
ɑ vd
ɑ vl
2000
1800
1600
1400
1200
Figure 7.3
F
1
and F
2
values (in Hz) for /
?
/ and /ai/ for Speaker 7, an
Appalachian female born in 1931. Values are shown by voiced (vd), voiceless (vl),
and word-final (wb) contexts. F
1
movement is greater in pre-voiced contexts
2400
1000
900
800
700
600
500
400
F
2
F
1
ai vl
ai vd
ai wb
ɑ vd
ɑ vl
2200
2000
1800
1600
1400
1200
Figure 7.4
F
1
and F
2
values (in Hz) for /
?
/ and /ai/ for Speaker 8, an
Appalachian female born in 1960. Values are shown by voiced (vd), voiceless (vl),
and word-final (wb) contexts. F
1
movement is greater in pre-voiced contexts
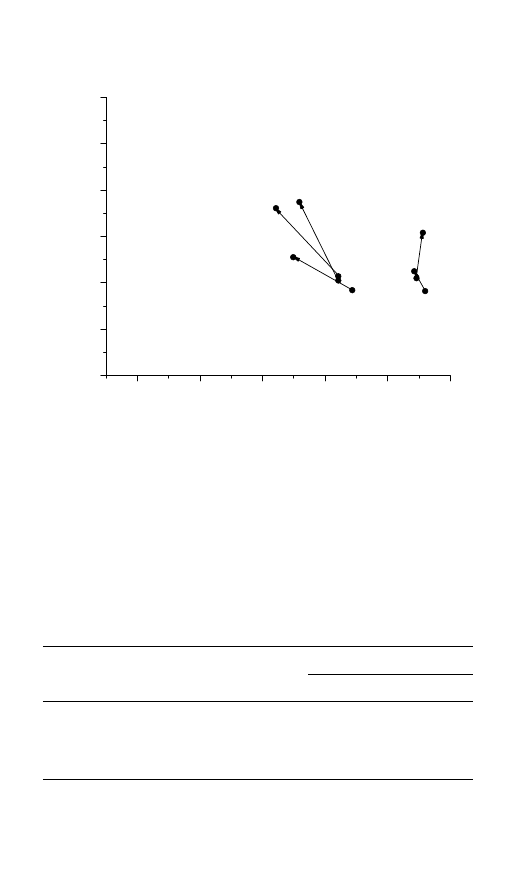
November 2007
MAC/MAL
Page-118
9780230_008861_08_cha07
118
Migration, Accommodation and Language Change
1000
900
800
700
600
500
400
F
1
F
2
ai vl
ai vd
ai wb
ɑ
vd
ɑ
vl
2200
2000
1800
1600
1400
1200
Figure 7.5
F
1
and F
2
values (in Hz) for /
?
/ and /ai/ for Speaker 12, an
Appalachian female born in 1965. Values are shown by voiced (vd), voice-
less (vl), and word-final (wb) contexts. F
1
movement is greater in pre-voiced
contexts. F
2
/ai/ movement is greater in pre-voiceless context
Table 7.13, for Speaker 1, shows that for /?/, the pre-voiced F
1
move-
ment was greater than the pre-voiceless. For /ai/, the pre-voiceless
movement was greater, but not significantly, since the 95% C.I. for
Table 7.13
Estimated marginal means for F
1
movement by environment and
vowel for Speaker 1
Vowel Context Mean (Hz) Std. error (Hz)
95% Confidence interval
Lower bound Upper bound
/
?
/
Voiced
127
23624
80
174
Voiceless
61
33410
-5
127
/ai/
Voiced
81
18002
45
117
Voiceless
127
16049
95
159

November 2007
MAC/MAL
Page-119
9780230_008861_08_cha07
119
Table 7.14
Estimated marginal means for F
2
movement by environment and
vowel for Speaker 1
Vowel Context Mean (Hz) Std. error (Hz)
95% Confidence interval
Lower bound Upper bound
/
?
/
Voiced
−80
44371
−168
9
Voiceless
62
62750
−63
186
/ai/
Voiced
−14
33811
−81
53
Voiceless
−272
30144
−332
−212
Table 7.15
Estimated marginal means for F
1
movement by environment and
vowel for Speaker 2
Vowel Context Mean (Hz) Std. error (Hz)
95% Confidence interval
Lower bound Upper bound
/
?
/
Voiced
58
14303
30
86
Voiceless
43
14114
15
70
/ai/
Voiced
159
11951
135
182
Voiceless
201
10550
180
222
Table 7.16
Estimated marginal means for F
2
movement by environment and
vowel for Speaker 11
Vowel Context Mean (Hz) Std. error (Hz)
95% Confidence interval
Lower bound Upper bound
/
?
/
Voiced
−53
29019
−111
5
Voiceless
45
27530
−10
100
/ai/
Voiced
−38
29861
−98
21
Voiceless
−76
26867
−129
−22
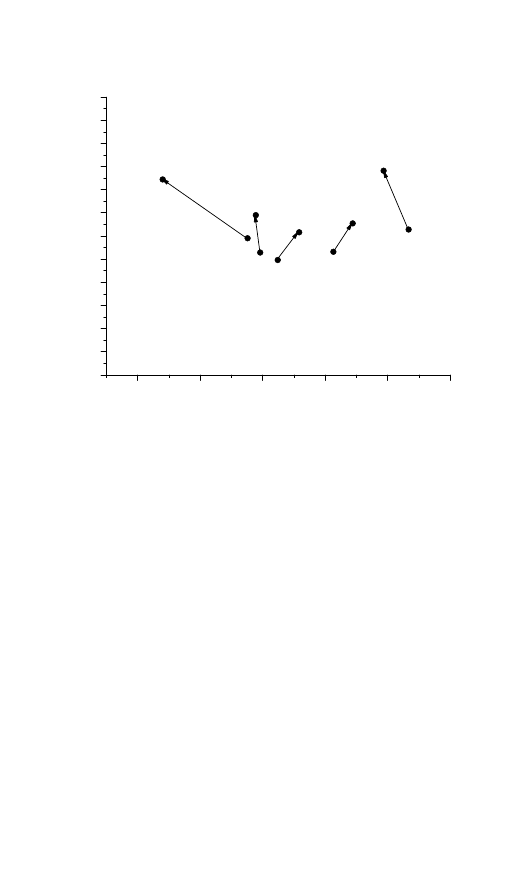
November 2007
MAC/MAL
Page-120
9780230_008861_08_cha07
120
Migration, Accommodation and Language Change
1000
950
900
850
800
750
700
650
600
550
500
450
400
F
1
F
2
ai vl
ai vd
ai wb
ɑ
vd
ɑ
vl
2200
2000
1800
1600
1400
1200
Figure 7.6
F
1
and F
2
values (in Hz) for /
?
/ and /ai/ for Speaker 1, an African
American female born in 1927. Values are shown by voiced (vd), voiceless
(vl), and word-final (wb) contexts. /ai/ movement in F
1
and F
2
is greater in
pre-voiceless context
the pre-voiced context, [45 Hz, 117 Hz], overlaps substantially with
the interval for the pre-voiceless context, [95 Hz, 159 Hz]. The differ-
ence between pre-voiced and pre-voiceless /ai/ glide is especially great
in F
2
(Table 7.14), where the pre-voiceless C.I. is [–332 Hz, –212 Hz]
and pre-voiced is [–63 Hz, 186 Hz]. This speaker instantiates the tradi-
tional AAE pattern of pre-voiced glide-weakening and pre-voiceless
diphthongization for /ai/, which can be seen in the vowel plot in
Figure 7.6. Note the similarity in glide length of the pre-voiced and
word-final environments compared to that of pre-voiceless /ai/.
Speaker 2’s vowel interactions for F
1
are shown in Table 7.15, and
her vowel plot in Figure 7.7. Although Speaker 2’s movements for /ai/
are clearly longer than Speaker 1’s overall (182 Hz versus 107 Hz in F
1
,
and –377 Hz versus –158 Hz in F
2
), they have the same conditioning
pattern of a longer glide in the pre-voiceless context, at least for F
1
.
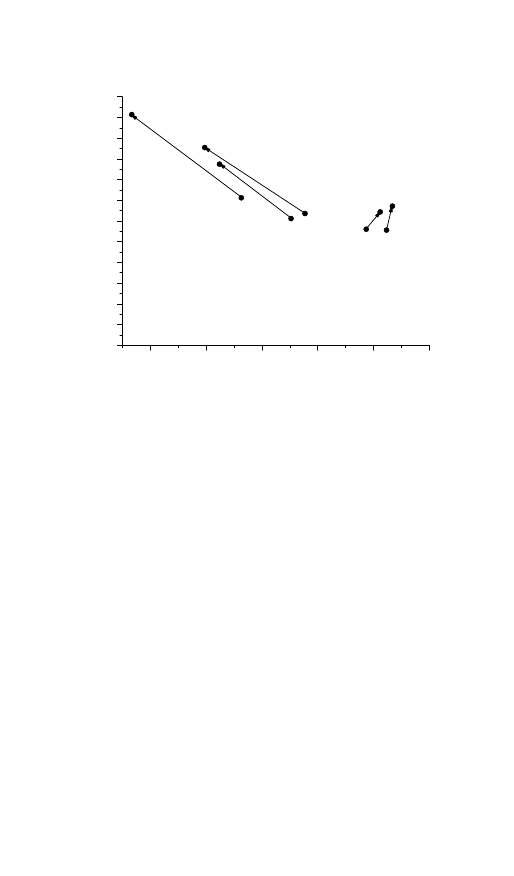
November 2007
MAC/MAL
Page-121
9780230_008861_08_cha07
The Patterning of /ai/
121
2200
1000
950
900
850
800
750
700
650
600
550
500
450
400
F
2
F
1
ai vl
ai vd
ai wb
ɑ vd
ɑ vl
2000
1800
1600
1400
1200
Figure 7.7
F
1
and F
2
values (in Hz) for /
?
/ and /ai/ for Speaker 2, an African
American female born in 1936. Values are shown by voiced (vd), voiceless (vl),
and word-final (wb) contexts. /ai/ movement in F
1
is greater in pre-voiceless
context
It is important to point out that Speaker 1 and Speaker 2 are older
African American females (Speaker 1 was born in 1927; Speaker 2 was
born in 1936). The traditional AA pattern of pre-voiced and pre-word
boundary glide weakening and a robust glide in pre-voiceless contexts
is expected due to the patterns reported in Anderson (2002). In that
study, I found that middle-age and younger speakers showed pre-
voiceless glide-weakening but that older speakers did not.
For Speaker 11 (Table 7.16), the significant F
2
difference by voicing
occurs only for /?/, so there is no difference in F
2
movement by
context for /ai/. Note, however, that the absolute difference in Speaker
11’s F
2
glide length for /?/ is only 8 Hz (–53 Hz pre-voiced and 45 Hz
pre-voiceless), but this is interpreted statistically as 98 Hz because the
pre-voiceless variant glides backward and the pre-voiced one forward
in the vowel space. Given the lack of a significant difference between
/?/ and /ai/ glide length and the lack of context effect on /ai/, this
speaker fits the criteria for across-the-board glide-weakening, shown
in the plot in Figure 7.8.

November 2007
MAC/MAL
Page-122
9780230_008861_08_cha07
122
Migration, Accommodation and Language Change
ai vl
ai vd
ai wb
ɑ vd
ɑ vl
2200
F
2
2000
1800
1600
1400
1200
1000
900
800
700
600
500
400
F
1
Figure 7.8
F
1
and F
2
values (in Hz) for /
?
/ and /ai/ for Speaker 11 (an Appalachian
female born in 1936), who shows across-the-board /ai/ glide-weakening.
Values are shown by voiced (vd), voiceless (vl), and word-final (wb) contexts
Vowel plots for the remaining speakers 3 (AA), 5 (AA), 9 (AP), and
10 (AP) are shown below in Figures 7.9–7.12. These are the speakers
who did not show significant contextual effects for F
1
or F
2
at the
0.05 level for either /?/ or /ai/.
7.2.3 Comparison with a Midwestern White speaker
Table 7.17 and Figure 7.13 show /?/ and /ai/ for Midwestern White
Speaker 13. Recall that comparison with the data reported by Hillen-
brand et al. (1995) is not possible, as they did not investigate /ai/.
For F
1
, a GLM analysis performed as before shows significant main
effects for vowel (F(1,102)
= 10.616, p < 0.002) and context (F(1,102)
= 11.707, p < 0.001). This speaker has greater F
1
movement for /ai/
than /?/ overall (192 Hz versus 65 Hz), and greater movement in pre-
voiced contexts than pre-voiceless ones (109 Hz versus –32 Hz for /?/
and 238 Hz versus 103 Hz for /ai/), presumably because the pre-voiced
vowel is longer. There was no significant vowel by context interac-
tion. For F
2
, there was a significant main effect for vowel (F(1,102)
=
72.180, p < 0.001), with the /ai/ midpoint-to-offset trajectory longer
at –509 Hz compared to /?/ at –12 Hz, and a significant interaction
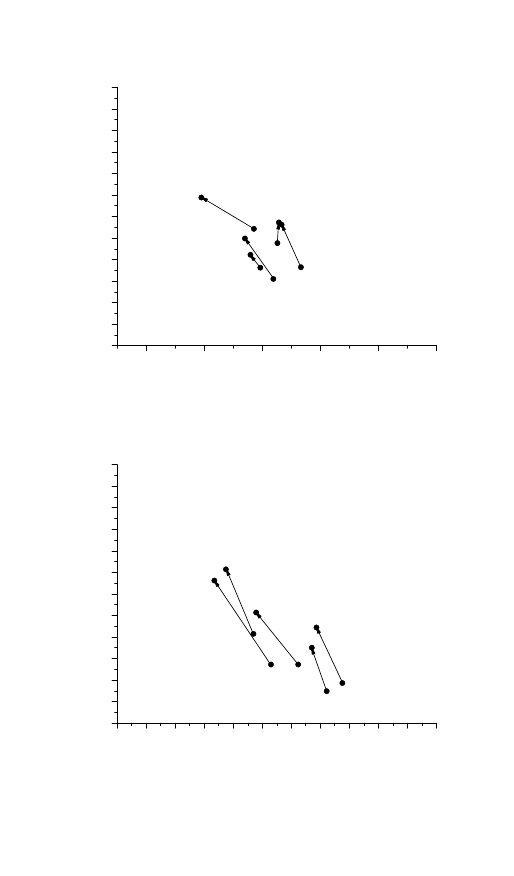
November 2007
MAC/MAL
Page-123
9780230_008861_08_cha07
123
ai vl
ai vd
ai wb
ɑ vd
ɑ vl
1000
950
900
850
800
750
700
650
600
550
500
450
400
F
1
2200
F
2
2000
1800
1600
1400
1200
Figure 7.9
F
1
and F
2
values (in Hz) for /
?
/ and /ai/ for Speaker 3, an African
American female born in 1971. Values are shown by voiced (vd), voiceless
(vl), and word-final (wb) contexts
2300
ai vl
ai vd ai wb
ɑ vd
ɑ vl
1000
950
900
850
800
750
700
650
600
550
500
450
400
F
1
F
2
2200 2100 2000 1900 1800 1700 1600 1500 1400 1300 1200
Figure 7.10
F
1
and F
2
values (in Hz) for /
?
/ and /ai/ for Speaker 5, an African
American female born in 1974. Values are shown by voiced (vd), voiceless
(vl), and word-final (wb) contexts
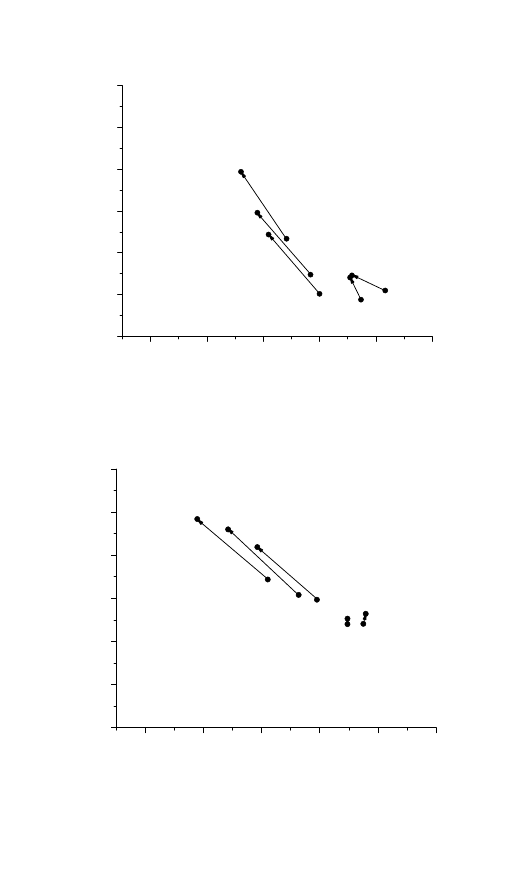
November 2007
MAC/MAL
Page-124
9780230_008861_08_cha07
124
ai vl
ai vd
ai wb
ɑ vd
ɑ vl
1000
900
800
700
600
500
400
F
1
2200
F
2
2000
1800
1600
1400
1200
Figure 7.11
F
1
and F
2
values (in Hz) for /
?
/ and /ai/ for Speaker 9, an
Appalachian female born in 1951. Values are shown by voiced (vd), voiceless
(vl), and word-final (wb) contexts
ai vl
ai vd
ai wb
ɑ vd
ɑ vl
1000
900
800
700
600
500
400
F
1
2200
F
2
2000
1800
1600
1400
1200
Figure 7.12
F
1
and F
2
values (in Hz) for /
?
/ and /ai/ for Speaker 10, an
Appalachian female born in 1949. Values are shown by voiced (vd), voiceless
(vl), and word-final (wb) contexts
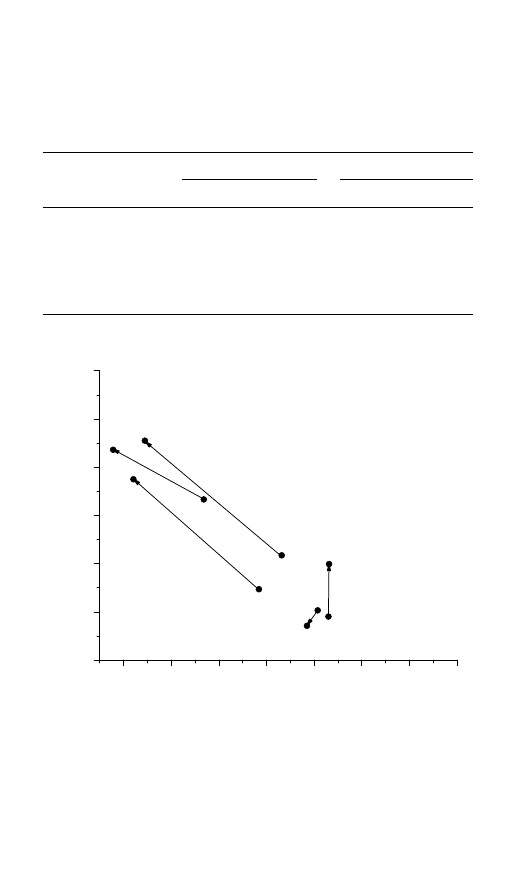
November 2007
MAC/MAL
Page-125
9780230_008861_08_cha07
125
Table 7.17
Average F
1
and F
2
movement (in Hz) by vowel and context for
Midwestern White Speaker 13
F
1
movement
F
2
movement
Vowel
Context
Mean
Stdev
N
Mean
Stdev
N
/
?
/
Voiced
109
219
26
3
186
26
Voiceless
−32
189
12
−45
180
12
Total
65
218
38
−12
183
38
/ai/
Voiced
238
190
43
−575
291
43
Voiceless
103
118
22
−381
242
22
Total
192
180
65
−509
289
65
ai vl
ai vd
ai wb
ɑ vd
ɑ vl
1000
900
800
700
600
500
400
F
1
2600
F
2
2400
2200
2000
1800
1600
1400
1200
Figure 7.13
F
1
and F
2
values (in Hz) for /
?
/ and /ai/ for Speaker 13, a
Midwestern White female born in 1967. Values are shown by voiced (vd),
voiceless (vl), and word-final (wb) contexts

November 2007
MAC/MAL
Page-126
9780230_008861_08_cha07
126
Migration, Accommodation and Language Change
Table 7.18
Estimated marginal means (in Hz) for F
2
movement by environ-
ment and vowel for Midwestern White Speaker 13
Vowel Context Mean (Hz) Std. error (Hz)
95% Confidence interval
Lower bound Upper bound
/
?
/
Voiced
3
48331
−93
98
Voiceless
−45
71142
−186
96
/ai/
Voiced
−575
37582
−650
−500
Voiceless
−381
52542
−485
−277
of vowel with context (F(1,102)
= 5.027, p < 0.027). The estimated
marginal means for the interaction (Table 7.18) shows that F
2
move-
ment for /?/ did not vary significantly by voicing context (a difference
of 48 Hz), but did vary for /ai/ (a difference of 194 Hz). Speaker 13’s F
2
movements for /ai/ (–575 Hz pre-voiced and –381 Hz pre-voiceless) are
substantially greater than those of the AA group (–139 Hz pre-voiced
and –164 Hz pre-voiceless) and the AP group (–214 Hz pre-voiced and
–215 Hz pre-voiceless).
Table 7.19
Summary of /ai/ patterning by speaker. Differences in the third
and fourth columns that are significant at the 0.05 level are in bold
Speaker More movement for
/ai/ than /
?
/ in
F
1
/ai/ movement
greater preceding
F
2
/ai/ movement
greater preceding
1
F
2
Voiceless
Voiceless
2
F
1
and F
2
Voiceless
Voiceless
3
F
2
Voiceless
Voiceless
4
F
1
and F
2
Voiced
Voiceless
5
F
1
and F
2
Voiced
Voiced
6
F
1
and F
2
Voiced
Voiceless
7
F
1
and F
2
Voiced
Voiceless
8
F
1
and F
2
Voiced
Voiced
9
F
1
Voiceless
Voiced
10
F
1
and F
2
Voiceless
Voiceless
11
n/a
Voiced
Voiceless
12
F
1
and F
2
Voiced
Voiceless
13
F
1
and F
2
Voiced
Voiced

November 2007
MAC/MAL
Page-127
9780230_008861_08_cha07
The Patterning of /ai/
127
7.2.4 Summary of speaker-by-speaker analysis
Table 7.19 summarizes the patterns for each speaker. The vowels
of all speakers except 11 showed greater movement for /ai/ than
/?/ in at least one acoustic dimension, and most in both. Where
voicing has a significant conditioning effect, the predominant pattern
is for pre-voiced /ai/ to show greater movement than pre-voiceless
possibly due to longer duration. This is in contrast with the traditional
conditioning pattern of /ai/ glide-weakening in pre-voiced contexts
and diphthongization in pre-voiceless contexts shown by the older
AAs. Speaker 12 is exceptional in that voicing context had opposite
effects on F
1
and F
2
.
7.3 The patterning of /ai/ in Detroit African American
English reported by Nguyen (2006)
Nguyen (2006) analyzed the patterning of /ai/ for both contemporary
Detroit AAE data and a subset of Shuy, Wolfram, and Riley’s Detroit
AAE corpus collected in 1966. She used two methods for taking
acoustic measurements of /ai/. One measure calculated the F
2
differ-
ence within the /ai/ diphthong between the nucleus (/a/) and the
offlgide (/i). The second method examined the F
2
difference between
the nucleus of the /ai/ diphthong and /G/ (with /G/ being extracted
from tokens produced independently from the /ai/ diphthong, e.g.
as in /bGt/ “bit”).
Major findings from Nguyen (2006) are broken down by following
environment; she examined pre-voiced and pre-voiceless tokens. For
pre-voiced tokens, males have more glide-reduction than females
(94). Lower-status speakers show greater glide-reduction than higher-
status speakers (96), and contemporary speakers show more glide-
reduction than 1966 speakers (96).
For pre-voiceless environment, Nguyen (2006) analyzed both F
1
and F
2
. In contrast to the results in my study, she found that
contemporary speakers had no greater degree of glide-weakening in
pre-voiceless environments than Wolfram’s 1966 tokens (110). She
analyzed this surprising finding, given my own (2003) findings, as a
result of contrasting ideological stances concerning Detroit and the
South between our two sets of speakers. I discuss these contrasting
ideological stances further in Chapter 8.

November 2007
MAC/MAL
Page-128
9780230_008861_08_cha07
128
Migration, Accommodation and Language Change
7.4 Conclusion
In this chapter I have analyzed glide length of /ai/ and /?/ by ethni-
city, vowel, and context. Although there are many similarities in
patterning between the AA and AP groups, there are several contrasts.
In the group comparison that included the four youngest speakers
of each ethnicity, the AP group has significantly greater /ai/ move-
ment overall in the F
2
dimension. In the speaker-by-speaker analysis,
I showed that the older AA speakers instantiate the traditional pattern
of voicing conditioning on /ai/ by showing diphthongal pre-voiceless
variants, in contrast to the younger AAs and the APs who show
glide-weakening for the progressive pre-voiceless variant. The Detroit
White woman showed greater movement for F
2
than either of the
Southern migrant groups. The social salience of /ai/ will be discussed
in Chapter 8. The finding that, as a group, younger AAs show pre-
voiceless glide-weakening is an important one because the canonical
pattern reported in the literature for AAE is for the /ai/ glide to be
weakened in pre-voiced and word-final contexts but robust in pre-
voiceless contexts. The results presented in this chapter add to the
growing body of work (Mallinson et al. 2001; Anderson 2002, 2003;
Anderson and Fridland 2002; Fridland 2004; Childs 2005) which
suggests that pre-voiceless /ai/ glide-weakening is a change in progress
for at least some speakers of AAE.

November 2007
MAC/MAL
Page-129
9780230_008861_09_cha08
8
The Local and Supralocal
Contexts for the Patterns of
Usage
This chapter discusses and contextualizes the results for /u/ and /S/
(Chapter 6) and /ai/ (Chapter 7) in terms of the local contact situ-
ation in Detroit as well as the supralocal context of American English.
Section 8.1 provides comments on Detroit and its relationship to the
suburbs. Participants discuss residential segregation, “White Flight”
out of Detroit, perceptions concerning the suburbs, poverty and
crime in Detroit, the 1967 riot, and Coleman Young, the first
African American mayor of Detroit. Section 8.2 provides comments
on migration, the South, and Southern cultural practices. Speakers
discuss reverse migration and purchasing property in the South, ties
to the South which include trips to South and loved ones who
either remained in the South or returned there, rural cultural tradi-
tions brought to Detroit by first-generation migrants and persisting
for later generations, relationships between African American and
Appalachian White Southern migrants, the self-reported categories
of “Southern” and “Hillbilly,” and metapragmatic commentary on
language.
8.1 Participant comments on Detroit and its relationship
to the suburbs
In commenting on daily life, participants are offering interpretations
on their conditions and situations and on everyday life in Detroit.
Before each interview, the participants in this study were given a flyer
that explained the purpose of the project.
129

November 2007
MAC/MAL
Page-130
9780230_008861_09_cha08
130
Migration, Accommodation and Language Change
We want to audiotape a series of conversations lasting between
45 and 60 minutes with Detroiters from a number of different
neighborhoods. These will help us understand how developments
over the last 40 years or so have affected men and women of
different generations in their everyday lives. We will use the tapes
to learn about changes in peoples’ views of their work and their
leisure and about the way Detroiters speak of their city and to each
other. In short we want a record of what Detroiters’ say about their
city, at the beginning of the twenty first century. (Excerpt from
the Flyer, Conversations in Motown at the turn of the century:
Detroit people and Detroit neighborhoods, for The Detroit Project,
Directed by Lesley Milroy at the University of Michigan)
/ai/ shows massive differentiation among socially salient groups in
the Detroit area (Edwards 1997; Eckert 2000; Anderson 2003). Several
themes emerge in the recorded interviews which provide a window
into patterns of social indexing that are particularly helpful in under-
standing the patterning of /ai/ presented in Chapter 7. Section 8.1.1
provides comments from the interviews that reveal, for the African
American participants, the salience of residential segregation, stances
toward the suburbs, perceptions of the White exodus out of Detroit,
the 1967 riot, Coleman Young, and the salience of poverty, lack
of jobs, and other struggles that characterize life in the inner city.
Section 8.1.2 presents commentary on migration, the South, differ-
entiation between Southern migrants and Midwestern Whites, and
Southern cultural practices as well as metapragmatic commentary on
language.
8.1.1 Residential segregation
The sociologists Farley et al. describe Detroit as “ a metropolitan
that is exceptionally segregated—by 1990, Detroit was more resid-
entially segregated than other US metropolis” (2000: 161). Through
extensive surveys of residents of Detroit and the suburbs of Detroit,
these researchers compiled “residential isolation indexes” to measure
the degree of segregation in the Detroit metro area. For Whites in
the area, the index score was 92, which means “ that the typical
White lived in a neighborhood where 92% of other residents were
White” (163). Farley et al. conclude, “regardless of their poverty or
prosperity, Detroit Whites generally lived in the suburbs and Blacks

November 2007
MAC/MAL
Page-131
9780230_008861_09_cha08
Local and Supralocal Contexts for Patterns of Usage
131
in the central city” (191), and that Detroit shows a “ long-run
trend in racial isolation” (171).
In their interviews, African American participants frequently
discussed racial segregation in the Detroit area.
(1) Detroit is a very, very prejudiced, segregated city. Most of
the good jobs are in the suburbs because the Whites don’t know
when another riot might break out, and that keeps a lot of the
minorities and poor White people from getting jobs because
they don’t have the cars to get out there. (Speaker 2, African
American F, b. 1936)
(2) (Highs schools) are very segregated. The schools are still really
fucked up. (Speaker 3, African American F, b. 1971)
My class was almost all Black. Out of about 600 students, 6 of them
were White. (African American M, b. 1973, boyfriend of Speaker 3).
Comments (3) and (4) describe the composition of the neighborhoods
in Detroit, mostly African American with some “poor Whites.”
(3) Most of the neighborhoods are filled with Blacks and what
some people refer to as poor Whites. I don’t like to hear them
referred to as that. (Speaker 2, African American F, b. 1936)
(4) Detroit is predominantly Black. (Speaker 5, African American F,
b. 1974)
There is a perception shared by some of the participants that Detroit
Whites live in the suburbs in order to minimize their contact with
African Americans. In comment (5), Speaker 3 says, “Whites don’t
want to live here in the regular neighborhoods with us.” Speaker 6,
in comment (6) says, “Whites moved to the suburbs to get away from
Black people.”
(5) I don’t know why Detroit remains to be so segregated. I guess
it’s because the Whites don’t want to live here in the regular
neighborhoods with us. But, you know, who gives a damn. If
they don’t like Detroit, to hell with them. (Speaker 3, African
American F, b. 1971)

November 2007
MAC/MAL
Page-132
9780230_008861_09_cha08
132
Migration, Accommodation and Language Change
(6) Whites moved to the suburbs to get away from Black people.
There is a dividing line between the city and the suburbs. Cross
it, and its dangerous for a Black person to drive alone. I hate
having to live like that. (Speaker 6, African American F, b. 1967)
After the “White Flight” (described in Section 8.1.2), roads between
the city and the suburbs served as a racial boundary. Before the mass
exodus of Whites to the suburbs, Detroit enforced racial boundaries
through zoning. It is interesting that residential racial boundaries
persist in Detroit over space, time, and social upheavals such as the
1967 Riot (discussed in Section 8.1.5) as well as desegregation and
the Civil Rights Movement.
(7) There was a lot of segregation in the South, but there was a lot of
segregation in Detroit, too. We lived in zones. We lived in Zone 7;
I’ll never forget it, and the reason they had these zones was because
there was designated schools for Blacks and designated schools for
Whites They didn’t want Blacks to attend their schools. That’s
why we had zones, like you have zip codes now; we had zones,
and we were designated to certain zones, and that’s where we had
to go. (Speaker 2, African American F, b. 1936)
Residential segregation is a fact of life in Detroit, as Farley et al.
(2000) point out. The salience of residential segregation to the African
American participants in this project is apparent in the excerpts from
interviews above. Comment (6) above concisely describes the situ-
ation, “there is a dividing line between the city and the suburbs,”
and that dividing line is racial. In addition to discussing residen-
tial segregation, participants also discussed the “White Flight” from
Detroit.
8.1.2 “White Flight” out of Detroit
In addition to racial segregation, Farley et al. (2000) also discuss
the White exodus from Detroit at length in their extensive social
science research project study of the Detroit metropolitan area. These
researchers frame the exodus of White Detroiters to the suburbs as a
way to create residential segregation based on race (2000: 146). One
report estimates that Detroit has lost over 600,000 residents to the
suburbs by the late 1980s (Widick 1989), and the trend continues

November 2007
MAC/MAL
Page-133
9780230_008861_09_cha08
Local and Supralocal Contexts for Patterns of Usage
133
(Farley et al. 2000) Similar to the theme of residential segregation,
African American participants also discussed the White exodus out
of Detroit.
There is a perception among some participants that the “White
Flight” is primarily a result of Whites fleeing the city after the
infamous 1967 riot. However, there is also a perception that the
“White Flight” is not just a historical event, but is an ongoing trend
(“I even understand now that they’re down at 22 mile,” comment (1)
below) with economic consequences (“A lot of people were out of a
job because when the White people moved, they took their businesses
with them,” comment (2) below).
(1) The city was never the same again after that. After the riot they
call it the “White Exodus.” Most of the Whites left the city after
that time. They went past 8 mile, 9 mile; I even understand now
that they’re down at 22 mile. Because this riot was with Blacks,
the black population called it the “White Flight”. That’s what
they call it. They all left the city. (Speaker 2, African American F,
b. 1936)
(2) My mother told me Detroit was a whole lot better before the
riots because of the “White Flight.” A lot of people were out
of a job because when the White people moved, they took their
businesses with them. (Speaker 5, African American F, b. 1974)
Similar to the comments on residential segregation above in Section
8.1.1, there is the perception that the “White Flight” due to Whites
wanting to minimize their contact with African Americans.
(3) The “White Flight” was due to Whites moving to the suburbs
to get away from the Black people. (Speaker 6, African American F,
b. 1967)
(5) Most White people left Detroit when the Blacks moved in.
(Speaker 8, Appalachian White F, b. 1960)
(6) I’m going to tell you the truth. Detroit was very prejudiced.
Whites moved out to the suburbs; we call it the “White Flight”.
(Speaker 1, African American F, b. 1927)

November 2007
MAC/MAL
Page-134
9780230_008861_09_cha08
134
Migration, Accommodation and Language Change
The next section discusses the relationship of Detroit and its suburbs,
which also figured prominently in the participant interviews. The
relationship between Detroit and its suburbs has also attracted atten-
tion from other scholars (Farley et al. 2000).
8.1.3 Suburbs
The patterns of residential segregation were so striking in the surveys
conducted by Farley et al. (2000) that those researchers expanded the
study: “ race is such a strong determinant of where one lives in
metro Detroit that we explored the thinking behind neighborhood
evaluations by using open-ended questions” on the topic of “desirab-
ility of the inner suburbs.” The team of sociologists noted it was
“ easy to summarize the explanations blacks gave for classifying
the suburbs as undesirable: it is a racial issue” (Farley et al. 2000: 195).
They summarize the results as follows:
For African Americans, racial reasons overwhelm the other explan-
ations for why suburbs are undesirable. And the finding that
so many blacks reported specific incidents and went on at
length reveals that Detroit’s blacks share a cognitive map of
the suburban ring. It is one that sees most suburbs as hostile to
them. (196)
The participants in this study also commented on the social salience
of Detroit’s suburbs.
(1) And they (people in the suburbs) feel like they can be that
way cause they live out there, and they’re rich. (Speaker 6, African
American F, b. 1967)
Echoing what Farley et al. (2000: 195) describe as a Detroit African
American “cognitive map” of a hostile suburban ring, Speaker 6
discusses racial profiling of African Americans by suburban police in
comments (2) and (3).
(2) There are places here in Michigan where I probably shouldn’t
drive alone I guess that’s just how people are. Even some of
the suburbs, you know, a dividing line, you’re in Detroit and the
next minute you’re in a suburb, and they’re like that, you know.

November 2007
MAC/MAL
Page-135
9780230_008861_09_cha08
Local and Supralocal Contexts for Patterns of Usage
135
And you just have to be really careful, and I hate having to live
like that. Well should I go here because I know how the police
are here (Speaker 6, African American F, b. 1967)
(3) I didn’t really hear my father talk about it (harassment of
African Americans by police). I’m really starting to hear more about
it now that I’m older and on my own. I guess because they’re
getting more outlandish with it. They’re going to pull somebody
over because (pause). But when I was growing up I didn’t hear that
much about it like I do now. You know, it’s almost an everyday
thing. Well, I won’t say every day, but it happens more often than
not. And those are close suburbs, not way out in the upper part
of Michigan but in the surrounding Detroit suburbs. And I think
that’s really bad. I really do because there are Black people that
live in the suburbs. So, what do they do? They get pulled over.
Yeah, if you get pulled over There was this one case where the
mayor, Mayor Archer’s son was pulled over in the suburb, Royal
Oak, if I’m not mistaken. He was pulled over because they said he
fit a description of a bank robber, but I mean if you’re not doing
over the speed limit or whatever, there’s no reason for him to be
handcuffed and thrown in the back of the police car, so you know,
as they say it is the nineties, and that stuff still happening. So, I’m
surprised at it being the nineties and we still have to go through
stuff like that, that blatant out of order behavior from people.
Where were they raised? In Michigan. They’re a cop. Or they had
to have lived in Detroit or the surrounding areas. Where were
they raised where they were taught this way? (Speaker 6, African
American F, b. 1967)
Farley et al. suggest, “ less obvious forms of discrimination
continue to maintain Detroit as one of the most segregated places
in the nation, including the tendency of some suburban police
officers to stop young male drivers who are Black more frequently
than those who are White” (2000: 264).
Not only did Whites abandon Detroit for the suburbs, so did
corporations and businesses. Widick (1989: xiv) argues that “ a
powerful force which negatively affects Detroit is the impact
of the decisions of the power structure—the auto industry leaders,
the big merchandisers, and the investors—to shift the bulk of its

November 2007
MAC/MAL
Page-136
9780230_008861_09_cha08
136
Migration, Accommodation and Language Change
plants, stores, investments, and activities outside the city.” Parti-
cipant comments (4) and (5) explicitly link “White Flight” with a loss
of good jobs in Detroit.
(4) We don’t need ya’ll people and businesses in the suburbs. We
don’t need this, and we don’t need that, but we did, and that’s
how everything got so bad . (Speaker 5, African American F,
b. 1974)
(5) Most of the good jobs are in the suburbs because the Whites
don’t know when another riot might break out, and that keeps
a lot of the minorities and the poor people from getting jobs
because they don’t have the cars to get out there. (Speaker 2,
African American F, b. 1936)
Once again, as in the previous sections of this chapter, a perception
that Whites moved to the suburbs to distance themselves from the
African American population of Detroit is described in comment (6).
(6) Mostly they (Whites) move out to the suburbs to get away from
Black people, but not all Black people are like that. I’ve worked,
well, since 18. (Speaker 6, African American F, b. 1967)
The social salience of racial segregation dividing the city from the
suburbs is apparent in comment (7).
(7) They (African Americans in the city) hate them, the White
people in the suburbs, but oh well. (Speaker 5, African American F,
b. 1974)
The contrast in the material conditions of the suburbs versus the city
is also socially salient. Residing in the suburbs means having access to
a better education, better roads, better jobs, and better opportunities.
(8) My friend Tiffany grew up in West Bloomfield, and I used
to wonder what it would be like to go to an all-White school.
(Speaker 5, African American F, b. 1974)

November 2007
MAC/MAL
Page-137
9780230_008861_09_cha08
Local and Supralocal Contexts for Patterns of Usage
137
Comment (9) is especially interesting because it highlights social
differentiation between Whites who stayed in Detroit and those who
live in the suburbs.
(9) We are different than “suburbanites”. Most White people
left Detroit when the Blacks moved in. Our apartment on the
Northeast side of Detroit was $235 a month. It wasn’t safe.
(Speaker 8, Appalachian White F, b. 1960)
Suburbanites would have been able to live there. They would have
been killed. (Detroit White M, husband of Speaker 8)
Speaker 8, as well as her husband, calls residents of the suburbs
“suburbanites” and explicitly points out how they, as city dwellers,
are different from “suburbanites.” Speaker 8 describes herself as
having grown up in a “regular neighborhood” in Detroit and discusses
how her parents would not leave Detroit during the “White Flight.”
She discusses how her parents were well integrated into their neigh-
borhood and how she and her husband also chose to live in Detroit.
Chapter 3 discussed the demographic differences between the inner
city as well as the inner and outer suburbs of Detroit. The outer
suburbs are affluent; the inner suburbs are more stable than the inner
city, and the urban center has a poverty level of over 50% (SEMCOG
1994). In other words, there is a continuum of affluence in the Detroit
metropolitan region with the outer suburbs and inner city consti-
tuting the two extremes.
A report on community leadership for the twenty-first century,
based on results from an 18-month project that generated detailed
case studies of 10 major metropolitan regions (including Detroit),
also discusses the disparities between the inner cities and the suburbs
in terms of crossing a line, similar to the way Speaker 6 described the
dividing line between the city and the suburbs in comment (3).
It is impossible not to notice the dramatic differences in economic
prosperity within the region. Crossing the street from East Detroit
to Grosse Pointe Park is like moving from a underdeveloped
country into an enclave of the wealthy. Nowhere else in the United
States is the line between the haves and the have-nots as clear
or as abrupt. The Detroit metropolitan area has as far to go as

November 2007
MAC/MAL
Page-138
9780230_008861_09_cha08
138
Migration, Accommodation and Language Change
any other region in the country in dealing with both racial and
socioeconomic segregation. (Parr 1998, accessed via the inter-
net at http://www.academy.umd.edu/Publications/boundary/Case
Studies/csdetroit.htm)
In the course of fieldwork, I drove through the area described above:
East Detroit to Grosse Pointe Park, where I conducted an interview
with a wealthy resident of that suburb. Literally, a single road divides
poverty-stricken East Detroit from the luxury homes of Grosse Pointe
Park. Section 8.1.4 discusses the poverty and crime facing Detroit.
8.1.4 Poverty, scarcity of jobs, and crime in Detroit
Participants also discussed poverty, difficulty in finding employment,
and crime in Detroit. In fact, Detroit has a national reputation as a
city in crisis:
Or consider the Detroit region. It reluctantly serves as the stereo-
type of a region in chronic crisis. Nearly every adversity that
could befall a major city happened there—from the compet-
itive meltdown of its jewel, the American automobile industry,
to urban flight that created the most hollowed out core of
all American cities, leaving in its wake hundreds of acres
of urban wasteland. For years in the 1980s and early-90s,
Detroit failed to register a single housing start. (Peirce and
Johnson 1998, accessed via the internet at http://www.academy.
umd.edu/Publications/boundary/CaseStudies/bcsdetroit.htm)
The participants discussed how difficult life is in Detroit, particularly
for residents of the inner city.
(1) Life is hard on Black people in the city, especially in Detroit.
It’s sad because nobody cares how folks are living here. (Speaker 5,
African American F, b. 1974)
(2) It wasn’t very easy to get a job in Detroit. (Speaker 8,
Appalachian White F, b. 1960)
Speaker 1 discusses how she and her family lacked enough food while
her husband was looking for work.

November 2007
MAC/MAL
Page-139
9780230_008861_09_cha08
Local and Supralocal Contexts for Patterns of Usage
139
(3) There have been days I didn’t have the money to buy it (food),
and a lot of nights I would go to bed hungry cause I would feed
the kids before I would eat. Um hm. And when I was down South,
I never did go hungry. I always had food. It might not have been
the best of food, but it was food. Then when I come here, married,
kids, go to bed hungry at night. I just couldn’t believe that. I
just couldn’t believe that. I really couldn’t. I didn’t know it until
then because I used to cry myself to sleep. (Speaker 1, African
American F, b. 1927)
Speaker 2 described the decline of Detroit, beginning after the 1967
riot.
(4) You could see a decline. Going down, going down. (Speaker 2,
African American F, b. 1936)
Speaker 8 and her husband, who are both White, describe gun fire
in their neighborhood as “not a big deal to us.” The landlord they
rented from gave them a reduced rent to serve as security for the
business downstairs from their apartment.
(5) We had guests one evening for dinner, and walked them out
to their car and heard gun fire right up the street. Not a big deal
to us, but they were walking fast to their car. That was very,
very common. (Speaker 8, Appalachian White F, b. 1960)
The reason the guy who owned the business let us live there is
to keep an eye on the building, so in a sense we were security.
(Detroit White M, husband of Speaker 8)
There was a guy across the street who sold drugs. (Speaker 8,
Appalachian White F, b. 1960)
Speaker 8’s husband comments at length on the ineffectiveness of
Detroit’s police.
(5 continued) call the police and nobody comes. And an hour
later, and there’s nobody there. They are fucking lying. There
is no police response times. There is no police response time.
(Detroit White M, husband of Speaker 8)

November 2007
MAC/MAL
Page-140
9780230_008861_09_cha08
140
Migration, Accommodation and Language Change
Hanging out the party store or hanging out at the whore house.
(Speaker 8, Appalachian White F, b. 1960)
The disintegration of Detroit Big out-of-control organizations
that are falling apart. I was never much impressed by what I saw.
An old good-old-boy network of White boys. They were indolent,
and didn’t do much. report takers at best. And it was never
ending. (Detroit White M, husband of Speaker 8)
I remember trick-or-treating on Jefferson, and a man came out
of Burger King chasing someone with a baseball bat. 380 fires
on Devil’s Night one night. So many abandoned houses. You
asked “is it getting better?” No It really is not a real city. It
really is not a real city. (Speaker 8, Appalachian White F, b. 1960)
The city is depopulated. Many less people live there than in my
youth. Worthless police officers, fat ass White police officers.
(Detroit White M, husband of Speaker 8)
The characterization of Detroit police officers as “a good-old boy
network of White boys” and “worthless fat ass White police
officers” by Speaker 8‘s husband is particularly interesting because he
is also White, but he clearly differentiates himself from White police
officers.
As Speaker 8 pointed out in comment (2), the employment situ-
ation in Detroit is grim and life in the inner city is difficult. A
government report issued in March 2007 listed Detroit as having the
highest rate for job loss in the nation for last year for a metropol-
itan area (http://www.bls.gov/news.release/metro.nr0.htm). In addi-
tion to the difficulties in securing employment in Detroit, this section
also discussed crime and poverty in the inner city. Section 8.1.5
describes the 1967 riot, a key historical moment in Detroit.
8.1.5 Riots
The 1967 riot in Detroit has been described as the worst race riot in
U.S. history:
In 1967, the city suffered the most agonizing race riot in
U.S. history. It began with a police raid on an after-hours

November 2007
MAC/MAL
Page-141
9780230_008861_09_cha08
Local and Supralocal Contexts for Patterns of Usage
141
drinking spot, and ended with forty-three killed, 7,000 arrested,
and damage of more than $30 million. One result was
more white flight and a majority African-American city. (Parr
1998, accessed through the internet at http://www.academy.
umd.edu/Publications/boundary/CaseStudies/bcsdetroit.htm)
The riot was discussed not only by older participants, who experi-
enced it, but also by younger participants.
(1) Detroit has never been the same since the 1967 riot because
they tore the city up. They set things a-fire, looted stores, and
did everything they thought they could get away with. But
prior to that, there wasn’t a nicer place to live than the city of
Detroit, MI. We went back down after the riot and it was just
like a war zone, piles of ashes still smoldering and smoking, and
they had cut off the expressway. Couldn’t get in and couldn’t
out. After a week went by we could get in. (Speaker 2, African
American F, b. 1936)
(2) The National Guard was worse than the people that were
fighting. They did so wrong. They did really wrong. Ummhmm.
In the 1967 riot they didn’t get away with it Because people
was killing the Guard. (Speaker 1, African American F, b. 1927)
(3) The factory shut down during the 67 riot. We got off early
that day. (Speaker 7, Appalachian White F, b. 1931)
(4) And I know my mother told me the reason why Detroit is like
it is 1) the riot and 2) after the riots Coleman Young took office
and it really just got bad. (Speaker 5, African American F, b. 1974)
The riot forever changed Detroit, as noted by Speaker 2 in comment
(1), “Detroit has never been the same since the 1967 riot.” Speaker 1,
in comment (2), comments on the force used by the National Guard
to stop the riot: “The National Guard was worse than the people that
were fighting. They did so wrong. They did really wrong.” Widick
(1989: 186) describes the aftermath of the 1967 riot as “ a back-
lash of Black rage and White fear, the extent of which was seldom
comprehended.” Speaker 5’s comment (4) is especially noteworthy
because of the report that her mother reasons “Detroit is like it is”

November 2007
MAC/MAL
Page-142
9780230_008861_09_cha08
142
Migration, Accommodation and Language Change
due, in part, to the riot and also to the leadership of Coleman Young.
The stance that Coleman Young contributed to the decline of Detroit
was not shared by any of the other participants in this study. The
older African American participants (Speaker 1 and Speaker 2), in
particular, described the leadership of Coleman Young as bright spot
in the history of Detroit.
8.1.6 Coleman Young, first African American Mayor of Detroit
Coleman Young was frequently mentioned in the interviews. Young
was a first-generation Southern migrant who was born in Alabama.
He was the first African American mayor of Detroit and served five
consecutive terms as Mayor of Detroit, easily winning each election.
Detroit underwent massive transformation during Young’s tenure:
African-American Mayor Coleman Young, who took office in
1973, took a blunt, pragmatic approach to Detroit’s realities. In
1977, the city’s $350 million Renaissance Center opened with
skyscraping office and hotel towers. The massive development led
to more than $600 million in other downtown investment. The
auto industry reinvested in Detroit, as well.
But the problems in the 1970s continued. Whites fled, with
population declining by more than 300,000 people. The city
found itself stuck with city wages well above those of comparable
cities, and in 1981, bankruptcy looked like the next step. Once
again, the city rallied. Young trimmed more than 4,000 from
city staff, coaxed residents into supporting a doubling of city
taxes, and convinced those still on the city payroll to take major
pay cuts. (Young) pulled (Detroit) back from the brink of
disaster. (Parr 1998, accessed through the internet at http://www.
academy.umd.edu/Publications/boundary/CaseStudies/bcsdetroit.
htm)
Speaker
2,
in
particular,
echoes
Parr’s
comment
that
“(Young) pulled (Detroit) back from the brink of disaster”: (Young)
brought the city to where it was, but now I see it on a decline. Coleman
Young brought the city back from the 67 riot.

November 2007
MAC/MAL
Page-143
9780230_008861_09_cha08
Local and Supralocal Contexts for Patterns of Usage
143
(1) They’re on the mend. They’re trying to bring the city back, but
as far as I’m concerned it will never be the same. It will never be
the same. And their choice to bring the gambling casinos down
there, I think that’s the worst decision the city could have ever
made. The last mayor that died last year, was the mayor Coleman
Young, he brought the city to where it was, but now I see it on a
decline.
Coleman Young brought the city back from the 67 riot, and the
first thing he did when he got into office. I do believe that was
the first black mayor of the city of Detroit.
Speaker 2 also points out the Coleman Young ended institutionalized
racial profiling by the Detroit police force.
They had a program called Stress. They used to stop young black
men on the street because they were afraid of them, and search
them, check for weapons, so when Coleman Young got into office,
he said “no we’re going to stop this. This is discrimination. If
you’re going to stop the young black men, you’re going to stop all
of them.” So he took that out.
Coleman Young had a reputation of “fighting for the seniors” (see
below), one manifestation of which was instituting a free bus ride
program for senior citizens.
And then he started to bring in all kinds of different stuff. He
wanted free (bus) rides for the seniors He fought a lot for
the seniors, and when Coleman Young died this is one person
that cried. I really cried when he died. He had free ride for the
seniors
Young also had a reputation for using profanity. Speaker 2 also reports
that “he gave a lot jobs to minorities that never had good jobs
before.”
My brother asked why Coleman Young used all that profanity. I
told my brother because that is all some people understand. He
gave jobs to a lot of minorities, not only blacks, minorities that

November 2007
MAC/MAL
Page-144
9780230_008861_09_cha08
144
Migration, Accommodation and Language Change
had never had good jobs before. You don’t remember and your
parents don’t, but the only jobs they would give Blacks was the
dirtiest and lowest jobs. You probably don’t remember, even your
parents don’t remember, but the only jobs they would give to
blacks was cleaning, the dirtiest and lowest paying jobs they could
find. That’s why my dad had to work two jobs because, having a
large family, one check was not enough, so that was why he had
to work two jobs. (Speaker 2, African American F, b. 1936)
Speaker 1 and her husband also commented on Coleman Young.
(2) Coleman did a lot for the seniors. The man was in office five
terms. He got free (bus) rides for the seniors. (African American M,
husband of Speaker 1)
The only thing I didn’t like about Coleman was that he cussed so
much. He cussed on the news, and little children be watching the
news. (Speaker 1, African American F, b. 1927)
The only Appalachian White participant who lived in the city instead
of the inner suburbs also comments favorably on Young.
(3) I liked Coleman Young. My parents are pretty down about
Archer (the mayor of Detroit at the time of the interview). Archer
is trying to throw my parents out of their house, condemn it and
give them $30,000. (Speaker 8, Appalachian White F, b. 1960)
Coleman Young is an important figure in the social landscape of
Detroit for city residents. Note that the only Appalachian speaker
to actually reside in the city instead of in a suburb is Speaker 8,
the only Appalachian participant to comment on Young. This same
participant was also the only Appalachian participant to comment
on crime and lack of jobs in Detroit in Section 8.1.4.
8.2 Participant comments on migration, the South, and
Southern cultural practices
For both the African American and Appalachian White parti-
cipants, general cultural orientation to the South emerged during the

November 2007
MAC/MAL
Page-145
9780230_008861_09_cha08
Local and Supralocal Contexts for Patterns of Usage
145
fieldwork phase of the study. This section discusses the plans of some
of the participants to return to the South, ties to the South, aspects
of Southern culture described by participants, comments by African
American participants about Appalachian White Southern migrants
as well as comments by Appalachian Southern migrants concerning
African American Southern migrants, and explicit commentary on
language.
Participants reported where they or their families migrated from in
the South, which is discussed in Section 8.2.1.
8.2.1 Reverse migration and purchasing property in the South
(1) I am from Waycross, Georgia. Do you know where that is?
(Speaker 1, African American F, b. 1927)
(2) My mom was from West Virginia; my father was from
Alabama. (Speaker 2, African American F, b. 1936)
(3) My grandparents came to Detroit from Georgia. My grandpa
wanted to make a better life. (Speaker 3, African American F,
b. 1971)
(4) My family is from the Carolinas. (Speaker 4, African American F,
b. 1974)
(5) My parents are from Greeneville, South Carolina. (Speaker 6,
African American F, b.1967)
(6) I’m from Ranger, North Carolina. A lot of Southern people
came from the Carolinas and Tennessee. We lived on Tennessee
Street. There’s been people from the South coming up here ever
since then. (Speaker 7, Appalachian White F, b. 1931)
(7) My parents eloped in 1954, went to Georgia, got married, and
then they moved here. A lot of Southerners migrated, lots of jobs.
There was job availability here. (Speaker 8, Appalachian White F,
b. 1960)
(8) My mom is from Murphy, North Carolina. (Speaker 9,
Appalachian White F, b. 1951)
(9) My grandfather came to Detroit in the early twenties to work
in the auto factories, and many people from Franklin did. He
didn’t stay long, was a carpenter, found work and moved back to

November 2007
MAC/MAL
Page-146
9780230_008861_09_cha08
146
Migration, Accommodation and Language Change
Franklin. My grandmother was dying of cancer, and she wanted
to go home to die. My parents moved to Detroit after they grew
up. My grandfather’s brother and kids also moved up. The only
family we ever had here was Uncle Frank’s family. Grandpa and
Grandma moved back to Franklin and bought 118 acres. (Speaker
10, Appalachian White F, b. 1949)
(10) We are both from Nantahala, North Carolina, in Macon
County. (Speaker 11, Appalachian White F, b. 1936)
(11) We are from Hiawassee Dam (in North Carolina). (Speaker 12,
Appalachian White F, b. 1965)
Berry (2000) discusses The Great Southern Migration as being kin-
based, and a few participants in my study also discussed migration
in those terms.
(12) I have a brother and sister in Detroit. It wasn’t too bad for
me, after I got used to it, because I had relatives up here. And they
all stayed. We have a big family. Half of them are up here, half in
North Carolina. (Speaker 11, Appalachian White F, b. 1936)
(13) I had two brothers here ahead of me. Another brother came
up at the same time; the four of us in a car going up, 18 hours.
My two other brothers were in Hamtramck. We lived in a duplex
with six family members. There was a lot of Southern people
there. My nephew came up to work and people I knew from all
around there. (Speaker 7, Appalachian White F, b. 1931)
Bridget: Well that probably helped
Oh yeah and we’d go visit them and they’d come visit us. Yeah
that did help. (Speaker 7, Appalachian White F, b. 1931)
Several participants discussed their plans to move back to the South,
and some already had property there. Reverse migration for Southern
migrants is not unique to Southern migrants in Detroit. It is reported
for Southern migrants in other regions of the Midwest by Berry (2000)
and in California (Gregory 2005)
Speaker 5 contrasts the reports about the South from Detroit friends
who are moved back down South with conditions in inner city

November 2007
MAC/MAL
Page-147
9780230_008861_09_cha08
Local and Supralocal Contexts for Patterns of Usage
147
Detroit. She described her goal as “getting out of Detroit and going
South.”
(14) I have friends in Atlanta, some of the other Southern
states. And they’re from here, they come back after going to
these Southern places and talk about how much better it is for
people—no matter what color you are. My mother was about
to move to Atlanta. I was going to go to Emery University. We
were out of here, but my grandmother took ill. This was right
before she passed, so we ended up staying. But most of the
people we grew up with, they moved (South) at some point, so
it’s like we the only people still here! Why? Why are we still
here? So I made it my goal that when I graduate and find myself
doing whatever it is I call myself doing , I’m outta here. I hate
Detroit. I don’t care if I’m fifty, I’m getting out of Detroit and
going South. I hate it. I really do. (Speaker 5, African American F,
b. 1974)
Not only does Speaker 12 plan on moving back down South, she and
her husband already own property in North Carolina and spend “at
least a month every summer” there. Like Speaker 5 above, Speaker 12
indicates that moving back South is a goal: “We’ve always tried to
get back South.”
(15) I’m counting the days until my husband retires from Ford
so we can move back South. I always have a fabulous phone bill
from calling down South. I keep close contact with my family. We
bought a place in the South. My parents live there now. That’s the
only place we vacation at. That’s where we go every summer. We
go at least three times a year. I would stay down there at least a
month every summer. Last summer my dad died. I was practically
there all summer. We usually go at the end of May. (Speaker 12,
Appalachian White F, b. 1965)
She has more friends down there than she does here. (Appalachian
M, husband of Speaker 12)
We’ve always tried to get back South. One Yankee woman
once said, “Maybe they’ll move back South”. Give us a break,
people. We already have our home (back South). When we retire

November 2007
MAC/MAL
Page-148
9780230_008861_09_cha08
148
Migration, Accommodation and Language Change
South maybe we can take some real vacations because from
up here we’ve always gone to North Carolina, 99% of the time.
(Speaker 12, Appalachian White F, b. 1965)
Speakers 7 and 10 also own property in the South.
(16) I have a trailer down South. (Speaker 7, Appalachian White F,
b. 1931)
(17) I bought a house in Franklin. I spent winters in Michigan
and summers in North Carolina without my husband. He’s not
very fond of the South and will never live there. My husband said,
“You don’t need a house down there.” “Yes I do,” I said, “The
door is closing on my life down there, and it’s only open a crack.”
(Speaker 10, Appalachian White F, b. 1949)
Speaker 9 commented on the reverse migration of some of her
husband’s African American coworkers.
(18) My husband works with a lot of African Americans at Chrysler.
Most of them have homes built down there, no plans of staying
up here after they retire. Most of them are going back (South).
(Speaker 9, Appalachian White F, b. 1951)
She also indicated the she and her husband hope to purchase property
down South:
(19) We really like it down South .We are really thinking about
getting a place down there. That’s what we’re hoping to do when
he retires. (Speaker 9, Appalachian White F, b. 1951)
This section discussed the migration history of each of the parti-
cipants as well as comments by some of the participants that they
either plan to move back down South (reverse migration) or, in some
cases, already own property in the South. The next section discusses
participant comments regarding ties to the South, including trips and
visits back South and relatives still residing in the South.

November 2007
MAC/MAL
Page-149
9780230_008861_09_cha08
Local and Supralocal Contexts for Patterns of Usage
149
8.2.2 Ties to the South: Trips and relatives
Regular and repeated trips from Detroit to the South were frequently
mentioned in the interviews. A few participants even reported period-
ically moving back down South, particularly when the employment
situation in Detroit faltered.
(1) My father’s family moved back and forth constantly. He would
spend maybe two weeks here and then go back South. (Speaker 8,
Appalachian White F, b. 1960)
(2) My brothers, every time they’d get laid off they’d take off back
down South. Every time he’d (her husband) get a long weekend,
we’d take off and go. (Speaker 7, Appalachian White F, b. 1931)
Bridget: That’s a long drive just for a long weekend.
I know, but you’d get so homesick, not just for the people but
also for the mountains, too. There’s none around here, you know.
Wall to wall people and all that. Concrete and everything, you
know. It was hard on us. In 1957 my husband was laid off for three
years, and we moved back down South lock, stock and barrel, took
everything. We came back to Detroit in 1961. You had to come
up here to make a living cause there was no way down there.
I used to go down there and stay for months at a time. (Speaker 7,
Appalachian White F, b. 1931)
Speaker 1 sent her children down South for several months once
when times were particularly difficult.
(3) After the war, a lot of people lost their jobs. We liketa starved
to death. My mother had the kids down South. I didn’t want them
to go hungry. (Speaker 1, African American F, b. 1927)
In addition to the excerpts from participant interviews above, in
which a few participants described owning property in the South,
Speakers 12 and 10 described extended visits to the South during
the summer months. Speaker 12’s 13-year-old daughter spends every
single summer in the Southern Appalachian mountains with her
grandparents.

November 2007
MAC/MAL
Page-150
9780230_008861_09_cha08
150
Migration, Accommodation and Language Change
(4) My husband and I go back and forth South, staying at least
a month most every summer. My daughter always spends the
summer in North Carolina [she was in North Carolina at the time
of the interview]. I don’t think she has ever spent a summer in
Michigan. The mountains are always home. The longer we live up
here I think “well, its not so bad”, but when we’re driving home
and I’m looking at the Tellico Mountains I think “oh, this is what
I do love”. (Speaker 12, Appalachian White F, b. 1965)
Speaker 10 ran away from home (in Detroit) at age 11 and spent the
next 6 years in Franklin, North Carolina with her grandparents.
(5) As a small child, we got in a car, I’m one of three girls, and
we’d go spend two weeks with grandfather (in Franklin, North
Carolina). My father kept making trips down. As a small child, we’d
go spend two or three weeks with Grandpa, with the animals, and
it was magic. I loved it. We visited old people with Grandfather.
So, we’d spend the summer there until I was eleven. I hitchhiked
down South to grandpa’s when I was eleven. A man driving an
eighteen wheeler truck drove me all the way to grandpa’s. I stayed
there six years. It was magic growing up. I got summer jobs We
didn’t have much. I worked for an uncle farming and learned a
lot on the farm. Finally it was the end of my junior year, my
grandfather said I needed to go back North. I had a boyfriend,
etc. I wasn’t interested in leaving. I still spend every summer on
the mountain in Franklin. The ones I knew that are the most
important to me are going to be gone. There isn’t anyone on the
mountain that doesn’t know me. Everyone knows me and I know
everyone. It is like time stopped and I can go back and still get
the magic. It is still magic to me. Still see my aunt quite often.
(Speaker 10, Appalachian White F, b. 1949)
One factor that contributes to a sense of a Southern “homeland” is
that the participants, even second- and third-generation migrants,
still maintain contact with family that either remained in or returned
to the South.
(6) When I was growing up, my parents still went down South to
family reunions. (Speaker 6, African American F, b. 1967)

November 2007
MAC/MAL
Page-151
9780230_008861_09_cha08
Local and Supralocal Contexts for Patterns of Usage
151
(7) I’ve got family still down there; that’s the thing. (Speaker 12,
Appalachian White F, b. 1965)
(8) I miss family most of all. That was the hardest thing about
coming up here—leaving your family. I’d get so homesick I’d just
sit and cry. I wrote them letters. I couldn’t call; they didn’t have no
phones then. That was what was so hard to do; when we first
come up here was leaving the family behind like that. (Speaker 7,
Appalachian White F, b. 1931)
The excepts from the interviews in this section make it clear that both
the African American and Appalachian White Southern migrants
continue to maintain ties to the South, evident in visits to the South
and family ties still in the South. The next section discusses Southern
cultural practices maintained by the Southern migrants.
8.2.3 Southern cultural practices in Detroit
Participant interviews revealed that they maintain a variety of
Southern cultural practices, including food, burial practices, religious
traditions such as church homecomings, caring for the sick and
elderly, and researching family genealogy.
Comment (1) indexes a differentiation in the identification of
“place of origin” between Southerners and non-Southerners. A stereo-
typical characteristic of the South is that you cannot be “from” a
particular place unless your family goes back several generations in
the area. Indeed, I myself was raised with that understanding.
(1) When somebody asks us where we’re from, we say we’re from
Hiwassee Dam, North Carolina. If you ask an outsider where
they are from, it’s the latest place they’ve lived. (Speaker 12,
Appalachian White F, b. 1965)
Comment (2) describes how Southerners still raise their gardens in
Detroit.
(2) A lot of people got they garden, like we got a garden here.
Before we had a garden, I was looking at the neighbor’s garden.
His wife asked, “Are you from down South?” I said “Yes I am.” She

November 2007
MAC/MAL
Page-152
9780230_008861_09_cha08
152
Migration, Accommodation and Language Change
said, “You want some of these vegetables don’t you?” I said, “um
hum.” She give me greens, she give me okra; she gave me corn;
she gave me tomatoes. She just fixed up a basket and gave it to
me. (Speaker 1, African American F, b. 1927)
Speaker 1 also describes how she arranged to have grits, a Southern
staple, imported to Detroit from the South before the time that
Detroit merchants began to carry them in their stores.
(3) I love grits. I love grits. (Her husband stated that there were no
grits in Detroit when they first moved up from Georgia). So, I go
to the store, and I say “you got any grits?” “What is that?” I said
“grits”, and I couldn’t tell them what it was. All I knew was grits.
I didn’t even know what grits was made of. I think I started Detroit
having grits cause I asked for them so much. I wrote my daddy.
I told him to send me some grits because they didn’t have grits
here, and he sent me a five pound bag of grits, and I went and
showed it to the man at the store. (Speaker 1, African American F,
b. 1927)
Speaker 9 taught the cook at a Warren (inner suburb of Detroit)
restaurant to make Southern breakfast gravy because they brought
her unacceptable, non-breakfast (i.e. non-sausage) gravy when she
ordered gravy with her breakfast. Notice how Speaker 9 told the wait-
person “I am from the South,” even though she is a second-generation
migrant.
(4) We went out to breakfast once and I ordered gravy. They
brought me chicken gravy. I said, “Excuse me this is not breakfast
gravy.” They said it was. I said, “Well, I’m from the South and this
is not it. I tell you what, you take me back to your kitchen and
I’ll show you how to make Southern breakfast gravy.” And I did.
I made them a pot of (sausage) gravy. My granny taught me how
to make it. (Speaker 9, Appalachian White F, b. 1951)
This speaker also cooks Southern food for her family, and her grand-
daughter’s favorite food is fried okra, a Southern delicacy.

November 2007
MAC/MAL
Page-153
9780230_008861_09_cha08
Local and Supralocal Contexts for Patterns of Usage
153
(5) My granddaughter’s favorite food is fried okra. (Speaker 9,
Appalachian White F, b. 1951)
Like Speaker 9 above, Speaker 4—an African American—identifies
herself as Southern: “A lot of people from the South are up here, and
we barbeque on our front porches.” Speaker 4 is third generation.
(6) Detroit is a mixture between the North and the South: the
hospitality of the South plus the big city life of the North. A lot of
people from the South are up here, and we barbeque on our front
porches. One way you know a Southern person in Detroit is when
you go over to their house for the first time and get a huge dinner.
(Speaker 4, African American F, b. 1974)
Burial practices are another important cultural tradition. The
daughter of Speaker 7 died as a young adult, and Speaker 7 took
her back to the family graveyard for burial instead of burying her in
Michigan, where her daughter had lived her entire life.
(7) All my people are going to be buried in the family graveyard
in North Carolina. Even though I raised my daughter in Michigan
I took her back to the family graveyard to be buried. (Speaker 7,
Appalachian White F, b. 1927)
Speaker 10 has already purchased her plot in the “family row”
back at her family’s church in North Carolina. In fact, although
she is a third-generation migrant, she is a member of that church
since she is able to attend regularly during the summer (see
Section 8.2.2).
(8) I’m going to be buried in my family row (back down South).
I’ve got it all taken care of, and I know where I’m going to go.
I’m going to be there with my people. My uncle said, “You’re
going to be buried at your home church.” So he took me up to
my family church (in Franklin, North Carolina), of which I am a
member, and he showed me my family row. They were worried
somebody would take my spot. So, I had to put a footstone with
my initials, and I feel good about that. So I’ve got it all taken care
of. I’m going be there with my people. My husband is going to be

November 2007
MAC/MAL
Page-154
9780230_008861_09_cha08
154
Migration, Accommodation and Language Change
cremated. That’s my story. You have any questions? (Speaker 10,
Appalachian White F, b. 1949)
(9) Being Southern, when someone dies, we take food to the
family’s house. (Speaker 7, Appalachian White F, b. 1927)
Speaker 8 reports that Detroit used to have a festival for Southern
migrants, and Speaker 9 describes many kinds of cultural events and
get-togethers for Southerners.
(10) Detroit used to have “The Southern Festival”. (Speaker 8,
Appalachian White F, b. 1960)
(11) There were picnics out on (Highway) 94 for people from
Kentucky, plus Freedom Hill. There’s several different places that
have bluegrass (music). There’s a lot of stuff going on up here for
Southern people. Got to keep your roots. There’s quite a few things
that go on that are strictly Southern based. Potlucks. (Speaker 9,
Appalachian White F, b. 1951)
Speaker 8 also described parties in her childhood neighborhood, an
inner city Southern migrant enclave.
(12) (Inner City Southern Appalachian) people would have like
these he haw parties every week, and that’s just what you do. You
drink whisky and pull out your gun and shoot out the street lights
things like that. (Speaker 8, Appalachian White F, b. 1960)
The cultural anthropologist Hartigan (1999) also described these sorts
of parties in Corktown, an Appalachian enclave in Southwestern
Detroit.
(13) Something else that should be here (in Michigan) is home-
coming. I wish we had that here, makes people closer as a congreg-
ation. I wish they had that here, picnic on the cemetery grounds.
I am a member of a church down there (in the South). I go to
homecoming, was baptized down there. (Speaker 10, Appalachian
White F, b. 1949)

November 2007
MAC/MAL
Page-155
9780230_008861_09_cha08
Local and Supralocal Contexts for Patterns of Usage
155
Speaker 10, who revealed in comment (5) of Section 8.2.2 that she
ran away from home in Detroit to live with her grandfather down
South at age 11, maintains close friendships with her girlfriends down
South.
(14) My girlfriends sent me a tee-shirt that says GRITS—girls
raised in the South. Floats real well around town. (Speaker 10,
Appalachian White F, b. 1949)
Speaker 10 is also the family historian and the “keeper of the family
pictures.”
(15) I do the family genealogy. I have over 300 pictures. I am the
keeper of the family pictures. I have the family history. (Speaker
10, Appalachian White F, b. 1949)
Other important cultural Southern traditions include dropping
everything to be with loved ones in the event of a death in the family,
and family members being present in around-the-clock shifts when
loved ones are hospitalized. Having myself grown up in the rural
Smoky Mountains of Western North Carolina, I understand that there
is literally nothing—not school, employment, or anything else—that
takes priority over family during these times.
(16) If someone dies, I’ll drive all night to be there for the family.
There, if somebody’s in the hospital, you stay by their side all
night. You don’t leave your loved one and go home. You stay
there in the chair and you sleep. (Speaker 10, Appalachian White
F, b. 1949)
Bridget: Somebody’s there all the time.
And when they get bad in the nursing home, it’s the same thing.
I take my shift. (Speaker 10, Appalachian White F, b. 1949)
This section described the maintenance of Southern cultural practices
by the African American and Appalachian White Southern migrant
participants, such as strong kinship ties, burial practices, food, and

November 2007
MAC/MAL
Page-156
9780230_008861_09_cha08
156
Migration, Accommodation and Language Change
gardening. The next section discusses comments made by parti-
cipants on the relationship between Southern Whites and Southern
African Americans in the Detroit area.
8.2.4 Relationship between Southern Whites and Southern
African Americans
This section presents participant comments centering on the topic of
relations between Southern Whites and Southern African Americans
in Detroit.
Comments (1) and (2) describe neighborhoods as “mostly Black”
with some White Southerners.
(1) Some White Southerners live in the city, but most White
people live in the suburbs, and Detroit is mostly Black. (Speaker
3, African American F, b. 1971)
(2) I lived in an integrated neighborhood growing up. Most of
the neighborhoods are filled with Blacks and what some people
refer to as “poor Whites”, which I don’t agree with that term, but
that’s the term that they use. Most of them are from the South,
and I don’t think they should be called “poor White”. (Speaker 2,
African American F, b. 1936)
Speaker 7, a retired factory worker, reports that African American and
White Southern migrants worked together in the factories.
(3) Black and White Southerners worked together (in the
factories), carpooled together, and got along very good. (Speaker
7, Appalachian White F, b. 1927)
Speaker 9 describes one cultural similarity between African American
and White Southern migrants as being the preparation of Southern
food.
(4) There’s a lot of similarities between Black and White Southern
people. For one thing, we like to cook and eat Southern food.
I don’t have a racist bone in my body. I don’t look at a person
for their color. My husband doesn’t like store bought food or
restaurant stuff. I cook all the time and the guys at work say, “Ali,

November 2007
MAC/MAL
Page-157
9780230_008861_09_cha08
Local and Supralocal Contexts for Patterns of Usage
157
you married to a Black woman.” He says, “No I’m not.” They say,
“Yes you are. White women don’t cook like that.” He’d have pork
chops smothered in onion gravy, corn. The correlation between
African American and Southern White people is if you’re from
the South, you cook. You can’t tell the difference. My husband
would have pork chops smothered in onion gravy. And for break-
fast he loves .you know, sausage gravy. (Speaker 9, Appalachian
White F, b. 1951)
Speaker 8 discusses the problems with bussing, in an integration
attempt, when she attended school: “The students never got along,
especially White students who grew up in neighborhoods without
Black people.” Recall that Speaker 8 is the only Appalachian White
participant whose family remained in the inner city, and once again
she contrasts herself with other Whites who live in neighborhoods
without African American residents: “Of course, I grew up with Black
people, and I always got along with everyone.”
(5) I had a very poor education. Classes were way over-
crowded very
poor. Poor
education.
The
city
started
bussing trying to integrate the schools. Lots of little riots every
single day. The students never got along, especially White students
who grew up in neighborhoods without Black people. Of course,
I grew up with Black people, and I always got along with everyone.
(Speaker 8, Appalachian White F, b. 1960)
Although Speaker 12 and her husband resided in the suburbs at
the time of the interview, they recalled growing up in the city
and commented on similarities and differences in treatment of
African American and Appalachian White Southern migrants by non-
Southern Detroit Whites.
(6) Southern Whites in the inner city. It was because they
didn’t have a lot of money. (Appalachian White M, husband of
Speaker 12)
A lot of things they (African Americans) went through was
because they were poor and poor (White) people suffer the same
thing. When I grew up, we still had an outhouse, no inside

November 2007
MAC/MAL
Page-158
9780230_008861_09_cha08
158
Migration, Accommodation and Language Change
running water until sixth grade. The Northerners treated the
Blacks worse than the (White) Southerners. When I was working,
I thought they (society) think we’re prejudiced because we’re
from the South. But I remember when I was working it was
during the time economics was bad everywhere My boss said,
“Why don’t they hassle the hillbillies?” (Speaker 12, Appalachian
White F, b. 1965)
I had African American kids as friends, and my dad wouldn’t
support residential segregation. The neighborhood wanted to buy
a house to keep Blacks out. My family would not support that.
(Appalachian White M, husband of Speaker 12)
Speaker 12 also comments on cultural similarities between African
American and Appalachian White Southern migrants.
(7) It’s more being poor than the skin. Crackling bread. That’s
what people up here consider a Black thing. We ate that growing
up. The other thing I thought was funny a Black lady at church
put a pair of silk undies at night to keep her hair in shape. My
mom did that. It’s not Black. People up here think we (South-
erners) are dumb hicks every way you put it. Even in the South
we’re discriminated against by city people. Any minority group,
regardless of race, has been treated wrongly. It’s not just the color
of your skin. But Blacks can’t get away from it Their skin color
separates them no matter what. I’ve never had a racist bone in my
body. We’re all God’s children. I don’t have a racist bone in my
body. (Speaker 12, Appalachian White F, b. 1965)
Speaker 12 also highlights a key difference between the situation
of African American Southern migrants and Appalachian Whites
when she acknowledges that “Blacks can’t get away from it Their
skin color separates them no matter what.” Indeed, many Southern
Whites, including all but one of the Appalachian participants in this
study, were eventually able to dissolve into the suburban landscape;
Detroit African Americans, in contrast, have never penetrated the
suburbs in a significant way (Farley et al. 2000). Speaker 8 is the one
Appalachian White who remained in the inner city.

November 2007
MAC/MAL
Page-159
9780230_008861_09_cha08
Local and Supralocal Contexts for Patterns of Usage
159
Bridget: Did you grow up in an integrated neighborhood?
Of course, I grew up with Black people! We lived in Detroit.
(Speaker 8, Appalachian White F, b. 1960)
This section demonstrated that African American and Appalachian
White Southern migrants are salient to each other in the
city/neighborhood landscape, more so historically than presently,
since most Appalachian migrants have moved to the suburbs. Never-
theless, the presence of both African American and White Southern
migrants in the city was frequently mentioned in the interviews.
8.2.5 Identification as “Southern” and “Hillbilly” and
differentiation between Southern migrants and Midwestern
Whites
Considering the common practice in sociolinguistics of ignoring or
dismissing the role of regional identity in patterns of use for AAE
until recently (Wolfram 2007), it is important to highlight that
African American participants frequently identified themselves as
“Southern” in the fieldwork phase of the study. Four years of parti-
cipant observation in a Detroit African American community, in
addition to the interviews, provided an ethnographic context to this
self-identification as Southern. The Detroit African Americans in this
study maintain a variety of Southern cultural traditions as well as ties
to the South. Comments (1) and (2) are examples of self-identification
as Southern by African American participants.
(1) Southerners still raise their gardens in Detroit like we got a
garden here (Speaker 1, African American F, b. 1927)
(2) A lot of people from the South are up here, and we barbeque
on our front porches. (Speaker 4, African American F, b. 1974)
Comment (3) provides an example of an Appalachian Southern
migrant identifying as “hillbilly” (see also Comment (7) in Section
8.2.6 for an example of an African American participant using that
term to label the dialect spoken by Appalachian migrants). Self-
categorization as “Southern” to mean Southern African American and

November 2007
MAC/MAL
Page-160
9780230_008861_09_cha08
160
Migration, Accommodation and Language Change
“hillbilly” to mean Appalachian White may be a form of ethnic differ-
entiation in Detroit, but that remains open for a more large-scale
study.
(3) Oh, I just love it down South. People are much more friendlier.
(Speaker 9, Appalachian White F, b. 1951)
Bridget: Do you consider yourself a Southerner or a mixture?
Actually, I consider myself a Southerner more so than a North-
erner. No doubt about it. Southern cooking—that’s all I do. I just
made fried taters and pinto beans. My granddaughter loves fried
okra and greens. We had them last week. Most people ask, “Are you
a hillbilly”? And I say, “Yeah, I’m a hillbilly. I sure am.” I’m not
ashamed of it. I’d like to move back down South, but unfortunately
my kids all work in the factories up here, in Chrysler. Most of them,
so I’d never leave my grandkids. I think that’s why my mom’s
never gone back home, doesn’t want to leave the grandkids. But
I like it down South; its really peaceful and its back home. We
lived Downtown Detroit when we first got up here. Every hillbilly
that’s ever come to Detroit lived in the Southwest side. There’s
still a lot of people down there. Yeah there’s a lot of Southern
people down there. We lived there, but we eventually moved out
this way. Lot of Southerners there. A lot of Southerners up here.
(Speaker 9, Appalachian White F, b. 1951)
Another important component of the ethnographic analysis concerns
comments that explicitly address differentiation between Southern
migrants and Midwestern Whites (sometimes referred to as “Yankees”
by the participants in this study), as in comment (4).
(4) There is such a difference (from Southerners) in the way a
typical Yankee thinks and the way they do things. People from
up here are Yankees. The true typical Yankees know it alls
look down on you That type gives them a bad image The
pushy, impatient people. They treat Southern people like they’re
totally stupid, and they’re used to a fast pace. But it’s weird
how those prejudices are, we get, I get tickled. [husband’s name
omitted] sister, she’s married to someone up here who in my
opinion is typical Yankee, you know. We kind of tolerate him

November 2007
MAC/MAL
Page-161
9780230_008861_09_cha08
Local and Supralocal Contexts for Patterns of Usage
161
because we have to, but their kids are so Southern it’s pathetic.
And [name of her sister-in-law omitted] parents are typical, typical,
what we consider Yankees, you know, and they’re just And so
there’s just such a difference in the way they think and the way
they do things. (Speaker 12, Appalachian White F, b. 1965)
Speaker 5 describes a perception in comment (5) in which some
African Americans in Detroit are different from African Americans
she knows in the South.
(5) I really, really feel so strong about this. . And when you
compare these people (in Michigan) to African American people
in Southern states that you will find that people in Southern
states are more inclined to go to school, to get degrees because
people did fight and lose their lives for the right to go to school. I
think that’s what I have a problem with most. (Speaker 5, African
American F, b. 1974)
There are also comments contrasting sociocultural practices of the
South with those of the North.
(6) In the South people go to the fellowship hall in church for
dinners and wedding receptions. I don’t go to church in Michigan,
but I bet they go out to brunch afterwards in a restaurant. (Speaker
7, Appalachian White F, b. 1927)
(7) In Franklin (North Carolina), it is a time to visit with your
neighbor. If you did that here, they’d carry you out by your neck.
We don’t talk about religion here (in Michigan). There are lots of
differences between North and South. (Speaker 10, Appalachian
White F, b. 1936)
Speaker 9 comments on differences as she perceives them between
Southern and Midwestern gender roles for women (note again the
use of the label “Yankee”).
(8) Southerners visit; Yankees don’t. I was raised to take care of
my husband and my children, to cook for them. My sons’ wives
are from up here, and they don’t even cook. It all goes back to your

November 2007
MAC/MAL
Page-162
9780230_008861_09_cha08
162
Migration, Accommodation and Language Change
values, what you are raised with. I love it down South. People
are much more friendlier, more laid back. (Speaker 9, Appalachian
White F, b. 1951)
The following comments highlight the differences between rural and
urban cultures.
(9) It wouldn’t have been quite as difficult, but being from the
country, it seems like there’s a lot of people here in the big city
and I’m too much of a coward to drive, hard to get around.
(Speaker 12, Appalachian White F, b. 1965)
(10) It’s (the South is) a different world. It’s at a different pace.
I think that it’s much more honest, maybe because it’s the Bible
Belt. Much more religious, more honest. I don’t lock my doors
(in the South). I dislike the city. When I came back to Michigan
(from North Carolina) and Jim and I got married, I said, “I can’t
live like this, where you pull up in a driveway and there’s a house
on each side,” you know forty feet apart or something I have
to have it open, can’t be staring at my neighbor I don’t want
that. I got displaced. (Speaker 10, Appalachian White F, b. 1936)
(11) I love the country. I don’t like the city. (Speaker 2, African
American F, b. 1936)
This section described social identification and differentiation for
the Southern migrant participants. The next section provides meta-
pragmatic commentary on language by the Southern migrant parti-
cipants.
8.2.6 Metapragmatic commentary on language
This section showcases examples of metapragmatic commentary on
language in the interview corpus. Comment (1) demonstrates an
awareness of different expectations for greetings between Southerners
and non-Southerners.
(1) Down South when people ask you how you are they want a
couple of sentences where you tell them how you are. In Michigan,
people ask but don’t want you to really answer them. If I run
into somebody in Michigan and they ask how I am it is a cliché.

November 2007
MAC/MAL
Page-163
9780230_008861_09_cha08
Local and Supralocal Contexts for Patterns of Usage
163
In Franklin (North Carolina), it would be insulting to answer the
same way as in Michigan. In Franklin, I have to give them fifteen
seconds of how I am, and strangers speak to you. Here people are
suspicious if you speak and they don’t know you, “what does she
want?” (Speaker 10, Appalachian White F, b. 1949)
Although Speaker 9 is a second-generation Southern migrant who
has lived her entire life in the Detroit metropolitan area, she still
perceives of herself as having a Southern accent.
(2) I don’t think you ever lose a Southern accent. I don’t think
you ever really lose it. I think it’s who you’re around. (Speaker 9,
Appalachian White F, b. 1951)
Comment (3) is important because it demonstrates the social sali-
ence of Southern English in Detroit (and, more generally, within the
broader context of General American English).
(3) You’re IQ goes out the window as soon as you open your
mouth. (Speaker 12, Appalachian White F, b. 1965)
Speaker 12 also discusses the way her 13-year-old daughter “talks
(more) Southern” after her annual return from spending the summer
in the South with relatives.
(4) We used to get tickled at her (their thirteen year old
daughter) She would talk Southern, not that she was teasing,
but she liked it, and after she comes home, she says the words.
I probably say them as much but I don’t notice it. His cousin
that lived up here just moved back to Tennessee. We were really
close to her Platt Are you familiar with the word platt? Every-
body else calls it “braids” and we’d say something about “platting
hair” and everybody else would look at you like you were probably
crazy. (Speaker 12, Appalachian White F, b. 1965)
Speaker 12 provides explicit commentary on the socially salient /ai/
in the especially salient pre-voiceless context, which was analyzed as
part of this study and discussed in Chapter 7.

November 2007
MAC/MAL
Page-164
9780230_008861_09_cha08
164
Migration, Accommodation and Language Change
(5) I know after we got up here, we had friends that he (her
husband) knew and his name is Mike, so I had called him and I
says “Mike” [ma:k] and he says, “No Mac lives here”, and I says,
“No. Mike. [ma:k]” And after I said it two or three times, I finally
said “It’s Donna!” I kept saying it over and over. They look at
you like you re a total lunatic. (Speaker 12, Appalachian White F,
b. 1965)
Going back to one of the themes discussed in Section 8.2.5, we see
the label “hillbilly,” this time applied to language.
(6) Yours (accent) is a lot stronger than mine. If I go down South,
I come back with it stronger. Sometimes my husband says I talk
like a hillbilly. You never really lose it. (Speaker 9, Appalachian
White F, b. 1951)
One of the most important comments in the entire study was made by
Speaker 2, an elderly African American participant. Speaker 2 stated
that two dialects were to be found in the inner city of Detroit: African
American English, which she refers to as “Southern,” and Southern
Appalachian, which she refers to as “Hillbilly”:
(7) I have a heavy Southern accent, although I wasn’t born in the
South. A lot of the words I say come out with a very Southern
accent. Then we also got what I call the hillbilly sound in Detroit,
and we often mock one another. There’s some good hillbillies here.
(Speaker 2, African American F, b. 1936)
Metapragmatic commentary on language is important to the inter-
pretation of the results presented in Chapters 6 and 7. Section 8.3
gives the interpretation of these results.
8.3 Interpretation of the results for the patterns of use
presented in Chapters 6 and 7
Chapter 2 described language ideologies (see Section 2.2.2) as socially
positioned beliefs about language and its relationship with society
and culture. Johnstone (2003: 199) describes language ideology
as “ people’s beliefs about what language is, what is for, and what

November 2007
MAC/MAL
Page-165
9780230_008861_09_cha08
Local and Supralocal Contexts for Patterns of Usage
165
its roles in their lives should be.” Language ideologies are manifested
not only as reactions (or lack of reaction as the case may be) and
attitudes to linguistic varieties and features, but also in patterns of
use (Anderson and Milroy MS). These ideologies can change over
time and space as particular groups (and particular linguistic features)
shift in and out of salience. Since a change in language ideology
can result in a change in a pattern of use, ideology shapes the direc-
tion of linguistic change (Anderson and Milroy MS). This approach
contrasts with that of Labov (1994), in which linguistic change in
vowel systems results primarily from language internal factors oper-
ating in a manner that is for the most part independent of the cultural
orientations of individual speakers (see Section 2.2.1).
Chapter 2 described a “crucial site” as a culturally defined area in
which “powerful ideological work is being done” (Phillips 2000: 233),
a notion which I argue extends to the vowel space and vowel changes.
The “work” in this context includes the marking of ethnolinguistic
boundaries and the declaration of cultural affiliations. Linguistic
features that are socially salient and show consistent patterns of
differentiation between groups, as well as between individuals, consti-
tute crucial sites for the expression of such ideologies. The nature
of language ideologies cannot be determined simply by correlating
linguistic features with social features determined by the researcher.
As discussed in Chapter 2, analysis of linguistic variation in this
framework requires that one attempt to identify the social categories
that are most relevant to the participants. These categories may or
may not mirror the conventional triumvirate of race, gender, and
class.
The demographic and ethnographic evidence revealed in the parti-
cipant comments above suggests that the relevant social opposi-
tion for contemporary Detroit African Americans is with Midwestern
White speakers. The participant comments in Sections 8.1 and 8.2 on
their own social and linguistic practices are relevant to the interpret-
ation of the acoustic results presented in Chapters 6 and 7. Residen-
tial segregation in the city was salient to the Detroit African Amer-
icans whom I interviewed (discussed in Section 8.1), and a general
cultural orientation to the South emerged during the fieldwork phase
of the study (discussed in Section 8.2). Such comments provide evid-
ence of sensitivity to the effects of residential segregation, and some
participants reported that the only White people living in the city

November 2007
MAC/MAL
Page-166
9780230_008861_09_cha08
166
Migration, Accommodation and Language Change
with them were Appalachians. In the context of the commentary on
the saliency of residential segregation, it makes sense that African
American speakers would index a strong linguistic boundary with
Midwestern Whites. This is particularly relevant to the expansion of
glide-weakened /ai/’s territory to the pre-voiceless phonetic environ-
ment; more on this is discussed in Section 8.3.2.
As noted above, a general orientation to Southern culture in Detroit
was demonstrated by many of the participants. For example, all
participants reported their families’ pre-migration places of origin
in the South, and many migrants, as well as Detroit-born descend-
ants of migrants, described themselves and the culture of Detroit
as “Southern.” Participants often described neighborly visits, barbe-
cues, pig-pickings, and other quintessential Southern activities as
evidence of “Southernness.” The Detroit African American and
the Appalachian White participants frequently expressed a strong
cultural loyalty to the South in their interviews, as revealed by the
speaker comments in Section 8.2. The participant comments provide
evidence that both the Appalachian White and African American
participants in this study show a regional affiliation and cultural
orientation to the South in addition to a linguistic one (pre-voiceless
/ai/ glide-weakening), even if they are second or third-generation
migrants. Several participants plan to move back South. Others
expressed a desire to move back South but said they could not because
they did not want to leave behind family in Detroit.
8.3.1
/u/ and /S/
This section summarizes the results for the acoustic analysis of /u/
and /S/. An important empirical finding is that the Detroit African
American participants in this study show consistent fronting of /u/
and /S/. Fronting of these vowels has generally been reported in
the literature as characteristic only of White speakers (Labov 1994,
2001; Thomas 2001), with a few recent exceptions (Wolfram and
Thomas 2002; Fridland 2003; Childs 2005). As Bailey and Thomas
(1998) point out, fronting of these vowels has indexed Black and
White ethnicity in the South and, according to Thomas (2001), in
many areas still does. The results presented here, along with the
pervasiveness of /u/ and /S/ fronting generally, suggest that these
changes no longer define either regional variation or, contrary to
previous reports, Black and White ethnicity. I argue that in contrast

November 2007
MAC/MAL
Page-167
9780230_008861_09_cha08
Local and Supralocal Contexts for Patterns of Usage
167
with some areas of the South that still show a division along ethnic
lines for this change (Thomas 2001), /u/ and /S/ do not currently
provide an ethnolinguistic boundary marker for either regional or
ethnic identity for the participants in this study.
8.3.2 Comparison of groups for fronting
Chapter 6 reported patterns of fronting of /u/ and /S/ for (1) the
African American and Appalachian White Southern migrant parti-
cipants in this study; (2) contemporary Detroit African American and
1966 African American speakers in Jennifer Nguyen’s (2006) study;
and (3) contemporary Detroit African American and Detroit White
participants in Nguyen and Anderson (2006). Since these studies all
employed the same acoustic methods, cross-comparisons of results
yields a very clear picture of context-based fronting of /S/ and /u/ in
the Detroit metropolitan area.
The patterns for /S/ across the data sets include the following:
Nguyen (2006) reports context-based fronting for Wolfram’s 1966
middle-class Detroit African American speakers in which pre-alveolar
tokens are more fronted than pre-velar ones. Working-class 1966
African American speakers, however, show no fronting for /S/.
Nguyen’s contemporary sample of Detroit African Americans span-
ning the entire social status spectrum shows the same pattern
of context-based fronting as Wolfram’s 1966 middle-class Detroit
African American speakers. My study reports the same pattern
of context-based fronting for Detroit African American Southern
migrant participants as well as Appalachian White Southern migrant
participants. When considered within the context of Nguyen’s real-
time data, it is clear that fronting of /S/ in Detroit African American
speech is a change in progress that happened first for middle-class
African American speakers which is now reported for contemporary
African American speakers of all social status levels in my study,
Nguyen’s (2006) study, and in a comparative study of Detroit
African American and Detroit White speech (Nguyen and Anderson
2006), which show that this pattern of contextually based fronting
also exists in the speech of White Detroiters. The current study
cannot address whether /S/ fronting is unrelated across the different
communities in the Detroit area, or whether it may be a result of
dialect contact.

November 2007
MAC/MAL
Page-168
9780230_008861_09_cha08
168
Migration, Accommodation and Language Change
Patterns of /u/ fronting are also contextually conditioned. The
Detroit African American and Appalachian White Southern migrant
participants in the current study show a pattern in which pre-alveolar
/u/ is fronted relative to the position of pre-labial tokens of /u/,
which are backed, and pre-word-boundary tokens, which fall in the
middle of the two extremes of the front-back dimension of the vowel
space. The same pattern is reported in Nguyen and Anderson (2006),
which compares patterns of /u/ fronting for Detroit African Amer-
ican and Detroit White speakers. Both the African American and the
Detroit White participants in that study show contextually condi-
tioned fronting in which pre-alveolar variants are the most fronted
and pre-labial variants are the most backed, but African American
participants show greater contextually based fronting and backing
than the Detroit White participants. Pre-word boundary tokens, as in
the current study, fall in the middle of the two extremes. All of these
groups showed more fronted variants of pre-alveolar /u/ than the
Kalamazoo female participants in the Hillenbrand et al. (1995) study,
which was used to make a baseline comparison between the backed
pre-alveolar variants in that study and the fronted pre-alveolar vari-
ants for the Detroit participants. Unfortunately, Nguyen (2006) did
not analyze /u/ so there is no real-time data for patterns of /u/ for
Detroit African American speakers.
In the current study, the Southern migrant groups show strikingly
similar context effects for their patterns of use; the only significant
difference by ethnicity for the F
2
distance scores between the phon-
ologically front and phonologically back vowels is that the African
Americans show a more fronted pre-velar /S/ than the Appalachian
Whites. With regard to diphthongization, both groups showed a
tendency for variants of /u/ to glide toward the back of the vowel
space from midpoint to offset and for /S/ to glide toward the front.
I suggested in Section 6.3.3 that, in the case of /u/, this pattern of
diphthongization may help to distinguish these variants from their
front counterparts. Context effects from the following consonant
allow for differentiation between groups of speakers. The Appalachian
White and African American participants in this study show only
subtle contextually conditioned differentiation; as noted above, the
only environment that showed a significant difference by ethnicity
for fronting scores was pre-velar /S/. Section 4.3 described a similar
pattern of subtle phonetic differentiation between Detroit African

November 2007
MAC/MAL
Page-169
9780230_008861_09_cha08
Local and Supralocal Contexts for Patterns of Usage
169
American and Appalachian White speakers in which both groups
tend to avoid /æ/-raising, but the African American speakers showed
raising before pre-nasal following contexts.
As discussed in Section 6.2, context effects such as coarticulation
are lawful and predictable, and as such different dialects should
not show opposite directions for contextually conditioned changes.
However, different dialects may well show different degrees for the
progression as well as the limits on change. In this view, the earlier
stages of a sound change are expected to show stronger contex-
tual effects than the final stages. For example, for the Southern
migrant speakers, /u/ shows strong conditioning effects from pre-
alveolar and pre-labial following environments. The word-final vari-
ants, in contrast, fall in the middle of the two extremes (pre-alveolar
promoting fronting and pre-labial inhibiting it). Contextually condi-
tioned change progresses in an orderly fashion through environ-
ments: for example, pre-alveolar> pre-final> pre-labial for the fronting
of /u/. Following environments whose acoustic and articulatory char-
acteristics promote the change would show more advanced variants
than environments which do not. For example, pre-alveolar contexts
are amenable to fronting of the back vowels. Alveolar consonants
are produced with a fronted tongue body; the acoustic consequence
of this gesture is a high F
2
. Back vowels, in contrast, show a backed
tongue body and low F
2
. The constriction must move forward in the
front/back dimension of the articulatory space to produce an alve-
olar consonant after a back vowel. Labial consonants, which show
a backed tongue body (and low F
2
), inhibit fronting. The tongue
body shows little or no movement going from a back vowel into a
labial constriction. Rates of change, or progression through contexts,
are expected to vary across dialects and individual speakers. In this
view, a dialect (or an individual) showing strong contextual effects
on fronting may eventually no longer show such conditioning after
the change has progressed across contexts.
8.3.3 The (non)role of language ideology in the patterning of
the high and lower-high back vowels
/u/ and /S/ apparently are not the sites of significant sociolin-
guistic differentiation in the Detroit area—certainly not for the parti-
cipants in this study and probably not in General American English
since fronting of these vowels is a pervasive and wide-scale change.

November 2007
MAC/MAL
Page-170
9780230_008861_09_cha08
170
Migration, Accommodation and Language Change
Johnson (2003: 118) notes that /u/ generally tends to be fronted in
American English. Nguyen and Anderson (2006) found that /u/ and
/S/ were fronted for contemporary Detroit AAE as well as for Detroit
Whites, and, furthermore, both groups showed very similar patterns
of contextual conditioning for the fronting process. Additional evid-
ence that /u/ and /S/ are not good candidates for being crucial ideo-
logical sites is that they do not seem to receive the same kinds of
commentary as the socially stigmatized variants of /ai/ (discussed in
Section 8.3.2; also see participant comment (5) in Section 8.2.6).
As noted above, what constitutes a crucial linguistic site is not
contingent on linguistic factors alone and may vary across regions
and time. In the South, fronting of high and lower-high back vowels
among Whites and its absence among African Americans is appar-
ently socially salient, prompting linguists to conclude that, for the
most part, African Americans do not participate in this vowel change
(e.g. Thomas 2001). As discussed in Section 2.1.5, the distinction
between front and back variants of /u/ and /S/ expresses a social
meaning in the South, and at least until recently, African Amer-
icans are generally described as maintaining backed variants (Thomas
2001). Presumably, fronting of the high and lower-high back vowels
is a more recent change for African Americans than for Whites.
The reports indicating that African Americans participate in these
widespread changes are recent (e.g. Fridland 2003; Childs 2005), but
fronted variants of /u/ and /S/ have been described as changes that
have reached virtual completion in Southern White varieties (Labov
1994; Thomas and Bailey 1998; Thomas 2001).
I suggest that where the salient social division is along ethnic lines,
as has been the case in the South, /u/ and /S/ provide a crucial site
for maintaining a linguistic boundary and expressing local meaning.
The evidence from the previous section suggests that the African
American participants in this study have experienced an ideological
realignment following migration in which the primary distinction
is between Northern Whites and Southern migrants rather than
between Southern Blacks and Southern Whites. Because fronting of
/u/ and /S/ shows only subtle contextually conditioned differences
between Black and White Southern migrant groups, I suggest that it
has fallen from salience as a crucial linguistic site. The patterns of
contextually conditioned fronting observed here can thus be under-
stood as participation in a more global change in American English,

November 2007
MAC/MAL
Page-171
9780230_008861_09_cha08
Local and Supralocal Contexts for Patterns of Usage
171
contrary to the claims that African Americans do not participate in
the widespread vowel rotations in American English (Labov 1994,
2001).
8.4 /ai/
While fronting of /u/ and /S/ is apparently a global change, reported
for varieties of English around the world (see Chapter 2), glide-
weakening of /ai/ is a more restricted change associated in partic-
ular with speakers of Southern White varieties of English and AAE
(Wolfram and Schilling-Estes 1998). Variation for /ai/ has been
described as socially salient in American English (Wolfram and
Schilling-Estes 1998: 75; Plichta and Preston 2003) and has played a
different role than the high and lower-high back vowels as a socially
meaningful linguistic boundary marker.
Besides being a more local change than fronting of the high and
lower-high back vowels, another important difference between glide-
weakened /ai/ and fronted back vowels is that the former does not
show the lawful contextual conditioning of the latter. In other words,
fronting of /u/ and /S/ is constrained by universal phonetic (i.e.
internal) factors, but /ai/ glide-weakening is not. In fact, from a phon-
etic point of view, it makes more sense for glide-weakening to occur
first in pre-voiceless, rather than pre-voiced, contexts because pre-
voiceless vowels show shorter durations. A vowel with a shorter dura-
tion is more amenable to truncation of the glide. The historical record
for Southern variants of glide-weakened /ai/ indicate that, instead of
what universal phonetic factors would lead us to predict, exactly the
opposite scenario occurred, with pre-voiced contexts showing glide-
weakening sooner than the pre-voiceless ones.
Glide-weakened variants of /ai/ (in pre-voiced and word-final
contexts) are characteristic of both Southern White and African Amer-
ican varieties of English, varieties which have shared this feature for
at least 100 years (Bailey and Thomas 1998). These variants distin-
guished Southern from non-Southern varieties of English, but did not
distinguish Southern White from Southern African American vari-
eties, at least until recently. Glide-weakening of /ai/ before voiceless
obstruents is a more recent change (e.g. in Appalachian and Texan
varieties) that AAE speakers are generally said not to participate in
(Bailey and Thomas 1998: 104; Thomas 2001). The progression of

November 2007
MAC/MAL
Page-172
9780230_008861_09_cha08
172
Migration, Accommodation and Language Change
glide-weakened variants of /ai/ to the pre-voiceless context for the
Detroit African American participants is analyzed in Section 8.3.2 as
a case of dialect leveling. Leveling is a typical linguistic response to
speaker migration and mobility and subsequent dialect contact (see
also Section 2.2.3). The evidence presented in Chapter 7 suggests that
the Detroit African American speakers in this study have undergone a
process of allophonic leveling that, while bringing their patterns into
alignment with the Appalachian speakers, indexes a strong contrast
with the Midwestern Whites. It seems that external, rather than
internal, factors conditioned this change; this is in contrast to the
fronting of /u/ and /S/, which are conditioned by the internal contex-
tual factor of following phonetic environment.
8.4.1 Summary of major patterns for /ai/
Diphthongal productions of /ai/ before pre-voiceless following
contexts, as in [nais] “nice” and [lait] “light,” is a pattern of use
that is still in operation in conservative Southern White and conser-
vative Southern AAE varieties. In other words, the reported pattern
for General Southern White varieties and AAE is for there to be
spectral differences based on voicing of the following consonant in
which the diphthongal variant occurs before voiceless obstruents. The
spread of glide-weakened variants to pre-voiceless following contexts
is a more recent change than pre-voiced weakening (Thomas 2001)
and is mainly reported for the non-plantation regions of the Amer-
ican South, such as the Great Smoky Mountains of the Southern
Appalachians (Anderson 1999; Childs 2005) and Texas (Thomas
2001).
Non-Southern varieties of American English also show spectral
differences for /ai/ based on the voicing of the following consonant.
For these varieties, offsets tend to show lower values for F
1
and
higher ones for F
2
before voiceless consonants than before voiced
ones (Thomas 2000; Moreton 2004). Thomas (1991, 1993) reports
such spectral differences for speakers in Ohio. Results from percep-
tual research also show that /ai/ tokens with shorter durations, lower
F
1
values, and higher F
2
values are more consistently identified as
occurring before a pre-voiceless consonant than a pre-voiced one
(Thomas 2000: 15). Thomas argues that listeners are able to use the
offset spectral difference as a perceptual cue to the identity of the
following consonant (16). Thomas points out that truncation, rather

November 2007
MAC/MAL
Page-173
9780230_008861_09_cha08
Local and Supralocal Contexts for Patterns of Usage
173
than more extreme diphthongization, would be expected for vowels
in pre-voiceless contexts because these vowels should show shorter
durations. He suggests that the spectral differences in the offsets of
/ai/ are instead used by speakers to compensate for the shorter dura-
tion by “ exaggerating the glide gesture” (2). Moreton (2004) tests
Thomas’s hypothesis that diphthongs show hyperarticulation before
voiceless consonants and found that offglides for /ai/ as well as /oi
eG aS/ showed “more peripheral” F
1
and F
2
offglides before voiceless
consonants for 16 American English speakers. This researcher also ran
a perceptual test which showed that tokens of /ai/ (tide/tight) were
more likely to be judged as occurring in the pre-voiceless context
when they showed lower F
1
, higher F
2
, and a shorter duration. F
2
was the most important cue for the pre-voiced/pre-voiceless distinc-
tion. Moreton concludes that “ [-voice] is correlated with, and
cued by, peripheralization of diphthong offglides.” In summary, more
extreme diphthongization in the pre-voiceless environment is not
only a feature of traditional Southern varieties, but is characteristic
of general American (i.e. non-glide weakening) varieties as well.
Context effects such as those discussed above make it clear that
it is important to consider the phonetic dimensions of /ai/ glide-
weakening in detail. In the approach taken here, /ai/ was compared
to the reference vowel /?/, which was expected to show little, if
any, diphthongization. Twelve of the 13 speakers did show more
movement for either F
1
, F
2
, or both for /ai/ than /?/.
The two older African American speakers showed diphthongization
of /ai/ in pre-voiceless contexts, the traditional pattern described in
the literature. For the younger African American speakers, however, as
well as for all the Appalachian White speakers, for whom voicing had
a significant conditioning effect, pre-voiced variants showed greater
diphthongization from midpoint to offset than pre-voiceless variants.
This is in contrast to the spectral differences based on voicing of the
following consonant which are described above for General Amer-
ican English and may be the result of the longer duration of vowels
in the pre-voiced context. Finally, both Southern migrant groups
showed more glide-weakening for /ai/ than the Detroit White woman
(Speaker 13), who showed greater movement for F
2
than either of
the Southern migrant groups. In Section 8.3.2, I suggest that the
important finding that all but the oldest African American speakers

November 2007
MAC/MAL
Page-174
9780230_008861_09_cha08
174
Migration, Accommodation and Language Change
show glide-weakening of /ai/ in the pre-voiceless context may be best
understood as a case of dialect leveling.
8.4.2 /ai/ Glide-weakening and dialect leveling
Given the association of pre-voiceless glide-reduced variants of /ai/
with White Southern dialects, their apparent absence from Detroit
AAE until relatively recently (Anderson 2002; Nguyen 2006), the
large-scale migration of many of the Detroit African Americans from
the South, and the social ties of Detroit African Americans with White
Appalachians who also migrated from the South, it is likely that glide-
weakening of /ai/ in the progressive pre-voiceless following context
is a result of dialect contact following migration. Dialect contact
processes have effects which cannot always be explained in terms
of direct transmission of particular linguistic forms between speakers
(Anderson 2002). Phonological leveling is a process which reduces
allophonic differentiation and renders vowel systems more similar
to each other. Anderson and Milroy (MS), citing Trudgill (1986: 98),
note that socially marked or minority variants are most susceptible
to elimination.
The elimination of the pre-voiceless diphthongal allophone of /ai/
for the younger and middle-aged Detroit African American speakers is
a case of allophonic leveling. The spread of a glide-weakened variant
to the pre-voiceless context in Detroit AAE indexes a contrastive
identity with Midwestern Whites and a linguistic affiliation with the
South. The overall effect is that Detroit AAE aligns with a progressive
Southern vowel system for /ai/, including that of the Detroit Southern
White community, while indexing an opposition with Northern
Whites.
The social sensitivity to /ai/ is demonstrated in the extreme vari-
ability of diphthongization shown among the individual speakers.
Speakers 1 and 2 (the older African Americans) show the tradi-
tional pattern of pre-voiceless diphthongization. The middle-aged
and younger speakers show glide-weakening across voicing contexts
and tend to show a greater degree of diphthongization in pre-
voiced contexts than in pre-voiceless ones (see Section 7.2.4).
The Appalachian White speakers also show variability of diph-
thongization across individual speakers. All the Southern migrant
speakers—both African American and Appalachian White—show less

November 2007
MAC/MAL
Page-175
9780230_008861_09_cha08
Local and Supralocal Contexts for Patterns of Usage
175
diphthongization for /ai/ than Speaker 13, the Detroit White woman
(see Section 7.2.3).
Section 2.1.4 described the use of the Southern glide-weakened
variant of /ai/ as socially salient, both inside and outside of the
South (Wolfram and Schilling-Estes 1998; Plichta and Preston 2003),
one of those “linguistic practices more likely to be talked about
than others in metapragmatic commentary” (Phillips 2000: 233).
Nguyen (2006: 88) also comments on the social salience of /ai/;
she cites work by Rahman (2003, 2005) among African American
improvisational comedians. Nguyen discusses Rahman’s finding that
portrayals of African American characters utilized glide-weakened
variants of /ai/, but portrayals of markedly middle-class African
American speakers utilize diphthongal productions of /ai/. Speaker
12 commented specifically on the salience of pre-voiceless /ai/ for
her own speech (Section 8.2.6).
Pre-voiceless /ai/ glide-weakening is a stereotypical marker of
Southern speech (Johnstone 2003: 200; Plichta and Preston 2003).
The leveling of the diphthongal variant in the pre-voiceless context
by the middle-aged and younger African American speakers is ideo-
logically mediated. The changes affecting /ai/ in Detroit’s Northern
White neighborhoods follow very different trajectories, which Eckert
(1996) demonstrates are also highly socially salient (see Section 3.6).
One outcome of the changes in Detroit AAE is thus the main-
tenance of a strong linguistic boundary between Detroit AAE and
Midwestern White speakers, and a further outcome is the emer-
gence of the progressive pre-voiceless glide-weakened variant of /ai/,
which indexes a regional and linguistic affiliation with the South, an
affiliation shared with White Appalachian Southern migrants. The
patterning of /ai/ can be interpreted with reference to the speaker
comments in Sections 8.1 and 8.2 which revealed that the African
American participants maintain a variety of Southern cultural prac-
tices and maintain ties to the South evident, in some cases, in
plans to return to the South. The relevant social opposition for the
Detroit African American participants in this study is not with the
Appalachian Southern migrants but with Midwestern Whites who
live in the suburbs. Although all of the Appalachian migrant speakers
in this study but one were eventually able to move to the inner
suburbs, some of the Detroit African American participants indic-
ated that the only White people living with them in the inner city

November 2007
MAC/MAL
Page-176
9780230_008861_09_cha08
176
Migration, Accommodation and Language Change
suburbs were White Appalachians. Speaker 8 is an Appalachian White
Southern migrant in this study who remained in the inner city
instead of moving to the suburbs. Hartigan (1999) conducted ethno-
graphic fieldwork with Appalachian Whites in the central city, and
he also described cordial relations between African Americans and
Appalachian Whites in his study.
I am not suggesting that the leveling of the pre-voiceless allophone
of /ai/ for the African American speakers is the result of direct day-
to-day contact between African American and Appalachian White
speakers. The migration of African Americans from the South to
Detroit resulted in a massive upheaval and radical change to their
social and linguistic contexts which resulted in the pre-voiceless
diphthongal allophone of /ai/ becoming socially redundant. In the
South, AAE pre-voiceless diphthongal /ai/ indexes an opposition
with Southern White groups that use the variant, but it is no
longer necessary for the Detroit AAE speakers to index this social
opposition (Anderson 2002). Differentiation among different social
and linguistic groups became salient following migration from the
rural South to the urban Midwest, and these changes in social
differentiation yielded changes in language ideologies, ideological
stances (Nguyen 2006), language attitudes, patterns of use, and social
indexing among speaker groups. The expansion of the Southern
glide-weakened variant of /ai/ to the progressive pre-voiceless context
for the middle-aged and younger African American participants is a
linguistic reflex of a changed social differentiation following migra-
tion (Anderson 2002).
It is important to point out that, as noted in Chapter 5, this study
takes a detailed ethnographic and detailed acoustic approach and
is limited in terms of the small sample size in terms of speakers (6
African American and 6 Appalachian White Southern migrants). I am
not claiming that the vowel patterns reported in this study are typical
of all speakers of Detroit AAE. Nguyen found different patterns for
/ai/ in her dissertation about middle-class African American speech
in Detroit. Nguyen cross-compares the results of her study of vocalic
variables for contemporary men and women over a wide social
status spectrum with those of Anderson (2003), an earlier incarn-
ation of the present study. For /ai/, Nguyen’s speakers maintain
spectral differences between pre-voiced and pre-voiceless following
contexts, although she does note that /ai/ “may be becoming less

November 2007
MAC/MAL
Page-177
9780230_008861_09_cha08
Local and Supralocal Contexts for Patterns of Usage
177
diphthongal over time” (2006: 102). A particularly important finding
is that the females in her study are diphthongal for pre-voiceless /ai/.
She analyzes the differing results for pre-voiceless /ai/ between the
two studies in terms of ideological stances articulated by the different
sets of speakers for each study:
Far from contradicting Anderson’s results my analysis is that
the different results for (pre-voiceless) /ai/ in our studies reflect
the different ideologies of the speakers in our samples. As several
quotes from Anderson’s speakers showed, the speakers in her
sample expressed animosity toward Detroit and a cultural affinity
toward the South. Anderson linked these ideological stances with
the linguistic results she found, suggesting that the speakers in her
sample index a Southern orientation through their use of glide
reduction in voiceless contexts (157)
The speakers in Nguyen’s study “ do not share the hostility toward
Detroit, nor the affinity for the South ” Nguyen suggests:
if Anderson is correct in correlating her speakers’ feelings toward
Detroit and the South with their use of Southern White patterns
of /ai/ glide reduction, then we would predict, based on my own
speakers’ lack of such expressed ideologies about Detroit and the
South, that the speakers in my sample would not display the
Southern White pattern of /ai/ glide-reduction. Thus, I suggest
that the differences between my own results for /ai/ and those of
Anderson (2003) support Anderson’s correlation between ideo-
logical stances and linguistic use. (158)
Eagleton (1991: 9) describes ideology as “(concerning) the actual uses
of language between particular human subjects for the production of
specific effects” and as a “ function of the relation of an utterance
to its social context.” As Eagleton points out, an important factor to
consider when trying to understand the role of ideology encoded in
language is “ a question of who is saying what to whom for what
purposes” (9). In other words, it is important to consider the context
of the interview event when interpreting the patterns reported in
the analysis chapters. Participants were asked to tell me about their
everyday experiences in Detroit and to comment on changes they had

November 2007
MAC/MAL
Page-178
9780230_008861_09_cha08
178
Migration, Accommodation and Language Change
witnessed in Detroit in their lifetimes. The social salience of topics
centering on perceptions of the South and being Southern emerged
during the course of fieldwork. Eagleton also addresses the role of
context:
It may help to view ideology less as a particular set of discourses,
than as a particular set of effects within discourses. (Its) effects
are discursive, not purely formal, features of language. What is
interpreted will depend on the concrete context of the utterance,
and it is variable from one communicative situation to the next
(194). Ideology offers a set of reasons for material conditions
(209). A person’s “real” situation is inseparably bound up with
linguistic interpretation of one kind or another. (213)
The ideological stances evident in the comments for the African
American participants on the topics of life in the inner city, residen-
tial segregation, and important historical events such as the “White
Flight” and the 1967 riot reflect the material conditions of these
speakers and provide a context for the differentiation, both culturally
and linguistically, between the African American Southern migrants
and Midwestern Whites. This is particularly evident in the patterning
of the highly socially salient glide-weakened /ai/. The African Amer-
ican and Appalachian White Southern migrant participants in this
study show very different patterns of use for /ai/ than those described
by Eckert (2000) for non-Southern suburban Whites as well those
described by Nguyen (2006) for her sample of Detroit African Amer-
icans who did not report frustration with inner city life, as the
participants in my study did, or an affiliation with the South. More
generally, /ai/ is salient within the broader context of American
English (Wolfram and Schilling-Estes 1998).

November 2007
MAC/MAL
Page-179
9780230_008861_10_cha09
9
Conclusions and Implications
9.1 General commentary
Section 2.2 discusses Labov’s claim that large-scale vowel changes are
largely structured by language internal principles (Labov 1994). In his
second volume on language change, he suggests that, for the most
part, “social and structural elements in language (are) segregated”
(Labov 2001: 29). In short, he conceptualizes internal and external
types of change as two very different creatures which rarely interact:
internal and external (factors) are effectively independent of
each other. If an internal factor is dropped or changed, changes
appear in other internal factors, but the external factors remain
unchanged; if an external factor is dropped or changed, other
external factors change but the internal factors remain as they
were. These basic sociolinguistic findings provide the method-
ological rationale for the separate discussion of internal and
external factors. (Labov 1994: 3)
Chapter 8 considered internal constraints on the fronting of the
high and lower-high back vowels as well as the external motiva-
tions driving the allophonic leveling of diphthongal variant of /ai/
in the progressive pre-voiceless context. I have argued that some
vowel changes, such as /ai/ glide-weakening in the pre-voiceless
context, provide a crucial site for indexing an allegiance to the South
and an opposition with Midwestern Whites, while the other change
examined in this study, fronting of /u/ and /S/, does not constitute a
179

November 2007
MAC/MAL
Page-180
9780230_008861_10_cha09
180
Migration, Accommodation and Language Change
site for social and linguistic differentiation in Detroit (see also Nguyen
and Anderson 2006). Insisting that only language internal principles
structure vowel rotations in American English cannot explain these
patterns; nor does it have sufficient explanatory power to account for
why African American speakers show different reactions over time
and space to widespread changes such as /u/ and /S/ fronting and
regional changes such as pre-voiceless /ai/ glide-weakening. In the
South, African Americans are most typically characterized as avoiding
both of these changes (Labov 2001; Thomas 2001), but recent studies,
including Fridland (2003), Wolfram and Thomas (2002), and Childs
(2005) indicate that at least some African Americans in the South do
participate in these changes. Likewise, the Detroit African Americans
in this study participate in both of these changes which were previ-
ously described as characteristic of Whites only. Although fronting
of the back vowels shows strong contextual conditioning (i.e. are
internally constrained), the process is also subject to ideological inter-
vention. This could explain why at least some African Americans in
the South do not show fronting of the high and lower-high back
vowels or pre-voiceless /ai/ glide-weakening (Thomas 2001). In those
areas, where the salient division is along ethnic lines, backing for /u/
and /S/ remains a crucial site. Interestingly, it is these linguistically
conservative areas of the South (formally the plantation region of the
South), where Blacks and Whites show similar patterns of /ai/ glide-
weakening in that both groups maintain the diphthong in the pre-
voiceless context (Wolfram and Schilling-Estes 1998; Thomas 2001).
In those areas, it seems that /u/ and /S/ are crucial sites for ethnic
boundary marking while /ai/ is not. Recall from Section 2.1.4 that
glide-weakening in the pre-voiceless context is a progressive change
reported for restricted groups of speakers (e.g. in Texas as well as the
Smoky Mountain region of North Carolina and East Tennessee). For
the African Americans in Detroit and elsewhere that show fronting,
/u/ and /S/ have lost their social salience, that is their local meaning,
and no longer constitute a crucial site for the expression and main-
tenance of local language ideologies. /ai/, in contrast, is rich in local
meaning for both groups of Southern migrant speakers and Southern
speakers generally (Wolfram and Schilling-Estes 1998; Plichta and
Preston 2003; Tillery and Bailey 2003). /ai/ also shows a different
trajectory of change for White speakers in the suburbs, and is highly
socially salient there as well (Eckert 2000).

November 2007
MAC/MAL
Page-181
9780230_008861_10_cha09
Conclusions and Implications
181
As noted above, there are important sociolinguistic differences
between fronting of /u/ and /S/ and /ai/ glide-weakening. While
fronting of /u/ and /S/ are widespread, perhaps even global, changes
in varieties of English, glide-weakening of /ai/ is a more local change
associated with specific groups of people, namely African Americans
and some groups of Southern Whites. /ai/ has been described as
socially salient by many sociolinguistic researchers, including several
who have conducted research in Detroit (Deser 1990; Eckert 1996;
Edwards 1997). Social sensitivity to /ai/ is also expressed through the
extreme variability in the vowel realizations across speakers. This is
hardly surprising because it is a highly socially salient vowel feature
of Southern speech (Plichta and Preston 2003); also, Southern speech
in general is highly socially salient (Preston 1996; Johnstone 2003).
Fronting of /u/ and /S/ does not carry this kind of social significance
or receive this kind of public commentary; these are widespread vowel
changes affecting not just Southern varieties, but many varieties,
of American English (Labov 1994, 2001; Thomas 2001), including
General American English (Johnson 2003). Accordingly, fronted real-
izations of /u/ and /S/ do not appear to be crucial sites for the expres-
sion of a local language ideology for the Detroit African American
speakers in this study. Finally, the two sets of changes are different
in that fronting of /u/ and /S/ is internally constrained by contex-
tual effects from the following consonants. /ai/ glide-weakening, in
contrast, does not seem to follow a lawful, phonetically constrained
path of change. It is a different sort of change, dialect leveling, a
process which is frequently an outcome of language contact resulting
from situations of migration and mobility (Milroy 2002).
9.2 Limitations and contributions of the study and
implications for sociolinguistic research
This work, most certainly, does not represent the “last word” on AAE
and Appalachian English in Detroit. I want to mention the limitations
of this work. As discussed in Chapter 5, this study analyzes many
tokens from a small number of speakers (13 speakers for the main part
of the study; additional speakers were analyzed for the Pilot Study
discussed in Chapter 4). Due to the “case study” approach taken
here, I cannot make any large claims about Detroit speech or about
Appalachian English or AAE in a broad sense. Rather, I describe the

November 2007
MAC/MAL
Page-182
9780230_008861_10_cha09
182
Migration, Accommodation and Language Change
linguistic behavior of the Southern migrant participants in this study.
My claims are focused on their speech alone. I do not regret taking
the approach I chose. The depth-first approach allowed me to analyze
enough tokens (5859, to be exact) to understand the role of phonetic
context in shaping (more specifically, constraining) the patterns of
language use described in this study for the high and lower-high back
vowels. I hope I have demonstrated the importance of considering
phonetic context in discussions of language variation in American
English. The expense of a detailed acoustic analysis, as I have said,
is that it limited the number of speakers I was able to include in the
analysis. Finally, I want to acknowledge the vital importance of large-
scale studies of speech communities, such as those conducted by Walt
Wolfram and his students as well as the studies of Bill Labov and
his students; the methodology in this study aims only to supplement
these more traditional approaches.
I also want to acknowledge that studying language ideology
presents its own unique set of challenges. Since I did not specific-
ally attempt to obtain metapragmatic commentary on the vowels in
this study (I did not even know what vowels I would study when
I began the fieldwork), I am not able to operationalize ideology in
any concrete way, as pointed out by John Baugh (personal commu-
nication). The analysis appeals to a language ideological interpretive
framework, based on a framework developed by linguistic anthro-
pologists (see further Chapter 2), in a general, not a specific, way.
Eagleton (1991) defines ideology, in the general sense, as “any set of
beliefs motivated by social interests” (2). I have tried to reveal key
beliefs and participant interpretations of life in the Detroit metro-
politan area as encoded in commentary from individual participants.
I argue in particular that belief and attitudes shape language use
by creating social oppositions such as Southern/Midwestern White
and Inner City Detroit/Suburban Detroit, social oppositions that
are reflected in linguistic differentiation, such as the differentiation
between groups in Detroit for patterns of use for the socially salient
/ai/ vowel (see also Eckert 2000). However, I fully acknowledge the
slippery nature of ideology as reflected in language or any other social
behavior, and my claims concerning language ideology should be
understood as being tentative claims.
Despite its limitations, I hope this book has made contributions to
the study of language variation and American English vowel systems.

November 2007
MAC/MAL
Page-183
9780230_008861_10_cha09
Conclusions and Implications
183
This study has presented several methodological innovations (see
further Anderson 2003) which can be applied to future studies. The
goals of these methods are to allow cross-speaker comparisons and
facilitate replication by other researchers. For /u/ and /S/, I have
quantified fronting not simply through analysis of absolute F
2
meas-
urements, which vary substantially across speakers, but rather by
measuring the differences in F
2
between /u/ and /i/ and between
/S/ and /G/. This relative measure acknowledges that the notion of
fronting only has meaning in reference to the front of the vowel
space, as defined by the F
2
values of the front vowels. The findings
also demonstrate the need to consider effects of following context,
which are not generally analyzed in socioacoustic work on varieties of
American English. Diphthongization is also a relative notion, which
can best be quantified with reference to a non-diphthongal vowel
such as /?/. I have demonstrated a method for precisely quantifying
diphthongization of /ai/ by subtracting F
1
and F
2
midpoint values
from offset values. These measurements make it possible to specify
both the length and direction of the glide.
This project has also indicated several fruitful directions for future
research. The clear-cut contextual effects on the patterns of use
for /u/ and /S/ suggest that socioacoustic work on vowel systems
should consider context effects such as coarticulation. Based on the
results for this study, I would predict global, or frequently attested,
changes to show contextual conditioning at least in the earlier stages
of change. More established changes presumably show less contex-
tual conditioning. Different dialects and different speakers would
not be expected to show opposite patterns of shifting, but the rate
of change across environments could vary. Finally, future research
should also address the question of the degree to which African Amer-
icans are participating in widespread (which are not just “White-
spread”) vowel changes in American English.

November 2007
MAC/MAL
Page-184
9780230_008861_11_bib01
Bibliography
Akers, Elmer. 1936. Southern Whites in Detroit. Ph.D. Dissertation. University
of Michigan, Ann Arbor.
Anderson, Bridget L. 1997. “Adaptive sociophonetic strategies and dialect
accommodation: /ay/ monophthongization in Cherokee English.” Univer-
sity of Pennsylvania Working Papers in Linguistics 4(1): 185–202.
——. 1998. An Acoustic Study of Phonological Transfer and Vowel Accommod-
ation among the Snowbird Cherokee. Master’s Thesis, North Carolina State
University, Raleigh, NC.
——. 1999. “Source-language transfer and vowel accommodation in the
patterning of Cherokee English /ai/ and /oi/.” American Speech 74(4):
339–368.
——. 2001. “Phonetic variants are important in phonological processes.”
Linguistic Society of America Annual Meeting, Washington, DC.
——. 2002. “Dialect leveling and /ai/ monophthongization among African
American Detroiters.” Journal of Sociolinguistics 6(1): 86–98.
——. 2003. An Acoustic Study of Southeastern Michigan Appalachian and African
American Southern Migrant Vowel Systems. Ph.D. Dissertation. University of
Michigan.
——. In press. “A quantitative acoustic approach to /ai/ glide weak-
ening among Detroit African American and Appalachian White Southern
Migrants.” Language and Variety in the South III: Historical and Contemporary
Perspectives. Tuscaloosa: University of Alabama Press.
Anderson, Bridget L. and Mark Arehart. 2001. “Creaky voice and the Detroit
AAE vowel system.” New Ways of Analyzing Variation 30, Raleigh, NC.
Anderson, Bridget L. and Valerie Fridland. 2002. “A comparative study of /ai/
among African Americans in Memphis and Detroit.” New Ways of Analyzing
Variation 31, Stanford, CA.
Anderson, Bridget L. and Lesley Milroy. 1999. “Southern sound changes and
the Detroit African American English vowel system.” New Ways of Analyzing
Variation 28, Toronto.
——. 2001a. “Towards an integrated account of internal and external
constraints on language change.” Linguistic Society of America Annual Meeting,
Washington, DC.
——. 2001b. “Detroit Southern Migrant varieties of English and the Northern
Cities Shift.” New Ways of Analyzing Variation 30, Raleigh, NC.
——. Unpublished manuscript. Internal and External Constraints on Change in
the Detroit African American Vowel System: A Case Study and Some Further
Implications, The University of Michigan.
Anderson, Bridget L., Lesley Milroy, and Jennifer Nguyen. 2002. “Fronting
of /u/ and /
S
/ among Detroit African Americans: Evidence from real and
apparent time.” New Ways of Analyzing Variation 31, Stanford, CA.
184

November 2007
MAC/MAL
Page-185
9780230_008861_11_bib01
Bibliography
185
Ash, Sharon. 1996. “Freedom of movement: /uw/-fronting in the Midwest.”
In Jennifer Arnold, Reneé Blake, Brad Davidson, Scott Schwenter, and Julie
Soloman, eds. Sociolinguistic Variation: Data, Theory, and Analysis: Selected
Papers from NWAV 23 at Stanford. Stanford University: Center for the Study
of Language and Information. 162–175.
Bailey, Guy and Erik Thomas. 1998. “Some aspects of AAVE phonology.”
In Salikoko S. Mufwene, John R. Rickford, Guy Bailey, and John Baugh,
eds. African-American English: Structure, History, and Use. London: Routledge.
85–109.
Bailey, Guy, Tom Wikle, Jan Tillery, and Lori Sand. 1996. “The consequences
of catastrophic events: An example from the American Southwest.” In
Jennifer Arnold, Reneé Blake, Brad Davidson, Scott Schwenter, and Julie
Soloman, eds. Sociolinguistic Variation: Data, Theory, and Analysis. Stanford,
CA: Center for the Study of Language and Information.
Beckford, Alicia. 1999. A Sociophonetic Analysis of Jamaican Vowels. Ph.D.
Dissertation. University of Michigan, Ann Arbor.
Beddor, Patrice Speeter, James D. Harnsberger, and Stephanie Lindemann.
2002.
“Language-specific
patterns
of
vowel-to-vowel
coarticulation:
Acoustic structures and their perceptual correlates.” Journal of Phonetics 30:
591–627.
Bernstein, Cynthia and Elizabeth Gregory. 1993. “Measuring social causes of
phonological variables.” American Speech 68: 227–240.
——. 1994. “The social distribution of glide-shortened /ai/ in LAGS.” South-
eastern Conference on Linguistics 50. Memphis, TN.
Berry, Chad. 2000. Southern Migrants: Northern Exiles. Urbana and Chicago:
University of Illinois Press.
Campbell, Lyle. 1999. Historical Linguistics: An Introduction. Cambridge, MA:
MIT Press.
Chambers, Jack. 1992. “Dialect acquisition.” Language 68(3): 673–705.
——. 1995. Sociolinguistic Theory: Linguistic Variation and Its Social Significance.
Blackwell: Oxford.
Childs, Becky. 2005. Investigating the Local Construction of Identity: Sociophon-
etic Variation in Smoky Mountain African American Women’s Speech. Ph.D.
Dissertation. The University of Georgia.
Clarke, Sandra, Ford Elms, and Amani Youssef. 1995. “The third dialect
of English: Some Canadian evidence.” Language Variation and Change 7:
209–228.
Deser, Toni. 1990. Dialect Transmission and Variation: An Acoustic Analysis of
Vowels in Six Urban Detroit Families. Ph.D. Dissertation. Boston University.
Dressler, W.U. and S. Moosmuller. 1991. “Phonetics and phonology: A
socio-psycholinguistic framework.” Phonetica 48: 135–148.
Eagleton, Terry. 1991. Ideology: An Introduction. London: Verso.
Eckert, Penelope. 1987. “Relative values of opposing variables.” In K.M.
Denning, S. Inkelas, F.C. Mc Nair-Knox, and J.R. Rickford, eds. New Ways of
Analyzing Variation 15, Stanford, CA.
——. 1988. “Sound change and adolescent social structure.” Language in Society
17: 183–207.

November 2007
MAC/MAL
Page-186
9780230_008861_11_bib01
186
Bibliography
——. 1989. Jocks and Burnouts: Social Categories and Identity in the High School.
New York: Teachers College Press.
——. 1991. “Social polarization and the choice of linguistic variants.” In
Penelope Eckert, ed. New Ways of Analyzing Sound Change. San Diego:
Academic Press. 213–232.
——. 1996. “(ay) goes to the city: Reminiscences of Martha’s Vineyard.”
In John Baugh, Crawford Feagin, Greg Guy, and Deborah Schriffrin,
eds. Towards a Social Science of Language: Festschrift for William Labov.
Philadelphia and Amsterdam: John Benjamins. 47–68.
——. 2000. Linguistic Variation as Social Practice. Oxford: Blackwell.
——. 2001. “Style and social meaning.” In Penelope Eckert and John Rickford,
eds. Style and Sociolinguistic Variation. Cambridge: Cambridge University
Press.
Edwards, Walter. 1997. “The variable persistence of southern vernacular
features in the speech of inner city black Detroiters.” In Cynthia Bernstein,
Thomas Nunally, and Robin Sabino, eds. Language Variety in the South Revis-
ited. Tuscaloosa: University of Alabama Press. 76–86.
Elias, Katherine. M.S. The Detroit System: A Report on the Social Geography and
Demographic Structure of Detroit. The University of Michigan.
Evans, Betsy. 2001. Dialect Contact and the Northern Cities Shift in Ypsilanti,
Michigan. Ph.D. Dissertation. Michigan State University, Lansing.
Farley, Reynolds, Sheldon Danziger, and Harry Holzer. 2000. Detroit Divided.
New York: The Russell Sage Foundation.
Fasold, Ralph. 1969. A Sociolinguistic Study of the Pronunciation of Three Vowels
in Detroit Speech. Georgetown University mimeograph.
Foulkes, Paul and Gerald Docherty, eds. 1999. Urban Voices: Accent Studies in
the British Isles. London: Arnold.
Frekko, Susan. Unpublished manuscript. Detroit Project Participant Profiles. The
University of Michigan.
Fridland, Valerie. 1999. “The Southern Shift in Memphis, Tennessee.”
Language Variation and Change 11: 267–285.
——. 2001. “The relationship of network strength and changes in the Southern
Vowel Shift among African Americans in Memphis, Tennessee.” New Ways
of Analyzing Variation (NWAV) 30 , Raleigh, NC.
——. 2003. “Network strength and the realization of the Southern Vowel Shift
among African-Americans in Memphis, TN.” American Speech 78.
——. 2004. “Tied, tie and tight: /ay/ monophthongization among African-
Americans and European-Americans in Memphis, TN.” Journal of Sociolin-
guistics.
Gordon, Matthew. 1997. Urban Sound Change Beyond City Limits: The Spread
of the Northern Cities Shift in Michigan. Ph.D. Dissertation. University of
Michigan, Ann Arbor.
——. 2000. “Phonological correlates of ethnic identity: Evidence of diver-
gence?” American Speech 75: 115–136.
——. 2001. Small-Town Values, Big-City Vowels: A Study of the Northern Cities
Shift in Michigan. Durham, NC: Duke University Press.

November 2007
MAC/MAL
Page-187
9780230_008861_11_bib01
Bibliography
187
Graff, David, William Labov, and Wendell A. Harris. 1986. “Testing listeners’
reactions to phonological markers of ethnic identity: A new method
for sociolinguistic research.” In David Sankoff, ed. Diversity in Diachrony.
Amsterdam Studies in the Theory and History of Linguistic Science, series 4,
Current Issues in Linguistic Theory 53. Amsterdam: John Benjamins. 45–58.
Gregory, James N. 2005. The Southern Diaspora: How the Great Migrations of
Black and White Southerners Transformed America. Chapel Hill: University of
North Carolina Press.
Habick, Timothy. 1980. Sound Change in Farmer City: A Sociolinguistic Study
Based on Acoustic Data. Ph.D. Dissertation. University of Illinois, Urbana-
Champaign.
——. 1993. “Farmer City, Illinois: Sound systems shifting South.” In Timothy
C. Frazer, ed. “Heartland” English: Variation and Transition in the American
Midwest. Tuscaloosa: University of Alabama Press. 97–124.
Hall, Joseph S. 1942. “The phonetics of Great Smoky Mountain speech.”
American Speech Reprints and Monographs, No. 4. New York: Columbia Univer-
sity Press.
Hartigan, John Jr. 1999. Racial Situations: Class Predicaments of Whiteness in
Detroit. Princeton, NJ: Princeton University Press.
Hazen, Kirk and Ellen Fluharty. 2001. “Defining Appalachian English: Bidia-
lectalism and beyond.” New Ways of Analyzing Variation 30, Raleigh, NC.
Hillenbrand, James, Laura A. Getty, Michael J. Clark, and Kimberlee Wheeler.
1995. “Acoustic characteristics of American English vowels.” Journal of the
Acoustical Society of America 97(5): 3099–3111.
Irvine, Judith T. and Susan Gal. 2000. “Language ideology and linguistic differ-
entiation.” In Paul Kroskrity, ed. Regimes of Language. Santa Fe, NM: School
of American Research Press. 35–84.
Johnson, Keith. 1989. “Higher formant normalization results from auditory
integration of F2 and F3.” Perception and Psychophysics 46: 174–180.
——. 2003. Acoustic and Auditory Phonetics (2nd edition). Oxford: Blackwell.
Johnstone, Barbara. 2000. “The individual voice on language.” Annual Review
of Anthropology 29: 405–424.
——. 2003. “Features and the use of southern style.” In Stephen J. Nagle
and Sara L. Sanders, eds. English in the Southern United States. Cambridge
University Press. 159–172.
Jones, Jamila. Unpublished manuscript. The Vowel Systems of African Americans
in the Urban North. Michigan State University.
Jones, Jamila and Dennis R. Preston. In press. “AAE and identity: Constructing
and deploying linguistic resources.” H. Samy Alim and John Baugh, eds.
Festschrift for Geneva Smitherman. New York, NY: Routledge.
Kroskrity, Paul. 2000. “Regimenting languages: Language ideological perspect-
ives.” In Paul Kroskrity, ed. Regimes of Language. Santa Fe, NM: School of
American Research Press. 1–34.
Kurath, Hans and Raven I. McDavid, Jr. 1961. The Pronunciation of English in
the Atlantic States. Ann Arbor, MI: University of Michigan Press.
Labov, William. 1963. “The social motivation of sound change.” Word 19:
273–309.

November 2007
MAC/MAL
Page-188
9780230_008861_11_bib01
188
Bibliography
——. 1972. “Some principles of linguistic methodology.” Language in Society
1: 97–120.
——. 1991. “The three dialects of English.” In Penelope Eckert, ed. Analysis of
Sound Change in Progress. New York, NY: Academic Press.
——. 1994. Principles of Linguistic Change: Internal Factors. Cambridge, MA:
Basil Blackwell.
——. 1998. “Co-existent systems in African-American Vernacular English.”
In Salikoko S. Mufwene, John R. Rickford, Guy Bailey, and John Baugh,
eds. African-American English: Structure, History, and Use. London: Routledge.
110–153.
——. 2001. Principles of Linguistic Change: Social Factors. Oxford: Blackwell.
Labov, William and Wendell A. Harris. 1986. “De Facto Segregation of Black
and White vernaculars.” In David Sankoff, ed. Diversity and Diachrony.
Amsterdam Studies in the Theory and History of Linguistic Science, series
4, Current Issues in Linguistic Theory 53: 1–24.
Ladefoged, Peter. 1996. Elements of Acoustic Phonetics. Chicago: University of
Chicago Press.
Lass, Roger. 1997. Historical Linguistics and Language Change. Cambridge:
Cambridge University Press.
Lippi-Green, Rosina. 1997. English with an Accent: Language, Ideology and
Discrimination in the United States. London: Routledge.
Luthin, Herbert W. 1987. “The story of California (ow): The coming-of-age
of English in California.” In Keith M. Denning, Sharon Inkelas, Faye C.
McNair-Knox, and John C. Rickford, eds. Variation in Language: NWAV-
XV at Stanford. Proceedings of the Fifteenth Annual Conference on New Ways
of Analyzing Variation. Stanford, CA: Department of Linguistics, Stanford
University. 312–324.
MacMahon, Michael. 1998. Phonology. The Cambridge history of the English
language Volume IV; 1776–1997. Cambridge: Cambridge University Press.
373–535.
Mallinson, Christine, Walt Wolfram, and Jaclyn Fried. 2001. “Dialect accom-
modation in a bi-ethnic mountain enclave community: More evidence on
the earlier development of African American English.” Southeastern Confer-
ence on Linguistics LXIV, Knoxville, Tennessee.
Marckwardt, Albert H. 1957. Principal and Subsidiary Dialect Areas in the North-
Central States. Publication of the American Dialect Society 27.
Marks, Carole. 1989. Farewell—We’re Good and Gone: The Great Black Migration.
Blacks in the Diaspora Series. Bloomington: Indiana University Press.
Metropolitan Area Employment and Unemployment Summary. Accessed via
the internet at http://www.bls.gov/news.release/metro.nr0.htm
Milroy, James. 1992. Linguistic Variation and Change. Oxford: Blackwell.
Milroy, Lesley. 1987a. Observing and Analyzing Natural Language: A Critical
Account of Sociolinguistic Methods. Oxford: Blackwell.
——. 1987b. Language and Social Networks. Oxford: Blackwell.
——. 2002. “Introduction: Mobility, contact, and language change—
working with contemporary speech communities.” Journal of Sociolinguistics
6(1): 3–15.
Milroy, Lesley and Matthew Gordon. 2003. Sociolinguistics: Methods and Inter-
pretation. Oxford: Blackwell.

November 2007
MAC/MAL
Page-189
9780230_008861_11_bib01
Bibliography
189
Moreton, Elliott. 2004. “Realization of the English postvocalic [voice] contrast
in F
1
and F
2
.” Journal of Phonetics 32: 1–33.
Munro, Murray J., Tracey M. Derwing, and James E. Flege. 1999. “Canadians
in Alabama: A perceptual study of dialect acquisition in adults.” Journal of
Phonetics 27: 385–403.
Nguyen, Jennifer. 2006. The Changing Social and Linguistic Orientation
of the African American Middle Class. Ph.D. Dissertation. University of
Michigan.
Nguyen, Jennifer and Bridget Anderson 2006. “A comparison of /u/ and /
S
/
fronting for African American and White Detroiters.” New Ways of Analyzing
Variation (NWAV) 35, Ohio State University.
Niedzielski, Nancy. 1999. “The effect of social information on the perception
of sociolinguistic variables.” Journal of Language and Social Psychology 18(1):
62–85.
Ohala, John. 1981. “The origin of sound patterns in vocal tract constraints.”
In Peter MacNeilage, ed. The Production of Speech. New York: Springer Verlag.
189–216.
——. 1992. “The segment: Primitive or derived?” In G.J. Docherty and
D.R. Ladd, eds. Papers in Laboratory Phonology II: Gesture, Segment, Prosody.
Cambridge: Cambridge University Press.
Parr, John. 1998. “Detroit: Struggling against history.” In Bruce Adams
& John Parr, eds. Boundary Crossers: Case Studies of How Ten of
America’s Metropolitan Regions Work. Academy of Leadership: The Univer-
sity of Maryland Press. Accessed via the internet, http://www.academy.
umd.edu/Publications/boundary/CaseStudies/bcsdetroit.htm
Pederson, Lee. 1983. East Tennessee Folk Speech. New York: Verlag Peter Lang.
Peirce, Neil and Curtis Johnson. 1998. Boundary Crossers: Community Lead-
ership for a Global Age. Academy of Leadership: The University of
Maryland Press. Accessed via the internet, http://www.academy.umd.
edu/Publications/boundary/CaseStudies/bcsdetroit.htm
Phillips, Susan U. 2000. “Constructing a Tongan Nation-State through
language ideology in the courtroom.” In Paul Kroskrity, ed. Regimes of
Language. Santa Fe, NM: School of American Research Press. 229–257.
Pierrehumbert, Janet, Mary E. Beckman, and D.R. Ladd. 2001. “Conceptual
foundations of phonology as a laboratory science.” In N. Burton-Roberts,
P. Carr, and G. Docherty, eds. Phonological Knowledge: Its Nature and Status.
Oxford: Oxford University Press. 273–304.
Plichta, Bartek and Dennis Preston. 2003. “The /ay/s have it: Stereotype,
perception, and region. Paper presented at New Ways of Analyzing Variation
32. University of Pennsylvania.
Preston, Dennis R. 1996. “Where the worst English is spoken.” In Edgar
Schneider, ed. Focus on the USA. Amsterdam: John Benjamins. 297–360.
Preston, Dennis R., Rika Ito, Evans, Betsy E., and Jamila Jones (2000). Change
on top of change: Social and regional accommodation to the Northern Cities
Chain Shift. In H. Bennis, H. Ryckeboer, and J. Stroop, eds. De Toekomst van
de Variatielinguitiek (special issue of Taal en Tongval to honor Dr. Jo Daan
on her ninetieth birthday ed., 61–86). Amsterdam: Meertens.

November 2007
MAC/MAL
Page-190
9780230_008861_11_bib01
190
Bibliography
Rahman, Jacquelyn. 2003. “Golly gee! The construction of middle-class white
characters in the monologues of African-American comedians.” New Ways
of Analyzing Variation 32, Philadelphia, PA.
——. 2005. “ ‘Talking White at the Apollo’: African American narrative
comedians portraying the middle-class establishment.” American Dialect
Society Annual Meeting, Oakland, CA.
Repp,
Bruce.
1982.
“Categorical
perception:
Issues,
methods,
find-
ings.” Haskins Laboratories Report on Speech Research 70 (April–June):
99–183.
Schilling-Estes, Natalie. 1996. The Linguistic and Sociolinguistic Status of /ay/
in Outer Banks English. Ph.D. Dissertation. University of North Carolina,
Chapel Hill.
——. 1997. “Accommodation versus concentration: Dialect death in two post-
insular island communities.” American Speech 72: 12–32.
——. 2000. “Inter-ethnic differentiation and cross-ethnic accommodation:
/ay/ in Lumbee Native American Vernacular English.” Language Variation
and Change 3: 141–174.
SEMCOG (Southeastern Michigan Council of Governments). 1994. Patterns
of Diversity and Change in Southeast Michigan. Detroit: Community
Foundation.
Shuy, Roger, Walt Wolfram, and William K. Riley. 1968. Field Techniques in an
Urban Language Study. Washington, DC: Center for Applied Linguistics.
Silverstein, Michael. 1979. “Language structure and linguistic ideology.” In
Paul R. Clyne, William F. Hanks, and Carol L. Hofbaur, eds. In the Elements:
A Parasession on Linguistic Units and Levels. Chicago: Chicago Linguistics
Society. 193–247.
——. 1992. “The uses and utility of ideology: Some reflections.” Pragmatics 2:
311–323.
——. 1996. “Indexical order and the dialectics of social life.” In Risako Ide,
Rebecca Parker, and Yukako Sunaoshi, eds. Proceedings of the Third Annual
Symposium About Language and Society. Austin, TX. 266–295.
Stevens, Kenneth N. 1998. Acoustic Phonetics. Cambridge, MA: MIT Press.
Stewart, Kathleen. 1996. A Space on the Side of the Road: Cultural Poetics in an
“Other” America. Princeton, NJ: Princeton University Press.
Stockwell, Robert and Donka Minkova. 1997. “On drifts and shifts.” Studies in
Anglica Posnaniensia XXXI: 283–303.
——. 1999. Explanations of Sound Change: Contradictions between Dialect Data
and Theories of Chain Shifting. Leeds Studies in English, New Series Vol. XXX:
82–103.
Strange, Winifred. 1999. “Perception of vowels: Dynamic constancy.” In J.M.
Pickett, ed. Fundamentals of Speech Perception, Theory, and Technology. Boston:
Allyn & Bacon.
Strange, Winifred, T.R. Edman, and J.J. Jenkins. 1979. “Acoustic and phon-
ological factors in vowel identification.” Journal of Experimental Psychology:
Human Perception and Performance 5(4): 643–656.

November 2007
MAC/MAL
Page-191
9780230_008861_11_bib01
Bibliography
191
Sugrue, Thomas. 1996. The Origins of the Urban Crisis: Race and Inequality in
Post-War Detroit. Princeton: Princeton University Press.
Thomas, Erik. 1991. “The origin of Canadian Raising in Ontario.” Canadian
Journal of English Linguistics 36. 147–170.
——. 1993. “Vowel changes in Columbus, Ohio.” Journal of English Linguistics
22: 205–215.
——. 1995. Phonetic Factors and Perceptual Reanalyses in Sound Change. Ph.D.
Dissertation. University of Texas, Austin, TX.
——. 2000. “Spectral differences in /ai/ offsets conditioned by voicing of the
following consonant.” Journal of Phonetics 28: 1–25.
——. 2001. An Acoustic Analysis of Vowel Variation in New World English.
A Publication of the American Dialect Society 85. Durham: Duke University
Press.
Thomason, Sarah. 2001. Language Contact. Edinburgh University Press.
Tillery, Jan and Guy Bailey. 2003. “Urbanization and Southern American
English.” In Stephen J. Nagle and Sara L. Sanders, eds. English in the Southern
United States. Cambridge University Press. 159–172.
Trudgill, Peter. 1986. Dialects in Contact. Oxford: Blackwell.
Trudgill, Peter, Elizabeth Gordon, Gillian Lewis, and Margaret Maclagan. 2000.
The role of drift in the formation of native-speaker southern hemisphere
Englishes: Some New Zealand evidence. Diachronica 17(1): 111–138.
U.S. Bureau of the Census. 2000 U.S. Census Data. http://www.census.gov/
Watt, Dominic. 1998. Variation and Change in the Vowel System of Tyneside
English. Ph.D. Dissertation. University of Newcastle upon Tyne.
——. 2000. “Phonetic parallels between the close-mid vowels of Tyneside
English: are they internally or externally motivated?” Language Variation
and Change 12(1): 69–101.
Widick, B. J. 1989. Detroit: City of Race and Class Violence. Detroit, MI: Wayne
State University.
Williams, Cratis D. 1992. Southern Mountain Speech. Berea: Berea College
Press.
Wolfram, Walt. 1969. A Sociolinguistic Description of Detroit Negro Speech.
Washington, DC: Center for Applied Linguistics.
——. 1974. Sociolinguistic Aspects of Assimilation: Puerto Rican English in New
York City. Washington, DC: Center for Applied Linguistics.
——. 2007. “Sociolinguistic Folklore in the Study of African American
English.” Presentation at the Linguistic Society of America Annual Meeting,
Anaheim, CA.
Wolfram, Walt and Donna Christian. 1976. Appalachian Speech. Arlington: the
Center for Applied Linguistics.
Wolfram, Walt and Erik Thomas. 2002. The Development of African American
English. Oxford: Blackwell.
Wolfram, Walt and Natalie Schilling-Estes. 1998. American English: Dialects
and Variation. Oxford: Blackwell.
Wolfram, Walt, Erik Thomas, and Elaine W. Green. 2000. “The regional
context of earlier African-American speech: Evidence for reconstructing the
development of AAVE.” Language and Society 29: 315–355.

November 2007
MAC/MAL
Page-192
9780230_008861_11_bib01
192
Bibliography
Woods, Anthony, Paul Fletcher, and Arthur Hughes. 1986. Statistics in
Language Studies. Cambridge, England: Cambridge University Press.
Woolard, Kathryn A. 1998. “Introduction: Language ideology as a field of
inquiry.” In Bambi B. Schieffelin, Kathryn A. Woolard, and Paul V. Kroskrity,
eds. Language Ideologies: Practice and Theory. New York: Oxford University
Press. 3–47.
Woolard, Kathryn A. and Bambi Schieffelin. 1994. “Language Ideology.”
Annual Review of Anthropology 23: 55–82.

November 2007
MAC/MAL
Page-193
9780230_008861_12_ind01
Index
/ai/
African American English, 9
Appalachian English, 10
Detroit, 11
Glide-Weakening,
Monophthongization, 9
Glide-weakening, pre-voiceless, 9
social salience of Southern
variants of, 2, 181
Southern Whites, 9
voicing context, 63–4
African American
Detroit, 176
cultural similarities to Southern
Whites, 166
migration to, 176
migration to the Midwest, 1–3,
24–28
riots, 24–8
vowel systems, 7–9
African American English (AAE) ,
4–11, 12, 17–21, 24–34, 40–51,
53–63, 94–102, 142–81
Detroit, 18–21
Michigan, Southeastern, 21, 31
Southern U.S., 31–2
Akers, E., 21–4, 26
American English, 4–17, 30, 31,
102–4, 110–111, 169–73,
180–3
Anderson, B.L., 1, 9, 12–13, 16, 25,
29–30, 35, 37–9, 50, 60, 65, 66,
87–103, 111, 121, 128, 130, 165,
167, 168, 170–83
Appalachian
migration, 21–4
vowel systems, migrant, 28–31
Appalachian English, 3, 15, 18,
28–31, 34, 35, 181
Appalachian Whites
Detroit, 31–2
cultural similarities to Southern
African Americans, 31–3
discrimination and isolation,
21–4
migration to, 26–8
Ash, S., 12
attitudes, speaker, 15, 16
see also ideological stance
Bailey, G., 4, 6, 8, 9, 38, 40, 45, 81,
100, 166, 170, 171, 180
Beckford, A., 50, 81
Beddor, P.S., 80
Bernstein, C., 9
Berry, C., 1, 21, 23–8, 146
Campbell, L., 13
Chambers, J., 48, 53
Cherokee English, 103
Childs, B., 9, 12, 39, 80, 102, 103,
111, 128, 166, 170, 172, 180
Christian, D., 29, 30, 31, 56
Clarke, S., 12
coarticulation (anticipatory),
context effects of consonants on
preceding vowels, 80–1
crucial site, 2, 10, 13, 14, 165, 170,
179, 180, 181
Deser, T., 8, 11, 32, 181
Detroit
African American English, 31, 127,
164
Appalachian Whites, 18, 24, 26–8,
31, 43, 158, 168, 176
Demographics, 18–34
Detroit White Speech, 167
inner city, 2
193

November 2007
MAC/MAL
Page-194
9780230_008861_12_ind01
194
Index
Detroit – continued
pilot study, 35–46
Southern Migration, to Detroit,
21, 27, 146
African Americans, Southern,
26–33
Appalachian Whites, 28–31
suburbs, 10, 18, 33, 129–32
inner suburbs, 20, 34, 40, 134–7
outer suburbs, 137–8
Detroit study at the University of
Michigan, 130
dialect accommodation, 1, 2, 7–16
dialect contact, 1, 2, 16–17, 18, 94,
167, 172, 174
dialect leveling, 16, 172, 174, 181
Docherty, G., 50, 51
Eagleton, T., 177, 178, 182
Eckert, P.,10, 11, 33, 36, 49, 52, 54,
103, 130, 175, 178, 180, 181,
182
Edwards, W., 11, 26, 32, 54, 103,
130, 181
Elias, K., 20
ethnolinguistic boundary marker, 2,
167
Evans, B., 31
F
2
distance measures, 60, 65–70,
74–86, 168
Farley, R., 19, 20, 25, 34, 130–5,
158
Fasold, R., 6
Field Techniques, see Methodology
Fluharty, E., 29, 31
Foulkes, P., 50, 51
Frekko, S., 20, 35, 55, 56
Fridland, V., 103, 111
“friend-of-a-friend” fieldwork
method, 55–6
Gal, S., 14, 15, 16
Gordon, E., 8
Gordon, M., 49
Graff, D., 8
Graham County, North Carolina,
29, 30
Gregory, E., 9
Gregory, J.N., 146
Habick, T., 12
Hall, J.S., 29, 30, 161
Harris, W.A., 8
Hartigan, J., Jr., 21, 26–29, 54, 154,
176
Hazen, K., 29, 31
Hillenbrand, J., 54, 61–4, 66–70, 79,
80, 100, 120, 168
ideological stance, 2, 127, 176, 177,
178
individual speakers, 51–2, 54, 64,
66, 80, 89, 110, 165,
169, 174
Irvine, J.T., 14–16
Ito, R., 189
Johnson, K., 40
Johnson, C., 138
Johnstone, B., 51–2, 164, 175, 181
Jones, J., 8, 32, 33
Kroskrity, P., 14, 15
Kurath, H., 6, 30
Labov, W., 4–17, 31–2, 40, 45,
81, 165, 166, 170, 171,
179–82
Ladefoged, P., 87
language change/variation
external motivations/factors,
13–14
internal constraints/factors,
13–14
models, 13–14
language ideology
defined, 14–16
framework, 15
large-scale vowel rotations of
American English, 4, 12, 13, 18,
100
Lippi-Green, R., 16

November 2007
MAC/MAL
Page-195
9780230_008861_12_ind01
Index
195
local categories, 4, 49
hillbilly, 159–62
Southerner, 159
Yankees, 160–1
Luthin, H.W., 12
MacMahon, M., 12
Mallinson, C., 9, 103, 111, 128
Marckwardt, A.H., 6
Marks, C., 24
McDavid, R.I., Jr., 6, 7, 30
Michigan, Southeastern see Detroit
migration, the Great Southern
African American, 24–6
kin-based, 24
Southern Whites, 22–4
Milroy, J., 50, 51
Milroy, L., 47, 50, 130
Minkova, D., 7, 11, 12
models of language change
dialect contact, 16–17
external factors, 13–14
internal factors, 13–14
Moreton, E., 172, 173
Munro, M.J., 53
Nguyen, J, 39, 65, 87–100, 127,
167–8, 170, 174–80
Niedzielski, N., 34
Normalization, 40, 61, 66, 89
Northern Cities Shift, 5, 13, 18, 40,
45
Ohala, J., 80, 81
Parr, J., 138, 141, 142
participant comments
Detroit and relationship to
suburbs, 129–30
Coleman Young, first African
American mayor of Detroit,
130, 142–4
poverty and crime, 138–40
residential segregation, 130–2
riots, 140–2
suburbs, 134–8
White flight (migration out of
Detroit), 132–4
migration, South and Southern
cultural practices, 144–5,
151–6
metapragmatic commentary on
language
property, owning in South,
145–148
regional identity, 159–62
reverse migration, 145–8
Southern cultural practices, in
Detroit, 151–6
Southern Whites and Southern
African Americans,
Relationship, 156–9
ties to the South, 149–51
relatives, 149–51
trips, 149–51
participant observation, 33, 48,
49–50, 159
Pederson, L., 30
Peirce, N., 138
Phillips, S.U., 2, 10, 165, 175
phonological change
contextual effects, 81–3
contextually conditioned changes,
80–1
leveling, 89–91
pilot study, 35–46
Plichta, B., 9, 10, 171, 175, 180, 181
Preston, D.R., 8–10, 33, 171, 175,
180, 181
Rahman, J., 175
Repp, B., 51
Riley, W.K., 87, 127
Schieffelin, B., 14
Schilling-Estes, N., 5–12, 40, 45, 51,
103, 171, 175, 178, 180
SEMCOG (Southeastern Michigan
Council of Governments), 20,
25, 137
Shuy, Wolfram, and Riley’s Detroit
AAE corpus collected in 1966, 87
Silverstein, M., 14

November 2007
MAC/MAL
Page-196
9780230_008861_12_ind01
196
Index
Smoky Mountain English, 30
sociolinguistic and demographic
context, of study, 18–34
Southern cultural identity, 151–6
Southern food, 56, 152, 156
Southern shift, 6–7
spectral comparisons
spectral measures (FFT Analysis),
58
Stevens, K.N., 60, 81–7
Stewart, K., 23, 29
Stockwell, R., 7, 11, 12
Strange, W., 81, 163
Sugrue, T., 18, 21, 24, 25, 28
supralocal vowel changes, 129–78
Thomas, E., 4–16, 38–40, 45, 48, 50,
51, 80–1, 100–4, 166–7, 170–3,
180–1
Thomason, S., 16
Tillery, J., 9, 180
Trudgill, P., 12, 16, 17, 174
/u/ and /
S
/
comparisons of fronting
between African American
and Appalachian Whites in
Detroit, 87–99
comparisons of fronting between
African American and
Midwestern Whites in Detroit,
87–99
fronting, 94
pre-alveolar, 97–9
pre-labial, 94–9
pre-velar, 100–1, 167–8
rounding and backing, 86–7
word-final, 84
U.S. Bureau of the Census, 19–20
Watt, D., 13, 52, 80
Wheeler, K., 150
Widick, B.J., 132, 135, 141
Williams, C.D., 30
Wolfram, W., 4–12, 29–32, 39–40,
45–51, 81, 87, 94, 100, 104, 127,
159, 166–7, 171, 175, 178, 180,
182
Woolard, K.A., 14
Youssef, A., 185
Wyszukiwarka
Podobne podstrony:
A Look at the Articles of Confederation and the U S Constit
Ralph Abraham, Terence McKenna, Rupert Sheldrake Trialogues at the Edge of the West Chaos, Creativi
zooming in and out connecting individuals and collectivities at the frontiers of organizational netw
Burke, Michael; Kuzmicova, Anezka; Mangen Anne; Schilhab, Theresa Empathy at the Confluence of Neur
Walterowicz, Łukasz A comparative analysis of the effects of teaching writing in a foreign language
The Role of Language in the Creation of Identity Myths in Linguistics among the Peoples of the Forme
Eros and the Poetry At the Courts of Mary Queen of Scots and James VI
32 Abduction in Natural Language Understanding The Handbook of Pragmatics Blackwell Reference Onli
Recognizing and Understanding Revolutionary Change in Warfare The Sovereignty of Context
Midnight at the Well of Souls World Map Sheet
A Critical Look at the Concept of Authenticity
Midnight at the Well of Souls Navigation Sheet
Improve Yourself Business Spontaneity at the Speed of Thought
Midnight at the Well of Souls Solar System Sheet
Midnight at the Well of Souls Ship Blueprints
At the Boundaries of Automaticity Negation as Reflective Operation
Brief Look at the Code of Hammurabi
Midnight at the Well of Souls Character Sheet
Lovecraft At The Mountains Of Madness
więcej podobnych podstron