
Explaining Intraday Pattern of
Trading Volume from the Order
Flow Data
Yi-Tsung Lee, Robert C.W. Fok and Yu-Jane Liu*
1. INTRODUCTION
Extensive studies have documented a pattern of usually large
trading volume at the market open, and in particular at the close
in the New York Stock Exchange and Toronto Stock Exchange.
For example, Wood, McInish and Ord (1985), McInish and
Wood (1990a), McInish and Wood (1992) and Lockwood and
Linn (1990) found U-shaped patterns for intraday returns and
trading volume. Similar patterns have also been explored in some
Asian stock markets. For instance, Chow, Lee, Liu and Liu
(1994), Ho and Cheung (1991), as well as Ho, Cheung and
Cheung (1993) found extremely large trading volume at the
close in the Taiwan and Hong Kong stock markets. Hence, large
trading volume around market open and close is a global
phenomenon.
Many researchers dedicate their efforts to explain why such
patterns exist. McInish and Wood (1990b), Harris (1989) and
Porter (1992) suggested that day-end effects might account for
the pattern. Since different markets show similar intraday
patterns of trading volume, trading mechanisms may not be
Journal of Business Finance & Accounting, 28(1) & (2), January/March 2001, 0306-686X
ß Blackwell Publishers Ltd. 2001, 108 Cowley Road, Oxford OX4 1JF, UK
and 350 Main Street, Malden, MA 02148, USA.
199
* The authors are respectively from the National Chung Cheng University, Taiwan;
Shippensburg University, USA; and the National Chengchi University, Taiwan. Yi-Tsung
Lee would like to acknowledge the financial support of the National Science Council for
research presented in this article from grant No. NSC 88-2416-H-194-002-88-053. (Paper
received August 1998, revised and accepted February 2000)
Address for correspondence: Yi-Tsung Lee, Department of Accounting, National Chung
Cheng University, 160 San-Hsing, Ming-Hsiung, Chia-Yi 62117, Taiwan, ROC.
e-mail: actytl@accunix.ccu.edu.tw

responsible for the patterns. Information asymmetry has recently
been proposed as one of the possible explanations for the
pattern. Admati and Pfleiderer (1988 and 1989) pioneered to
construct a model and demonstrated that liquidity traders tend
to trade together to reduce the monopoly power of insiders. The
clustering of uninformed traders draws informed traders to the
market because informed traders benefit more from their private
information when noise traders trade. Using an information-
based model, Foster and Viswanathan (1990) contended that
information is accumulated during non-trading periods.
Therefore, informed traders may wish to enter the market as
soon as possible; otherwise, their private information will be
gradually revealed as transactions take place.
Brock and Kleidon (1992) proposed the risk-sharing
motivation. They suggested that day traders tend to shift the
risk of holding positions overnight to other traders. Following the
insight of Brock and Kleidon (1992), Gerety and Mulherin
(1992) asserted that traders who perform arbitrage functions
during active trading do not want to retain their holdings
overnight. Their results indicate that closing volume is related to
the expected overnight volatility underscoring risk-sharing
motives. Additionally, the expected and unexpected volatility
will affect the next open volume, which supports both the risk-
sharing motives and information asymmetry hypothesis. Using a
mathematical model, Slezak(1994) showed that closures delay
the resolution of uncertainty, and thus redistribute risk across
time and traders. As a consequence, the redistribution alters risk
premium, liquidity costs, and the degree of information
asymmetry.
All of these studies, except Gerety and Mulherin (1992), are
theoretical researches. Gerety and Mulherin (1992) adopted
Schwert's model to estimate the expected and unexpected
volatility. They validate the information asymmetry and risk-
sharing hypothesis in explaining trading volume. However, they
did not address how informed and uninformed traders behave
during the intraday periods. Studies on intraday trading yield
important policy implication. For example, Gerety and Mulherin
(1992) drew inference on the effect of trading halt from the
behavior of trading volume around market close. As
Bessembinder, Chan and Seguin (1996) claimed, `Despite the
200
LEE, FOK AND LIU
ß Blackwell Publishers Ltd 2001

importance of the topic, surprisingly little empirical research has
addressed the determinant of trading volume.' To date, there is
no close-up study on the trading behavior of different types of
investors and its impact on the intraday trading volume pattern.
This study extends the literature by examining the relationship
between investors' trading behaviors and trading volume during
intraday periods. The pivotal contribution of this study is to track
the intraday trading behavior of informed and uninformed
investors directly using a complete limit order book data of the
Taiwan Stock Exchange. We examine the intraday pattern of
information orders and liquidity orders as well as the ordering
strategies of both informed and uninformed (liquidity) traders.
The study finds the following important pattern of intraday
trading: First both informed and uninformed investors tend to
place more orders at both the market open and the close.
Second, real orders exhibit a J-shaped pattern while waiting
orders are in a reversed J-shaped pattern. Third, the impact of
liquidity trading on volume is relatively larger than that of the
information trading.
In this study, we use order flow data from the Taiwan stock
market (TWSE). The data allows us to examine investors' trading
behaviors directly. There are several merits of using the order
flow data: (1) We can exclude the impact of trading rules of
execution; (2) TWSE is an agent market. Using the data from the
market excludes the influences of dealer or specialist systems in
the investigation of intraday patterns of trading volume; (3)
Previous studies have used location in spreads to proxy for
relative pressure of buy and sell orders. As pointed out by Lee
and Ready (1991), these measurements may be biased. With
order flow data, we can identify directly whether a trade is buyer-
initiated or seller-initiated; (4) It allows us to construct proxies
for information trading and liquidity trading.
The following section investigates the intraday pattern of
trading volume in the Taiwan stock market based on the intraday
transaction data from March 1 to May 31, 1995. Testable
hypotheses are constructed and variables used in the regression
analysis are defined in Section 3. Empirical results are provided
in Section 4. Finally, concluding remarks are made in Section 5.
INTRADAY PATTERN OF TRADING VOLUME
201
ß Blackwell Publishers Ltd 2001

2. INTRADAY PATTERN OF TRADING VOLUME
(i) Data Descriptions
The Taiwan stock market uses a call system except for the open. For
the open trade, orders with the same price are matched randomly.
For other time intervals, orders are matched based on price-time
priority. The market opens a call at 9:00 A.M. by accumulating the
entering orders from 8:30 A.M. to 9:00 A.M. The calls during the
remaining periods (from 9:00 to 12:00, excluding the open trade)
are executed for one minute on average (for more details, see Chow,
Hsiao and Liu, 1999). It is an agency market in which no dealers or
specialists are involved in the market. Thus, using the data from the
Taiwan stock market enables us to investigate intraday patterns in a
way that results are not contaminated by different auction
mechanisms in various intraday trading periods. Furthermore, since
most stocks in the Taiwan stock market are actively traded, our
results are not likely affected by nonsynchronous trading.
Order flow data and transaction data from the Taiwan stock
market under study is for the period from March 1 to May 31, 1995.
We have an electronic complete limit order book which provides
data on all trades including quotations, buy or sell-initiated shares
in lots and time-stamped. The data allows us to identify different
types of investors and their trading behaviors. In addition, the data
avoids the bias that may be caused by only investigating part of the
order flow files (e.g. Biais, Hillion and Spatt, 1995).
In order to distinguish traders' real trading intention versus
desire for information, data from individual stocks instead of the
market indices are examined. We analyze the 30 most actively
traded stocks in the sample period. The 30 stocks account for
more than 46% of the total market value of the stocks traded in
the TWSE, therefore, the sample is representative.
(ii) Intraday Pattern of Trading Volume
The intraday pattern of trading volume for our sample firms
across 31 time intervals is summarized in Figure 1. The first point
represents the open trade. The others are six-minute intervals.
Previous studies find a U-shaped pattern for trading volume.
Figure 1 indicates a different pattern for our sample firms.
202
LEE, FOK AND LIU
ß Blackwell Publishers Ltd 2001
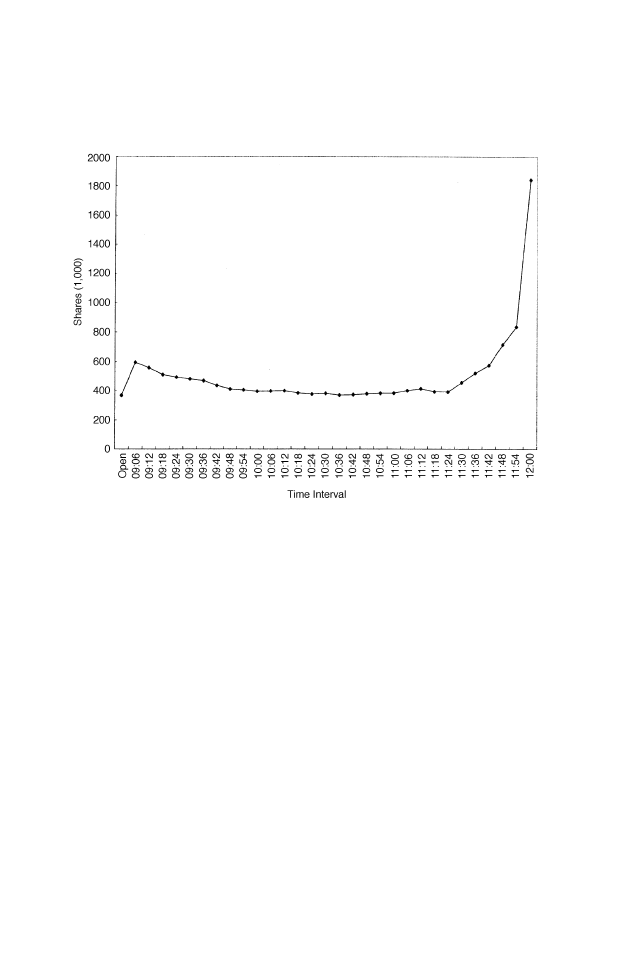
Surprisingly, a J-shaped rather than a U-shaped pattern is found.
The lowest trading volume occurs at the open trade. This could
not be due to late reporting because the calls in the TWSE are
executed no more than 90 seconds on average. The trading
shares jump up at 9:06, taper through the interior periods
gradually, and rise rapidly at the end of the trading day, especially
for the last six minutes. F test results indicate that trading volume
at the market close is statistically different from that of the open
trade and from those in the interior periods (9:06-11:54): F
-open,
close
and F
-close, inn
are 20.2 and 17.54 respectively, where F stands
for F-statistic, `open' represents the open trade, `inn' represents
the interior periods from 9:06 to 11:54, and `close' represents the
last trade interval (11:54±12:00). However, trading volume at the
open is not significantly different from those of the other time
intervals excepting the last trading interval (11:54±12:00).
The J-shaped pattern does not necessarily contradict to the
findings reported in previous studies. As Foster and Viswanathan
(1990) reported, less active firms show a more pronounced U-
Figure 1
Intraday Volume
INTRADAY PATTERN OF TRADING VOLUME
203
ß Blackwell Publishers Ltd 2001

shaped pattern of trading volume. Our sample includes the most
active stocks in the Taiwan market, so it is not surprising to find a
less pronounced U-shaped pattern. Moreover, if the open trade is
included into the 9:00±9:06 interval, trading volume confers
more closely to a U-shaped pattern. Nevertheless, Figure 1 shows
that trading volume is extremely large at the market close, i.e., a
closure effect is evident.
3. TESTING HYPOTHESES AND MEASUREMENT OF VARIABLES
(i) Testable Hypothesis
In the following, we investigate how trading volume is related with
the trading behaviors of informed and uninformed traders. Firstly,
we examine if concentrated trading exists during the intraday
period. Secondly, we investigate whether informed traders and
uninformed traders cluster their orders at the market open and
the close. Finally, we examine the ordering strategy of informed
and uninformed traders by decomposing total orders into real and
waiting orders. The testing hypotheses are listed below.
H
1
: Investors tend to place more orders at the open and the
close than at the interior periods.
Admati and Pfleiderer (1988 and 1989) showed mathematically
that concentrated trading exists at the market open and the
close. They demonstrated that liquidity traders tend to trade
together to reduce the monopoly power of insiders. The
clustering of uninformed traders draws informed traders to the
market. However, trading volume may not be a good proxy for
trading intention of investors, since trading volume may also be
affected by trading rules of execution. In particular, if the trading
rules for the open, close and the rest of the trading periods are
different, results based on trading volume may be biased.
To examine if large trading volume implies concentrated
trading, this study adopts original entering orders to examine the
traders` desires to place their orders. We hypothesize that
investors tend to place more orders at the market open and
the close than at the interior periods. Therefore, clustering
orders are expected around the market open and the close.
204
LEE, FOK AND LIU
ß Blackwell Publishers Ltd 2001

H
2
: The clustering of informed and uninformed traders at
market open and the close contribute to the intraday
pattern.
Admati and Pfleiderer (1988 and 1989) demonstrated that
liquidity traders and informed traders tend to cluster their trade
at the open and close. Foster and Viswanathan (1990) contended
that informed traders might wish to enter the market at the open
to avoid revealing their private information. In order to examine
these arguments, we classify total orders into informed and
uninformed orders (or liquidity orders). We hypothesize that
informed orders and uninformed orders at the open and the
close are larger than those at the rest of the trading intervals.
Furthermore, concentrated trading by informed and uninformed
traders accounts for the intraday pattern of trading volume.
H
3
: Traders place orders strategically and conservatively at the
market open.
Slezak(1994) proved that closures delay the resolution of
uncertainty, thereby redistributing risk across time and traders.
We hypothesize that traders strategically place their orders due to
closure effects. Due to high uncertainty generated from non-
trading periods, traders place their orders conservatively at the
market open.
(ii) Measurement of Variables
To test the aforementioned hypotheses, we need to measure
investor's trading desire and identify whether an investor is an
informed or uninformed trader. Measurements of the key
variables used in this study are defined in the following section:
(a) Traders Desires
The indicators listed below are used to measure trading desires of
investors. B
i;t
S
i;t
represents total buy (sell) orders at interval i
on day t. Orders are expressed in terms of trading lots (LOT) and
number of orders (NUM). The measurement interval, i, is six
minutes. There is always a trade-off between price priority and
waiting costs for traders to place their orders. If traders place a
low (high) price to buy (sell) stocks, they prefer to wait for a good
INTRADAY PATTERN OF TRADING VOLUME
205
ß Blackwell Publishers Ltd 2001

opportunity to get better prices. Such orders may be invalid for
execution and reflect desires for price priority rather than real
trading intention. On the contrary, if traders place a high (low)
price to buy (sell) stocks, they show great intention to have their
orders being executed. Such orders represent real trading
intention rather than desires for price priority. Therefore, we
classify total orders into two categories. Real buy (sell) orders at
interval i on day t, RB
i;t
RS
i;t
are buy (sell) orders that are
greater (lower) than or equal to two ticks from the previous
transaction prices. Waiting buy (sell) orders at interval i on day t,
UB
i,t
(US
i,t
), are orders that are lower (greater) than or equal to
two ticks from the previous transaction prices. If investors have
strong desires to place their orders at market open and close, we
would find U-shaped patterns for real buy and sell orders.
(b) Informed Traders and Uninformed Traders
Past theoretical studies suggested that trading volume is partially
determined by the interaction of informed and uninformed
traders. Unfortunately, previous studies fail to measure trading
activity of informed and uninformed traders due to data
limitation. With a complete limit order book, we can construct
proxies for informed trading and liquidity trading. We classify
investors as informed and uninformed traders based on the order
size in terms of trading lots. Two lines of researches can rationalize
the use of order size to define informed and uninformed traders.
Easley and O`Hara (1987) argued that informed traders tend to
trade large amounts at any given price. The stealth trading
hypothesis proposed by Barclay and Warner (1993) hypothesized
that informed traders tend to place medium to large orders.
Recently, Lee, Lin and Liu (1999) provided evidence that big
individual investors are the most well informed traders on the
Taiwan Stock Exchange. Moreover, they found that small orders
(uninformed orders) provide liquidity to the market.
In this study, orders with size greater than or equal to 20 lots
are defined as informed orders, and uninformed orders (or
liquidity orders) are orders with less than 20 lots. The choice of
20 lots as the cutting point is arbitrary. Nevertheless, 20 lots
would be regarded as a medium trade size in the TWSE. As the
stealth trading hypothesis suggests, informed traders tend to split
206
LEE, FOK AND LIU
ß Blackwell Publishers Ltd 2001

their transaction into several medium trades. In addition, Lee,
Lin and Liu (1999) also defined informed and uninformed
trades based on order size. They found that a cutting point of 10
lots and 20 lots yielded similar empirical results.
4. EMPIRICAL RESULTS
(i) Trading Behaviors of Informed and Uninformed Traders
The distribution of buy and sell orders across the 31 time
intervals is shown in Table 1a. Orders are measured in terms of
lots (LOTS) and the number of orders (NUM). The first session
(OPEN) indicates the orders accumulated from 8:30 up to the
first trade. The others are six-minute intervals. The times shown
in the first column of Table 1a indicate when a six-minute
interval is ended. For example, the second interval `9:06' stands
for the time period from 9:00 to 9:06 excluding the first trade.
The last interval `12:00' stands for the interval from 11:54 to
12:00. The time interval from 9:06±11:54 is defined as the interior
period, `inn'. Regardless of the measurement unit, investors'
orders display an unambiguous U-shape pattern. Total order is
the largest at the open, and the second largest order appears at
the market close. F-statistics indicate that total orders at the open
and the close are significantly different from those in the interior
periods (F
-open,inn
= 28.41; F
-close,inn
= 11.62). The finding
supports the first hypothesis, that is, investors tend to cluster
their orders at the market open and the close.
Trading lots and the number of orders at the open are almost
two times of those at the market close. A detailed examination of
Table 1a indicates that this is mainly driven by the behavior of sell
orders. Sell orders dominate buy orders at the market open. Sell
LOTS and NUM are 2719.49 and 257.36, respectively, compared
with 1760.35 and 180.24 for the buy LOTS and NUM. There is a
relatively small difference between buy orders at the open and
those at the close. Moreover, at the market close, the sizes of sell
and buy orders are similar. Buy LOTS and NUM are 1164.28 and
105.25, respectively, compared with sell LOTS and NUM 1151.65
and 102.99 respectively at the close. The large sell order at the
open could be a reflection of a high level of uncertainty.
INTRADAY PATTERN OF TRADING VOLUME
207
ß Blackwell Publishers Ltd 2001

Table 1a
Buy and Sell Orders
BUY
SELL
TOTAL(B+S)
LOTS
NUM
LOTS
NUM
LOTS
NUM
Open
1760.35
180.24
2719.49
257.36
4479.84
437.60
9:06
602.81
52.99
694.13
57.18
1296.94
110.17
9:12
604.89
55.39
708.67
66.99
1313.56
122.38
9:18
560.28
52.60
587.43
57.00
1147.71
109.61
9:24
541.58
50.42
531.83
51.51
1073.41
101.94
9:30
484.80
46.36
513.14
49.97
997.93
96.33
9:36
473.05
43.99
508.72
48.78
981.77
92.77
9:42
445.80
43.01
461.68
45.40
907.48
88.41
9:48
391.69
39.38
429.67
42.29
821.36
81.67
9:54
380.62
37.69
412.28
41.04
792.90
78.73
10:00
364.86
36.34
409.96
40.41
774.82
76.75
10:06
392.37
38.65
386.31
37.99
778.67
76.64
10:12
387.12
38.31
393.43
38.74
780.54
77.05
10:18
378.69
37.16
373.90
36.58
752.58
73.74
10:24
351.54
35.10
348.03
34.46
699.57
69.57
10:30
349.87
33.77
359.54
35.00
709.41
68.77
10:36
329.60
33.08
350.43
33.42
680.04
66.50
10:42
335.88
33.91
346.79
33.06
682.67
66.97
10:48
348.37
35.59
324.18
31.47
672.54
67.06
10:54
362.24
36.76
331.82
31.89
694.06
68.65
11:00
347.51
35.35
339.35
32.82
686.86
68.17
11:06
335.39
32.60
368.22
34.54
703.61
67.14
11:12
353.05
34.68
376.94
35.67
729.99
70.35
11:18
349.60
35.04
354.70
34.16
704.30
69.21
11:24
359.91
36.53
327.70
32.82
687.60
69.35
11:30
390.59
38.80
374.85
35.83
765.44
74.63
11:36
428.38
41.02
423.74
40.02
852.12
81.04
11:42
474.11
45.92
445.50
42.77
919.61
88.69
11:48
582.22
55.89
510.43
48.90
1092.65
104.79
11:54
662.32
66.31
600.93
58.05
1263.25
124.36
12:00
1164.28
105.25
1151.65
102.99
2315.93
208.24
AVERAGE
500.41
48.64
540.164
51.464 1024.49
98.62
F-all
9.96**
17.36**
20.28**
28.41**
15.38**
23.30**
F-open, 9:06
13.19**
25.14**
25.66**
35.18**
20.47**
31.03**
F-open, inn
18.92**
31.58**
34.77**
42.33**
28.41**
37.99**
F-open, close
2.71
6.79*
12.94**
18.73**
7.62**
12.89**
F-9:06, inn
2.11
1.47
4.10*
2.61
3.07
2.02
F-9:06, close
6.04*
8.76**
3.72
7.88**
4.81*
8.40**
F-close, inn
12.17**
14.65**
11.04**
16.51**
11.62**
15.64**
Notes:
Orders are expressed in terms of lots (LOTS) and number of orders (NUM). One lot
equals to 1,000 shares. F stands for F-statistic; `all' represents all trade intervals; `open'
represents the open trade; `9:06' represents the first six-minute interval (9:00±9:06)
excluding the open trade; `inn' represents interior periods from 9:06 to 12:00; `close'
represents the last trade interval (11:54±12:00). *, ** indicates significance at the 1% and
10% levels, respectively.
208
LEE, FOK AND LIU
ß Blackwell Publishers Ltd 2001

Table 1b
Order/Volume Ratio and Order Price Spread
Time Interval
Order/Volume Ratio
Order Price Spread
Open
27.7995
1.64398
9:06
4.7335
ÿ0.34812
9:12
4.5707
ÿ0.25677
9:18
4.2773
ÿ0.29271
9:24
4.2927
ÿ0.34481
9:30
3.5854
ÿ0.39852
9:36
3.5945
ÿ0.39353
9:42
3.9469
ÿ0.43050
9:48
3.3957
ÿ0.43947
9:54
3.3979
ÿ0.44465
10:00
3.4905
ÿ0.51876
10:06
3.3758
ÿ0.52619
10:12
3.3008
ÿ0.54541
10:18
3.1984
ÿ0.55570
10:24
3.3374
ÿ0.58733
10:30
3.2276
ÿ0.65403
10:36
3.2233
ÿ0.62710
10:42
3.1608
ÿ0.63968
10:48
3.0454
ÿ0.64929
10:54
2.8778
ÿ0.69568
11:00
2.7656
ÿ0.71159
11:06
3.0240
ÿ0.72560
11:12
2.8690
ÿ0.74839
11:18
2.8316
ÿ0.83204
11:24
2.6757
ÿ0.84706
11:30
2.4353
ÿ0.91175
11:36
3.0604
ÿ0.95526
11:42
2.2635
ÿ1.09502
11:48
1.9511
ÿ1.24558
11:54
1.7914
ÿ1.47301
12:00
1.3044
ÿ2.53481
AVERAGE
3.9614
ÿ0.63821
F-all
65.72**
62.48**
F-open, 9:06
77.50**
148.61**
F-open, inn
95.04**
246.18**
F-open, close
110.83**
289.81**
F-9:06, inn
4.19*
8.58**
F-9:06, close
22.09**
95.34**
F-close, inn
75.98**
77.82**
Notes:
Orders and volume in a certain trade session are expressed in terms of lots (LOTS). One
lot equals to 1,000 shares. Order price spread of a stock equals to average selling price
minus average buying price for the stock in a certain trade session. F stands for F-statistic;
`all' represents all trade intervals; `open' represents the open trade; `9:06' represents the
first six-minute interval (9:00±9:06) excluding the open trade; `inn' represents interior
periods from 9:06 to 12:00; `close' represents the last trade interval (11:54±12:00).
*, ** indicates significance at the 1% and 10% levels, respectively.
INTRADAY PATTERN OF TRADING VOLUME
209
ß Blackwell Publishers Ltd 2001

Interestingly, while the largest total order appears at the open,
trading volume (as shown in Figure 1) is at its peak at the market
close. Table 1b shows the order/volume ratio and the order price
spread (OPS). Order price spread of a stock equals average
selling price minus average buying price for the stock in a certain
trade session. The number shown in Table 1b is the average OPS
of the 30 sample firms. The order/volume ratio is extremely high
at the open and then decreases gradually. On the other hand,
OPS is positive at the open but becomes negative afterwards. A
high order/volume ratio and a large OPS imply a low chance for
orders to be executed and vice versa. Therefore, Table 1b further
illustrates that many of the orders placed at the open are not
executable. As investors may place orders conservatively, total
order may not be a good measure of real trading intention.
Therefore, it is important to distinguish real orders from waiting
orders ± the orders which are less likely to be executed.
To examine why large open orders do not lead to large trading
volume, we decompose total orders into real and waiting orders.
This decomposition is important to identify the real trading
intention of investors. To `test' the market, investors may place
orders that are not likely to be executed. As defined earlier, real
buy (sell) orders are those that have quotes greater (lower) than or
equal to two ticks from the previous transaction prices. Buy (sell)
orders that have quotes lower (greater) than or equal to two ticks
from the previous transaction prices are classified as waiting orders.
As shown in Table 2, the largest waiting orders occur at the
open. Only 38% [664.71/(664.71 + 1095.64)] of buy orders and
31% [(839.11/(839.11 + 1880.38)] of sell orders at the open are
real orders. Waiting orders dramatically decrease after the
market open and become stable after one hour of trading. This
is probably due to high uncertainty existing at the market open.
As information releases gradually, investors are willing to place
more executable orders. Therefore, waiting orders decrease
continuously since the open trade. Regardless of the fact that
waiting orders increase slightly at the market close, real buy and
real sell orders are the largest at the market close. About 93%
(1082.14/1164.28) of buy orders and 94% (1083.06/1151.65) of
sell orders are real orders. This implies that through trading,
private information is revealed and traders are less conservative at
the close than at the open. To sum up, results from Table 2
210
LEE, FOK AND LIU
ß Blackwell Publishers Ltd 2001

Table 2
Real and Waiting Orders in Terms of Lots in Trades
Time
Real Orders
Waiting Orders
Interval
BUY
SELL
BUY
SELL
Open
664.71
839.11
1095.64
1880.38
9:06
476.81
475.80
126.00
218.33
9:12
475.25
520.70
129.64
187.97
9:18
457.59
442.16
102.69
145.27
9:24
443.85
411.04
97.74
120.81
9:30
412.90
399.52
71.90
113.63
9:36
388.05
410.00
85.00
98.73
9:42
371.87
378.04
73.93
83.63
9:48
331.70
356.98
59.99
72.68
9:54
321.35
344.56
59.26
67.70
10:00
314.12
340.88
50.73
69.06
10:06
322.68
320.91
69.78
65.41
10:12
325.07
334.51
62.04
58.92
10:18
323.26
318.26
55.43
55.64
10:24
304.92
303.07
46.54
44.95
10:30
305.78
312.88
44.09
46.67
10:36
286.06
303.76
43.54
46.68
10:42
292.19
304.13
43.69
42.66
10:48
305.76
281.24
42.60
42.94
10:54
322.99
288.16
39.26
43.66
11:00
304.65
298.17
42.86
41.18
11:06
297.80
325.87
37.59
42.35
11:12
308.71
335.20
44.34
41.73
11:18
302.72
319.56
46.88
35.14
11:24
316.43
297.52
43.47
30.18
11:30
346.37
339.01
44.22
35.84
11:36
385.43
380.67
42.95
43.07
11:42
424.75
403.33
48.71
42.17
11:48
527.65
461.06
54.57
49.37
11:54
606.63
555.20
55.68
45.73
12:00
1082.14
1083.06
82.14
68.59
AVERAGE
398.39
402.72
94.93
128.42
F-all
5.15**
5.40**
21.77**
40.25**
F-open, 9:06
1.95
5.15*
20.66**
35.42**
F-open, inn
6.36*
10.04**
23.89**
42.98**
F-open, close
3.78
1.03
22.73**
42.76**
F-9:06, inn
1.32
1.44
6.35*
15.45**
F-9:06, close
8.77**
8.35**
2.19
14.05**
F-close, inn
13.60**
12.62**
1.39
0.05
Notes:
F stands for F-statistic; `all' represents all trade intervals; `open' represents the open trade;
`9:06' represents the first six-minute interval (9:00±9:06) excluding the open trade; `inn'
represents the interior periods from 9:06 to 11:54; `close' represents the last trade interval
(11:54±12:00). *, ** indicates significance at the 1% and 10% levels, respectively.
INTRADAY PATTERN OF TRADING VOLUME
211
ß Blackwell Publishers Ltd 2001

Table 3
Informed and Uninformed Orders
Time
Real Orders
Waiting Orders
Informed/
Interval
BUY
SELL
BUY
SELL
Uninf.
Informed
Uninf.
Informed
Uninf.
Informed
Uninf.
Informed
Uninf.
Open
410.53
254.17
545.21
293.91
714.92
380.72
1291.89
588.49
1.95
9:06
317.76
159.05
330.31
145.50
86.78
39.22
156.24
62.09
2.20
9:12
311.99
163.25
341.53
179.17
89.08
40.56
122.31
65.66
1.93
9:18
301.83
155.76
287.22
154.94
65.14
37.55
95.87
49.40
1.89
9:24
293.29
150.55
267.68
143.34
64.12
33.62
79.37
41.44
1.91
9:30
270.57
142.33
258.38
141.13
44.15
27.75
74.54
39.09
1.85
9:36
255.19
132.86
269.56
140.43
57.27
27.73
64.11
34.62
1.93
9:42
243.77
128.10
244.79
133.25
46.67
27.25
53.24
30.39
1.84
9:48
213.68
118.02
231.72
125.27
35.95
24.04
46.57
26.12
1.80
9:54
207.41
113.95
221.85
122.73
37.02
22.25
42.58
25.12
1.79
10:00
202.89
111.23
220.26
120.64
30.29
20.45
44.38
24.69
1.80
10:06
207.19
115.40
205.05
115.85
45.31
24.47
43.70
21.70
1.81
10:12
208.87
116.20
215.99
118.52
40.44
21.60
37.95
20.97
1.81
10:18
210.22
113.05
205.51
112.75
35.14
20.28
36.48
19.16
1.84
10:24
195.79
109.21
194.72
108.36
29.88
16.66
28.33
16.62
1.79
10:30
201.24
104.54
202.79
110.09
28.15
15.94
29.71
16.96
1.87
10:36
184.86
101.21
197.74
106.01
27.68
15.86
31.67
15.01
1.86
10:42
188.11
104.08
198.49
105.64
27.08
16.61
28.55
14.11
1.84
10:48
194.38
111.38
180.62
100.62
25.60
17.00
28.98
13.96
1.77
10:54
207.70
115.28
186.46
101.70
23.40
15.86
30.12
13.54
1.82
11:00
192.76
111.89
192.19
105.98
27.50
15.36
27.11
14.07
1.78
11:06
195.65
102.15
213.56
112.31
23.71
13.88
28.81
13.54
1.91
212
LEE,
FOK
AND
LIU
ß
Blackwe
ll
Publi
shers
Ltd
2001

11:12
200.04
108.67
218.15
117.05
28.12
16.22
28.34
13.40
1.86
11:18
194.74
107.99
207.13
112.42
29.27
17.61
22.91
12.24
1.81
11:24
201.94
114.49
189.56
107.96
27.09
16.39
18.51
11.67
1.74
11:30
222.46
123.91
218.02
120.99
28.11
16.11
24.02
11.82
1.81
11:36
254.19
131.25
246.91
133.76
26.42
16.52
29.40
13.67
1.89
11:42
279.52
145.88
259.22
144.11
29.94
18.77
28.22
13.95
1.85
11:48
346.69
180.97
295.71
165.35
33.94
20.63
33.75
15.62
1.86
11:54
389.84
216.80
354.22
200.98
34.61
21.07
29.51
16.22
1.78
12:00
727.71
354.44
704.48
378.58
53.94
28.20
45.82
22.76
1.95
AVERAGE
259.12
139.29
261.45
141.27
61.18
33.75
86.55
41.87
1.85
F-all
4.48**
6.11**
4.23**
7.54**
16.29**
35.39**
33.40**
49.30**
0.72
F-open, 9:06
0.95
4.57*
3.21
8.27**
14.99**
36.05*
28.79**
45.24**
0.29
F-open, inn
15.24**
41.64**
43.89**
70.63**
468.87** 1019.74**
961.91**
1390.40**
0.54
F-open, close
4.22*
2.30
0.77
1.47
16.72**
38.62**
35.25**
52.83**
0.89
F-9:06, inn
3.50
2.89
4.83*
1.01
26.59**
18.22**
97.89**
65.23**
2.68
F-9:06, close
7.60**
10.80**
5.54*
17.64**
2.19
1.88
12.64**
16.02**
3.50*
F-close, inn
98.07**
116.83**
85.60**
154.93**
3.28
2.76
0.11
0.01
0.15
Notes:
Informed orders = orders with size 20 lots; F stands for F-statistic; `all' represents all trade intervals; `open' represents the open trade; `9:06' represents
the first six-minute interval (9:00±9:06) excluding the open trade; `inn' represents the interior periods from 9:06 to 11:54; `close' represents the last
trade interval (11:54±12:00). *, ** indicates significance at the 1% and 10% levels, respectively.
INTRADA
Y
PATTERN
OF
TRADING
VOLUME
213
ß
Blackwell
Publishers
Ltd
2001

support our third hypothesis, that is, traders tend to place
conservative orders at the market open.
Another possible reason for large waiting orders at the open is
related to the trading mechanism in the Taiwan stock market.
The TWSE adopts an order-driven computerized trading system
allowing only limit orders. There are no specialists and a 7%
price limit at the open and intraday price limit in the inner
trading periods and the close are imposed. As a result, investors
may tend to place more conservative orders at the open. F-
statistics indicate that real buy and real sell orders exhibit a J-
curve pattern, which is consistent with the behavior of trading
volume listed in Figure 1. In particular, F
-open, inn
for real buy and
sell orders are 6.36 and 10.04 respectively; and F
-close, inn
for buy
and sell orders are 13.60 and 12.62, respectively. On the contrary,
waiting orders exhibit a reverse J-shaped pattern. Results in Table
2 indicate that while the largest buy order appears at the market
open, real trading intentions are the strongest at the close. The
huge number of real orders at the market close is consistent with
both the portfolio- rebalance need and risk-sharing motive.
Table 3 shows that informed and uninformed traders adopt
similar strategy, that is, they place large conservative orders at the
market open. By definition, informed trader's order is larger
than uninformed traders, we cannot make judgement on the
relative importance of informed orders and uninformed orders
in explaining the J-shaped pattern of trading volume merely
based on order size. The last column of Table 3 shows the ratio of
informed to uninformed orders. The ratio allows us to examine if
the relative trading behavior between informed and uninformed
investors changes overtime. The range of the ratio is (1.77±2.20).
According to the F-statistics, the ratio is not significantly different
across different sessions. The only exception is that the ratio for
the period `9:00±9:06' is significantly higher than that at the
closing period. This indicates that the relative trading behavior
between informed and uninformed investors is quite stable over
time. In addition, it is of interest to see if a particular type of
order is more likely to be executed at the open. We find that
while the informed orders counts 62% of the total orders, only
41% of the executed orders are informed orders. This means that
uninformed orders account for 59% of the executed orders even
though they account for only 38% of the total orders. In
214
LEE, FOK AND LIU
ß Blackwell Publishers Ltd 2001

addition, 7.6% of informed orders and 10.7% of uninformed
orders are executed at the open; the difference is statistically
significant. These figures imply that small orders are more likely
to be executed at the open. An examination of the pricing
behavior indicates that small orders tend to offer a better price
than large orders. This explains the relatively high execution rate
for small orders at the market open.
(ii) Regression Analysis
To investigate the role of information trade and liquidity trade in
explaining intraday pattern of trading volume, we conduct the
following regression analysis and report the results in Table 4:
VOL
t
a
0
a
1
INFB
t
a
2
INFS
t
a
3
UNFB
t
a
4
UNFS
t
"
t
1
where VOL
t
is the trading volume at time interval t; INFB
t
and
INFS
t
are the buy and sell orders placed by informed traders,
while UNFB
t
and UNFS
t
are buy and sell orders of uninformed
traders. For each of the trading intervals, the above regression is
estimated for each of the 30 sample firms, respectively. Reported
coefficient is the average of the coefficients for the 30 firms. The
t-statistics are calculated by using the coefficients obtained from
the regression for each of the sample firms.
Table 4 shows that trading orders placed by both informed and
uninformed traders are significantly related with trading volume
in all time intervals. However, the explanatory power is the lowest
at the market open and is the highest at the market close
(adjusted R
2
are 0.495 and 0.870 for the market open and market
close respectively). This implies that most orders at market open
are non-executable. In terms of the value of estimated
coefficients, the impact of uninformed orders is greater than
that of informed orders. In particular, coefficients of UNFB are
greater than that of INFB for all time intervals except at 11:48±
11:54. For the sell orders, coefficients of UNFS are uniformly
greater than that of INFS except at 10:12±10:18. While both
information trading and liquidity trading can explain intraday
trading volume, the impact of liquidity trading is relatively larger.
This is consistent with the study by Lee, Lin and Liu (1999) which
find that small investors provide liquidity to the market.
INTRADAY PATTERN OF TRADING VOLUME
215
ß Blackwell Publishers Ltd 2001

Table 4
Volume Regression±Total Orders
VOL
t
a
0
a
1
INFB
t
a
2
INFS
t
a
3
UNFB
t
a
4
UNFS
t
"
t
Interval
INTERCEP
INFB
INFS
UNFB
UNFS
Adjusted R
2
Open
ÿ177.067**
0.14024**
0.06796**
0.20174**
0.14793**
0.4951
9:06
ÿ112.328**
0.40618**
0.23558**
1.09961**
0.78831**
0.7895
9:12
ÿ106.836**
0.37540**
0.22833**
0.95579**
0.66170**
0.7651
9:18
ÿ82.129**
0.42648**
0.23936**
1.16678**
0.48987**
0.7981
9:24
ÿ62.670**
0.48336**
0.22434**
1.01721**
0.54073**
0.7750
9:30
ÿ73.169**
0.47751**
0.26483**
0.90254**
0.75828**
0.7447
9:36
ÿ69.443**
0.38743**
0.38401**
0.98304**
0.68453**
0.7608
9:42
ÿ40.543**
0.41405**
0.39811**
0.84710**
0.64315**
0.7524
9:48
ÿ37.101**
0.52033**
0.40850**
0.60507**
0.80262**
0.7573
9:54
ÿ42.590**
0.46304**
0.41332**
1.01925**
0.54311**
0.7361
10:00
ÿ50.423**
0.49785**
0.32878**
0.93595**
0.77886**
0.7590
10:06
ÿ12.428
0.37317**
0.42435**
1.14129**
0.42536**
0.7780
10:12
ÿ32.656**
0.46900**
0.41323**
0.75377**
0.59591**
0.7537
10:18
ÿ18.047
0.43212**
0.45091**
1.02498**
0.36773**
0.7633
10:24
ÿ18.165
0.49888**
0.38710**
0.86846**
0.58085**
0.6993
216
LEE,
FOK
AND
LIU
ß
Blackwe
ll
Publi
shers
Ltd
2001

10:30
ÿ49.270**
0.46198**
0.39674**
0.96970**
0.84006**
0.7612
10:36
ÿ63.287**
0.51419**
0.42454**
0.99913**
0.87841**
0.7621
10:42
ÿ44.263**
0.51057**
0.45332**
0.79265**
0.82062**
0.7577
10:48
ÿ49.344*
0.48839**
0.44256**
1.06329**
0.82993**
0.7778
10:54
ÿ37.729**
0.62150**
0.26850**
0.80926**
1.08982**
0.7849
11:00
ÿ29.904*
0.48771**
0.40427**
0.83176**
0.83262**
0.7740
11:06
ÿ102.849*
0.37685**
0.58740**
0.95854**
1.06801**
0.7950
11:12
ÿ30.498**
0.40893**
0.52204**
0.76776**
0.96060**
0.7838
11:18
1.043
0.49421**
0.42080**
0.70429**
0.76029**
0.7700
11:24
ÿ15.131
0.40428**
0.37986**
0.94874**
0.81792**
0.7396
11:30
ÿ30.893*
0.54376**
0.55733**
0.82389**
0.71485**
0.7979
11:36
ÿ49.558**
0.50999**
0.47605**
0.99202**
1.00933**
0.7936
11:42
ÿ33.809
0.52192**
0.56749**
0.67404**
0.92178**
0.7871
11:48
0.374
0.63447**
0.49797**
0.79482**
0.87166**
0.8086
11:54
ÿ19.527
0.64526**
0.52474**
0.59342**
1.04824**
0.8535
12:00
92.139*
0.59978**
0.66907**
0.92636**
1.15506**
0.8695
Notes:
VOL
t
is the trading volume at time interval t; INFB
t
and INFS
t
are the buy and sell orders placed by informed traders, while UNFB
t
and UNFS
t
are buy
and sell orders of uninformed traders. For each of the trading intervals, the above regression is estimated for each of the 30 sample firms, respectively.
Reported coefficient is the average of the coefficients for the 30 firms. The T-statistics are calculated by using the coefficients obtained from the
regression for each of the sample firms. *, ** indicates significance at the 1% and 10% levels, respectively.
INTRADA
Y
PATTERN
OF
TRADING
VOLUME
217
ß
Blackwell
Publishers
Ltd
2001

Table 5
Volume Regressions±Real/Waiting Orders
VOL
t
a
0
a
1
INFBR
t
a
2
INFSR
t
a
3
UNFBR
t
a
4
UNFSR
t
a
5
INFBW
t
a
6
INFSW
t
a
7
UNFBW
t
a
8
UNFSW
t
"
t
Interval INTERCEP
INFBR
INFSR
UNFBR
UNFSR
INFBW
INFSW
UNFBW
UNFSW
Adjusted R
2
Open
ÿ155.664**
0.29827**
0.22743**
0.57864**
0.52367**
0.01383
0.01743
0.07496
0.03672
0.6502
9:06
ÿ57.263**
0.46459**
0.33230**
1.27739**
1.15697**
0.01530
0.04144
ÿ0.29319
ÿ0.08964
0.8327
9:12
ÿ69.310**
0.47046**
0.30600**
1.17194**
0.92263**
0.05222
ÿ0.02205
ÿ0.05269
ÿ0.06593
0.8040
9:18
ÿ66.464**
0.47786**
0.34084**
1.18693**
0.67539**
0.18133
0.15628
0.67285*
ÿ0.15800
0.8306
9:24
ÿ47.357**
0.55347**
0.34415**
1.13025**
0.73423**
0.09041
ÿ0.06501
0.28633
ÿ0.38708
0.8084
9:30
ÿ62.382**
0.55127**
0.37954**
1.07483**
1.08425**
ÿ0.05829
ÿ0.12886
ÿ0.10922
ÿ0.63562
0.7828
9:36
ÿ58.385**
0.41273**
0.48126**
1.19042**
1.04315**
0.25194
0.00040
ÿ0.33523
ÿ1.04445**
0.8033
9:42
ÿ34.847**
0.49309**
0.39765**
1.15042**
0.79481**
0.08256
0.10776
ÿ0.08331
ÿ0.20133
0.7844
9:48
ÿ43.789**
0.55435**
0.50039**
0.92682**
0.94770**
0.01136
ÿ0.20452*
ÿ0.36881
ÿ0.25390
0.7839
9:54
ÿ41.114**
0.49486**
0.45474**
1.21168**
0.75340**
0.01812
0.03731
0.86169*
ÿ0.21204
0.7809
10:00
ÿ55.563**
0.50462**
0.47818**
1.05875**
0.91820**
ÿ0.03817
ÿ0.21786
0.17601
0.00599
0.7962
10:06
ÿ47.207**
0.48700**
0.51142**
1.33100**
0.66480**
0.03155
0.15123
0.51694
ÿ1.09909**
0.8233
10:12
ÿ41.729**
0.51513**
0.47417**
0.81963**
0.90082**
0.14991
0.13887
0.32271
ÿ0.77314*
0.7883
10:18
ÿ39.743*
0.47025**
0.49287**
1.20416**
0.66784**
0.15341
ÿ0.04723
0.03471
ÿ0.58885
0.7963
218
LEE,
FOK
AND
LIU
ß
Blackwe
ll
Publi
shers
Ltd
2001

10:24
ÿ20.057
0.55099**
0.48846**
0.98342**
0.82527**
0.08318
ÿ0.34249*
ÿ0.00261
ÿ0.58373
0.7344
10:30
ÿ47.761**
0.48630**
0.45592**
1.07349**
0.93003**
0.09920
0.20703
ÿ0.03461
ÿ0.03698
0.7850
10:36
ÿ62.282**
0.54169**
0.46699**
1.15224**
1.11969**
0.34842
0.03618
0.31207
ÿ0.86429*
0.8010
10:42
ÿ49.119**
0.53659**
0.56996**
0.98865**
1.09666**
0.01366
ÿ0.04675
ÿ0.45243
ÿ1.44598*
0.7974
10:48
ÿ63.342**
0.52269**
0.53338**
1.19527**
1.29695**
ÿ0.22299
ÿ0.35624
ÿ0.55371
ÿ0.72369
0.8203
10:54
ÿ46.776**
0.64485**
0.33462**
0.99797**
1.29082**
ÿ0.04600
0.16212
ÿ0.33889
ÿ0.45035
0.8078
11:00
ÿ54.993**
0.51107**
0.53219**
1.02295**
1.07469**
ÿ0.04818
ÿ0.23189
0.05457
ÿ0.65205
0.8097
11:06
ÿ97.988**
0.41097**
0.58819**
1.12968**
1.27574**
ÿ0.02716
0.67099*
0.24515
ÿ0.54198
0.8257
11:12
ÿ42.948**
0.48394**
0.55487**
0.82399**
1.15251**
ÿ0.07129
0.22644
0.67905
ÿ0.51464
0.8082
11:18
ÿ22.069
0.56440**
0.47232**
1.05275**
0.97542**
ÿ0.17194
ÿ0.09458
ÿ0.20426
ÿ2.19387**
0.8057
11:24
ÿ19.981
0.40480**
0.42062**
1.13585**
1.02623**
0.46152
0.41422
ÿ0.11928
ÿ1.22901*
0.7714
11:30
ÿ50.916**
0.60032**
0.55558**
0.98584**
1.06398**
ÿ0.12989
0.50911*
0.00331
ÿ1.52084*
0.8231
11:36
ÿ57.117**
0.52569**
0.51095**
1.07626**
1.28282**
ÿ0.04392
0.26476
ÿ0.54067
ÿ1.25610*
0.8188
11:42
ÿ70.041**
0.55269**
0.63671**
0.88167**
1.12054**
0.24280
ÿ0.57630
1.42087
ÿ0.26787
0.8288
11:48
ÿ42.284**
0.70395**
0.58829**
0.91922**
1.08144**
0.03681
ÿ0.10590
0.25191
ÿ0.22031
0.8338
11:52
ÿ35.678*
0.67791**
0.51020**
0.66898**
1.18555**
0.43140
0.59116
0.27954
ÿ1.18646
0.8780
12:00
48.457
0.62460**
0.70482**
1.01444**
1.25638**
0.41026
0.47690
ÿ0.48833
ÿ1.14357
0.8876
Notes:
VOL
t
is the trading volume at time interval t. For the independent variables, INF and UNF stand for informed and uninformed traders, respectively.
The fourth character identifies whether it is a sell (S) or a buy (B) order. The final character indicates whether it is a real (R) or a waiting (W) order.
For each of the trading intervals, the above regression is estimated for each of the 30 sample firms, respectively. Reported coefficient is the average of
the coefficients for the 30 firms. The T-statistics are calculated by using the coefficients obtained from the regression for each of the sample firms.
*, ** indicates significance at the 1% and 10% levels, respectively.
INTRADA
Y
PATTERN
OF
TRADING
VOLUME
219
ß
Blackwell
Publishers
Ltd
2001

To investigate the impact of real and waiting orders, we
decompose orders into real and waiting orders. Hence, trading
volume is regressed on the real and waiting orders placed by
informed and uninformed traders, i.e.:
VOL
t
a
0
a
1
INFBR
t
a
2
INFSR
t
a
3
UNFBR
t
a
4
UNFSR
t
a
5
INFBW
t
a
6
INFSW
t
a
7
UNFBW
t
a
8
UNFSW
t
"
t
:
2
For the independent variables, INF and UNF stand for informed
and uninformed traders, respectively. The fourth character
identifies whether it is a sell (S) or a buy (B) order. The final
character indicates whether it is a real (R) or a waiting (W) order.
As shown in Table 5, waiting order has insignificant impacts on
trading volume in most of the cases. In particular, none of the
coefficients of INFBW is significant. Therefore, the J-shape
pattern of trading volume is mainly driven by real orders.
Compared with Table 4, the coefficients of real orders (INFBR,
INFSR, UNFBR and UNFSR) are higher. Therefore, waiting
orders under-estimate the relationship between trading intention
and intraday pattern of trading volume. While the significant
level of informed and uninformed orders are the same,
coefficients of uninformed orders (UNFBR and UNFSR) are
higher than those of informed orders (INFBR and INFSR) in all
instances. This further supports the findings in Table 4; liquidity
trading plays a more important role than informed trading in
explaining the intraday pattern of trading volume.
(iii) Robustness of the Results
To test the robustness of the above results, we replicate the above
analyses using alternative definitions of real/waiting orders and
uninformed/informed orders as stated in Table 6. Moreover, we
attempt different regression specifications explained below. The
distributions of different types of orders based on various
classification criteria are presented in Figure 2. Figure 2
illustrates that intraday patterns of different types of orders are
parallel to those reported in Table 3. In particular, real orders of
both informed and uninformed investors follow a `J' shaped
pattern. On the contrary, waiting orders are extremely high at the
220
LEE, FOK AND LIU
ß Blackwell Publishers Ltd 2001

open but decrease dramatically afterwards. A slight difference is
that for cases (3), (4), (5), and (6), real orders at the open are
less than those in the period `9:00±9:06'. To sum up, the
distributions of orders reported in Tables 2 and 3 are invariant to
classification criteria.
For the regression analysis, we attempt the following
alternatives: (a) pooling all firms in each interval and estimating
equations (1) and (2); (b) pooling all firms across all time
intervals and adding 31 time dummies; trading volume is then
regressed on the dummies and the interaction terms of dummies
and the independent variables as stated in equations (1) and (2);
(c), same as (a) but including stock returns as control variables;
and (d) same as (b) but including stock returns as control
variables. Table 7 summarizes the key results for alternative
regression specifications and order classification schemes. Panel
A of Table 7 indicates that the main results drawn from Table 4
hold. In particular, uninformed orders have larger coefficients
than the informed orders. When pooling data is used, a major
different result is found in Panel B ± most of the coefficients of
waiting orders are significantly different from zero. However, the
coefficients of real orders are still uniformly greater than those of
waiting orders. The coefficients of uninformed orders are greater
than those of informed orders for real orders, but the reverse
relationship is found for waiting orders for cases 3 and 5. Except
slight variations, the main conclusions inferred from Tables 4
and 5 still hold. Our earlier results are robust with respect to the
order classification scheme and regression specifications.
5. CONCLUSIONS
Previous theoretical researches suggested that trading volumes
depend on traders' exogenous liquidity needs, information flows,
and the strategic interactions between informed and liquidity
traders. Constrained by order flow data unavailability, previous
studies examine indirectly concentrated trading using trading
volume data. The pivotal contribution of this study is to measure
the intraday trading behavior of informed and uninformed
investors directly using a complete limit order book data of the
Taiwan Stock Exchange. We examine the intraday pattern of
INTRADAY PATTERN OF TRADING VOLUME
221
ß Blackwell Publishers Ltd 2001
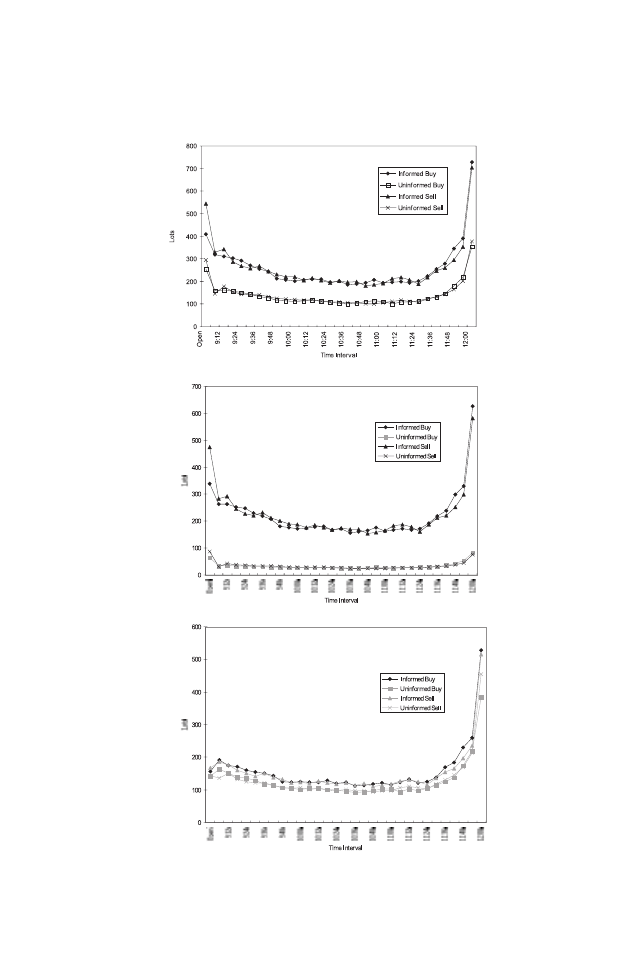
Figure 2
Distributions of Orders for Different Classification Schemes
Case 1
Real Orders
Case 2
Real Orders
Case 3
Real Orders
222
LEE, FOK AND LIU
ß Blackwell Publishers Ltd 2001
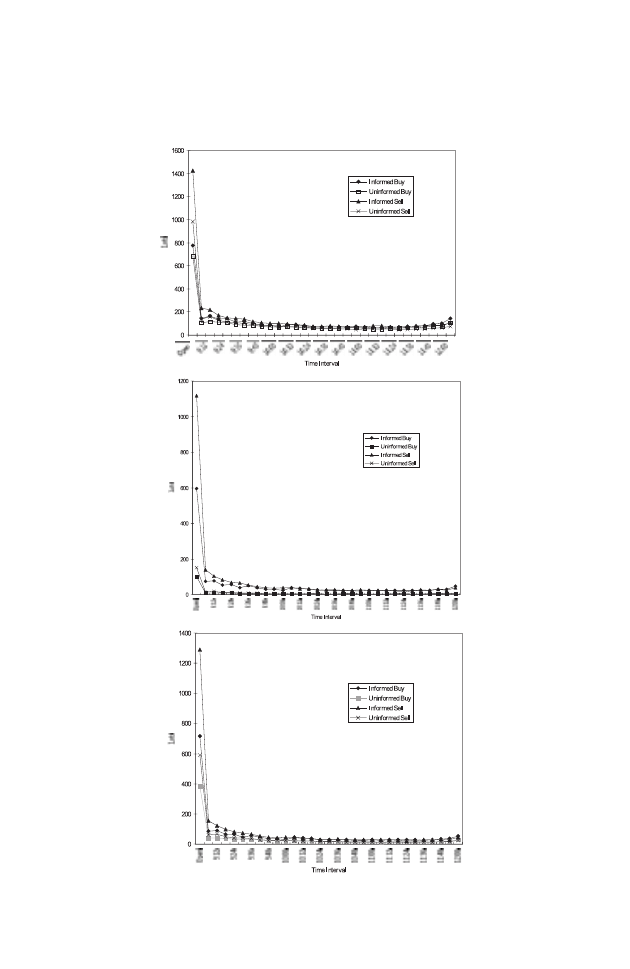
Figure 2 (Continued)
Case 1
Waiting Orders
Case 2
Waiting Orders
Case 3
Waiting Orders
INTRADAY PATTERN OF TRADING VOLUME
223
ß Blackwell Publishers Ltd 2001
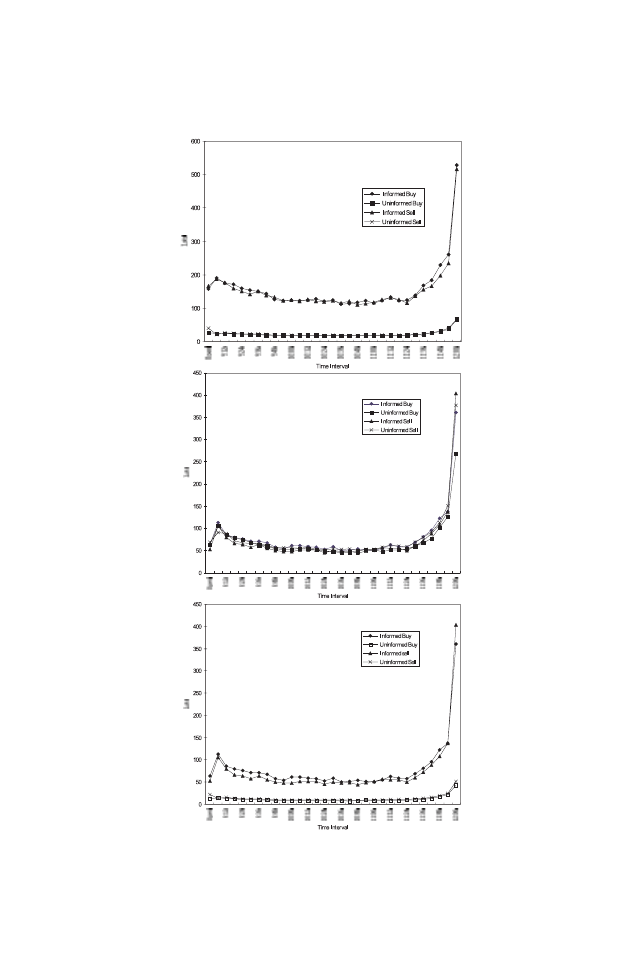
Figure 2 (Continued)
Case 4
Real Orders
Case 5
Real Orders
Case 6
Real Orders
224
LEE, FOK AND LIU
ß Blackwell Publishers Ltd 2001
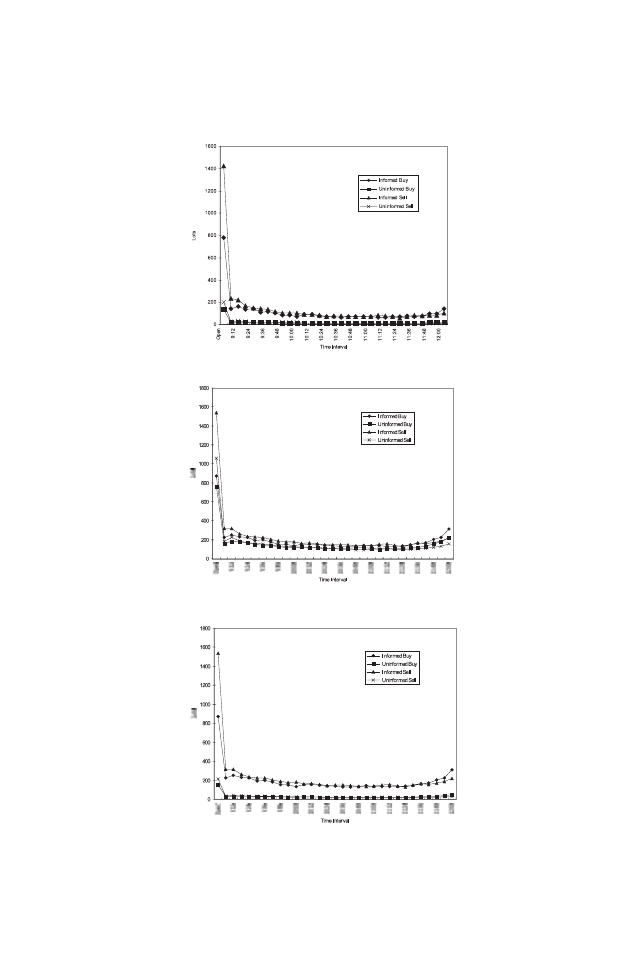
Figure 2 (Continued)
Case 4
Waiting Orders
Case 5
Waiting Orders
Case 6
Waiting Orders
Note:
Case 1±Case 6 are referred to different classification schemes as defined in Table 6.
INTRADAY PATTERN OF TRADING VOLUME
225
ß Blackwell Publishers Ltd 2001

Table 6
Alternative Specifications of Informed/Uninformed and Real/Waiting Orders
Order Type
Case 1 (the
Case 2
Case 3
Case 4
Case 5
Case 6
base case)*
Informed
orders
orders
orders
orders
orders
orders
orders
> 20 lots
> 20 lots
> 20 lots
> 20 lots
> 20 lots
> 20 lots
Uninformed
orders
orders
orders
orders
orders
orders
orders
20 lots
< 5 lots
20 lots
< 5 lots
20 lots
< 5 lots
Real buy
order price
order price
order price
order price
order price
order price
orders
ptp ÿ 2 ticks
ptp ÿ 2 ticks
ptp
ptp
ptp + 2 ticks
ptp + 2 ticks
Real sell
order price
order price
order price
order price
order price
order price
orders
ptp + 2 ticks
ptp + 2 ticks
ptp
ptp
ptp ÿ 2 ticks
ptp ÿ 2 ticks
Waiting buy
order price
order price
order price
order price
order price
order price
orders
< ptp ÿ 2 ticks
< ptp ÿ 2 ticks
< ptp
< ptp
< ptp + 2 ticks
< ptp + 2 ticks
Waiting sell
order price
order price
order price
order price
order price
order price
orders
> ptp + 2 ticks
> ptp + 2 ticks
> ptp
> ptp
> ptp ÿ 2 ticks
>ptp ÿ 2 ticks
Notes:
* ptp = price of the previous transaction.
Case 1 is the base case. Results reported in Table 1±Table 5 of the text are based on the definitions stated in Case 1.
226
LEE,
FOK
AND
LIU
ß
Blackwe
ll
Publi
shers
Ltd
2001

Table 7
Comparison of Regression Results Among Different Specifications and Definitions of Real/Waiting Orders and
Informed/Uninformed Orders
Panel A
Major Findings in Table 4
Case 1
Case 2
Case 3
Case 4
Case 5
Case 6
a b c d
a b c d
a b c d
a b c d
a b c d
a b c d
(1) Coefficients of informed orders ✓ ✓ ✓ ✓ ✓ ✓ ✓ ✓ ✓ ✓ ✓ ✓ ✓ ✓ ✓ ✓ ✓ ✓ ✓ ✓ ✓ ✓ ✓ ✓
and uninformed orders are
significant in all time intervals
(2) Coefficients of uninformed
✓ ✓ ✓ ✓
✓ ✓ ✓ ✓
✓ ✓ ✓ ✓
✓ ✓ ✓ ✓
✓ ✓ ✓ ✓
✓ ✓ ✓ ✓
orders > coefficients of
informed orders
Panel B
Major Findings in Table 5
Case 1
Case 2
Case 3
Case 4
Case 5
Case 6
a b c d
a b c d
a b c d
a b c d
a b c d
a b c d
(1) Coefficients of real orders are
✓ ✓ ✓ ✓
✓ ✓ ✓ ✓
✓ ✓ ✓ ✓
✓ ✓ ✓ ✓
✓ ✓ ✓ ✓
✓ ✓ ✓ ✓
significant
Coefficients of waiting orders
✗
✗
✗
✗
✗
✗
✗
✗
✗
✗
✗
✗
✗
✗
✗
✗
✗
✗
✗
✗
✗
✗
✗
✗
are insignificant
INTRADA
Y
PATTERN
OF
TRADING
VOLUME
227
ß
Blackwell
Publishers
Ltd
2001

Table 7 (Continued)
(2) Coefficients of real orders >
Coefficients of waiting orders
± for informed orders
✓ ✓ ✓ ✓
✓ ✓ ✓ ✓
✓ ✓ ✓ ✓
✓ ✓ ✓ ✓
✓ ✓ ✓ ✓
✓ ✓ ✓ ✓
± for uninformed orders
✓ ✓ ✓ ✓
? ? ? ?
✓ ✓ ✓ ✓
✓ ✓ ✓ ✓
✓ ✓ ✓ ✓
✓ ✓ ✓ ✓
(3) Coefficients of uninformed
orders >
Coefficients of informed order
± for real orders
✓ ✓ ✓ ✓
✓ ✓ ✓ ✓
✓ ✓ ✓ ✓
✓ ✓ ✓ ✓
✓ ✓ ✓ ✓
✓ ✓ ✓ ✓
± for waiting orders
✓ ✓ ✓ ✓
✓ ✓ ✓ ✓
✗
✗
✗
✗
✓
? ✓ ✓
✗
✗
✗
✗
? ? ? ?
Notes:
Case 1 to Case 6 are different from each other in the ways to classify orders. The definitions of real/waiting and informed/uninformed orders for each
case are shown in Table 6. (a)±(d) represent different regression specifications. (a) For each time interval, data for all the sample firms are pooled,
equations (1) and (2) are then estimated for each time interval; (b) Data for all the sample firms across all time intervals are pooled. Dummies for the
31 time intervals are added, trade volume are then regressed on the interval dummies and the interaction term between dummies and the
independent variables stated in equation (1) and (2); (c) Same as (a), adds stock returns as control variables; (d) Same as (b), adds stock returns as
control variables.
`✓': more than 2/3 of the coefficients are consistent with the result listed in the first column; `✗: more than 2/3 of the coefficients are opposite to the
result listed in the first column; `?': less than 2/3 but more than 1/3 of the coefficients are consistent with the result listed in the first column.
228
LEE,
FOK
AND
LIU
ß
Blackwe
ll
Publi
shers
Ltd
2001

information and liquidity orders as well as the ordering strategies
of both informed and uninformed (liquidity) traders.
The results of this study indicate that investors have strong
desires to place orders at the market open and the close. While the
largest orders are placed at the open, only mediocre trading
volume is observed. This implies that traders tend to place
conservative orders at the open. To take into account the strategic
interaction of informed and liquidity traders, we classify total
orders into real orders and waiting orders. Such a classification
allows us to distinguish real trading intention from desire for price
priority. Our findings show that real orders from both informed
and uninformed traders exhibit a J-shaped intraday pattern, which
is consistent with the intraday pattern of trading volume. On the
other hand, a reverse J-shaped pattern of waiting orders is found as
orders at the market open are less likely to be executed. Investors
tend to `test' the market when uncertainty at the market open is
high. However, as trading is taking place, information is released
and uncertainty is gradually resolved. As a consequence, the
amount of waiting orders is significantly reduced.
Results from regression analysis indicate that both information
and liquidity trading play an important role in explaining the
intraday pattern of trading volume. We find that the impact of
liquidity trade on trading volume is slightly greater than that of
information trade. The possible reason is that uninformed orders
provide liquidity to the market. Finally, waiting orders play a less
significant role than real orders in determining the intraday
pattern of trading volume. This pinpoints the importance of
distinguishing real trading intention from desires for price
priority in studying the regularities of trading volume.
REFERENCES
Admati, A.R. (1989), `Divide and Conquer: A Theory of Intraday and Day-of-the-
week Mean Effects', Review of Financial Studies, pp. 189±223.
________ and P. Pfleiderer (1988), `A Theory of Intraday Patterns: Volume and
Price Variability', Review of Financial Studies, Vol. 1, pp. 3±40.
Barclay, M.J. and J.B. Warner (1993), `Stealth Trading and Volatility: Which
Trades Move Prices?' Journal of Financial Economics, Vol. 34, pp. 281±305.
Bessembinder, H., K. Chan and P.J. Seguin (1996), `An Empirical Examination
of Information, Differences of Opinion, and Trading Activity', Journal of
Financial Economics, pp. 105±34.
INTRADAY PATTERN OF TRADING VOLUME
229
ß Blackwell Publishers Ltd 2001

Biais, B., P. Hillion and C. Spatt (1995), `An Empirical Analysis of the Limit
Order Book and the Order Flow in the Paris Bourse', Journal of Finance, Vol.
50, pp. 1655±89.
Brock, W.A. and A.W. Kleidon (1992), `Periodic Market Closure and Trading
Volume', Journal of Economic Dynamics and Control, Vol. 16, pp. 451±89.
Chow, H.E., P. Hasio and Y.J. Liu (2000), `Intraday Serial Correlation of
Returns: A Comparison of U.S. Stock Market and Taiwan Stock Market',
Pacific Economic Review (forthcoming).
________, Y.S. Lee, V.W. Liu and Y.J. Liu (1994), `Intraday Stock Returns of
Taiwan: An Examination of Transaction Data', Working Paper presented at
the Financial Management Association.
Easley, D. and M. O'Hara (1987), `Price, Trade Size and Information in
Securities Markets', Journal of Financial Economics, Vol. 19, pp. 69±90.
Foster, D. and S. Viswanathan (1990), `A Theory of the Interday Variations in
Volumes, Variance, and Trading Costs in Securities Markets', Review of
Financial Studies, pp. 593±624.
Gerety, M.S. and J.H. Mulherin (1992), `Trading Halts and Market Activity: An
Analysis of Volume at the Open and the Close', Journal of Finance, Vol. 47,
pp. 1765±84.
Harris, L. (1989), `A Day-end Transaction Price Anomaly', Journal of Financial
Economics, Vol. 16, pp. 99±117.
Ho, Y.K. and Y.L. Cheung (1991), `Behavior of Intra-daily Stock Return on an
Asian Emerging Market±Hong Kong', Applied Economics, pp. 957±66.
________ ________ and D.W.W. Cheung (1993), `Intraday Prices and Trading
Volume Relationship in an Emerging Asian Market', Pacific Basin Finance
Journal, Vol. 1, pp. 203±14.
Lee, C.M.C. and M.J. Ready (1991), `Inferring Trade Direction from Intraday
Data', Journal of Finance, Vol. 46 (June), pp. 733±46.
Lee, Y.T., J.C. Lin and Y.J. Liu (1999), `Trading Patterns of Big versus Small
Players in an Emerging Market: An Empirical Analysis', Journal of Banking
and Finance, Vol. 23, pp. 701±25.
Lockwood, L.J. and S.C. Linn (1990), `An Examination of Stock Market Return
Volatility During Overnight and Intraday Periods 1964±1989', Journal of
Finance, Vol. 45, pp. 591±601.
McInish, T.H. and R.A. Wood (1990a), `A Transactions Data Analysis of the
Variability of Common Stock Returns During 1980±1984', Journal of
Banking and Finance, Vol. 14, pp. 99±112.
________ ________ (1990b), `An Analysis of Transactions Data for Toronto
Stock Exchange Return Patterns and End-of-the-day Effect', Journal of
Banking and Finance, Vol.14, pp. 441±58.
________ ________ (1992), `An Analysis of Intraday Patterns in Bid/Ask Spreads
for NYSE Stocks', Journal of Finance, Vol. 47, pp. 753±64.
Porter, D.C. (1992), `The Probability of a Trade at the Ask: An Examination of
Intraday Behavior', Journal of Financial and Quantitative Analysis, Vol. 27, pp.
209±27.
Slezak, S.L. (1994), `A Theory of the Dynamics of Security Returns Around
Market Closures', Journal of Finance, Vol. 49 (September), pp. 1163±211.
Wood, R.A., T.H. McInish and J.K. Ord (1985), `An Investigation of
Transactions Data for NYSE Stock', Journal of Finance, Vol. 40, pp. 723±39.
230
LEE, FOK AND LIU
ß Blackwell Publishers Ltd 2001
Wyszukiwarka
Podobne podstrony:
Ahn And Cheung The Intraday Patterns Of The Spread And Depth In A Market Without Market Makers The
Maps of the Ancient World Ortelius A Selection of 30 Maps from The Osher and Smith Collections
Did Shmu el Ben Nathan and Nathan Hanover Exaggerate Estimates of Jewish Casualties in the Ukraine D
AN ANTHOLOGY OF SORBIAN POETRY from the 16th 20th centuries A rock against these alien waves
A Technique for Removing an Important Class of Trojan Horses from High Order Languages
Carney Scott M Harmonic Trading Profiting From The Natural Order Of The Financial Markets (Volume 1
Admati And Pfleiderer A Theory Of Intraday Patterns Volume And Price Variability
Lee, Mucklow And Ready Spreads, Depths, And The Impact Of Earnings Information An Intraday Analysis
Adorno Freudian Theory and the Pattern of Fascist Propaganda
Intraindividual stability in the organization and patterning of behavior Incorporating psychological
Richard Bandler And John Grinder Patterns Of The Hypnotic Techniques Of Milton Erickson
Donald H Mills The Hero and the Sea, Patterns of Chaos in Ancient Myth (pdf)(1)
Continuities and Discontinuities Patterns of Migration, Adolescent
Intraindividual stability in the organization and patterning of behavior Incorporating psychological
Glądalski, Michał Patterns of year to year variation in haemoglobin and glucose concentrations in t
Spinks, Lee Genesis And Structure And The Object Of Postmodernism
DANN Changing patterns of violence at Qustul and Ballana in the post Meroitic period Part One The Hu
Psychology and Cognitive Science A H Maslow A Theory of Human Motivation
więcej podobnych podstron