
Analysis and Reconstruction of
the 1974 Tornado Super Outbreak
R M S S p e c i a l R e p o r t
Risk Management Solutions
TM

1
1974 Super Tornado Outbreak Copyright 2004 Risk Management Solutions, Inc. All Rights Reserved.
April 2, 2004
I
N T R O D U C T I O N
The Super Outbreak of tornadoes that occurred on April 3-4, 1974 was the most intense and
widespread tornado outbreak in recorded history. In total, 148 tornadoes spanned 13 states
producing about 900 square miles (2331 square km) of tornado damage in less than 18 hours. This
report reviews the event’s meteorological and damage characteristics, describes the impact
subsequent research had on tornado risk models, and examines the property losses possible if the
outbreak were to occur today.
2
1974 Super Tornado Outbreak Copyright 2004 Risk Management Solutions, Inc. All Rights Reserved.
April 2, 2004
M
E T E O R O L O G I C A L
C
H A R A C T E R I S T I C S
Looking back, the atmospheric characteristics preceding the super outbreak provided clear evidence
of the high potential for widespread tornado development. On the evening of April 2, 1974 a deep
area of low pressure (983 millibars) over the Colorado-Kansas border created strong winds blowing
from the south over the lower Mississippi River Valley. This forced high-humidity air northward
from the Gulf of Mexico to the lower Midwest and Ohio Valley states. This moist layer of air was
“capped” by warm, dry air, which limited thunderstorm development and created highly unstable
atmospheric conditions. Recognizing this, the National Oceanic and Atmospheric Administration
(NOAA) issued preliminary severe weather alerts on the morning of April 2 for much of the central
and southern plains states.
During the morning of April 3, the center of low pressure moved northeastward to the Iowa-
Illinois border. As the air warmed up during the day and winds converged near the ground, an
explosive and sudden outbreak of thunderstorms developed around 2:00 pm Central Daylight Time
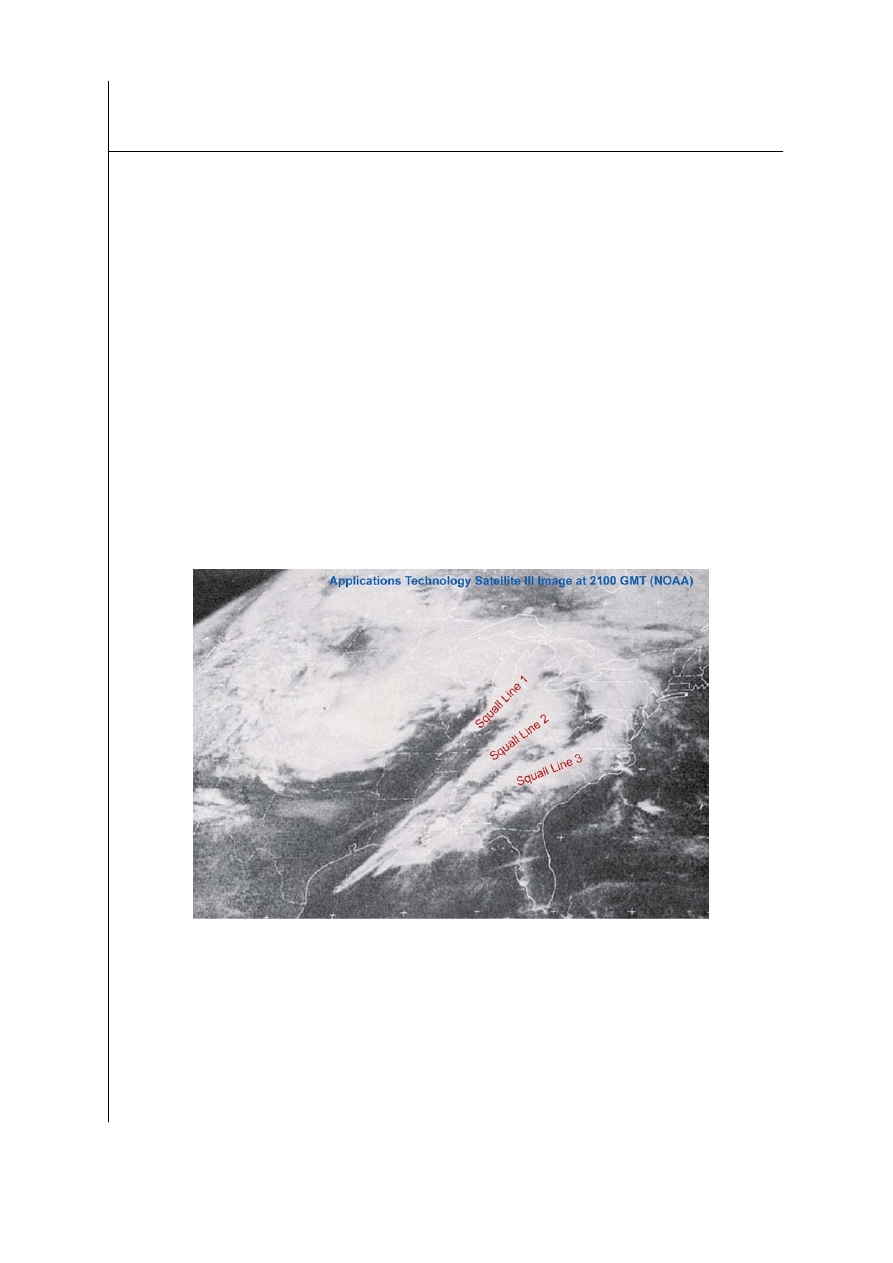
(CDT). Three major squall lines of thunderstorms oriented in a southeast-northwest direction
developed (see Figure 1). The most northerly line covered central Illinois, the central line extended
from northwestern Kentucky to central Indiana, and the southern line ran along the Tennessee-
North Carolina border. Most of the tornadoes were produced by individual thunderstorm cells
within these lines. The individual tornadoes moved northeastward at 40-60 mph (65-95 km/hr),
while the larger scale squall-line systems advanced toward the southeast.
Figure 1: Satellite image of the Eastern U.S. at 21:00 GMT on April 3,
1974
Up to 15 destructive tornadoes occurred simultaneously during the Outbreak. Among the suite
of tornadoes produced, the longest life of any single tornado was two hours and five minutes.
Ninety percent of the tornadoes, however, lasted less than 40 minutes. Many of these tornadoes
were part of ‘families’ or a sequence of tornadoes spawned in succession by a single thunderstorm
cell. Dr. Ted Fujita identified 30 such tornado families that comprised 74% of the Outbreak’s

3
1974 Super Tornado Outbreak Copyright 2004 Risk Management Solutions, Inc. All Rights Reserved.
April 2, 2004
tornadoes and resulted in 98% of the 315 deaths. The longest-lasting tornado family existed for
nearly five hours, while the average life was approximately two hours.
The total path length of all tornadoes combined was approximately 2,600 miles (4,185 km),
covering a total area of approximately 900 square miles (2331 square km). Dating back to the late
1800s, no other single-day event has surpassed the super outbreak in terms of the number of
tornadoes or the area they affected.
4
1974 Super Tornado Outbreak Copyright 2004 Risk Management Solutions, Inc. All Rights Reserved.
April 2, 2004
E
V E N T
D
A M A G E
C
H A R A C T E R I S T I C S
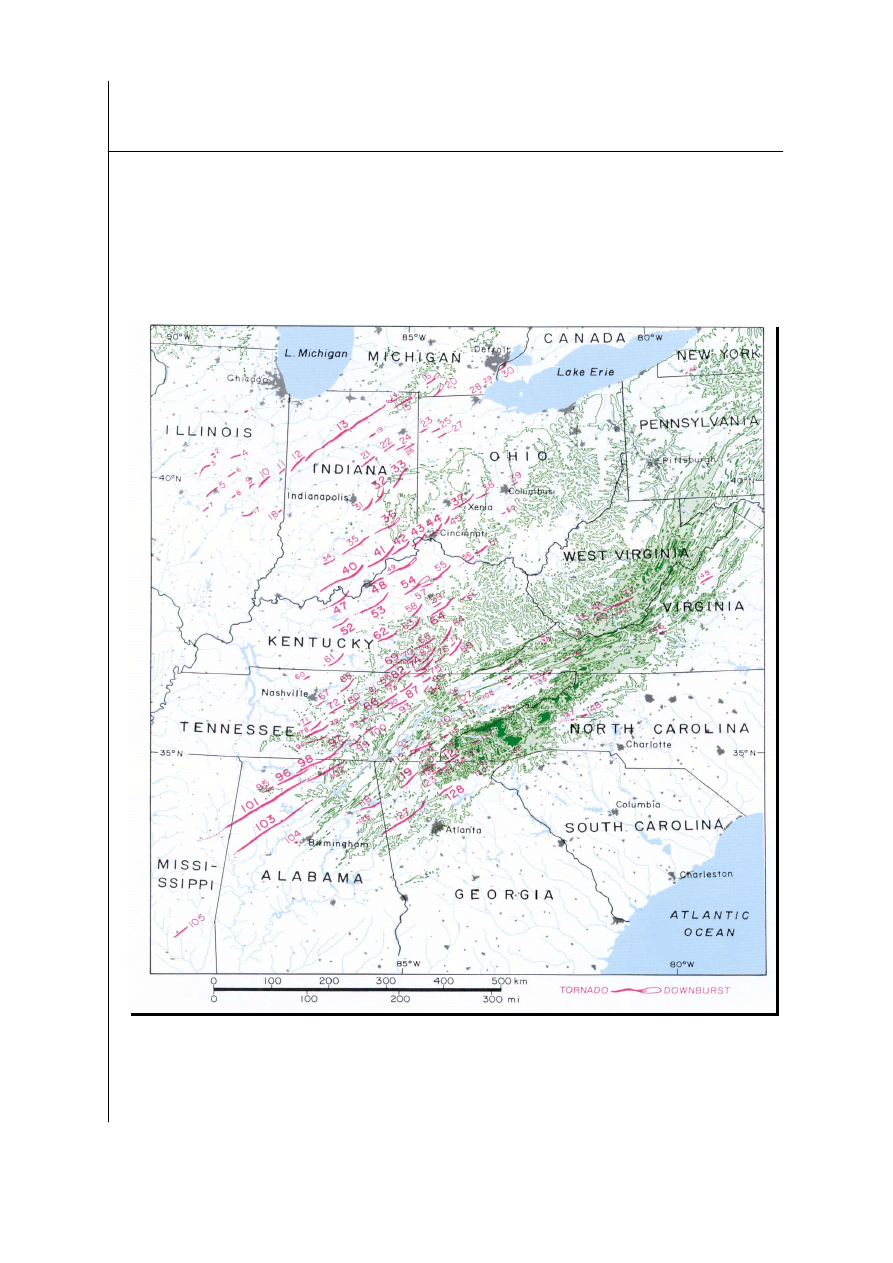
Following the super outbreak, Dr. Ted Fujita and his colleagues initiated the most extensive aerial
tornado survey ever conducted. The aerial survey was complemented by the collection of vast
amounts of engineering data on the performance of individual structures subject to wind and debris
loads. It took Fujita’s team nearly 10 months to confirm the characteristics of each of the tornadoes
in the event depicted in Figure 2. The F-scale classification statistics of the Outbreak are shown in
Table 2.
Figure 2: Map of the 1974 Tornado Super Outbreak
5
1974 Super Tornado Outbreak Copyright 2004 Risk Management Solutions, Inc. All Rights Reserved.
April 2, 2004
Peak F-
Rating
No. of
Tornadoes
Total
Length (mi)
Mean Width
(mi)
Total Area
(sq mi
2
)
F5 6
302
0.487 147
F4 24
858
0.457 392
F3 35
710
0.366 260
F2 30
360
0.185 67
F1 31
295
0.062 18
F0
21 46 0.028
1
Table 2: F-scale classification statistics from super outbreak
A total of 315 people were killed, more than 6,000 people were injured, and over 27,590
buildings were damaged. Of those that died, 74% were killed while in houses or buildings, 17% in
mobile homes, 6% in automobiles, and 3% while seeking shelter. The economic damage amounted
to $600 million. Ten of the thirteen affected states were declared disaster areas. The greatest storm
activity and damage was spread across Alabama, Georgia, Tennessee, Kentucky, Indiana, Illinois
and Ohio. Table 3 summarizes the damage in these states.
State No.
of
Tornadoes
Deaths Injuries Economic
Damage ($ M)
Alabama 8
86
949
50
Georgia 7
17
104
15
Illinois 13
2
20
11
Indiana 20
49 768
>100
Kentucky 26
77
1,377
110
Ohio 9
3 41
>150
Tennessee 28
50
635
30
Table 3: Super outbreak damage statistics for key states
Damage and loss statistics about some of the most devastating individual tornadoes follows. The
map reference number is provided in parentheses after each of the tornado headings.
Xenia, Ohio Tornado (37)
The most deadly tornado in the entire Outbreak devastated Xenia (pop 25,000) in Greene County,
Ohio shortly after 3:30 pm CDT. Thirty-four people were killed and more than 1,600 injured. The
F5 tornado destroyed around 1,300 buildings, while 2,000 others sustained some damage resulting
in a loss of over $130 million.

6
1974 Super Tornado Outbreak Copyright 2004 Risk Management Solutions, Inc. All Rights Reserved.
April 2, 2004
Brandenburg, Kentucky Tornado (47)
The state’s most severe tornado (F5), which hit Brandenburg in Meade County, was the first of 26
to impact Kentucky. It was even noted to have caused a significant fall and subsequent rise in the
level of the Ohio River as it passed over. Across the entire state, 6,625 families had damaged
property and between 1,800 and 2,000 of the state’s farms incurred damage.
Alabama Tornadoes (96, 97, & 98)
Two tornadoes (96 & 98) caused 55 of the 86 deaths in Alabama and injured 408 people. Over
1,100 buildings, 200 mobile homes, and numerous motor vehicles were destroyed or heavily
damaged. The first tornado (96) formed near Newburg (Franklin County) at 6:30 pm CDT and
moved northeastward. The second (98) followed a parallel track approximately 30 minutes later,
and located only a half-mile north of the first. The second tornado caused 11 more deaths and 121
injuries after crossing into Tennessee. One home was hit by two tornadoes (97 & 98), unroofed
during the first pass and blown entirely away during the second.
Other Severe Weather
Tornadoes were not the only agents of damage. A severe thunderstorm hit St. Louis at about 1:05
pm CDT. This storm, which had high winds and baseball-size hail, caused 25 injuries and $45
million in damage; a record hail loss at the time. Hail up to three inches in diameter was also
observed near Charlotte, North Carolina. Heavy snow and freezing rain affected northern
Michigan, along with damaging wind gusts and flash flooding that washed out some roads and
bridges. Missouri, Michigan, Mississippi, New York, West Virginia, Virginia, North Carolina, and
South Carolina were also affected by either tornado or severe thunderstorm activity.
7
1974 Super Tornado Outbreak Copyright 2004 Risk Management Solutions, Inc. All Rights Reserved.
April 2, 2004
I
N F L U E N C E O N
M
O D E L I N G A N D
P
U B L I C
P
O L I C Y
In the 1970s, the Nuclear Regulatory Commission actively supported tornado risk probability
research to aide in their regulatory decisions. The creation of the Fujita damage scale in 1971
provided a critical means of translating observed damage into wind speed estimates. However,
prior to the 1974 Super Outbreak, researchers were unable to characterize the intensity distribution
within a tornado’s path.
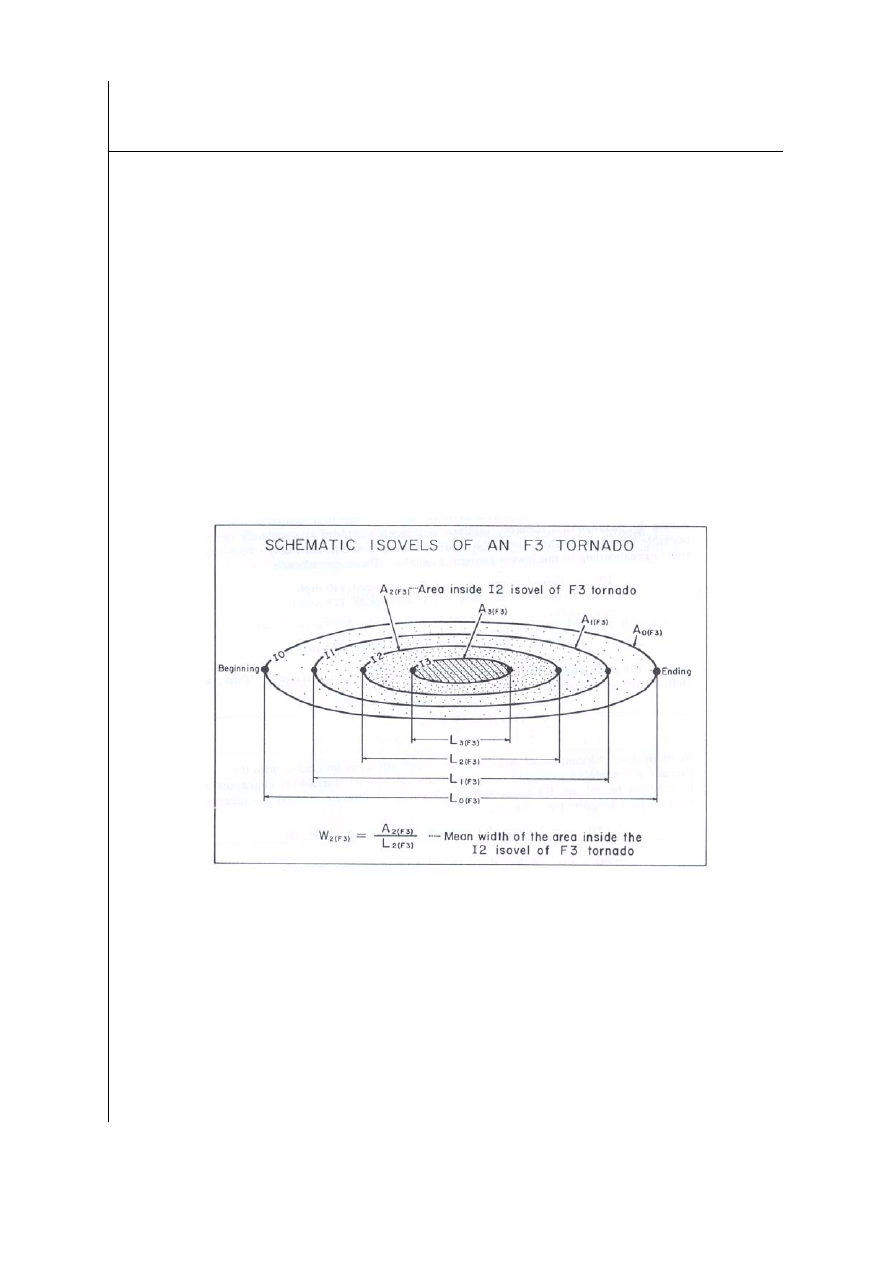
Fujita’s extensive aerial survey after the 1974 Super Outbreak provided the necessary data to
develop an empirical relationship for the width of each F-scale damage area within a tornado path.
As an example, Fujita found that the swath of the F5 damage area within an F5 tornado was very
narrow, usually less than 20 miles (32 km) wide. This survey data provided a new means for
assessing tornado intensity probabilities that accounted for the gradation of damage within the
tornado path. A schematic drawing by Fujita in the late 1970s illustrates this method (see Figure 3).
To this day, this relationship remains the basis for estimating the intensity distribution within
tornadoes.
Research from the 1974 event also provided further evidence of intense vortices embedded
inside a tornado and led to the discovery of downbursts (small scale damaging downdrafts) that
were recognized as the cause of several major airline accidents in the following decade.
Figure 3: Contours of maximum wind speeds (isovels) by F-rating inside a
hypothetical F3 tornado
Aside from the scientific advances, the outbreak also led to NOAA’s rapid expansion of its
weather radio network. During the 1974 event, tornado warnings were being posted so frequently,
that they could not be transmitted from the National Weather Service (NWS) offices fast enough
using teletype. Commercial radio stations also had difficulty re-transmitting the information. After
the Outbreak, NOAA initiated an immediate expansion of its Weather radio network across the
country, along with a modernization program that allowed the National Weather Service to adopt
new technology, improving weather warning lead-times and accuracy.

8
1974 Super Tornado Outbreak Copyright 2004 Risk Management Solutions, Inc. All Rights Reserved.
April 2, 2004
H
A Z A R D A N D
P
R O P E R T Y
L
O S S
R
E C O N S T R U C T I O N
Based on Fujita’s detailed color map of the event’s tornadoes and intensity ratings, RMS
reconstructed the tornado and downburst hazard from the 1974 Outbreak. This process involved
digitization of all 148 tornado paths and downburst areas followed by calibration of these areas to
account for adjustments made to path sizes in the map’s original production. The intensity within
each tornado was derived based on the area/intensity relationships established by Fujita and his
collaborators as a result of their extensive aerial survey.
Because of the extraordinarily localized impacts of these phenomena, RMS used land use cover
data to disaggregate its 2003 U.S. Industry Exposure Database by line of business and coverage to a
resolution of 984 feet (300 m). This detailed resolution was needed to accurately represent the
average loss potential from an individual historic event.
RMS’ reconstruction and modeling effort suggests that a repeat of the 1974 Super Outbreak
today would cause a record level of economic and insurance losses. The insurance losses would
likely reach as much as $3.5 billion for wind losses alone. Unlike recent major tornadoes, such as
the 1999 Oklahoma City Tornado, the impacts of a super outbreak would be distributed over quite
a large area, with losses exceeding the $500 million mark in Ohio, Indiana, and Kentucky. A repeat
of the 1974 Outbreak would surpass the $3.13 billion insurance loss (PCS July 28, 2003) recorded
for the May 2-11, 2003 sequence of tornadoes that impacted 18 states. While there were more
tornadoes in the May 2003 outbreak (~190 tornadoes), the area impacted by intense tornadoes was
actually less than the 1974 Super Outbreak.

9
1974 Super Tornado Outbreak Copyright 2004 Risk Management Solutions, Inc. All Rights Reserved.
April 2, 2004
R
E F E R E N C E S
Abbey, R. F., and T. T. Fujita, 1975: Use of Tornado Path Lengths and Gradations of Damage to
Assess Tornado Intensity Probabilities. Ninth Conf. Severe Local Storms, Norman, OK.
Fujita, T. T., 1974: Jumbo Tornado Outbreak of 3 April 1974. Weatherwise, Vol. 27, No. 3.
Fujita, T. T., 1974: Superoutbreak Tornadoes of April 3, 1974 as seen in ATS Pictures. Sixth Conf.
Aerospace and Aeronautical Meteor, El Paso, TX.
Fujita, T. T., 1975: Statistics of April 3-4 1974 Tornadoes. SMRP letter to colleagues.
Fujita, T. T., 1978: Workbook of Tornadoes and High Winds For Engineering Applications. SMRP
Research Paper 165.
Fujita, T. T., 1992: Memoirs of an effort to unlock mystery of severe storms during the 50 years,
1942-1992. Wind Research Laboratory, Department of Geophysical Sciences, The University of
Chicago, pp. 298.
Grazuilis, T. P., 1993: Significant Tornadoes, 1680-1991. Environmental Films, St. Johnsbury,
VT.
Hoxit, L. R., and C. H. Chappell, 1975: Tornado Outbreak of April 3-4, 1974; Synoptic Analysis.
NOAA Tech Report ERL-338-APCL 37.
Wyszukiwarka
Podobne podstrony:
Romeo and Juliet Analysis and Summary of the Play doc
Preliminary Analysis of the Botany, Zoology, and Mineralogy of the Voynich Manuscript
The Goals and?ilures of the First and Second Reconstructio
Chrystia Freeland Plutocrats, The Rise of the Ne w Global Super Rich and the?ll of Everyone Else (
African Filmmaking North and South of the Sahara
The?uses and?fects of the Chernobyl Nuclear Reactor Melt
Advantages and drawbacks of the Internet
A Tale of Two Cities Summary and Themes of the Book
Confederation And Constitution of the United States
activity-animals-and-parts-of-the-body, Filologia angielska, Praktyki
Cigarettes and Their?struction of the Brain
Pros and Cons of the?ath Penalty
Availability and?scription of the File Checksum Integrity Verifier utility
Stephenson, Neal Dreams and Nightmares of the Digital Age
[Mises org]French,Doug Walk Away The Rise And Fall of The Home Ownership Myth
Herbs Of The Field And Herbs Of The Garden In Byzantine Medicinal Pharmacy
więcej podobnych podstron