
Mapping of temperature distribution in pharmaceutical
microwave vacuum drying
A
´ . Kelen
a,
*, S. Ress
b
, T. Nagy
a
, E. Pallai
c
, K. Pintye-Ho´di
d
a
Formulation Development, Richter Gedeon Ltd., Budapest 10., P.O. B.27 H-1475 Budapest, Hungary
b
Department of Electronic Devices, Technical University of Budapest, H-1521 Budapest, Hungary
c
University Veszpre´m, Research Institute of Chemical and Process Engineering, H-8200 Veszpre´m, Hungary
d
Department of Pharmaceutical Technology, University of Szeged, H-6720 Szeged, Hungary
Received 29 November 2004; received in revised form 14 September 2005
Available online 7 February 2006
Abstract
Microwave vacuum drying is getting more and more popular—thanks to its known advantageous features. In spite of its uniqueness, there is a
rightful resistance and mistrust because of the nonhomogeneous electric field that may cause nonhomogeneous temperature distribution in the
workload. In practice the best uniformity of power density and the shortest drying time are sought simultaneously, thus the drying method is close
to its secure limit. Control and monitoring of a running process remains unsolved but even experimental mapping is rather circuitous. The
dielectric and thermal properties of a complex pharmaceutical composition are rarely known, and moreover, they change during a drying process,
which makes accurate mathematical modelling rather uncertain. For that very reason preliminary tests can never be neglected. The aim of our
study is to experimentally map and evaluate the heat distribution quantitatively. To get a 3D overview of a free-flowing bulk, the workload was
divided with Teflon layers to form cross-sectional surfaces. After dissipation of microwave energy, IR thermocartograms were taken and the
temperature distribution was evaluated quantitatively. The ‘‘3D layered thermography’’ method offers reliable and workload-specific information,
via a simple executable technique, for optimization of a microwave assisted drying process.
D 2005 Elsevier B.V. All rights reserved.
Keywords: Pharmaceutical; Microwave; Homogeneity; Thermography
1. Introduction
1.1. Dielectric heating
The benefits and drawbacks of microwave drying in the
pharmaceutical industry have been well known for decades. In
spite of the fact that dielectric drying offers unique advantages
the biggest resistance to widespread use may be the non-
uniformity of the electromagnetic field (E-field), which results
in a nonhomogeneous temperature pattern
. The origin and
result of a generated hot-spot is influenced by the electromag-
netic and thermodynamic features of the microwave system
and the workload. Hotter areas are cooled by heat diffusion to
the surrounding material, determined by the thermal diffusivity
and the temperature gradient. The use of microwaves can be
risky if the thermal diffusivity of the workload is low, in which
case the heat flow is slower than the rate of energy dissipation.
When drying of extremely fragile corn starch-based
granules (6.3 kg) was carried out under vacuum (50
T 5 mbar)
and accelerated by microwaves (1.2 kW, 2450 MHz) in a
single/one pot unit (Collette Ultima 25 l; a high-shear
granulator that incorporates vacuum and microwave drying
options), local burning was experienced after 25 min of
microwave heating. In the case of dielectric heating the
location and temperature of hot spots are unpredictable,
because of many factors, which influence the uniformity of
the E-field
.
To avoid the undesirable unequal temperature distribution
there are several possible solutions, e.g. intensification of the
mixer motion, and/or reduction of the microwave power. The
former would change the grain-size distribution unacceptably,
while the latter would considerably increase the process time.
0032-5910/$ - see front matter
D 2005 Elsevier B.V. All rights reserved.
doi:10.1016/j.powtec.2005.12.001
* Corresponding author.
E-mail address: a.kelen@richter.hu (A
´ . Kelen).
Powder Technology 162 (2006) 133 – 137
www.elsevier.com/locate/powtec

As a result of experimental process optimization the best
uniformity and highest acceptable power density, as well as the
shortest drying time are sought, without any corresponding
damage of the workload.
The aim of the present study is to experimentally map and to
evaluate the forming stereoscopic temperature pattern of a free-
flowing bulk workload. This paper focuses on the macroscopic
temperature distribution, and not on the molecular/microscopic
level
1.2. Thermography
Among the non-perturbing, and non-intrusive temperature-
monitoring alternatives, infrared imaging is known as one of
the most promising. Thermal imaging relies on the fact that all
bodies emit electromagnetic radiation due to electronic
oscillation and the radiated energy is proportional to the
temperature of the object. The unique advantage of IR
monitoring is that it does not disturb the drying and a huge
quantity of data can be recorded digitally and displayed
instantly
. The limitation of IR monitoring is that it provides
information exclusively about the monitored surface. Ohlsson
et al.
made cross sections of solid objects and used thermal
imaging to get 3D information about their temperature
distributions.
2. Theoretical aspects
2.1. Nonhomogeneity of microwaves
Field concentration of standing waves at close proximity to
the power-feed-point can cause non-uniform distribution of the
microwave field
. Many factors influence the uniformity of
the E-field. They can be divided roughly into two groups:
cavity effects (design limitation, location of the microwave
inlet point, shape of the cavity, hanging parts such as spray
gun, mixer, chopper, thermometer) and workload interactions
(loss factor, penetration depth and thickness of the workload,
particle features, etc.), that are different from product to
product and from equipment to equipment
.
Inter alia ‘‘mechanical moving mode stirrers’’ or ‘‘wave-
guide rotating joints’’ or simple agitation of the workload are
used to assure more uniform E-field distribution, and thus
heating. Adequate homogeneity can be achieved, e.g. in a
developed microwave applicator, characterised by cylindrical
shape and adjusted with several magnetrons
. In the case of
special single/one pot pharmaceutical microwave equipment,
the number and position of magnetrons is very restricted due to
its primary functional purpose, thus agitation of the workload is
preferred. In the case of drying of extremely fragile granules,
any type of mechanical movements endanger the quality of the
product.
2.2. Theoretical models
An inherent deficiency of dielectric drying is that there is no
common method to control, or properly monitor, the E-field
distribution and its effect after starting the microwave
treatment. With the help of mathematical models based on
Maxwell’s equations the theoretical electric and magnetic field
configuration within the product can be calculated
[8,10]
even
in 3D
, if the configuration of the cavity, the dielectric
properties of the workload and the granule geometry, etc., are
exactly known. The following dielectric heating equation is
also used to calculate the dissipated microwave power ( P
d
,
[W])
:
P
d
¼ 2pf e
0
eVVE
2
i
ð1Þ
where f = microwave frequency [Hz];
(
0
= free-space or abso-
lute permittivity 8.854
10
12
[F/m]; eVV= loss factor of the
dielectric material [dimensionless]; E
i
= electric-field strength
within the dielectric [V/m].
The internal energy (U, [J]) of the product being dried in
microwave oven changes with the absorbed (dissipated)
microwave energy (E
d
, [J]). Based on the first law of
thermodynamics, temperature is considered as an indicator of
E-field. The change in the internal energy can be expressed by
the following relations:
DU
¼ RQ RW
ð2Þ
DU
¼ Q
solvent t
start
Yt
BP
ð
Þ
þ Q
steam t
BP
Yt
end
ð
Þ
þ Q
solid t
start
Yt
end
ð
Þ
W
vol
þ W
evap
ð3Þ
DU
¼ c
solvent
m
solvent
DT
t
start
Yt
BP
ð
Þ
þ c
steam
m
steam
DT
t
BP
Yt
end
ð
Þ
þ c
solid
m
solid
DT
t
start
Yt
end
ð
Þ
pDV þ L
v
m
solvent
ð4Þ
DU
¼ c
solvent
m
solvent
DT
t
start
Yt
BP
ð
Þ
þ c
solid
m
solid
DT
t
start
Yt
end
ð
Þ
þ L
v
m
solvent
ð5Þ
where Q = quantity of heat [J]; W = work [J]; Q
xx(t
yy
Y
t
zz
)
=
quantity of heat of the indicated material in the given
temperature range [J]; W
vol
= volumetric work [J]; W
evap
= eva-
poration work [J]; c
xx
= specific heat capacity of the indicated
material [J/kg K]; m
xx
= mass of the indicated material [kg];
DT
(t
yy
Y
t
zz
)
= temperature difference between the indexed events
[K]; L
v
= heat of vaporization [J/kg].
The energy dissipation of the steam, which is present in the
cavity, is considered negligible due to its small amount
(m
steam
å 1 g). There is no volumetric work (DV å 0). The
change in the internal energy during microwave drying can be
calculated on the basis of the dissipated microwave power ( P
d
,
[W]) and the microwave treatment time (t, [s]).
DU
¼ E
d
¼ P
d
t
ð6Þ
DT ¨DU ¨P
d
¨E
i
ð7Þ
Microwaves are not forms of heat, but rather forms of
energy that are manifested as heat through their interaction with
materials. There is a two-step energy conversion: electric field
is converted to induced ordered kinetic energy, which in turn is
converted to disordered kinetic energy, at which point it may be
A´. Kelen et al. / Powder Technology 162 (2006) 133 – 137
134
regarded as heat within the material
. In accordance with
the aforementioned, it can be stated that the change in the
product temperature is proportional to the change in the
internal energy of the material and to the dissipated power
thus to the electric-field strength within the dielectric.
For determination of the dissipated microwave power ( P
d
,
[W]), a special instrumental set-up
would be required to
measure the magnetron output power ( P
m
, [W]), the reflected
power ( P
r
, [W]) and all the losses that are evolved in the set-up
(e.g. losses by the direction coupling, by fitting attenuation).
Based on the measured reflected microwave power, the
dissipated microwave power could be calculated by the
following equation:
P
d
¼ P
m
BP
r
ð8Þ
where B = comprises the different attenuations and losses
[dimensionless].
Theoretical models are always limited by generalization and
simplification. Calculations consider the workload homoge-
neous from dielectric, thermal and other point of views
although it is generally not the case. Especially when drying
complex pharmaceutical compositions, the workload may
consist of several ingredients, characterised by different and
often unknown dielectric and thermal properties. Moreover
these are continuously changing during a drying process, not
only in time but also in 3D, and depending on many factors
(e.g. moisture content and temperature)
. For that very
reason, experimental tests are much more reliable.
3. Experiments (‘‘3D layered thermography’’
mapping method)
In the experiments the steady-state workload was corn
starch (Ph.Eur., Roquette GmbH, Germany), a common
pharmaceutical diluent. Its density was found ~ 560 kg/m
3
that
does not influence considerably the drying process
During the drying process the initial moisture content was
13% (wet weight based) and the temperature was 25
-C.
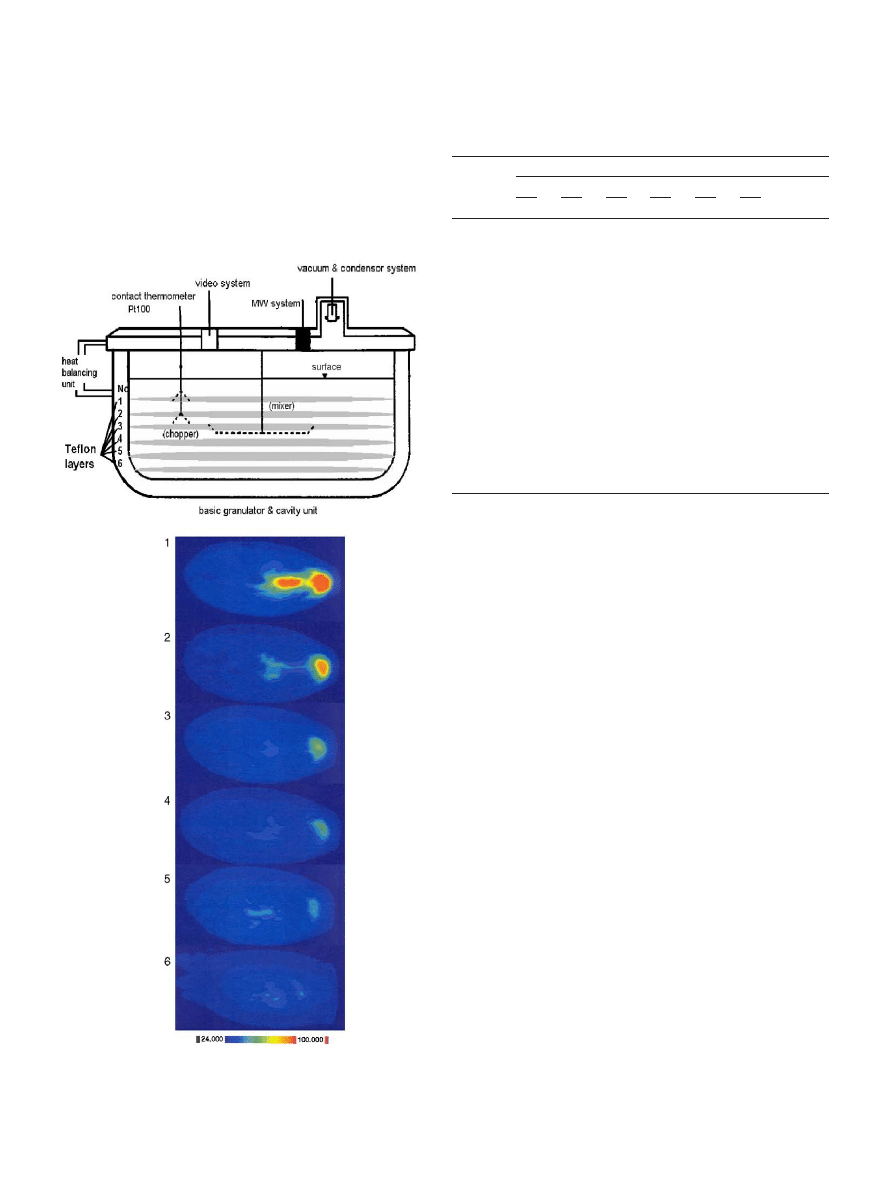
The workload (6.3 kg, 2/3 of the total capacity) was heated
by microwaves at 1.2 kW (2450 MHz) under a pressure of
50
T 5 mbar in a single pot system (Collette Ultima 25 l,
Collette NV, Belgium) (
). Initially, the temperatures of the
double-jacket of the cavity and the workload were tempered at
25
T 1 -C for 60 min. The temperature of the condenser was
controlled at 6
T 1 -C during the drying processes. Circulation
in the cooling system was stopped, thus the double-jacket was
heated up exclusively by thermal conduction.
After 25 min of microwave radiation carbonised dots were
detected on the surface. Because of carbonisation, the temper-
ature of the local hot spots must have been over 200
-C,
according to the thermogravimetric analysis of cornstarch.
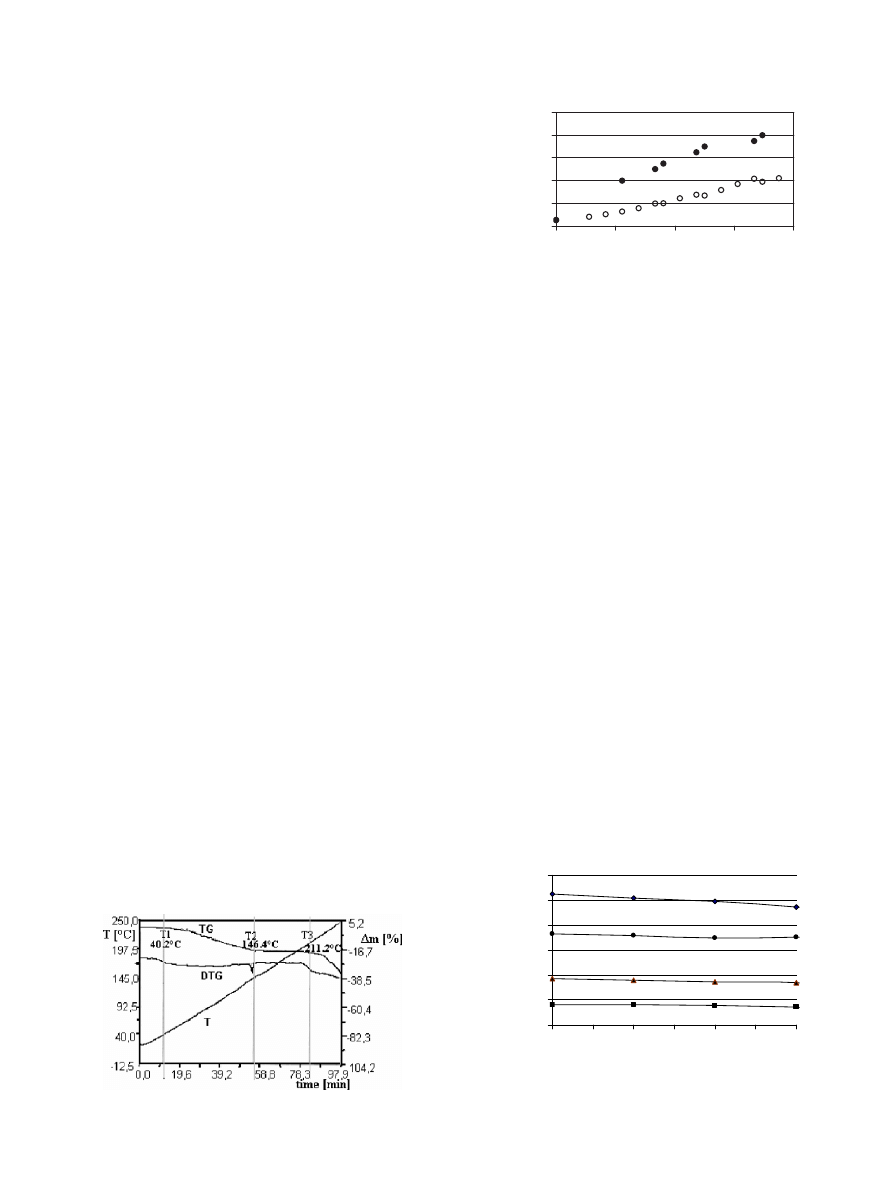
During the study the samples were heated slowly and
continuously during ¨ 100 min, from 20
-C to 250 -C (T curve
). According to the TG (thermogravimetry) and DTG
(differential thermogravimetry) curves there are three tempera-
tures (T1, T2 and T3) where the mass of the sample changes
because of thermodynamic effects (
). Knowing the
structure and chemical behaviour of corn starch it can be stated
that the first two peaks correspond to loss of free water (from
T1: ¨ 40
-C to T2: ¨145 -C). The third peak (T3: over 200 -C)
refers to the conspicuous carbonization (decomposition).
At 25 min radiation time the contact thermometer fitted into
the chopper arm (Pt100 in
) measured around 60
-C while
there were carbonized spots (
).
The measured temperature difference between the two areas
was significant. Therefore more detailed mapping was essential
in order to get reliable information about the temperature
distribution within the entire workload. Teflon (PTFE) disks of
1 cm thickness were used to divide the workload horizontally
into six layers of 2 cm thickness. Teflon was chosen because it
does not absorb microwave energy
. Between the layers tiny
Fig. 1. T (=temperature) and TG (=thermogravimetry) curves of corn starch.
T1, T2 and T3 indicate the temperatures were the mass of the sample changed.
20
40
60
80
100
120
0:00
0:07
0:14
0:21
0:28
time [min]
T [
°
C]
Fig. 2. Temperature – time curve of cornstarch. The contact thermometer fitted
into the chopper arm (Pt100) (>) was operating during the running process,
hot-spot surrounding temperature (?) is measured immediately after micro-
waves were switched off (6.3 kg, 50 mbar, 1.2 kW, 2450 MHz). (Three
replications were used to generate each data point.)
40
50
60
70
80
90
100
0,0
0,5
1,0
1,5
2,0
2,5
3,0
time, [min]
T, [
°
C]
Fig. 3. Transient temperature of cornstarch at different initial temperatures. The
long-wave emission constant of corn starch is found at 0.95 (in harmony with
the data given in the user manual of the IR camera). (Three replications were
used to generate each data point.)
A´. Kelen et al. / Powder Technology 162 (2006) 133 – 137
135
Teflon distance pieces assured an even density of cornstarch,
because it is known that the loss factor depends on the
characteristic bulk density
. After 25 min drying time, the 6
cornstarch layers were immediately monitored one by one by
an infrared camera (AGA782 Infrared Imaging System,
Infrared System AB, Sweden). The six snapshots were taken
within 1 min of the microwave being switched off. Transient IR
snapshots
prove that the temperature decrease between the
end of the microwave treatment and taking the thermograms is
negligible (DT
max
found 1 – 2
-C) (
Thermography offers immediate coloured 2D images (
Fig. 4
)
about the heating pattern of each layer that can be characterised
and quantified.
4. Results and discussion
After 25 min of microwave treatment carbonised hot spots
are detected. Their surrounding temperature was measured and
found to be around 100
-C meanwhile the temperature of
another area is found around 60
-C (Pt100 thermometer).
According to the thermal analysis of corn starch (
) it can
be stated that the carbonised hot spots are heated up to a
minimum of 200
-C during the drying process. A significant
difference can be found between the temperature in the vicinity
of the hot-spots and the contact thermometer fitted into the
chopper arm (
). The experiments prove the non-uniform
temperature distribution that originates from the non-uniform
E-field distribution.
The colours of the thermocartograms refer to the tempera-
ture of the area, in accordance with the given colour scale,
which makes qualitative analysis possible. Two hotter areas are
seen directly under the microwave inlet window. The asym-
metric temperature pattern on the surface is the consequence of
the microwave inlet position and the vertical temperature
decrease is in agreement with penetration depth concepts
(
). The amplitude of microwave diminishes owing to
absorption of power as heat in the material
.
Fig. 4. The single/one pot equipment. The workload is divided by Teflon disks
into six horizontal layers. The six thermocartograms are in order of location:
layer No. 1 is the upper and No. 6 is the base of the pot. Diameters of the disks
follow the geometry of the bowl: Nos. 1, 2, 3 and 4 are 0.37 m, No. 5 is 0.34 m
and No. 6 is 0.22 m.
Table 1
The quantitative evaluation of the temperature distribution based on ‘‘layered
thermography’’
n
x
, layer no.
T
i
y
* [C]
1
2
3
4
5
6
M
i
y
* [%]
m
n
x
i
y
* [%]
< 25
16.3
3.2
–
–
–
–
3.2
25 – 30
21.9
33.9
37.3
34.9
31.3
13.9
28.9
30 – 35
19.9
39.1
39.1
37.7
34.9
39.1
34.9
35 – 40
20.7
10.5
18.0
20.7
26.4
38.3
22.4
40 – 45
6.1
7.2
3.1
5.0
5.7
8.6
5.9
45 – 50
3.2
3.5
0.7
1.0
1.8
–
1.7
50 – 55
2.2
0.7
0.5
0.5
–
–
0.6
55 – 60
1.6
0.6
0.5
0.2
–
–
0.4
60 – 65
1.4
0.4
0.6
–
–
–
0.4
65 – 70
1.2
0.3
0.1
–
–
–
0.2
70 – 75
1.0
0.2
–
–
–
–
0.2
75 – 80
0.8
0.2
–
–
–
–
0.2
80 – 85
0.6
0.2
–
–
–
–
0.1
85 – 90
0.6
0.4
–
–
–
–
0.2
90 – 95
0.6
–
–
–
–
–
0.1
> 95
2.1
–
–
–
–
–
0.4
T¯
n
x
[
-C]
36.7
33.2
32.4
32.6
33.1
34.6
T¯: 33.7
n
x
= number of a layer; T¯
i
y
= temperature range [
-C]; M
i
y
* = percent of the total
material in the i
y
temperature range within the whole workload [%];
m
n
x
i
y
* = percent of the material in the i
y
temperature range within the n
x
layer
[%]; T¯
n
x
= average temperature of the n
x
layer [
-C]; T¯ = average temperature of
the total workload [
-C]). (Three replications were used to generate each data.)
A´. Kelen et al. / Powder Technology 162 (2006) 133 – 137
136

To get more detailed 3D information about the temperature
thus E-field distribution of a free flowing workload the
obtained thermocartograms are evaluated with the under-
mentioned ‘‘layered thermography’’ technique (
). One
layer is represented by some 24 000 pixels in the thermo-
cartograms. One pixel corresponds to 1.2 mm
2
of the corn
starch layer. The mass (m
n
x
i
y
, kg) of bulk characterised by a
chosen temperature range (i
y
: i
25 – 30
, . . ., i
95 – 100
) in a layer
(n
x
: n
1
, . . ., n
6
) can be calculated by the camera-detected
surface area (A
n
x
i
y
, m
2
) (the sum of the surfaces according to
the number of the pixels), the known thickness (d
n
x
= d = con-
stant, 0.02 m) and the density (q
n
x
= q = constant, ¨ 560 kg/
m
3
) of the product layer. Based on preliminary tests, the
vertical temperature difference within the corn starch layers of
0.02 m thickness was never greater than 1 – 2
-C, thus the
temperature of the whole amount under a given surface can
be characterised by the surface temperature.
m
n
x
i
y
¼ A
n
x
i
y
dq
ð9Þ
The percentage of material (m
n
x
i
y
*, %) characterized by an
i
y
temperature range within the n
x
layer can be calculated from
the mass in question (m
n
x
i
y
, kg) and the mass of the entire layer
(m
n
x
, kg) (in other words from the number of pixels in question
and the sum number of pixels in the entire layer):
m4
n
x
i
y
¼
m
n
x
i
y
m
n
x
I100
ð10Þ
The percentage of total material (M*
i
y
, %) characterized by an
i
y
temperature range within the whole workload (M, %) is:
M 4
i
y
¼
M
i
y
M
I100
ð11Þ
The average temperature of the n
x
layer (T¯
n
x
,
-C) can be
calculated from the percentage of the material characterized by
an i
y
temperature range within the n
x
layer (m
n
x
i
y
*, %)
multiplied by the mean temperature of the incidental i
y
temperature range (T¯
i
y
,
-C).
¯
T
T
n
x
¼ R m4
n
x
i
y
I ¯T
T
i
y
=
100
ð12Þ
The presented ‘‘3D layered thermography’’ technique offers
quantitative information about the temperature distribution of a
free-flowing workload in a simple way. It is not suitable for
monitoring the deeper layers directly during a running process,
but based on the confirmed reproducibility of the E-field
distribution (analysis of variance proves the reproducibility;
p > 0.05), it makes the modelling of a real microwave assisted
drying process possible even in the case of a pharmaceutical
formula characterised by unknown and continuously changing
features.
5. Conclusions
In the case of dielectric drying the non-uniform temperature
distribution in the workload is the consequence of the
electromagnetic field interaction with the different dielectric
materials. Some techniques are known to lessen this temper-
ature differences but the prevention of its developing is more
serviceable from the product quality point of view.
The presented ‘‘3D layered thermography method’’ makes
possible to map the temperature distribution in a free-flowing
bulk and it also provides quantitative 3D information. Based on
the known temperatures of the identified hottest areas the
drying process can be regulated to keep the temperature of the
endangered areas below the critical limit.
Acknowledgements
The authors thank La´szlo´ Cserna´k, Attila Bo´dis and
Andra´sne´ Kucsera (Gedeon Richter Ltd.).
References
[1] M.E. Aulton, Radiation drying of wet solid, Pharmaceutics, 2nd ed
R,
Churchill Livingstone, London, 2002, pp. 386 – 388.
[2] A.F. Harvey, Microwave Engineering, Academic Press, New York, 1963.
[3] A.C. Metaxas, R.J. Meredith, Dielectric properties, Industrial Microwave
Heating, 2nd ed
R, Peter Peregrinus Ltd., London, 1988, p. 57.
[4] R. Meredith, Introduction and fundamental concepts, in: Engineers’
handbook of industrial microwave heating, The Institution of Electrical
Engineers, London, 1998, pp. 7 – 13, pp. 19 – 35. and pp. 163 – 176.
[5] J. Berlan, Microwaves in chemistry another way of heating reaction
mixture, Radiat. Phys. Chem. 45 (4) (1995) 581 – 589.
[6] J. Bows, K. Joshi, Infrared imaging feels the heat in microwave ovens,
Phys. World 5 (1992) 21 – 22.
[7] T. Ohlsson, P.O. Risman, Temperature distribution of microwave heating
spheres and cylinders, J. Microw. Power Electromagn. Energy 13 (4)
(1987) 303 – 310.
[8] G. Duschler, W. Carius, K.H. Bauer, Single-step granulation method with
microwaves preliminary studies and pilot scale results, Drug Dev. Ind.
Pharm. 21 (14) (1995) 1599 – 1610.
[9] J. Suhm, M. Mo¨ller, Aufbau von Mikrowellenanlagen Proc. OTTI-
Profiforum Mikrowellen-Thermoprozesstechnik Grundlagen, Anlagen
und Anwendungen, Deutschland, November, 2003.
[10] S. Zhu, Y. Zhang, T.R. Marchant, A DRBEM model for microwave
heating problems, Appl. Math. Model. 19 (5) (1995) 287 – 297.
[11] V.A. Mechenova, V.V. Yakovlev, Efficiency optimization for systems and
components in microwave power engineering, J. Microw. Power Electro-
magn. Energy: Publication of The International Microwave Power
Institute 39 (1) (2004) 15 – 29.
[12] A. Hallac, A.C. Metaxas, Finite element time domain analysis of
microwave heating applicators using higher order vector finite elements,
Proc. 9th International Conference on Microwave and High Frequency
Heating, UK, Sept., 2003, p. 021.
[13] R.F. Schiffmann, Microwave and dielectric drying, Handbook of Industrial
Drying, 2nd ed
R, Marcel Dekker, Inc., New York, 1955, pp. 345 – 372.
[14] A. Go¨llei, L. Luda´nyi, E. Pallai, A. Vass, E. Szijja´rto´, Power engineering
study of combined microwave and convective drying, Proc. 6th
International Conference on Food-Science, Hungary, May, 2004, (CD).
[15] M.K. Ndife, G. Sumnu, L. Bayindrili, Dielectric properties of six different
species of starch at 2450MHz, Food Res. Int. 31 (1) (1998) 43 – 52.
[16] C.M. McLoughlin, W.A.M. McMinn, T.R.A. Magee, Physical and
dielectric properties of pharmaceutical powders, Powder Technol. 134
(2003) 40 – 51.
[17] C. Pe´re´, E. Rodier, Microwave vacuum drying of porous media
experimental study and qualitative considerations of internal transfers,
Chem. Eng. Process. 41 (2002) 427 – 436.
[18] S. Nelson, Density dependence of dielectric properties of particulate
materials, Trans. ASAE 26 (1983) 1823 – 1825.
[19] V. Szekely, S. Ress, A. Poppe, S. Torok, D. Magyari, Zs. Benedek,
K. Torki, B. Courtois, M. Rencz, New approaches in the transient
thermal measurements, Microelectron. J. 31 (2000) 727 – 733.
A´. Kelen et al. / Powder Technology 162 (2006) 133 – 137
137
Document Outline
Wyszukiwarka
Podobne podstrony:
Experimental study on drying of chilli in a combined Microwave vacuum rotary drum dryer (Weerachai K
Improving Grape Quality Using Microwave Vacuum Drying Associated with Temperature Control (Clary)
Microwave vacuum drying of model fruit gels (Drouzas, Tsami, Saravacos)
Improving Grape Quality Using Microwave Vacuum Drying Associated with Temperature Control (Clary)
Modelling of dehydration rehydration of orange slices in combined microwaveair drying
Characterization of microwave vacuum drying and hot air drying of mint leaves (Mentha cordifolia Opi
Genome wide mapping of gene–microbiota interactions in susceptibility to autoimmune skin blistering
Thin layer modelling of the convective, microwave, microwave convective and microwave vacuum drying
Microwave vacuum drying of porous media experimental study and qualitative considerations of interna
Microwave vacuum drying of marine sediment determination of moisture content, metals and total carbo
Effective Moisture Diffusivity of Plain Yogurt Undergoing Microwave Vacuum Drying
Microwave Application in Vacuum Drying of Fruits (Drouzaf, H SchuberP)
Microwave Application in Vacuum Drying of Fruits (Drouzaf, H SchuberP)
Continuous Drying of Lumber in a Microwave Vacuum Kiln
Low Temperature Differential Stirling Engines(Lots Of Good References In The End)Bushendorf
więcej podobnych podstron