
Electronic copy available at: http://ssrn.com/abstract=1719796
1
Online Investors: What They Want, What They Do, And How Their
Portfolios Perform
1
Arvid Hoffmann
*
Maastricht University and Network for Studies on Pensions, Aging and Retirement (Netspar)
Hersh Shefrin
Santa Clara University
Abstract: For 5,500 individual online investors we match survey records with recent trading data to
gain a better understanding of the relationships among investors’ decisions, the processes leading to
these decisions, and resulting performance. We investigate what online investors want, in terms of
their stated objectives for investing, what they do, in terms of the broad investing strategies they
employ, and how their portfolios perform in terms of return, risk, and factor exposure. In particular,
we analyze how systematic differences in investors’ traits interact with their objectives and strategies.
Our results provide insights into the impact on investors’ portfolios stemming from overconfidence,
perceived competence, gambling and speculation, and risk appetite. These four variables have
received emphasis in the recent literature in which survey and transaction data are matched. We find
that investor traits such as experience, risk appetite, and ambition, objectives related to speculation,
and strategies relying on intuition and/or technical analysis are critical determinants of turnover. We
find that individual investor return performance is adversely impacted by demographic characteristics
such as length of online trading experience, and by strategies featuring the use of technical analysis
and/or advice from brokers. Notably, we find little if no evidence that investor returns are positively
correlated with risk, if anything the reverse.
JEL Classification: G11, G24
Keywords: Individual Investors, Behavioral Biases, Investment Decisions, Investor Performance.
*
Corresponding author: Arvid O. I. Hoffmann, Maastricht University, School of Business and Economics,
Department of Finance, P.O. Box 616, 6200 MD, The Netherlands. Tel.: +31 43 38 84 602. E-mail:
a.hoffmann@maastrichtuniversity.nl.
1
This research would not have been possible without the collaboration of a large online broker. The authors
thank this broker and all its employees who helped us. For their comments on previous drafts of this paper, the
authors thank Jeroen Derwall, Ingolf Dittmann, Marty Leibowitz, Andrew Lo, Harry Markowitz, Carrie Pan,
Bill Sharpe, Yossi Spiegel, Meir Statman and seminar participants at INSEAD (2010), the IMCA Advanced
Wealth Management Conference (2010), and the JOIM Spring Conference on Modern Portfolio Theory: The
Evolution and Future (2011). Special thanks to our JOIM discussant Jim Peterson, chief investment officer for
Charles Schwab Investment Advisory and portfolio manager for Schwab Managed Portfolios, who indicated
that American online investors share the same characteristics as those reported for Dutch investors in our paper.
The title of our paper is inspired by Meir Statman’s book “What Investors Really Want.” Any errors are, of
course, our own.

Electronic copy available at: http://ssrn.com/abstract=1719796
2
1. Introduction
Our paper investigates what online investors want, in terms of their stated objectives for investing,
what they do, in terms of the investing strategies they employ, and how their portfolios perform in
terms of return, risk, and factor exposure. The main contribution of this paper is that it uses matched
survey data and transaction data to characterize the variation in online investors' primary investment
objectives, their broad strategies, and their key psychological traits, along with an analysis of how
these variables influence the risk-return and turnover profiles of their portfolios.
This paper broadens and extends the recent literature that matches survey data to trading data.
This literature emphasizes the important role that psychological factors play in the investment
decision process. These factors broadly pertain to the “better than average” notion of overconfidence
(Dorn and Huberman 2005; Glaser and Weber 2007a; Glaser and Weber 2007b), self-perceived
competence (Graham, Harvey, and Huang 2009), entertainment and gambling/sensation seeking
(Dorn and Sengmueller 2009), and risk appetite (Dorn and Huberman 2005).
2
Dorn and Huberman (2005) find that investors who think they are knowledgeable about financial
securities hold better diversified portfolios, while those who rate themselves as above average in
terms of knowledge churn their portfolios more (see also Glaser and Weber 2007a). In a related vein,
Glaser and Weber (2007b) find a tendency among individual investors to overestimate their relative
position in terms of return percentile, indicating a better than average effect. However, they do not
find evidence for a “learning to be overconfident” effect (Gervais and Odean 2001) as actual (past)
returns are not correlated with the (current) degree of overconfidence of these investors. Graham et al.
(2009) find that investors who feel competent trade more and have more internationally diversified
portfolios. In addition, males and investors with larger portfolios or more education are more likely to
perceive themselves as competent. Dorn and Sengmueller (2009) find that investors who report
enjoying investing or gambling turn over their portfolio at twice the rate of their peers. Finally, Dorn
and Huberman (2005) find that self-reported risk aversion is the single most important determinant of
portfolio turnover and diversification for individual online investors.
Relative to the literature described above, our paper broadens the objectives under study so that
the focus on entertainment and gambling in the recent literature is imbedded in an analysis that also
examines other objectives such as saving for retirement, capital growth, and building a financial
buffer. The paper's examination of broad strategies in this context strikes us as new. Examples of
strategies are intuition, technical analysis, fundamental analysis, financial news, and advice from
brokers. As to psychological traits, the paper analyzes self-assessments of risk appetite, sophistication,
and ambition, all of which relate to issues addressed in the behavioral literature such as risk tolerance,
overconfidence, aspiration, and perceived competence.
2
We note that the idea of investors also deriving non-financial utility from their actions is not a recent one.
Markowitz (1952) already noted the “fun of participation” as a driving force of investing in the stock market.

3
Our analysis indicates that the performance of online investors’ portfolios, as measured by return,
factor risk, non-factor risk, and turnover are driven by the combination of objectives, strategies, and
personal traits. The paper contains new insights into the impact on investment activity from attributes
such as the objective of saving for retirement, the strategy of relying on intuition, and the
psychological trait involving ambition. Our findings support and extend results reported in the recent
literature. For example, consider investors whose primary objective is speculation. We confirm that
speculators turn their portfolios over more than other investors. We extend this finding to show that
relative to other online investors, self-identified speculators engage in more trading of options, earn
considerably lower returns (both gross and net of transaction costs) and bear more risk. Our results are
consistent with the well known finding for individual investors that turnover and returns are
negatively related, a property implicitly attributed to overconfidence. Notably, the paper provides
explicit evidence for this attribution in that relative to other online investors, speculators are especially
inclined to view themselves as very advanced. In respect to strategies, speculators who use technical
analysis have the worst returns by far. Not surprisingly, investors who employ technical analysis have
very high turnover and transaction costs, resulting in very low net returns. These results provide a
flavor of the findings reported in the paper. A fuller summary appears in the concluding section.
The remainder of this paper is organized as follows. Section 2 describes how we measure
investors’ psychological profiles. Section 3 shows our data and method. Section 4 presents our results.
Section 5 relates the results to the underlying psychological theory. Section 6 concludes.
2. Measuring Investors’ Psychological Profiles
We determine individual investors’ psychological profile as follows. First, we measure investors’
sophistication in terms of their self-classification as either a novice, advanced or very advanced
investor, in line with studies investigating better than average overconfidence (Dorn and Huberman
2005; Glaser and Weber 2007b; Graham, Harvey, and Huang 2009). Second, we investigate investor
competence (Graham, Harvey, and Huang 2009) by studying the strategies investors use and the
amount of knowledge these require. Third, we identify the relative importance investors attach to
entertainment and gambling (Dorn and Sengmueller 2009; Kumar 2009) as well as sensation seeking
(Grinblatt and Keloharju 2009) through survey questions that pertain to primary investment objective.
Fourth, we measure investors’ risk appetite (Dorn and Huberman 2005; Dorn and Huberman 2009).
Fifth, in line with literature on the role of aspiration levels on investment decision-making (Shefrin
and Statman 2000; Statman 2002; Statman 2011) we measure investors’ ambition levels. Sixth, we
identify investors’ experience in terms of account tenure (Seru, Shumway, and Stoffman 2010).
3. Data and Method
Our analyses draw on transaction records of all clients and questionnaire data obtained for a sample of
clients of the largest online broker in The Netherlands. The broker is mainly known as a discount

4
broker, but started to offer investment advice in recent years. Due to trading restrictions, we exclude
accounts owned by minors (age <18 years). We also exclude accounts with a beginning-of-the-month
value of less than €250 and accounts owned by professional traders to ensure we deal with active
accounts owned by individual investors. Imposing these restrictions leaves 65,325 individual accounts
with over 9 million trades in common stock and derivatives from January 2000 until March 2006.
3
3.1 Brokerage Records
Opening positions and transaction records are available for all prospective participants of the survey.
The typical record consists of an identification number, transaction time and date, buy/sell indicator,
type of asset traded, gross transaction value, and transaction commissions.
3.2 Survey Data
In 2006, one of us designed and performed an online survey for all clients of the online broker. In
total, 6,565 clients completed the questionnaire. Among other questions, the questionnaire sought to
identify investors’ investment objectives, investment strategies, ambition levels, appetites for risk, and
their sophistication as reflected in their self-categorization into novice, advanced, or very advanced
investor classes (see Figure 1).
After matching transaction records with questionnaire data, a sample of 5,500 clients and
corresponding accounts remain for which both transaction and survey data are available.
[Figure 1 about here]
3.3 Summary Statistics
In Table 1 we report descriptive statistics for the respondents (Panel A) as well as non-respondents
(Panel B) to the investor survey. Of the sample of investors for which both transaction and survey
data is available, 58% are male and the mean age is about 50 years. The mean (median) number of
trades over the sample period is 76.45 (30.00). Average (median) monthly turnover of common stock
is about 42% (11%), for derivatives average (median) monthly turnover is 16.5% (3.62%). The
average (median) portfolio value is €45,915 (€15,234). Combining the average portfolio value with
the total portfolio value of the average Dutch investor (Bauer, Cosemans, and Eichholtz 2009)
indicates that our average client invests more than three-fourths of her total self-managed investment
portfolio at this particular online broker. Although we have no information on these investors total
wealth including, for example, real estate and pension accounts, these numbers make it unlikely that
we investigate “play accounts” (Goetzmann and Kumar 2008).
4
Mean (median) trading experience is
3
As they constitute a negligible fraction of all trades in our sample, we follow Bauer, Cosemans and Eichholtz
(2009) and disregard any transactions in bonds and futures contracts.
4
In fact, 40.8% of our survey respondents only hold an investment account at this particular broker. Of the
respondents who also hold an investment account at another broker, 51.6% indicate that this comprises less than

5
about 40.21 (39.00) months. As compared to recent findings by Odean and Barber (2000) and
Goetzmann and Kumar (2008) our investors’ portfolios are better diversified, although still far from
well-diversified. The mean (median) number of stocks held by our investors is 6.57 (4.00) while the
mean (median) Herfindahl-Hirschmann Index (HHI) is 27.78% (21.14%). Comparing the HHI with
the normalized HHI (HHI*) indicates that investors’ portfolio weights are not uniformly distributed.
5
Mean (median) monthly returns over the sample period are -0.30% (0.30%). Risk appetite is relatively
high, with a mean (median) score of 5.31 (6.00) (1=very conservative, 7=very speculative).
A comparison between survey respondents (Panel A) and non-respondents (Panel B) shows that,
although the differences are relatively small, the clients who completed the survey tend to be
relatively sophisticated investors with a sizeable portfolio, which adds to the relevance of our study.
[Table 1 about here]
3.4 Measuring Investor Performance
Investor performance is defined as the monthly change in market value of all securities in an
investor’s account net of transaction costs. As performance is measured on a monthly basis,
assumptions have to be made considering the timing of deposits and withdrawals of cash and
securities. To be conservative, we assume that deposits are made at the start of each month and
withdrawals take place at the end of each month. Analyses assuming that deposits and withdrawals
are made halfway during the month yield similar results. Hence, we calculate net performance as
)
(
)
(
1
1
it
it
it
it
it
net
it
D
V
NDW
V
V
R
+
−
−
=
−
−
,
(1)
where V
it
is the account value at the end of month t, NDW
it
is the net of deposits and withdrawals
during month t, and D
it
are the deposits made during month t.
Gross performance is obtained by adding back transaction costs incurred during month t, TC
it
, to
end-of-the-month account value,
)
(
)
(
1
1
it
it
it
it
it
it
gross
it
D
V
TC
NDW
V
V
R
+
+
−
−
=
−
−
.
(2)
3.5 Attributing Investor Performance
To obtain investors’ abnormal performance, we attribute their returns to different risk and style factors
using the Carhart (1997) four-factor model. This model adjusts investor returns for exposure to market
(RMRF), size (SMB), book-to-market (HML), and momentum (UMD) factors. Following Bauer et al.
(2009), we construct these factors for the Dutch market, as our sample of investors mainly invests in
half of their total portfolio. As a robustness check, we compare the results of investors who only invest through
this particular broker with those who also have another broker, and find no significant differences.
5
HHI* measures HHI relative to a uniform benchmark, thereby facilitating comparisons across portfolios with
different numbers of stocks. The HHI*-benchmark value for a uniformly distributed portfolio is zero.

6
Dutch securities.
6
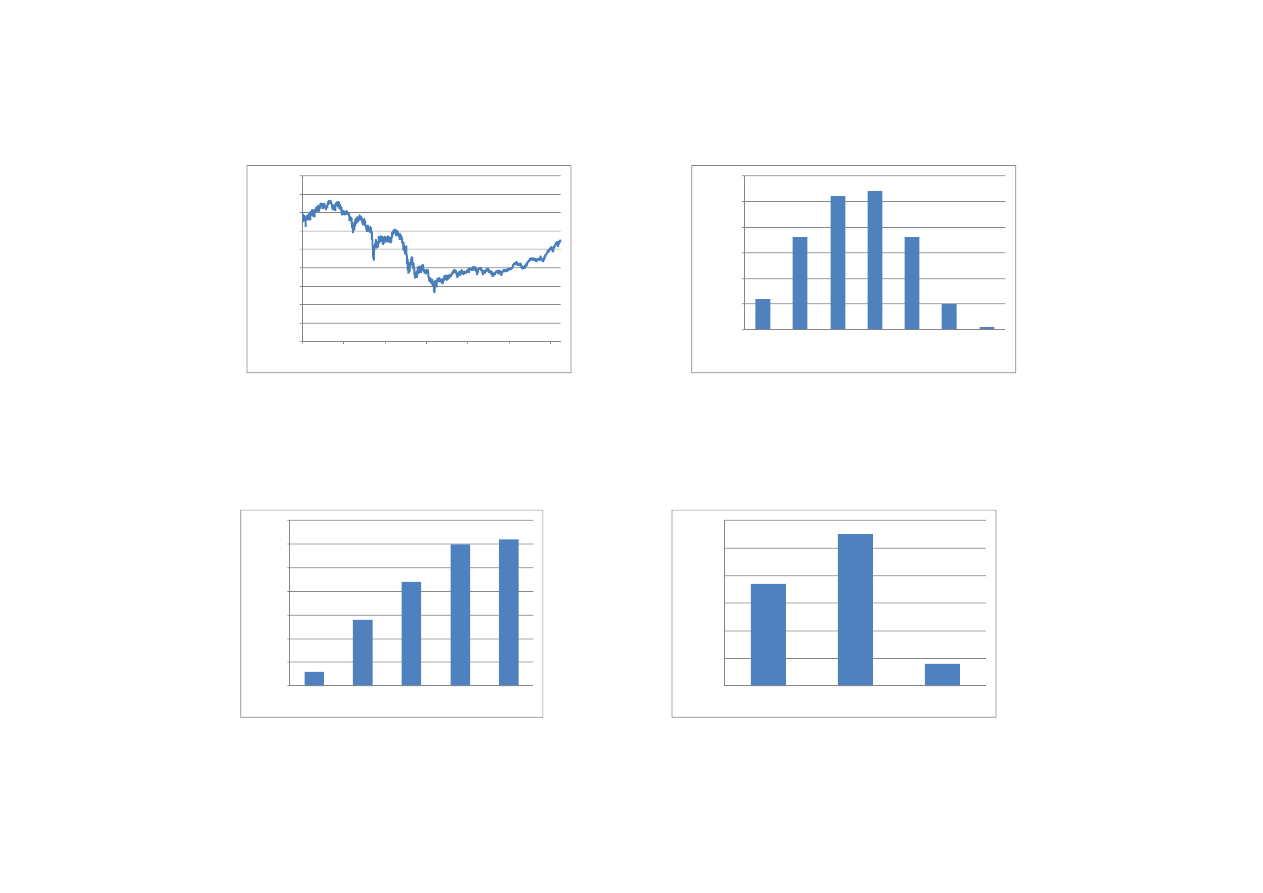
The market return in the RMRF factor is the return on the MSCI Netherlands equity
index. Figure 2 shows the performance of this index over the sample period. On average, the monthly
return on the Dutch market was -0.29% with a standard deviation of 6.73%. All factor-mimicking
portfolios are constructed according to the procedure by Kenneth French.
7
The following time series model is estimated to obtain risk and style adjusted returns:
∑
=
+
+
=
K
k
it
kt
ik
i
it
F
R
1
ε
β
α
.
(3)
In this model R
it
represents the excess return on investor i’s portfolio, β
ik
is the loading of portfolio i
on factor k, and F
kt
is the month t excess return on the k’th factor-mimicking portfolio. The intercept
α
i
measures abnormal performance relative to the risk and style factors. The factor loadings indicate
whether a portfolio is tilted towards market risk or a particular investment style.
[Figure 2 about here]
4. Empirical Results
We begin our empirical investigation by examining the distributions of individual investors’ traits,
such as risk appetite, ambition, and sophistication, their strategies, and their objectives. Next, we
study the interaction among these investors’ traits, the strategies they follow and the objectives they
choose. We then report regression results explaining turnover and return performance using investor
characteristics and traits, strategies, and objectives. Finally, we group investors into different
segments and compare investor traits, turnover, and return performance among these groups.
4.1 Traits, Strategies, and Objectives
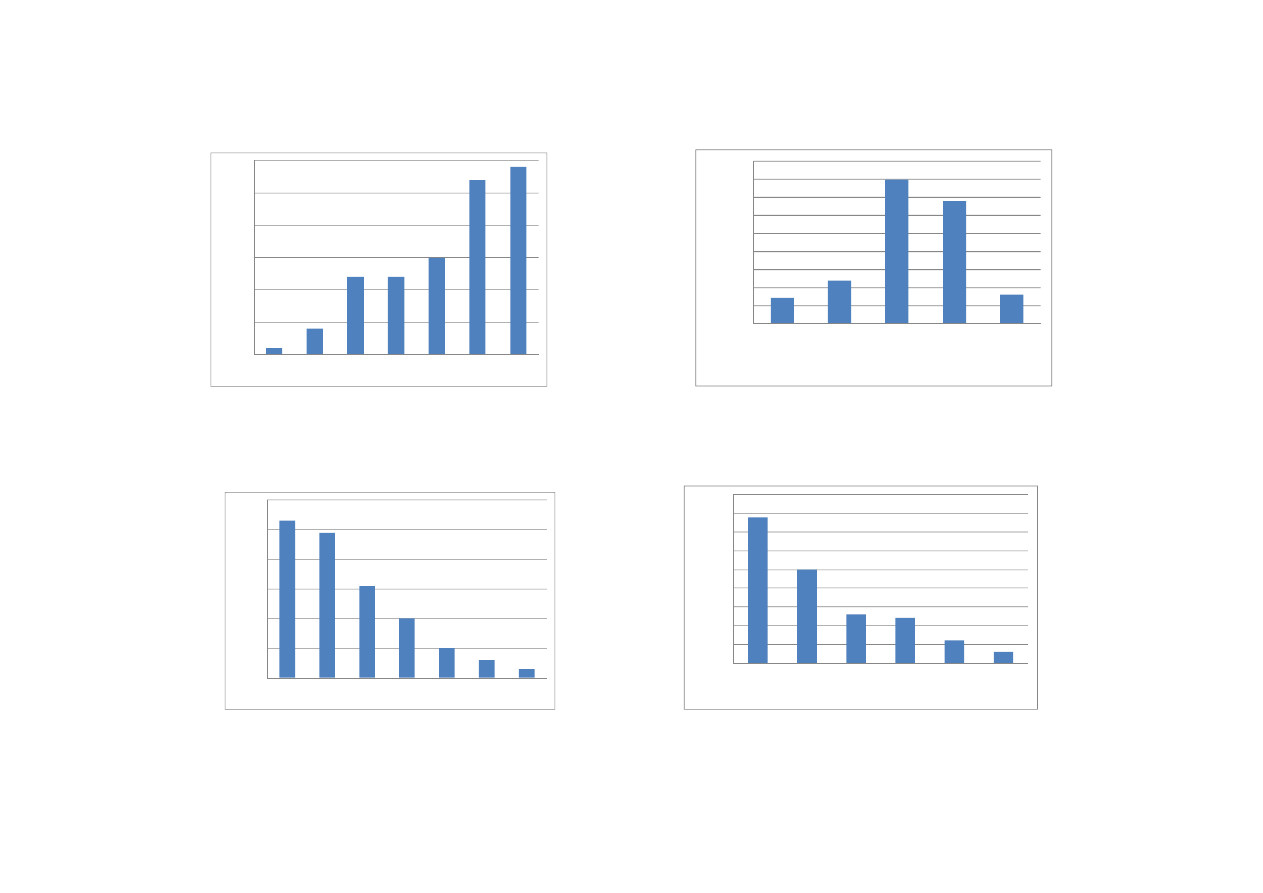
Figure 3 shows the distribution of investor age. Overall, the investors are either middle-aged or older,
while only a small proportion of investors are under 30 years old. Figure 4 depicts investors’ self-
reported investment experience in years. Most investors report to have 5 or more years of investment
experience, while the proportion of inexperienced investors is small. Figure 5 shows the distribution
of investors’ self assessments of sophistication. From this figure it becomes clear that while the
majority of investors in our sample judge themselves to be advanced or very advanced, the most
prevalent group are novices. Figure 6 shows the distribution of investors’ risk appetite along a
continuum from very conservative to very speculative. It is striking to see that most investors classify
themselves as either speculative or even very speculative, while only few investors see themselves as
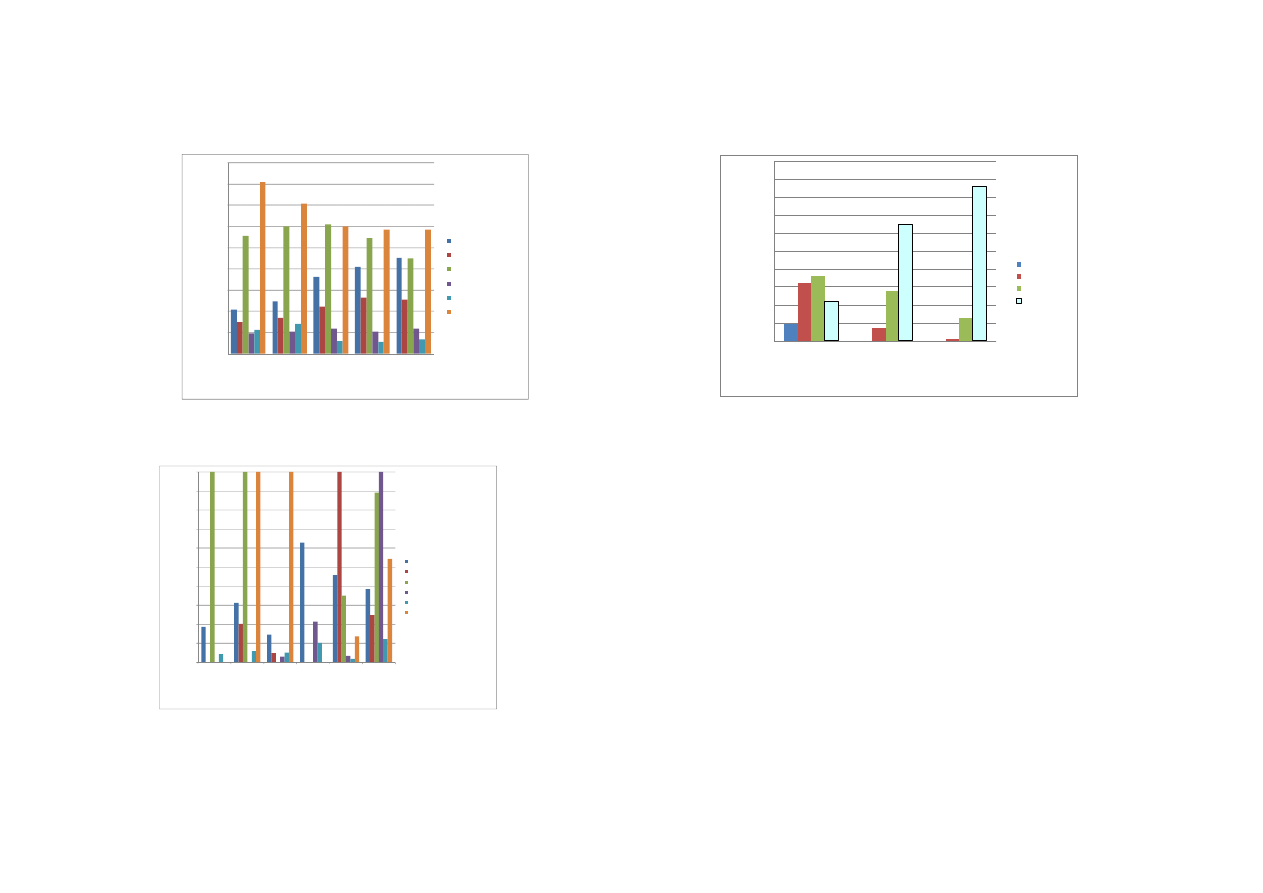
conservative or careful investors. Figure 7 displays the distribution of investors’ ambition level. Most
investors are either moderately or considerably ambitious. Figure 8 displays the strategies that
individual investors use to reach their investment decisions. Investors’ most popular strategy is to use
6
In terms of volume (value) 95% (85%) of all trades are transactions in Dutch securities. Hence, we find that
Dutch versions of the factor-mimicking portfolios lead to a better model fit than do international factors.
7
See http://mba.tuck.dartmouth.edu/pages/faculty/ken.french/data_library.html.

7
their own intuition, followed by financial news, technical analysis, fundamental analysis, professional
advice, and finally, tips from others (e.g., friends or family). Figure 9 depicts the most important
objective investors have regarding their investment account. Although achieving capital growth is the
most important goal, we note that about 38% of our sample invests either as a hobby or to speculate
on short-term stock market developments.
[Figures 3-9 about here]
4.2 Interactions among Traits, Strategies, and Objectives
In this section we investigate the interactions among investor traits, objectives and strategies
by
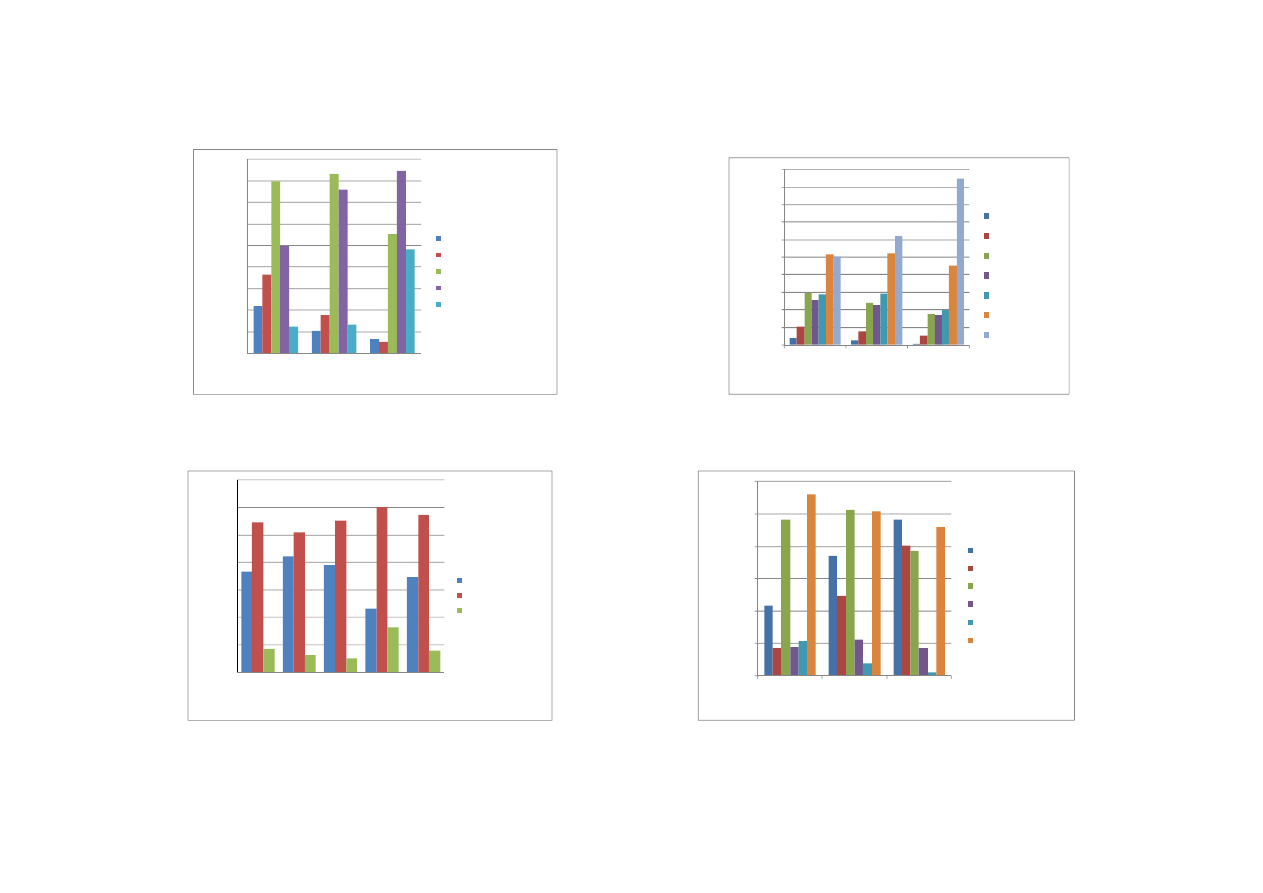
presenting cross-tabulating results. Figure 10 shows that the proportion of very ambitious investors is
higher for more sophisticated investors, while less sophisticated investors are less ambitious. Figure
11 shows that investors who judge themselves to be more sophisticated also have a higher risk
appetite. The high proportion of very advanced investors with a very speculative risk profile is
striking. Figure 12 shows sophistication level for the different objectives. Interesting findings are that
of all different objectives, investors that invest as a hobby have the highest proportion of novices,
while investors whose objective is to speculate have the highest proportion of investors who judge
themselves to be very advanced. Figure 13 shows the strategies that investors of different levels of
sophistication use to make their investment decisions. We find it noteworthy that although advanced
and very advanced investors more frequently use technical and fundamental analysis, while relying
less on tips from others and their intuition, the opposite is true for less sophisticated investors. Finally,
Figure 14 shows that the more ambitious investors become, the less use they make of their own
intuition and tips from others, and the more they use either technical or fundamental analysis.
[Figures 10-14 about here]
4.3 Explaining Investor Turnover: Regression Results
Table 2 first confirms previous findings that more experienced investors (Dorn and Huberman 2005)
and investors with higher past performance (Barber and Odean 2000) trade less frequently, while
investors that have a higher risk appetite (Dorn and Sengmueller 2009) trade more. Our findings add
to the existing literature in several ways. First, we find that investors with higher ambition levels and
investors who hold more concentrated portfolios trade more. Second, while wealthier investors have a
higher turnover of stocks, they actually have a lower turnover of derivatives. This finding suggests
that wealthier investors are more sophisticated and financially savvy, as prior research using similar
data reports that option trading hurts performance (Bauer, Cosemans, and Eichholtz 2009). Third,
adding investors’ objectives and strategies increases the explained variance in turnover and provides
additional insight into the drivers of trading. Both for stocks and derivatives, we find that investors
whose primary objective is speculating trade more. For stocks, we also find that investors whose

8
primary objective is capital growth or to save for retirement have lower turnover. Concerning
strategies, we find that both for stocks and derivatives, investors who use technical analysis trade
more. Investors who report relying on their intuition turn over their stocks more rapidly. Notably, the
use of fundamental analysis and financial news is negatively related to derivative turnover.
[Tables 2-5 about here]
4.4 Explaining Investor Performance: Regression Results
Table 3 (gross returns) first confirms previous findings that portfolio concentration (Goetzmann and
Kumar 2008) and stock turnover (Barber and Odean 2000) hurt performance, while wealthier
investors do better (Dhar and Zhu 2006). In addition we find that investors with more experience
(account tenure) achieve worse returns than investors with less experience, suggesting that experience
may lead to overconfidence (Barber and Odean 2001a; Gervais and Odean 2001). Indeed, we find
some evidence for such overconfidence as investors who report to be “very advanced” have a
significantly shorter account tenure (39 months) than those reporting to be “advanced” (42 months)
while the opposite result would be expected (t(3386) = 2.95, p = 0.003).
8
In addition, as our data is
from an online discount broker, investors with longer account tenure were first to adopt online trading
platforms. Prior research has identified online trading with behavioral phenomena such as self-
attribution bias, and illusions involving knowledge and control, which are known to reduce investors’
return performance (Barber and Odean 2001b; Barber and Odean 2002). In untabulated analyses, we
find that investor’s (online trading) experience is positively related to the standard deviation of their
gross and net returns and negatively related to the Adjusted R-squared of Carhart regressions. This
implies that experienced investors take both more total risk and more idiosyncratic risk. We find that
investors with higher risk appetite achieve higher gross returns. Investors’ objectives do not impact
their returns, but we add to the existing literature by finding that investors who use technical analysis
or professional advice to reach their investment decisions perform worse than those who do not.
Table 4 (net returns) shows a similar picture as Table 3, but makes clear that derivatives turnover
is especially detrimental to investors’ net return performance, although it had no impact on their gross
returns. This finding is in line with recent studies on option trading and individual investor
performance (Bauer, Cosemans, and Eichholtz 2009).
Table 5 (Carhart’s alpha) again shows that more experienced investors and investors with higher
turnover achieve lower returns, while wealthier investors achieve better returns. In addition, we find
that age has a negative impact on investors’ risk- and style adjusted net performance. After adjusting
for risk- and style tilts, investors’ net performance is no longer affected by their strategies.
8
We find a strong relationship between sophistication and self-reported investment experience: more advanced
investors report a longer experience. Interestingly, however, even after 5 years of self-reported investment
experience, there are still a substantial number of investors who consider themselves to be novices (Figure 15).

9
[Figure 15 about here]
4.5 Segmenting Investors
To highlight the associations among investors’ traits, strategies, and objectives in a more formal
manner, we segment the group of 5,500 investors for which we obtained both transaction and survey
data into groups based on their investment objectives and strategies (cf. Bailey, Kumar, and Ng 2010).
While the investors in our sample typically have only one investment objective, they combine
different strategies to attain this objective. Hence, we use univariate sorting to distinguish segments
based on investment objective and cluster analysis to discern segments based on investment strategy.
The univariate sorting results indicate five segments of investors based on their primary
investment objective. These segments are labeled Capital Growth, Hobby, Saving for Retirement,
Speculation
, and Building Financial Buffer.
To group together investors with similar scores on certain (combinations of) strategies, we use a
non-hierarchical cluster analysis following Hair et al. (1998). Using this method, differences between
segments in terms of scoring are maximized and within segments minimized. This procedure leads to
six segments, which we call Financial News, Financial News and Intuition, Intuition, Technical
Analysis Mix
, Fundamental Analysis Mix, and Financial News, Intuition, and Professional Advice.
Figure 16 shows the distribution of strategy usage within these different segments.
Table 6 reports descriptive statistics for these segments in regard to a number of brokerage
account variables, while Table 7 does the same for the survey variables.
[Tables 6 and 7 about here]
[Figure 16 about here]
4.5.1 Profiling Investor Segments based on Investment Objective
Table 6 shows that male investors are especially well represented in the segments Hobby and
Speculation
. The latter segments also contain the youngest investors, whereas those in the segment
Speculation
also trade most heavily during the sample period. Monthly turnover of stocks is highest in
the segment Speculation and lowest in the segment Saving for Retirement. Monthly turnover of
derivatives is highest in the segment Speculation, and lowest in the segment Building Financial
Buffer
. Investors in the segment Capital Growth have the largest portfolio value while Hobby
investors have the smallest. Investors Saving for Retirement are most experienced and best diversified
both in terms of number of stocks and the HHI, while investors in the segment Speculation are least
experienced and less diversified. The profiles of the segments Speculation and Hobby thus obtained,
containing younger male investors who overtrade and underdiversify, are in line with recent findings
on speculative trading as gambling (Kumar 2009) or entertainment (Dorn and Sengmueller 2009).

10
Table 7 demonstrates that investors in the segment Speculation are most ambitious, have the
greatest risk appetite, reports to have the lowest percentage of novice investors, and the highest
percentage of advanced and very advanced investors, respectively. Together with the high turnover
and dominance of males in this segment, these findings confirm and enrich earlier work that finds that
especially male investors are subject to overconfidence and trade excessively (Barber and Odean
2001a). Additionally, these findings confirm the prediction by Statman (2002) that investors who
perceive investing as playing the lottery may have particularly high aspiration levels and be subject to
overconfidence. Not surprisingly, investors in the segment Saving for Retirement have lower ambition
levels, lower risk appetite and are more modest about their self-assessed level of sophistication.
4.5.2 Profiling Investor Segments based on Investment Strategy
Table 6 shows that the fraction of males is highest in the segment Fundamental Analysis Mix and
lowest in the segments Financial News and Financial News, Intuition, and Professional Advice. The
number of trades during the sample period is highest for investors in the segment Fundamental
Analysis Mix
and lowest in the segment Intuition. The previous combination of gender and turnover is
consistent with earlier work by Barber and Odean (2001a) who find that relative to women, men are
overconfident and trade heavily. The combination of using fundamental analysis and excessive
trading is in line with our expectations that especially investors who feel they have more complete
information are likely to make bold forecasts and overcome their status quo bias, leading to less timid
choices in terms of transaction frequency (cf. Kahneman and Lovallo 1993). Average age is highest in
the segment Financial News, Intuition, and Professional Advice and lowest in the segment Intuition.
Monthly turnover of stocks is highest in the segment Financial News and Intuition and lowest in the
segment Technical Analysis Mix. Interestingly, however, the segment Technical Analysis Mix has the
highest turnover of derivatives, while the segment Financial News has the lowest. The segment
Fundamental Analysis Mix
has the highest portfolio value while the segment Intuition has the lowest.
Investors in the segment Financial News are most experienced while those in the segment Technical
Analysis Mix
are least. We find interesting differences between segments with regard to portfolio
diversification. The segment Fundamental Analysis Mix is best diversified, while the segment
Intuition
has the worst diversification. Investors who rely on intuition might have less conviction in
their capabilities than investors employing fundamental analysis, as they have less complete
information, resulting in conservative forecasts.
Table 7 demonstrates that investors in the segment Fundamental Analysis Mix have the highest
ambition level, while investors in other segments, such as Intuition and Financial News have more
modest ambitions. In line with the previous results, investors in the segment Fundamental Analysis
Mix
have the greatest risk appetite, whereas investors in the segment Financial News have the lowest
risk appetite. Finally, whereas the segments Fundamental Analysis Mix and Technical Analysis Mix
have the highest percentage of investors who regard themselves as very advanced, these numbers are

11
considerably lower in the other segments, reaching a minimum in the segment Financial News. The
lower score of the latter category of investors indicates that they may be less likely to be
overconfident about their abilities. Instead of trying to make an independent estimate of a company’s
attractiveness using, for example, fundamental analysis, they rely on widely available financial news.
4.6 Performance per Investor Segment
In this section we compare the raw returns and Carhart alphas of the different segments of investors
(Table 8). We expect important differences between segments due to the previously identified
differences with respect to characteristics obtained from the brokerage account data (e.g., turnover,
age, transaction frequency) as well as traits obtained from our investor survey (e.g., ambition level,
risk appetite). Interestingly, some groups of investors were able to achieve higher returns than the
market during our sample period, both gross and net of fees, although we note that return standard
deviations were all higher than the market standard deviation, with Carhart’s alpha being negative
across all investor segments.
[Table 8 about here]
4.6.1 Segments based on Investment Objectives
Panel A of Table 8 shows that the segment Speculation has the worst raw return (gross), while the
segment Capital Growth does best. The average investor in the segment Speculation loses 0.38% per
month in gross terms, whereas the average investor in the segment Capital Growth gains 0.68%.
The right hand side of Panel A shows that the performance difference between segments of
investors widens when transaction costs are taken into account. The return to the segment Speculation
incurs the most transaction costs, which is plausible considering this segment’s high turnover. The
raw net return of this segment is -2.22% per month, whereas the performance of the segment Capital
Growth
is still positive with 0.22%.
After also adjusting for both risk and style tilts, the segment Capital Growth still achieves the best
performance with a net alpha of -0.40% per month, whereas the segment Speculation remains the
worst performer with a net alpha of -1.28%. The latter result is in line with the traits of this segment’s
investors as obtained both from their brokerage account as well as investor survey data. Investors
whose objective is to speculate have high ambition levels, high risk appetite, high turnover, and judge
themselves to be very advanced. These traits are typical for overconfident investors who overtrade
and underperform (Barber and Odean 2001). In addition, the factor loadings show that these investors
heavily invest in small cap stocks, which may be a risky strategy in combination with their lower level
of diversification. Finally, the standard deviation of returns suggests that investors in the segment
Speculation
take the most risk while those in the segment Capital Growth take the least risk (in terms
of total risk). In addition, the low Adjusted R-squared values of the Carhart four-factor regression

12
suggest that for investors in the segments Hobby and Speculation idiosyncratic and thus
uncompensated risk is largest, while this is smaller for investors in the other segments.
4.6.2 Segments based on Investment Strategy
Panel B of Table 8 shows that the segment Technical Analysis Mix has the worst raw return (gross),
while the segment Financial News and Intuition does best, closely followed by Fundamental Analysis
Mix
. An average investor in the segment Technical Analysis Mix gains only 0.07% per month in gross
terms, whereas an average investor in the segment Financial Analysis and Intuition gains 0.86% and
Fundamental Analysis Mix
0.76%, respectively.
At the right, Panel A shows that, after taking transaction costs into account, the segment Technical
Analysis Mix
achieves the lowest returns and the segment Financial News and Intuition achieves the
highest returns. The raw net return of the segment Technical Analysis Mix becomes negative at
-0.92% per month, while the performance of the segment Financial News and Intuition stays positive
at 0.13%.
This pattern remains the same after adjusting for risk and style tilts, although the difference
between segments narrows. The segment Financial News and Intuition achieves the best performance
with a net alpha of -0.46%, closely followed by the segment Fundamental Analysis Mix, which
obtains a net alpha of -0.47%. The segments Technical Analysis Mix and Financial News, Intuition,
and Professional Advice
are the worst performers, having a net alpha of -0.73% and -0.71% per
month, respectively. The superior performance of the segments Financial News and Intuition and
Fundamental Analysis Mix
is interesting and suggests some stock-picking skills. After all, these
investors’ stock choices must be good enough to overcome the detrimental effect of the relatively high
level of transactions of these segments. The inferior performance of the segment Financial News,
Intuition, and Professional Advice
is remarkable and suggests that the advice of investment
professionals may not be very helpful for the performance of online investors’ portfolios, but is
associated with a relatively high number of transactions and turnover. Finally, the inferior
performance of the segment Technical Analysis Mix illustrates the limited usefulness of past stock
market information for future return performance. In addition, this segment trades heavily in
derivatives, which has been proven to often hurt performance (Bauer, Cosemans, and Eichholtz 2009).
Although the difference in total risk (standard deviation of returns) does not differ significantly
between the segments based on strategy, idiosyncratic risk does differ significantly, as indicated by
the Adjusted R-squared values of the Carhart four-factor regression. The low Adjusted R-squared
values suggest that for the segment Technical Analysis Mix, uncompensated risk is largest.
5. Behavioral Explanations: Underlying Psychology
In keeping with earlier literature on matched survey/trading data, we find strong support for the
importance of four traits in respect to the decisions online investors make about their portfolios and

13
trading activity: overconfidence, competence, entertainment/speculation, and risk appetite. Our
analysis confirms previous findings documenting that these variables are positively related to turnover
and negatively related to performance. Below, we place our results in the context of these traits.
5.1 Overconfidence
There are two versions of overconfidence identified by the behavioral decision literature,
overconfidence about ability and overconfidence about knowledge. Glaser and Weber (2007b) find
that overconfidence about ability is germane to investor behavior, but not overconfidence about
general knowledge. Overconfidence about ability is typically task specific and involves a person
viewing themselves as better at that task than they actually are. It is sometimes referred to as the
“better than average” effect because in surveys about relative ability, more than half of respondents
view themselves as above average, even when average is explicitly defined as the median.
We suggest that degree of self-assessed sophistication reflects overconfidence about ability. Our
analysis provides insights into the interaction of sophistication with investment experience, aspiration
(ambition), risk appetite, objective, and strategy. Notably, online investors viewing themselves as very
advanced are also the most ambitious (Figure 10) and have the highest risk appetites (Figure 11). As
shown by Figure 12, 25% of these investors indicate that their primary objective is speculating,
compared to 14% of all the investors in our sample. In regard to strategies, investors viewing
themselves as very advanced are much more inclined to use technical analysis and fundamental
analysis, and less inclined to rely on intuition than investors viewing themselves as novices or
advanced (Figure 13). As for experience, novice investors are quite varied in their self-reported
investment experience, very advanced investors are almost exclusively dominated by investors with
more than five years of experience, while advanced investors lie somewhere in between (Figure 15).
Notably, the results we report in section 4.4 suggest that investment experience might capture an
aspect of overconfidence not fully accounted for by sophistication.
5.2 Self Perceptions of Competence
Perceived competence reflects the degree to which investors view themselves as being knowledgeable
or familiar with the securities in their portfolios. In
this
regard,
competence
is
effectively
overconfidence about knowledge, reflecting familiarity bias. See Slovic and Corrigan (1973) who
study how amount of racing sheet information impacts the confidence and accuracy of horse race
handicappers.
As a concept, competence is one facet of the notion “bold forecasts, timid choices” introduced by
Kahneman and Lovallo (1993). This concept combines two conflicting features that have been
identified in the behavioral literature. The first feature pertains to biases such as excessive optimism,
overconfidence, and familiarity which predispose a decision maker to make bold forecasts. The
second feature pertains to regret avoidance, hindsight bias, ambiguity aversion, and loss aversion

14
which predispose a decision maker to maintain the status quo. Individuals whose behavior exhibits
both features are said to produce bold forecasts but make timid choices.
We suggest that strategy combinations capture familiarity bias, largely through their dependence
on financial news in combination with other choices. For example, we hypothesize that investors who
rely on financial news alone will feel more competent than investors who rely on intuition alone.
Similar reasoning leads us to suggest that investors who combine financial news and intuition will feel
more competent than investors who rely on financial news alone. Likewise, investors who combine
financial news, intuition, and professional advice will feel more competent than investors who only
combine financial news and intuition.
Graham et al. (2009) hypothesize a positive relationship between competence and trading volume.
This hypothesis would lead us to expect that for the four strategy segments discussed in the previous
paragraph, total turnover would be ranked highest for Financial News, Intuition, and Professional
Advice
, second highest for Financial News and Intuition, second lowest for Financial News alone, and
lowest for Intuition alone. We find that this is true with one exception. The one exception is that
turnover for the strategy segment Intuition is slightly greater than turnover for the segment Financial
News
. Interestingly, no investors in the segment Intuition rely on financial news, and vice versa.
We believe it is reasonable to suggest that investors using either technical analysis, fundamental
analysis, or both are more inclined to judge themselves as being more competent than other investors.
This is because the use of these techniques requires some level of familiarity with specific (company)
details, such as price histories, financial ratios, etc. In this regard, 35% of investors in the strategy
segment Fundamental Analysis Mix report relying on financial news, much lower than any of the
three segments with a strong association to financial news. If financial news were the only basis for
competence, this feature would predict that turnover would be lower for the segment Fundamental
Analysis Mix
than any of the financial news segments. Indeed, the segment Fundamental Analysis Mix
features more turnover than the segment associated with Financial News only. We view this as
evidence that using fundamental analysis is positively related to (perceived) competence.
There is reason to believe that professional advice (from brokers) contributes to competence in a
major way. The two segments most associated with professional advice are (1) Financial News,
Professional Advice, and Intuition
, and (2) Technical Analysis Mix. Every investor in the former
segment, and 21% of investors in the latter segment, use professional advice. These two segments
feature the most and second most total turnover.
The bold forecasts, timid choices perspective suggests that investors who view themselves as
more competent will hold more securities than investors who view themselves as less confident. As
can be seen from Table 6, this is a feature of our data. Notably, investors in the segment intuition hold
the least number of securities in their portfolios, whereas investors in the segment fundamental
analysis mix hold the most securities. This property is mirrored by HHI*. As noted by Goetzmann and
Kumar (2008), investors who increase the number of securities in their portfolio do not necessarily

15
become more diversified because of the tendency to add new securities that are similar to securities
already in the portfolio. This feature is consistent with familiarity bias, a point made by Graham et al.
(2009). As we discuss in section 5.4 below, idiosyncratic risk can be measured by Adjusted R-squared
in Table 8, and is highly pertinent to degree of diversification.
From a behavioral perspective, intuition corresponds to psychological concepts such as
representativeness and the affect heuristic. Representativeness refers to overreliance on stereotypes.
An example of an intuitive rule which reflects representativeness is “good stocks are stocks of good
companies.” See Solt and Statman (1989). The affect heuristic stipulates that in their memories,
people associate degrees of goodness (affect labels) to objects. Doing so provides the basis for snap
decisions, when it is too costly to take the time to analyze alternatives. An example of a rule reflecting
the affect heuristic is “buy stocks of companies whose names you both recognize and have made
strong positive associations with in your mind.” See Statman (2010) for a discussion of the affect
heuristic.
Shefrin and Statman (1995) find that reliance on the heuristic “good stocks are stocks of good
companies” associate good stocks with large companies and low book-to-market equity. In this
regard, Table 8 shows that investors belonging to the segment Intuition have the highest loading for
the size factor SMB (0.67) and the lowest loading for the book-to-market equity factor HML (0.21).
An interesting difference between the segment Intuition and the segment Technical Analysis Mix
concerns views about momentum. In Table 8, the loading on the momentum factor UMD for the
segment Intuition is -0.06, whereas for the segment Technical Analysis Mix the loading is 0.02. This
suggests that investors in the segment Intuition exhibit the behavioral bias gambler’s fallacy in that
they predict unwarranted return reversals, whereas investors in the segment Technical Analysis Mix
follow the technical maxim “the trend is your friend,” and predict momentum. The most important
difference between the compositions of these two segments is that all investors in the segment
Intuition
rely on their own intuition, although 15% also report using technical analysis. However, in
the segment Technical Analysis Mix, 63% use technical analysis, but none rely on their intuition.
5.3 Entertainment, Speculation, and Other Objectives
Our study supports the finding by Dorn and Sengmueller (2009) that investors who report enjoying
investing or gambling turn their portfolios over at roughly twice the rate of their peers (Table 6). In
this regard, we identify the objective “hobby” with “entertainment” and “speculating” with
“gambling.” Notably, speculating and hobby respectively have the highest and second highest rates of
total turnover for all objectives. Our study adds to the literature by distinguishing between speculating
and hobby, and by focusing on the properties associated with other objectives.
We view speculating as being especially associated with lottery-like returns, which is to say return
distributions that feature positive skewness. In contrast, we suggest that those who invest primarily as
a hobby focus on the thrill of picking winners, but attach less importance to positively skewed returns.

16
We do find that investors whose primary objective is speculating differ in interesting respects
from investors whose primary objective is entertainment. Consider the peer group for speculating and
hobby. The findings in Table 6 imply that members of the segment Speculation turn their portfolios
over at 2.6 times the peer group average, whereas for the Hobby segment, the corresponding figure is
considerably lower, at 1.4. Moreover, when it comes to the component of turnover associated with
derivatives, the corresponding ratios are 3.2 for Speculation and 1.5 for Hobby. These ratios support
the contention that speculators seek positively skewed returns more than other investors.
The sophistication profiles for the segments Speculation and Hobby are dramatically different.
The most prevalent investors in the speculating group rate themselves as very advanced, whereas the
most prevalent investors in the hobby group rate themselves as novices. The two groups also differ
dramatically when it comes to ambition. The most prevalent investors in the speculating group are
associated with the highest level of ambition, whereas for the hobby group, the most prevalent
investors are associated with the lowest level of ambition. Where the two groups do feature agreement
is risk appetite and diversification. The most prevalent investors in both groups feature the highest
risk appetite and the lowest number of stocks held. Notably, the hobby group holds the least number
of securities and has the highest value for HHI* (Table 6). While it might seem surprising that the
hobby group is less diversified than the speculating group, bear in mind that competence might be
playing a role here. The hobby group is less prevalent in segments where investors rely heavily on
technical analysis and fundamental analysis than the speculating group. In addition, the hobby group
is dominated by investors who view themselves as novices whereas the speculating group is
dominated by investors who view themselves as very advanced.
About 38% of our sample identify speculating and hobby as their primary objectives. When we
examine the other objectives, we find that the relationship between objectives and strategies is weak
in the sense that investors within the different objective groups choose strategies in similar ways. This
is not to say that there are no differences, only that the differences are not stark. For example,
investors in the speculating group lean to technical analysis more than do other groups. Investors in
the capital growth group lean to fundamental analysis more than do other groups. Investors in the
financial buffer group lean more both to financial news and own intuition than other groups.
Recall that capital growth, not speculation or hobby, is the most prevalent investor objective,
being associated with a little less than 40% of the investors in our sample. Capital growth is certainly
different from saving for retirement or building a financial buffer, in that precautionary saving and
retirement saving correspond to more specific goals. Yet, investors in this group earn the highest
returns, both gross and net, and surprisingly experience the lowest return standard deviations. This is
the case even though they are the worst diversified (as measured by HHI*) (Tables 6 and 7). Notably,
they turn their portfolios over much less than hobbyists and speculators, about the same as those
building a financial buffer, but considerably more than investors primarily saving for retirement.

17
What then distinguishes the capital growth group? In terms of psychological traits, the capital
growth group is more ambitious than investors building a financial buffer and saving for retirement,
but with a lower risk appetite. As we shall see next, risk appetite is particularly significant in this
regard, and is the dominant feature differentiating capital growth investors from the other two groups.
5.4 Risk Appetite and Aspiration
We find that differences in risk appetite impact both investor behavior and returns. The findings
reported in Tables 3 and 4 lead us to suggest that risk appetite is positively related to gross returns, but
not statistically significant to net returns. In this section, we provide a perspective suggesting that the
impact of risk appetite across objectives is negative. Our analysis suggests that at best, investors earn
no compensation for risk-bearing. We also suggest that other investor traits are equally important
drivers of investor behavior.
Our measure of risk appetite reflects a mixture of the traditional concept of risk aversion and the
behavioral concept of loss aversion (see Figure 1). We find that investors with different objectives do
differ significantly in their risk appetites. From lowest to highest, risk appetite ranks the segments
according to objectives as follows: Saving for Retirement, Building Financial Buffer, Capital Growth,
Hobby,
and Speculation. Viewed through the lens of objectives, realized risk is positively related to
risk appetite. That is, objectives associated with low risk appetites tend to experience lower return
standard deviations than investors with higher risk appetites (Tables 7 and 8). The results in Table 8
indicate that when viewed through the lens of objective, the relationship between risk and return is
negative, in the sense that the investors who earn the largest returns bear the least risk, as measured by
the return standard deviation of their portfolios. This statement holds true for both gross and net
returns. A simple OLS regression of net return on return standard deviation features a slope
coefficient of -0.3 (t = -7.0). For gross returns, the coefficient is -0.67 (t = -8.0).
Interestingly, the Capital Growth group appears to bear the least idiosyncratic risk (as measured
by Adjusted R-squared). Recall from Figure 9 that this group is not only the most common primary
objective, but comprises almost 40% of the sample. Notably, investors whose primary goal is
Speculation
bear the highest risk and earn the lowest returns. This finding is consistent with the notion
that speculators might be risk seeking and extends Dorn and Sengmueller (2009) by showing that
speculators might be willing to pay a premium to take risk, rather than shed risk. An alternative
explanation is, of course, that speculators are not risk seeking but instead make serious errors when
judging risk and/or expected return.
From lowest to highest, risk appetite ranks the segments according to strategies as follows:
Financial News, Financial News and Intuition, Financial News, Intuition, and Professional Advice,
Technical Analysis Mix, Intuition,
and Fundamental Analysis Mix. Regressing returns of the various
strategy segments against their respective standard deviation produces positive coefficients which are
statistically insignificant. Investors in the segment Technical Analysis Mix earn the lowest returns, but

18
they also bear the second lowest risk. On the other side of the coin, investors in the segment Intuition
bear the most risk, and earn the third lowest returns.
We note that the relationship between ambition and strategy selection is stronger than the
relationship between risk appetite and strategy selection. Interestingly, the use of fundamental
analysis and technical analysis increases with ambition, whereas intuition decreases (Figure 14).
6. Summary and Conclusions
Using recent matched survey/trading data of a large sample of individual online investors we analyze
how systematic differences in investors’ psychological profiles in terms of their traits, objectives, and
strategies impact their portfolios and returns. Our results extend the literature on the impact of
overconfidence, competence, entertainment/gambling, and risk appetite on individual investor
behavior. Below we highlight our findings, beginning with the impact of objectives on performance.
Investors whose primary objective is speculation earn considerably lower returns and bear much
more risk than investors with other objectives. Notably, capital growth is the most prominent investor
objective, followed by entertainment (hobby), and speculating.
The strategies investors employ reflect their sophistication and experience more than their
objectives. Our data indicate that online investors rely on their own intuition more frequently than any
other strategy. Our findings suggest that the addition of financial news and professional advice to
intuition leads to portfolios featuring more securities and greater turnover. Interestingly, investors
who combine intuition and financial news earn higher returns and incur higher risk than investors who
rely on intuition alone.
Reliance on intuition declines with sophistication, while the use of technical analysis and
fundamental analysis increase with sophistication. Our results indicate that technical analysis is
negatively associated with returns, even before accounting for transaction costs. In contrast,
fundamental analysis is positively associated with returns on both a gross and net basis, and with the
number of stocks held.
Investor traits and behavioral phenomena independently impact portfolio turnover, performance,
and risk. Turnover is positively related to risk appetite and ambition, and negatively related to
experience. Gross return is positively related to risk appetite, but negatively related to experience.
Portfolio return standard deviation is positively related to risk appetite, ambition, and experience. Our
findings are consistent with the notion that overconfidence effects are manifest within length of
investment experience and choice of strategies, especially technical analysis. We also suggest that
perceived competence reflects familiarity bias, and is manifest in the degree to which investors rely
on financial news, advice from brokers, and use fundamental analysis. Finally, whereas the literature
combines entertainment and gambling as objectives, we find that the psychological profiles of
speculators and hobbyists are quite different from each other. To their detriment, speculators are much
more ambitious and view themselves as much more sophisticated than hobbyists.

19
References
Bailey, W., A. Kumar, and D. Ng (2010), "Behavioral Biases of Mutual Fund Investors," Journal of
Financial Economics
, Forthcoming.
Barber, B. M. and T. Odean (2000), "Trading is Hazardous to Your Wealth: the Common Stock
Investment Performance of Individual Investors," The Journal of Finance, 55(2), 773-806.
Barber, B. M. and T. Odean (2001a), "Boys Will be Boys: Gender, Overconfidence, and Common
Stock Investment," The Quarterly Journal of Economics, 1 261-92.
Barber, B. M. and T. Odean (2001b), "The Internet and the Investor," Journal of Economic
Perspectives
, 15(1), 41-54.
Barber, B. M. and T. Odean (2002), "Online Investors: Do the Slow Die First?," Review of Financial
Studies
, 15(2), 455-87.
Bauer, R., M. Cosemans, and P. M. A. Eichholtz (2009), "Option Trading and Individual Investor
Performance," Journal of Banking and Finance, 33(4), 731-46.
Carhart, M (1997), "On Persistence in Mutual Fund Performance," The Journal of Finance, 52 57-82.
Dhar, R. and N. Zhu (2006), "Up Close and Personal: Investor Sophistication and the Disposition
Effect," Management Science, 52(5), 726-40.
Dorn, D. and G. Huberman (2005), "Talk and Action: What Individual Investors Say and What They
Do," Review of Finance, 9 437-81.
Dorn, D. and G. Huberman (2009), "Preferred Risk Habitat of Individual Investors," Journal of
Financial Economics
, 97(1), 155-73.
Dorn, D. and P. Sengmueller (2009), "Trading as Entertainment?," Management Science, 55(4), 591-
603.
Gervais, S. and T. Odean (2001), "Learning to be Overconfident," Review of Financial Studies, 14(1),
1-27.
Glaser, M. and M. Weber (2007a), "Overconfidence and Trading Volume," The Geneva Risk and
Insurance Review
, 32(1), 36.
Glaser, M. and M. Weber (2007b), "Why Inexperienced Investors do not Learn: They do not Know
their past Portfolio Performance," Finance Research Letters, 4 203-16.
Goetzmann, W. N. and A. Kumar (2008), "Equity Portfolio Diversification," Review of Finance,
12(3), 433-63.
Graham, J. R., C. R. Harvey, and H. Huang (2009), "Investor Competence, Trading Frequency, and
Home Bias," Management Science, 55(7), 1094-106.
Grinblatt, M. and M. Keloharju (2009), "Sensation Seeking, Overconfidence, and Trading Activity,"
The Journal of Finance
, 64(2), 549-78.
Hair, J. F., R. E. Anderson, R. L. Tatham, and W. C. Black (1998), Multivariate Data Analysis. Upper
Saddle River, New Jersey: Prentice Hall.
Kahneman, D. and D. Lovallo (1993), "Timid Choices and Bold Forecasts: A Cognitive Perspective
on Risk Taking," Management Science, 39(1), 17-31.
Kumar, A. (2009), "Who Gambles in the Stock Market?," The Journal of Finance, 64(4), 1889-933.
Markowitz, H. M. (1952), "The Utility of Wealth," Journal of Political Economy, 60(2), 151-8.
Seru, A., T. Shumway, and N. Stoffman (2010), "Learning by Trading," Review of Financial Studies,
23(2), 705-39.
Shefrin, H. and M. Statman (1995), "Making Sense of Beta, Size, and Book-to-Market," Journal of
Portfolio Management
, 21(2), 26-34.
Shefrin, H. and M. Statman (2000), "Behavioral Portfolio Theory," The Journal of Financial and
Quantitative Analysis
, 35(2), 127-51.
Slovic, P. and B. Corrigan (1973), "Behavioral Problems of Adhering to a Decision Policy," Talk
presented at The Institute for Quantitative Research in Finance, May 1, Napa, CA
.
Solt, M. E. and M. Statman (1989), "Good Companies, Bad Stocks," Journal of Portfolio
Management
, Summer.
Statman, M. (2002), "Lottery Players / Stock Traders," Financial Analysts Journal, 58(1), 14-21.
Statman, M. (2010), "Characteristics, Affect, and Stock Returns," working paper.
Statman, M. (2011), What Investors Really Want: Discover What Drives Investor Behavior and Make
Smarter Financial Decisions
. New York: McGraw-Hill.

20
Figure 1: Variables constructed from survey responses
Variables
Answer categories
Investment Objective
What is your most important investment objective with
the investment portfolio at this brokerage firm?
1 – Capital growth: achieve a higher expected
return than on a savings account
2 – Hobby: interest in stock market
3 – Saving for retirement: being able to stop
working on an earlier age
4 – Speculation: try to profit from short-term
developments on the stock market
5 – Building financial buffer: building a
financial buffer for future expenses
Investment Strategy
Which strategies do you use as a basis for your
investment decisions (multiple answers possible)?
1 – Financial news: I base my investment
decisions on financial news
2 – Intuition: I base my investment decisions on
my personal intuition
3 – Technical analysis: I base my investment
decisions on technical analysis
4 – Fundamental analysis: I base my investment
decisions on fundamental analysis
5 – Professional advice: I base my investment
decisions on the professional advice from an
investment advisor
6 – Tips from others: I base my investment
decisions on tips from others such as friends or
family.
7 – Other
Ambition Level
How ambitious do you consider yourself to be?
1 – I am not ambitious
2 – I am a bit ambitious
3 – I am moderately ambitious
4 – I am quite ambitious
5 – I am very ambitious
Risk Appetite
Investors answer a set of questions, measuring their
sensitivity for losses, time horizon, and subjective
probabilities of chance events. This leads to a risk
profile categorization between 1 and 7.
1 – Very Conservative
2 – Conservative
3 – Defensive
4 – Careful
5 – Offensive
6 – Speculative
7 – Very speculative
Investor Sophistication
What kind of investor do you consider yourself to be?
1 – A novice investor
2 – An advanced investor
3 – A very advanced investor
21
Figure 2: MSCI Netherlands January 2000 – March 2006
Figure 3: Investor age
0
200
400
600
800
1000
1200
1400
1600
1800
Jan-00
Jan-01
Jan-02
Jan-03
Jan-04
Jan-05
Jan-06
M
S
C
I
N
e
th
e
rl
a
n
d
s
In
d
e
x
0%
5%
10%
15%
20%
25%
30%
18-29
years
30-39
years
40-49
years
50-59
years
60-69
years
70-79
years
80-89
years
P
e
rc
e
n
t
Figure 4: Investor experience
Figure 5: Investor sophistication
0%
5%
10%
15%
20%
25%
30%
35%
0 - 1 year
1 - 3 years
3 - 5 years
5 - 10 years
> 10 years
P
e
r
c
e
n
t
0%
10%
20%
30%
40%
50%
60%
novice investor
advanced investor
very advanced investor
P
e
rc
e
n
t
22
Figure 6: Investor risk appetite
Figure 7: Investor ambition level
0%
5%
10%
15%
20%
25%
30%
very
conservative
conservative
defensive
careful
offensive
speculative
very
speculative
P
e
rc
e
n
t
0%
5%
10%
15%
20%
25%
30%
35%
40%
45%
I am not
ambitious
I am a little
bit ambitious
I am
moderately
ambitious
I am
considerably
ambitious
I am very
ambitious
P
e
rc
e
n
t
Figure 8: Investor strategies
Figure 9: Investor objectives
0%
10%
20%
30%
40%
50%
60%
own intuition
financial
news
technical
analysis
fundamental
analysis
professional
advice
tips from
others
other
P
e
rc
e
n
t
0%
5%
10%
15%
20%
25%
30%
35%
40%
45%
capital
growth
hobby
speculating
building
financial
buffer
saving for
retirement
no goal
P
e
rc
e
n
t
Note: as investors could select more than one strategy the columns add up to more than 100%.
23
Figure 10: Investor ambition levels for sophistication levels
Figure 11: Investor risk appetite for sophistication levels
0%
5%
10%
15%
20%
25%
30%
35%
40%
45%
novice investor
advanced
investor
very advanced
investor
P
e
rc
e
n
t
I am not ambitious
I am a little bit ambitious
I am moderately ambitious
I am considerably ambitious
I am very ambitious
0%
5%
10%
15%
20%
25%
30%
35%
40%
45%
50%
novice investor
advanced
investor
very advanced
investor
P
e
rc
e
n
t
very conservative
conservative
defensive
careful
offensive
speculative
very speculative
Figure 12: Investor sophistication level per objective
Figure 13: Investor strategies per sophistication level
0%
10%
20%
30%
40%
50%
60%
70%
saving for
retirement
hobby
building
financial
buffer
speculating
capital
growth
P
e
rc
e
n
t
novice investor
advanced investor
very advanced investor
0%
10%
20%
30%
40%
50%
60%
novice investor
advanced
investor
very advanced
investor
P
e
rc
e
n
t
technical analysis
fundamental analysis
financial news
professonal advice
tips from others
intuition
Note: as investors could select more than one strategy the columns add up to more than 100% per level of sophistication.
24
Figure 14: Investor strategies conditional on ambition level
Figure 15: Investor experience conditional on sophistication level
0%
5%
10%
15%
20%
25%
30%
35%
40%
45%
I am not
ambitious
I am a little
bit
ambitious
I am
moderately
ambitious
I am
considerably
ambitious
I am very
ambitious
P
e
rc
e
n
t
technical analysis
fundamental analysis
financial news
professional advicer
tips fromothers
own intuition
0%
10%
20%
30%
40%
50%
60%
70%
80%
90%
100%
novice investor
advanced investor
very advanced
investor
Sophistication
P
e
rc
e
n
t
0 - 1 years
1 - 3 years
3 - 5 years
5 - 10 years
Figure 16: Investor strategies distribution over segments
0%
10%
20%
30%
40%
50%
60%
70%
80%
90%
100%
financial
news
financal news
and intuition
intuition
technical
analysis mix
fundamental
analysis mix
financial
news,
intuition, and
professional
advice
P
e
rc
e
n
t
technical analysis
fundamental analysis
financial news
advice from a professional adviser
tips from others
own intuition
Note: this table shows the strategy usage of investors within segments. For example, within the segment
Technical Analysis Mix
, the dominant strategy is technical analysis, while fundamental analysis is also used,
though to a substantially lesser extent, and tips from others even less.

25
Table 1: Descriptive statistics
This table presents descriptive statistics for a sample of 65,325 investor accounts at a Dutch online broker. We
split the sample into 5,500 investors who participated in our investor survey and 59,825 who did not. The
sample period is from January 2000 to March 2006. The variables are defined as follows: Gender refers to the
fraction of accounts hold by a male investor only. Age in 2006 is the age in years of the main account holder.
Trades is the total number of stock trades per account during the sample period. Turnover stocks is the average
of the value of all stock purchases and sales in a given month divided by the beginning-of-the-month account
value. Turnover derivatives is the average of the value of all options purchases and sales in a given month
divided by the beginning-of-the-month account value. Portfolio value is the average market value of all assets in
the investor’s portfolio. Experience is the number of months an investor has been trading. Number of stocks
held refers to the number of different stocks an investor has in portfolio at the end of the sample period. HHI
refers to the Herfindahl-Hirschmann Index value for an investors’ portfolio at the end of the sample period (the
HHI is defined as the sum of the squared portfolio weights of all assets. For the purpose of the HHI calculations,
mutual funds are assumed to consist of 100 equally-weighted, non-overlapping, positions). HHI* refers to the
normalized index: (H – (1/N)) / (1 – (1/N)). Comparing HHI with HHI* makes clear how different the value
from the index is from uniform weights. Monthly net returns is the average raw return per month corrected for
transaction costs. Risk appetite refers to the self-reported riskiness of investors’ portfolios (1=very conservative,
7=very speculative). The table shows for each variable the mean, median, and standard deviation, as well as 5
th
,
25
th
, 75
th
, and 95
th
percentile values. If there is a statistically significant difference between attribute means
reported for the two samples (survey respondents and non-respondents), it is noted by asterisks in the mean
columns of the non-respondent sample. The mean comparison tests allow for different variances within the two
groups. ***/**/* indicate that the means are significantly different at the 1%/5%/10% level.
A: 5,500 Respondents of the Investor Survey
Mean
Std. Dev
5th Pctl
25th Pctl Median
75th Pctl 95th Pctl
Gender (male =1)
0.58
Age in 2006 (years)
49.70
12.73
28.00
40.00
50.00
59.00
70.00
Trades (#)
76.45
132.00
1.00
9.00
30.00
83.00
311.00
Turnover stocks (%)
42.40
121.00
0.00
3.89
10.99
31.48
173.05
Turnover derivatives (%)
16.50
79.81
0.00
0.00
3.62
7.52
68.45
Portfolio value (€)
45,915
142,576
1,057
5,321
15,234
42,406
166,840
Experience (months)
40.21
20.91
9.00
22.00
39.00
60.00
72.00
Number of stocks held
6.57
7.39
1.00
2.00
4.00
8.00
20.00
HHI (%)
27.78
23.28
1.10
9.80
21.14
39.73
78.42
HHI* (%)
17.20
21.55
0.16
4.06
9.06
20.74
70.69
Monthly Net Returns
-0.003
0.059
-0.071
-0.010
0.003
0.010
0.041
Risk Appetite (1-7)
5.31
1.61
2.00
4.00
6.00
7.00
7.00
B: 59,825 Non-Respondents of the Investor Survey
Mean
Std. Dev
5th Pctl
25th Pctl Median
75th Pctl 95th Pctl
Gender (male =1)
0.61***
Age in 2006 (years)
45.92*** 12.28
27.00
37.00
45.00
55.00
67.00
Trades (#)
44.41*** 104.00
0.00
2.00
10.00
38.00
210.00
Turnover stocks (%)
33.10*** 189.00
0.00
0.50
4.50
17.26
128.51
Turnover derivatives (%)
14.57
113.68
0.00
0.00
0.00
3.62
63.33
Portfolio value (€)
28,253*** 163,483
542
2,289
7,158
21,703
106,459
Experience (months)
34.21*** 23.02
2.00
13.00
31.00
55.00
72.00
Number of stocks held
6.24***
7.11
1.00
2.00
4.00
8.00
19.00
HHI (%)
35.99*** 20.71
1.00
21.64
36.81
47.29
76.05
HHI* (%)
25.85*** 26.00
0.01
7.63
17.41
32.31
91.09
Monthly Net Returns
-0.02***
0.095
-0.016
-0.023
-0.002
0.010
0.043
Risk Appetite (1-7)
4.83***
1.86
2.00
3.00
5.00
7.00
7.00

26
Table 2: Turnover regression
This table reports cross-sectional regression estimates to explain investors’ turnover of stocks and derivatives, respectively. The variables are defined as follows: Age is the
age in years of the main account holder in 2006. Experience is the number of months an investor has been trading. Mixed account is a dummy variable that takes the value of
1 if an account is hold by a couple of a man and a woman. Male account is a dummy variable that takes the value of 1 if an account is hold by a male only. Female account is
a dummy variable that takes the value of 1 if an account is hold by a female only. Novice/advanced/very advanced are dummy variables that refer to the self-reported
“sophistication” of investors and take the value of 1 if an investor reports to be novice, advanced, or very advanced, respectively. Risk appetite refers to the self-reported
riskiness of investors’ portfolios (1=very conservative, 7=very speculative). Ambition level refers to the self-reported ambition level of an investor (1=not ambitious, 5=very
ambitious). HHI refers to the Herfindahl-Hirschmann Index value for an investors’ portfolio at the end of the sample period (the HHI is defined as the sum of the squared
portfolio weights of all assets. For the purpose of the HHI calculations, mutual funds are assumed to consist of 100 equally-weighted, non-overlapping, positions). Lagged net
returns refers to the average net returns an investor achieved during the sample period. Log portfolio value is the natural log of the average market value of all assets in the
investor’s portfolio. Objectives are dummy variables that take the value of 1 if an investor indicates that a specific objective is her main investment objective. Strategies are
dummy variables that take the value of 1 if an investor indicates to use a specific strategy to reach her investment decisions. A constant term is included. All reported
regression coefficients are standardized coefficients.
Coeff
t-stat
Coeff
t-stat
Coeff
t-stat
Coeff
t-stat
Coeff
t-stat
Coeff
t-stat
age (years)
-0.010
-0.57
-.015
-0.85
-.019
-1.02
0.043
2.38
.043
2.34
.039
2.16
experience (months)
-0.069
-4.16
-.060
-3.66
-.057
-3.46
-0.108
-6.59
-.103
-6.32
-.096
-5.84
mixed account
-0.012
-0.10
-.013
-0.11
-.017
-0.14
0.036
0.31
.029
0.25
.033
0.29
male account
-0.022
-0.19
-.026
-0.22
-.029
-0.24
0.059
0.49
.052
0.43
.056
0.46
female account
-0.033
-0.60
-.031
-0.57
-.030
-0.55
0.023
0.42
.020
0.37
.022
0.40
novice investor
-0.040
-0.33
-.028
-0.23
-.029
-0.24
0.005
0.04
.003
0.02
-.004
-0.03
advanced investor
-0.035
-0.28
-.034
-0.27
-.038
-0.31
0.080
0.64
.071
0.57
.058
0.47
very advanced investor
-0.040
-0.70
-.054
-0.83
-.055
-0.85
0.058
0.89
.050
0.76
.043
0.66
risk appetite
0.060
3.67
.049
2.98
.049
2.96
0.041
2.54
.036
2.20
.036
2.21
ambition level
0.035
2.68
.031
1.83
.028
1.62
0.046
2.73
.042
2.45
.034
2.00
HHI
0.166
9.92
.157
9.44
.156
9.32
0.021
1.28
.018
1.09
.014
0.83
lagged net returns
-0.038
-2.30
-.034
-2.06
-.033
-1.99
-0.160
-9.77
-.157
-9.59
-.148
-9.04
log portfolio value (€)
0.076
4.05
.096
4.99
.097
5.00
-0.062
-3.34
-.056
-2.91
-.052
-2.71
saving for retirement
-.055
-2.14
-.055
-2.14
.030
1.15
.029
1.12
hobby
-.026
-0.68
-.026
-0.69
.048
1.28
.045
1.21
building financial buffer
-.052
-1.69
-.051
-1.67
.021
0.68
.024
0.78
speculating
.067
2.23
.065
2.15
.093
3.09
.089
2.97
capital growth
-.076
-1.77
-.075
-1.76
.039
0.93
.040
0.94
Strategies
technical analysis
.029
1.76
.074
4.48
fundamental analysis
.001
0.04
-.045
-2.72
financial news
.023
1.40
-.043
-2.69
professional advice
-.001
-0.04
.017
1.06
tips from others
-.003
-0.16
-.019
-1.17
intuition
.039
2.42
-.023
-1.43
other
.010
0.61
-.013
-0.79
Adj. R
2
0.038
0.050
0.050
0.052
0.056
0.064
No of Observations
5,500
5,500
5,500
5,500
5,500
5,500
Objectives
Turnover Derivatives
Turnover Derivatives
Turnover Derivatives
Characteristics and Traits
Turnover Stocks
Turnover Stocks
Turnover Stocks
Independent Variables

27
Table 3: Return regressions – gross returns
This table reports cross-sectional regression estimates to explain investors’ gross returns. The variables are
defined as follows: Age is the age in years of the main account holder in 2006. Experience is the number of
months an investor has been trading. Mixed account is a dummy variable that takes the value of 1 if an account
is hold by a couple of a man and a woman. Male account is a dummy variable that takes the value of 1 if an
account is hold by a male only. Female account is a dummy variable that takes the value of 1 if an account is
hold by a female only. Novice/advanced/very advanced are dummy variables that refer to the self-reported
“sophistication” of investors and take the value of 1 if an investor reports to be novice, advanced, or very
advanced, respectively. Risk appetite refers to the self-reported riskiness of investors’ portfolios (1=very
conservative, 7=very speculative). Ambition level refers to the self-reported ambition level of an investor (1=not
ambitious, 5=very ambitious). HHI refers to the Herfindahl-Hirschmann Index value for an investors’ portfolio
at the end of the sample period (the HHI is defined as the sum of the squared portfolio weights of all assets. For
the purpose of the HHI calculations, mutual funds are assumed to consist of 100 equally-weighted, non-
overlapping, positions). Log portfolio value is the natural log of the average market value of all assets in the
investor’s portfolio. Turnover stocks is the average of the value of all stock purchases and sales in a given
month divided by the beginning-of-the-month account value. Turnover derivatives is the average of the value of
all options purchases and sales in a given month divided by the beginning-of-the-month account value.
Objectives are dummy variables that take the value of 1 if an investor indicates that a specific objective is her
main investment objective. Strategies are dummy variables that take the value of 1 if an investor indicates to use
a specific strategy to reach her investment decisions. A constant term is included. All reported regression
coefficients are standardized coefficients.
Coeff
t-stat
Coeff
t-stat
Coeff
t-stat
age (years)
-.009
-0.51
-.009
-0.51
-.007
-0.37
experience (months)
-.206
-12.79
-.207
-12.80
-.212
-13.07
mixed account
-.010
-0.08
-.008
-0.07
-.005
-0.04
male account
-.025
-0.21
-.024
-0.20
-.021
-0.18
female account
.019
0.35
.020
0.36
.020
0.37
novice investor
.164
1.36
.169
1.40
.169
1.40
advanced investor
.120
0.97
.126
1.01
.132
1.06
very advanced investor
.015
0.24
.019
0.29
.022
0.33
risk appetite
.035
2.15
.033
2.05
.032
1.96
ambition level
.001
0.06
.004
0.23
.010
0.60
HHI
-.054
-3.22
-.055
-3.27
-.054
-3.20
log portfolio value (€)
.145
8.01
.153
8.12
.152
8.05
turnover stocks
.042
2.64
.043
2.66
.044
2.73
turnover derivatives
.015
0.93
.016
1.00
.023
1.44
saving for retirement
-.008
-0.33
-.008
-0.33
hobby
.029
0.77
.030
0.80
building financial buffer
.006
0.19
.002
0.07
speculating
-.012
-0.41
-.010
-0.33
capital growth
-.004
-0.10
-.006
-0.15
Strategies
technical analysis
-.053
-3.20
fundamental analysis
.016
1.00
financial news
.013
0.81
professional advice
-.043
-2.73
tips from others
.004
0.26
intuition
.000
0.02
other
.007
0.42
Adj. R
2
0.067
0.067
0.07
No of Observations
5,500
5,500
5,500
Gross Returns
Gross Returns
Gross Returns
Independent Variables
Characteristics and Traits
Objectives

28
Table 4: Return regressions – net returns
This table reports cross-sectional regression estimates to explain investors’ net returns. The variables are defined
as follows: Age is the age in years of the main account holder in 2006. Experience is the number of months an
investor has been trading. Mixed account is a dummy variable that takes the value of 1 if an account is hold by a
couple of a man and a woman. Male account is a dummy variable that takes the value of 1 if an account is hold
by a male only. Female account is a dummy variable that takes the value of 1 if an account is hold by a female
only. Novice/advanced/very advanced are dummy variables that refer to the self-reported “sophistication” of
investors and take the value of 1 if an investor reports to be novice, advanced, or very advanced, respectively.
Risk appetite refers to the self-reported riskiness of investors’ portfolios (1=very conservative, 7=very
speculative). Ambition level refers to the self-reported ambition level of an investor (1=not ambitious, 5=very
ambitious). HHI refers to the Herfindahl-Hirschmann Index value for an investors’ portfolio at the end of the
sample period (the HHI is defined as the sum of the squared portfolio weights of all assets. For the purpose of
the HHI calculations, mutual funds are assumed to consist of 100 equally-weighted, non-overlapping, positions).
Log portfolio value is the natural log of the average market value of all assets in the investor’s portfolio.
Turnover stocks is the average of the value of all stock purchases and sales in a given month divided by the
beginning-of-the-month account value. Turnover derivatives is the average of the value of all options purchases
and sales in a given month divided by the beginning-of-the-month account value. Objectives are dummy
variables that take the value of 1 if an investor indicates that a specific objective is her main investment
objective. Strategies are dummy variables that take the value of 1 if an investor indicates to use a specific
strategy to reach her investment decisions. A constant term is included. All reported regression coefficients are
standardized coefficients.
Coeff
t-stat
Coeff
t-stat
Coeff
t-stat
age (years)
-.012
-0.70
-.012
-0.68
-.009
-0.50
experience (months)
-.159
-10.05
-.161
-10.12
-.166
-10.43
mixed account
-.010
-0.08
-.008
-0.07
-.005
-0.04
male account
-.031
-0.26
-.030
-0.25
-.027
-0.23
female account
.015
0.29
.016
0.30
.016
0.29
novice investor
.170
1.43
.173
1.46
.173
1.46
advanced investor
.105
0.86
.111
0.91
.118
0.96
very advanced investor
.002
0.04
.007
0.11
.011
0.17
risk appetite
.016
1.03
.016
1.00
.015
0.92
ambition level
-.008
-0.46
-.004
-0.25
.003
0.19
HHI
-.062
-3.81
-.063
-3.82
-.061
-3.73
log portfolio value (€)
.210
11.75
.215
11.61
.214
11.53
turnover stocks
-.037
-2.39
-.035
-2.21
-.034
-2.14
turnover derivatives
-.153
-9.79
-.151
-9.62
-.143
-9.07
saving for retirement
-.009
-0.36
-.009
-0.35
hobby
.031
0.83
.032
0.87
building financial buffer
.010
0.35
.007
0.23
speculating
-.024
-0.83
-.022
-0.73
capital growth
.003
0.07
.002
0.04
Strategies
technical analysis
-.059
-3.63
fundamental analysis
.017
1.07
financial news
.014
0.88
professional advice
-.044
-2.85
tips from others
.012
0.75
intuition
.001
0.08
other
.009
0.59
Adj. R
2
0.098
0.099
0.103
No of Observations
5,500
5,500
5,500
Net Returns
Net Returns
Net Returns
Independent Variables
Characteristics and Traits
Objectives

29
Table 5: Return regressions – Carhart’s alpha
This table reports cross-sectional regression estimates to explain investors’ risk- and style adjusted returns
(Carhart’s alpha). The variables are defined as follows: Age is the age in years of the main account holder in
2006. Experience is the number of months an investor has been trading. Mixed account is a dummy variable that
takes the value of 1 if an account is hold by a couple of a man and a woman. Male account is a dummy variable
that takes the value of 1 if an account is hold by a male only. Female account is a dummy variable that takes the
value of 1 if an account is hold by a female only. Novice/advanced/very advanced are dummy variables that
refer to the self-reported “sophistication” of investors and take the value of 1 if an investor reports to be novice,
advanced, or very advanced, respectively. Risk appetite refers to the self-reported riskiness of investors’
portfolios (1=very conservative, 7=very speculative). Ambition level refers to the self-reported ambition level of
an investor (1=not ambitious, 5=very ambitious). HHI refers to the Herfindahl-Hirschmann Index value for an
investors’ portfolio at the end of the sample period (the HHI is defined as the sum of the squared portfolio
weights of all assets. For the purpose of the HHI calculations, mutual funds are assumed to consist of 100
equally-weighted, non-overlapping, positions). Log portfolio value is the natural log of the average market value
of all assets in the investor’s portfolio. Turnover stocks is the average of the value of all stock purchases and
sales in a given month divided by the beginning-of-the-month account value. Turnover derivatives is the
average of the value of all options purchases and sales in a given month divided by the beginning-of-the-month
account value. Objectives are dummy variables that take the value of 1 if an investor indicates that a specific
objective is her main investment objective. Strategies are dummy variables that take the value of 1 if an investor
indicates to use a specific strategy to reach her investment decisions. A constant term is included. All reported
regression coefficients are standardized coefficients.
Coeff
t-stat
Coeff
t-stat
Coeff
t-stat
age (years)
-.060
-2.49
-.059
-2.45
-.059
-2.42
experience (months)
-.075
-3.40
-.074
-3.37
-.075
-3.42
mixed account
-.079
-0.48
-.087
-0.52
-.097
-0.58
male account
-.037
-0.22
-.044
-0.26
-.055
-0.33
female account
-.048
-0.70
-.052
-0.75
-.053
-0.77
novice investor
.034
0.21
.038
0.23
.034
0.21
advanced investor
-.017
-0.10
-.012
-0.07
-.016
-0.10
very advanced investor
.046
0.57
.054
0.67
.047
0.58
risk appetite
.019
0.86
.023
1.06
.022
0.99
ambition level
-.038
-1.68
-.036
-1.57
-.034
-1.50
HHI
-.024
-1.09
-.024
-1.07
-.023
-1.03
log portfolio value (€)
.176
7.15
.173
6.77
.172
6.69
turnover stocks
-.245
-11.08
-.234
-10.50
-.233
-10.46
turnover derivatives
-.295
-13.40
-.293
-13.31
-.287
-12.88
saving for retirement
-.008
-0.22
-.008
-0.22
hobby
.050
0.98
.051
1.00
building financial buffer
.026
0.60
.028
0.66
speculating
-.042
-1.15
-.038
-1.05
capital growth
.064
1.07
.066
1.11
Strategies
technical analysis
-.024
-1.08
fundamental analysis
.026
1.12
financial news
.035
1.58
professional advice
-.030
-1.37
tips from others
-.001
-0.02
intuition
.014
0.61
other
.056
2.57
Adj. R
2
0.204
0.208
0.211
No of Observations
5,500
5,500
5,500
Alpha
Alpha
Alpha
Independent Variables
Characteristics and Traits
Objectives

30
Table 6: Descriptive statistics per investor segment – brokerage account variables
This table presents descriptive statistics for a sample of 5,500 investor accounts at a Dutch online broker regarding a number of variables obtained from their brokerage
account data. We split the sample into 5 (6) segments using univariate sorting (cluster analysis) on investment objective (strategy). N refers to the number of investor
accounts within each segment. The sample period is from January 2000 to March 2006. The variables are defined as follows: Gender refers to the fraction of accounts hold by
a male investor only. Age is the age in years of the main account holder in 2006. Trades is the total number of stock trades per account during the sample period. Turnover
stocks is the average of the value of all stock purchases and sales in a given month divided by the beginning-of-the-month account value. Turnover derivatives is the average
of the value of all options purchases and sales in a given month divided by the beginning-of-the-month account value. Portfolio value is the average market value of all assets
in the investor’s portfolio. Experience is the number of months an investor has been trading. Number of stocks held refers to the number of different stocks an investor has in
portfolio at the end of the sample period. HHI refers to the Herfindahl-Hirschmann Index value for an investors’ portfolio at the end of the sample period (the HHI is defined
as the sum of the squared portfolio weights of all assets. For the purpose of the HHI calculations, mutual funds are assumed to consist of 100 equally-weighted, non-
overlapping, positions). HHI* refers to the normalized index: (H – (1/N)) / (1 – (1/N)). Comparing HHI with HHI* makes clear how different the value from the index is
from uniform weights. The table shows for each variable the mean. We report the p-value of F-tests to detect significance differences between segments, reporting the F-ratio
between brackets. ***/**/* indicate that the means are significantly different between the segments at the 1%/5%/10% level.
Segments based on investment objective
Gender (male=1)
Age in 2006 (years)
Trades (#)
Turnover stocks (%) Turnover derivatives (%)
Portfolio value (€)
Experience (months)
# Stocks held
HHI (%)
HHI* (%)
Capital Growth (N=2422 )
0.56
50.99
79.62
35.61
11.04
62,646
41.88
7.27
25.32
15.66
Hobby (N=1395 )
0.62
47.31
65.20
43.43
18.45
24,139
39.18
5.43
32.25
19.28
Saving for Retirement (N=353 )
0.53
49.85
75.33
26.44
14.28
49,359
43.49
7.57
24.39
15.46
Speculation (N=688 )
0.64
48.61
99.25
78.87
38.49
33,579
34.47
5.63
30.38
17.69
Building Financial Buffer (N=642 )
0.55
50.85
65.13
35.46
10.55
45,915
40.53
6.39
28.82
19.21
P-value of F-test
0.00
0.00
0.00
0.00
0.00
0.00
0.00
0.00
0.00
0.00
(7.68)***
(21.83)***
(9.32)***
(20.03)***
(17.26)***
(18.19)***
(20.15)***
(12.21)***
(15.52)***
(5.63)***
Segments based on investment strategy
Gender (male=1)
Age in 2006 (years)
Trades (#)
Turnover stocks (%) Turnover derivatives (%)
Portfolio value (€)
Experience (months)
# Stocks held
HHI (%)
HHI* (%)
Financial News (N=963 )
0.55
50.64
67.04
44.71
10.66
38,992
41.93
5.69
28.27
17.96
Financial News and Intuition (N=1235 )
0.58
50.44
82.49
46.63
12.30
57,227
39.87
7.39
26.99
16.34
Intuition (N=1442 )
0.59
48.40
59.80
39.89
16.25
31,379
41.06
5.68
30.56
18.69
Technical Analysis Mix (N=878 )
0.58
49.35
79.11
36.20
31.02
39,470
37.34
6.11
26.82
16.39
Fundamental Analysis Mix (N=708 )
0.64
49.45
106.09
43.10
14.04
72,509
41.12
8.05
25.68
15.74
Financial News, Intuition, and Professional Advice (N=274)
0.55
51.05
84.81
46.46
17.23
47,705
38.16
7.81
25.21
16.18
P-value of F-test
0.01
0.00
0.00
0.40
0.00
0.00
0.00
0.00
0.00
0.07
(2.99)**
(5.82)***
(13.76)***
(1.03)
(7.718)***
(10.39)***
(5.98)***
(12.68)***
(4.37)***
(2.02)*

31
Table 7: Descriptive statistics per investor segment – survey variables
This table presents descriptive statistics for a sample of 5,500 investor accounts at a Dutch online broker regarding a number of variables obtained from our investor survey
data. We split the sample into 5 (6) segments using univariate sorting (cluster analysis) on investment objective (strategy). N refers to the number of investor accounts within
each segment. The sample period is from January 2000 to March 2006. The variables are defined as follows: Ambition refers to the self-reported ambition level of an investor
(1=not ambitious, 5=very ambitious). Risk appetite refers to the self-reported riskiness of investors’ portfolios (1=very conservative, 7=very speculative).
Novice/advanced/very advanced investor refers to the self-reported “sophistication” of investors and reports the percentage of investors per segment in each of the three
categories. The table shows for each variable the mean. We report the p-value of F-tests to detect significance differences between segments, reporting the F-ratio between
brackets. ***/**/* indicate that the means are significantly different between the segments at the 1%/5%/10% level.
Segments based on investment objective
Ambition (1-5)
Risk Appetite (1-7) Novice Investor (%)
Advanced Investor (%)
Very Advanced Investor (%)
Capital Growth (N=2422)
3.21
5.15
37.57
54.50
7.31
Hobby (N=1395)
3.16
5.54
44.44
49.17
5.87
Saving for Retirement (N=353)
3.26
4.98
37.39
54.67
7.64
Speculation (N=688 )
3.52
5.80
24.13
59.74
15.84
Building Financial Buffer (N=642)
3.15
5.05
39.88
54.98
4.67
P-value of F-test
0.00
0.00
0.00
0.00
0.00
(17.38)***
(36.99)***
(20.80)***
(5.70)***
(20.08)***
Segments based on investment strategy
Ambition (1-5)
Risk Appetite (1-7) Novice Investor (%)
Advanced Investor (%)
Very Advanced Investor (%)
Financial News (N=963 )
3.10
5.09
46.52
49.12
3.95
Financial News and Intuition (N=1235)
3.30
5.24
35.79
56.60
7.21
Intuition (N=1442 )
3.09
5.43
48.06
46.12
5.48
Technical Analysis Mix (N=878 )
3.31
5.29
34.85
53.99
10.13
Fundamental Analysis Mix (N=708 )
3.43
5.52
15.25
67.80
16.53
Financial News, Intuition, and Professional Advice (N=274 )
3.34
5.27
31.75
62.77
4.74
P-value of F-test
0.00
0.00
0.00
0.00
0.00
(17.35)***
(7.70)***
(54.11)***
(22.70)***
(23.97)***

32
Table 8: Investment performance per investor segment
This table presents monthly investment performance per investment segment from January 2000 until March 2006. We report raw gross returns, raw net returns, and alphas,
return standard deviations, and factor loadings based on net returns. For panel A the numbers 1-5 refer to the following investor segments: 1=Capital growth, 2=Hobby,
3=Saving for retirement, 4=Speculation, 5=Building financial buffer. For panel B the numbers 1-6 refer to the following investor segments: 1=Financial news, 2=Financial
news and intuition, 3=Intuition, 4=Technical Analysis Mix, 5=Fundamental Analysis Mix, 6=Financial news, intuition, and professional advice. We report the p-value of F-
tests to detect significance differences between segments, reporting the F-ratio between brackets. ***/**/* indicate that the means are significantly different between the
segments at the 1%/5%/10% level.
Gross Returns
Net Returns
A: Segments based on investment objective
1
2
3
4
5
P-value of F-test
1
2
3
4
5
P-value of F-test
Raw Return
0.0068
0.0034
0.0065 -0.0038 0.0057
0.00 (5.88)***
0.0022 -0.0064 0.0003 -0.0222 0.0003
0.00 (25.02)***
Alpha (Carhart)
-0.0040 -0.0066 -0.0061 -0.0128 -0.0054
0.00 (13.51)***
Standard Deviation of Returns
0.0760
0.0953
0.0802 0.1105
0.0786
0.00 (27.16)***
0.0757 0.0947 0.0794 0.1099
0.0781
0.00 (27.57)***
Factor Loadings:
RMRF
1.22
1.40
1.19
1.63
1.34
0.00 (19.50)***
SMB
0.57
0.75
0.56
0.86
0.66
0.00 (9.73)***
HML
0.22
0.24
0.21
0.27
0.21
0.48 (0.88)
UMD
-0.03
-0.05
0.01
0.00
-0.05
0.28 (1.28)
Adj. R
2
(%)
64.45
58.65
64.42
56.53
63.12
0.00 (16.46)***
B: Segments based on investment strategy
1
2
3
4
5
6
P-value of F-test
1
2
3
4
5
6
P-value of F-test
Raw Return
0.0041
0.0086
0.0025 0.0007
0.0076
0.0012 0.00 (3.65)***
-0.0027 0.0013 -0.0054 -0.0092 0.0003
-0.0065 0.00 (6.49)***
Alpha (Carhart)
-0.0057 -0.0046 -0.0058 -0.0073 -0.0047 -0.0071 0.00 (4.29)***
Standard Deviation of Returns
0.0850
0.0880
0.0887 0.0813
0.0849
0.0812 0.36 (1.01)
0.0797 0.0810 0.0842 0.0759
0.0784
0.0712 .37 (1.09)
Factor Loadings:
RMRF
1.31
1.32
1.33
1.24
1.30
1.32
0.60 (0.73)
SMB
0.67
0.67
0.67
0.57
0.55
0.70
0.08 (2.00)*
HML
0.26
0.24
0.21
0.20
0.22
0.17
0.19 (1.48)
UMD
0.00
-0.06
-0.06
0.02
-0.01
0.03
0.00 (4.00)***
Adj. R
2
(%)
62.70
63.58
61.92
58.52
63.69
63.61
0.00 (3.95)***
Wyszukiwarka
Podobne podstrony:
Mrs Lincoln s Boston Cook Book What To Do and What Not To Do in Cooking
Bearden Electret What it is and how it works (2005)
Horwich; Why Words Mean What They Do
what do they do, jobs
Teachers use many metaphors to describe what they do
What can they do
what did they do yesterday key
what do they do in their jobs 1
islcollective worksheets elementary a1 preintermediate a2 adult elementary school high school readin
what do they do in their jobs 2
What do they do
What invention do young people find most important
What poems do you like mos1
Can Women Have and Do They Need a Literature of Their Own
Dionne Warwick What To Do
islcollective worksheets beginner prea1 kindergarten reading speaking writ what we do in the house 1
What ll I do Berlin
więcej podobnych podstron