
Eect of a novel physical pretreatment process on the drying kinetics
of seedless grapes
Marisa Di Matteo
*
, Luciano Cinquanta
1
, Gianni Galiero, Silvestro Crescitelli
2
Chemical and Food Engineering Department, Salerno University, Via Ponte Don Melillo, 84064 Fisciano, Italy
Received 26 March 1999; accepted 3 April 2000
Abstract
In this paper an alternative physical method for enhancing the drying rate of seedless grapes is proposed. It consists of the
super®cial abrasion of the grape peel using an inert abrasive material. The eectiveness of this novel process was compared to that of
the traditional ethyl oleate dipping process by analysing not only their respective drying times, but also the peel surfaces by scanning
electron microscopy. Moreover, the drying kinetics of the above two treatments was reconstructed by using a mathematical model in
which the grape pretreatment used was assumed to aect the water diusivity in the grape peel, but not in the grape pulp. Even
though the abrasion method was found to be as eective as the traditional method and gave rise to a darker ®nal product, which is
less attractive to consumers, it would allow grape pretreatment thus avoiding the use of chemical additives, and permit safer raisins
to be produced. Ó 2000 Elsevier Science Ltd. All rights reserved.
Keywords: Grape drying; Abrasion; Dipping; Modelling; Browning
1. Introduction
Grape drying to produce raisins is a very slow process
(King, 1977; Peri & Riva, 1984; Rizvi, 1986; Tutuncu &
Labuza, 1996; Labuza & Hyman, 1998), due to the pe-
culiar structure of grape peel, that is covered by a waxy
layer (Chambers & Possingham, 1963; Aguilera, Op-
permann & Sanchez, 1987; Mahmutoglu, Emõr & Saygi,
1996). Its removal has been so far carried out by using
several chemical pretreatments (Pointing & Mc Bean,
1970; Bolin, Petrucci & Fuller, 1975; Bolin & Staord,
1980; Riva & Peri, 1986; Saravacos & Marousis, 1988).
For example, when grapes are dipped into an alkaline
solution containing, for instance, ethyl oleate, this
component penetrates into the waxy layer and causes
the formation of many small pores. As a consequence,
the drying time of pretreated grapes is up to four times
shorter than the drying time of untreated grapes.
In view of the increasing interest in minimally pro-
cessed food products, the main aim of this work was to
develop an alternative physical pretreatment consisting
of a preliminary abrasion of the grape peel so as to ac-
celerate grape drying to almost the same of that of the
traditional ethyl oleate dipping process. At this point in
time, the feasibility of this process on an industrial scale
was not considered. The aim was to study the eec-
tiveness of the process under laboratory conditions.
2. Materials and methods
Seedless white grapes (var. Nevado), harvested from
Trinitapoli in the Puglia region (Italy) and stored at 5°C
for two days before testing, to simulate long distance
transport conditions usually adopted, were used
throughout all experiments. Table 1 shows the main
chemical and physical parameters of about 100 fresh
grape berries.
The abrasion of the grape peel was carried out in a
shaker the walls of which were covered by coating with
abrasive sheets (USM ± Canada, grit range 60±80) as
reported before (Di Matteo, Donsõ, Ferrari, Cinquanta
& La Notte, 1997). Drying experiments were carried out
in a convection oven at 50°C, with an air speed of 0.5 m/
s, so as to reduce the average moisture of grapes to
about 20% w/w. Before drying, samples of about 50
grape berries were submitted to one of the following
pretreatments (TR):
Journal of Food Engineering 46 (2000) 83±89
www.elsevier.com/locate/jfoodeng
*
Corresponding author.
1
Present address: DI.S.T.A.A.M., Molise University, Via F. De
Sanctis, 86100 Campobasso, Italy.
2
Present address: Chemical Engineering Department, Federico II
University, P.le V. Tecchio, 80125 Napoli, Italy.
0260-8774/00/$ - see front matter Ó 2000 Elsevier Science Ltd. All rights reserved.
PII: S 0 2 6 0 - 8 7 7 4 ( 0 0 ) 0 0 0 7 1 - 6

1. immersion in an aqueous solution at 2% (v/v) ethyl
oleate and 2.5% (v/v) K
2
CO
3
at 40°C for 3 min
(EtOl);
2. abrasion in the shaker for 10 min (Abr);
while untreated samples (UT) were used as reference.
Moisture and reducing sugars content of fresh sam-
ples, as well their acidity expressed as equivalent tartaric
acid (by titration with NaOH solution), were measured
according to AOAC (1989). All measurements were
performed in triplicate.
During and after drying, the colour of the berries was
determined three times on 20 dierent samples by means
of a colorimeter (chroma-meter type CR-200b, Minolta,
Japan) using the Hunter colorimetric system (L, light-
ness; a
, redness; b
, yellowness, as de®ned by Hunter,
1979) and by measuring the absorbance (OD) at 425 nm
(Peri & Riva, 1984) with a spectrophotometer (Varian
DMS 100S).
Before drying, the peel of untreated and pretreated
samples was removed, washed with ethanol and dehy-
drated by means of aqueous solutions at 40±100% (w/w)
acetone. Then, after immersion in liquid nitrogen and
vacuum plating, the peel was examined using a scanning
electron microscope (Stereoscan 90, Cambridge Instru-
ments, UK) to evaluate the eectiveness of the physical
and chemical methods at removing the waxy layer from
the grape surface.
During the drying process, at each time t, in addition
to the water content, the axes of the grapes (considered
as ellipsoids) were measured; from these values it was
possible to compute the equivalent radius, R
i
, as the
radius of the sphere having the same volume of the el-
lipsoid. To take into account the volume reduction of
the grape berries that takes place during the dehydration
process, a staircase function was considered for the
equivalent radius R
i
in the mathematical model de-
scribed in the following paragraphs; the value of each
step of the function was computed as the mean between
the initial and the ®nal equivalent radius of each mea-
suring interval.
3. Results and discussion
At the end of the drying process the original structure
of the berries was maintained independently of the
pretreatment used. The abrasion was quite uniform over
the entire surface of the grapes and did not involve any
loss of juice since not one crack was observed both after
the physical pretreatment and after drying. Moreover,
after abrasion the grapes were rougher and had a slight
tissue softening. The drying curves of pretreated and
control grape berries are shown in Fig. 1. Not only was
the drying time needed to reduce the average moisture of
the grape berries from 84% to 20% w/w at 50°C in the
order of 35 h, but also the pattern of the drying curves
was quite similar for both the chemically and physically
treated samples. This drying time was about one third of
the time required to dry the untreated grape berries.
Notation
B
parameter de®ned by Eq. (5)
c
1
water concentration in the grape pulp (moles/m
3
)
c
2
water concentration in the grape peel (moles/m
3
)
c
3
water vapour concentration in air (moles/m
3
)
k
mass transfer coecient, de®ned by Eq. (8)
D
i
water diusivity in the grape pulp i 1 and peel i 2
(m
2
/h)
h
convective mass transfer coecient (m/h)
H
grape humidity, (%) dry matter
K
1
equilibrium constant, de®ned by the ratio between the
equilibrium concentrations of water in the grape pulp and in
the grape peel
K
2
equilibrium constant, de®ned by the ratio between the
equilibrium concentrations of water in the grape pulp and in
the grape peel
K
3
equilibrium constant, de®ned by the ratio between the
equilibrium concentrations of water in the grape pulp and
vapour in air
L
parameter de®ned by Eq. (12)
N
total test number
r
distance from the grape center (m)
R
1
pulp radius (m)
R
2
overall grape berry radius (m)
t
time (h)
Greek symbols
b
n
nth root of Eq. (13)
d
peel thickness d R
2
ÿ R
1
(m)
Subscripts
0
refers to time t 0
1
refers to grape pulp
2
refers to grape peel
3
refers to air surrounding the grape berry
eq
refers to equilibrium conditions t ! 1
1
refers to air bulk
Superscripts
TR
refers to treated grape berries: abraded (Abr) or dipped
(EtOl)
UT
refers to untreated grape berries
WP
refers to grape berries with no peel
Table 1
Main chemical composition and dimensions of 100 fresh grape berries
of var. Nevado
Moisture (% w/w)
84:0 1:6
Acidity (% w/w)
0:2 0:01
Reducing sugar (% w/w)
14:1 0:4
Average radius of grape
berries (m)
1:1 0:1 10
ÿ2
Average peel thickness
a
(m)
15 0:2 10
ÿ6
a
Measured with scanning electron microscope.
84
M. Di Matteo et al. / Journal of Food Engineering 46 (2000) 83±89
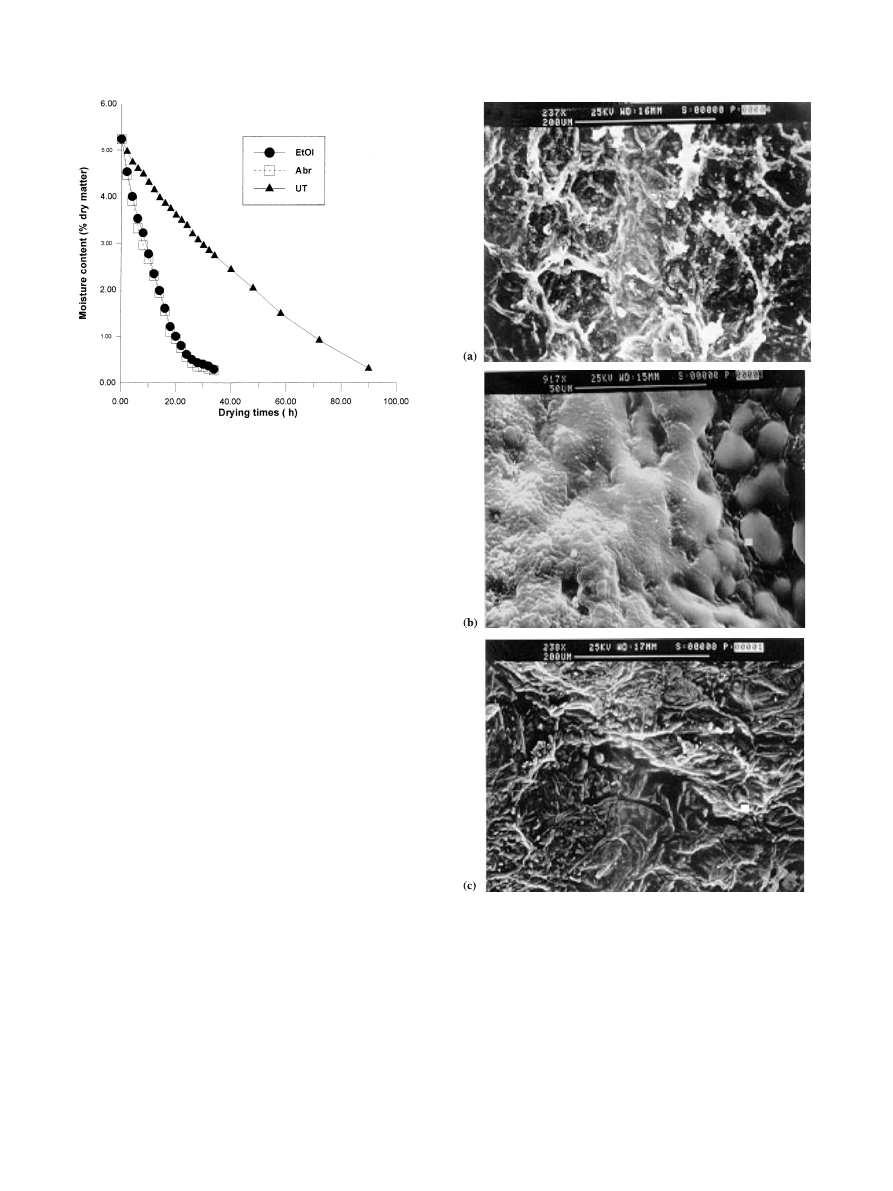
The eect of these methods on the waxy layer re-
moval from the grape peel was analysed by scanning
electron microscopy, as shown in Fig. 2.
In the untreated berries, Fig. 2(a) clearly shows the
waxy network. Fig. 2(b) refers to the peel of a sample
dipped in the ethyl oleate solution. As a result of waxy
solubilization by ethyl oleate, a number of micropores
in the waxy layer was formed, but this was accompa-
nied by a non-uniform redistribution of the waxy
component on the berry surface. Finally, in the peel of
the abraded sample, the waxy layer was almost com-
pletely removed in a quite uniform way (Fig. 2(c)).
The total sugar content, measured on a dry basis, did
not vary after drying and berries showed no sticky
surface.
The quality of grape berries and raisins was assessed
by measuring their colour in terms of the Hunter scale
variables (Table 2). In particular, lightness L and the
yellow chroma component (b
) were in¯uenced by the
pre-treatment used. As a result of drying, the variable L
tended to decrease slightly in all samples, its values being
always greater in pretreated samples than in the un-
treated ones; while the variable b
increased in all pre-
treated grape berries, being greater for the chemically
treated samples. After drying the OD values at 425 nm
were lower in chemically treated samples than in phys-
ically and untreated ones.
Generally, the colour of the abraded grape berries
was darker than that of the chemically treated samples,
which showed a lighter colour more appreciated
by consumers (Grncarevic & Hawker, 1971). Since
browning in white grape berries occurs by enzymatic
and non-enzymatic browning reactions (the former be-
ing due to the polyphenoloxidase mainly located in the
peel, Aguilera et al., 1987), the overall eect of the grape
peel abrasion appeared to be that of enhancing the de-
gree of enzymatic browning.
Fig. 2. Scanning electron micrograph of the peel of a grape berry
untreated (a), or pre-treated by dipping in ethyl oleate (b), or by
abrasion (c).
Fig. 1. Experimental values of humidity (% dry matter) vs drying times
for grape berries the peel of which was untreated (UT) or pre-treated
by dipping into ethyl oleate (EtOl) or by abrasion (Abr).
M. Di Matteo et al. / Journal of Food Engineering 46 (2000) 83±89
85
4. Mathematical model of grape dehydration
In the dehydration process of grape berries by means
of warm air, simultaneous heat and water (liquid and
vapour) transport in the pulp, in the peel (if present) and
in the gaseous ®lm surrounding the grapes, take place.
Since the duration of the thermal transient was generally
found to be far less than the duration of the dehydration
process, mass transport may be regarded as taking place
under isothermal conditions. In other words, the whole
drying process is controlled by mass transport only
(Bird, Stewart & Lightfoot, 1960; Peri & Riva, 1984).
Under the assumptions that pulp and peel (if present)
are uniform and isotropic, and the grape berries are
spherical, the mathematical model of grape dehydration
can be reduced to that of mass diusion from a spherical
body (Bird et al., 1960; Luikov, 1968; Crank, 1975;
Carslaw & Jaeger, 1980).
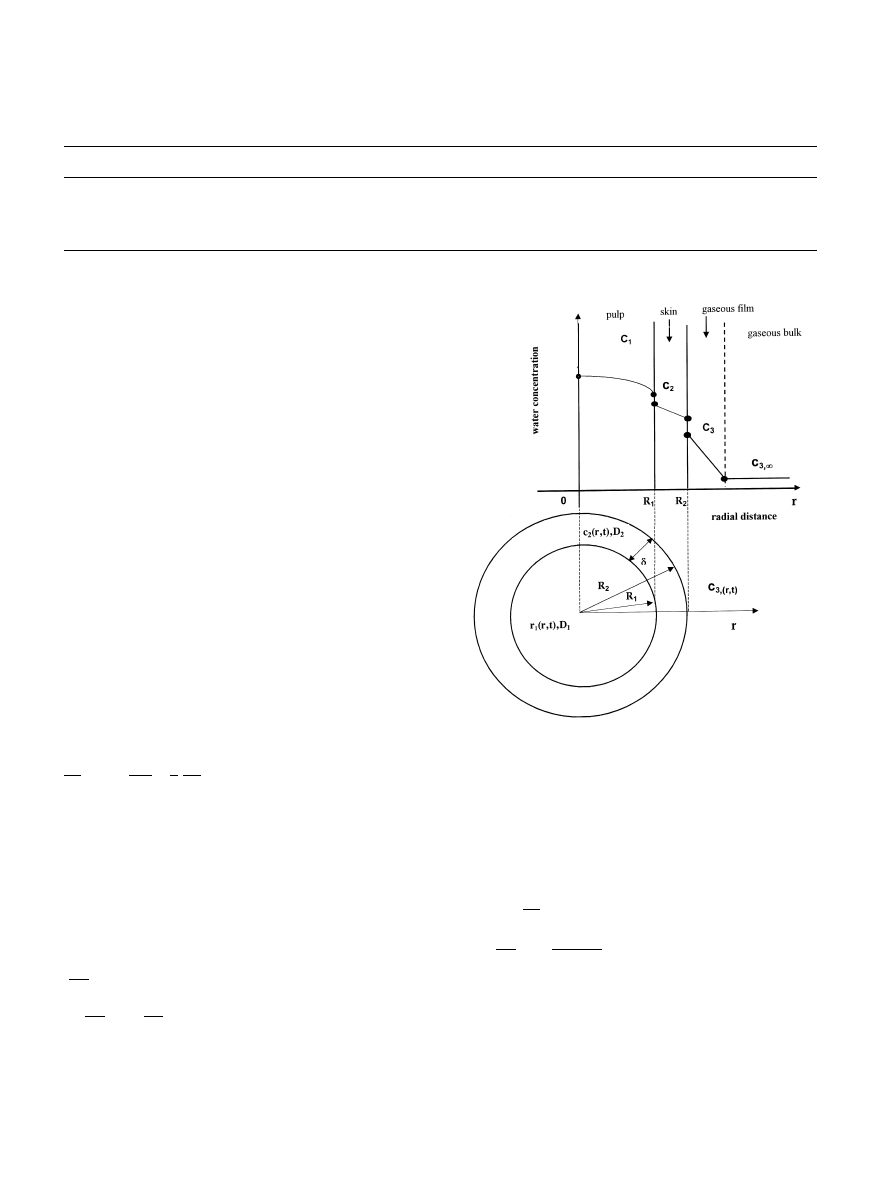
Fig. 3 shows the schematic water concentration pro-
®les in the grape pulp and peel, as well as in the gaseous
®lm surrounding each grape berry.
The mathematical model that describes the diusion
of water through whole grape berries must account for
its diusion both in the pulp and in the peel. Both the
processes, are described by the model:
oc
i
ot
D
i
o
2
c
i
or
2
2
r
oc
i
or
;
1
where the index i 1 refers to the pulp [i.e., for
r 2 0; R
1
] and i 2 to the peel [i.e., for r 2 R
1
; R
2
],
D
1
is the water diusivity in the grape pulp, which is
much higher than that in the grape peel D
2
.
Water concentration within grape pulp can be esti-
mated by solving dierential equation (1) for i 1 with
the following initial and boundary conditions:
c
1
r; 0 c
10
; r 2 0; R
1
; t 0;
oc
1
or
0; r 0; t > 0;
D
1
oc
1
or
D
2
oc
2
or
; r R
1
; t > 0;
c
1
K
1
c
2
; r R
1
; t > 0;
2
where the equilibrium±distribution curve relating water
concentrations in the pulp/peel interface was assumed to
be a linear one, characterised by the equilibrium con-
stant K
1
. Similarly, water concentration within the grape
peel can be obtained by solving Eq. (1) for i 2 with the
following initial and boundary conditions:
c
2
r; 0
c
10
K
1
; r 2 R
1
; R
2
; t 0;
ÿ D
2
oc
2
or
h
c
2
R
2
; t
K
2
ÿ c
31
; r R
2
; t > 0 if h 6 1;
c
2
R
2
; t K
2
c
31
; r R
2
; t > 0 if h ! 1;
3
where the equilibrium±distribution curve relating water
concentrations at peel/outer environment interface was
assumed to be a linear one, characterised by the
equilibrium constant K
2
. Water diusion in the gaseous
Fig. 3. Schematic diagram of water (or steam) concentration pro®les in
the grape pulp and peel, and in the gaseous ®lm surrounding each
grape berry.
Table 2
Colour parameters of grape berries as fresh product or dried after 48 h when using no pretreatment (UT), ethyl oleate dipping (EtOl) or abrasion
(Abr)
Grape berries
Samples pretreatment
L
a
b
OD at 425 nm
Fresh
UT
42:3 7:2
)3.3 0.4
5.6 0.7
0:163 0:02
Dried
UT
37:1 6:5
)3.1 0.3
5.4 0.6
0:528 0:04
Dried
EtOl
41:8 6:8
2.5 0.2
13.8 0.9
0:331 0:02
Dried
Abr
38:2 5:2
2.7 0.2
9.3 0.7
0:493 0:03
86
M. Di Matteo et al. / Journal of Food Engineering 46 (2000) 83±89

®lm around the grape berry was described by means of
the convective mass transfer coecient h (Bird et al.,
1960).
Owing to the thinness of grape (Table 1), it is possible
to neglect water accumulation in the peel, thus consid-
ering a steady-state distribution of c
2
r; t in the peel for
any time. In this case, the second boundary condi-
tion for the diusion in the pulp (if h 6 1) (Eq. (2))
becomes:
ÿD
1
oc
1
or
j
rR
1
B
c
1
R
1
; t
K
1
ÿ c
2eq
;
4
with
B
D
2
d
1
ÿ
D
2
=d
h=K
2
D
2
=d
;
5
c
2eq
K
2
c
31
:
6
For h ! 1, Eq. (4) reduces to
ÿD
1
oc
1
or
j
rR
1
k c
1
R
1
; t ÿ c
1eq
7
with
k
D
2
dK
1
8
and
c
1eq
K
1
K
2
c
31
:
9
In the experiments described here, the gaseous ve-
locity was quite high, thus allowing the resistance to the
mass transport out of the grape to be neglected (i.e.
h ! 1). Under this hypothesis, an analytical solution
(in series) exists (Luikov, 1968; Crank, 1975):
c
1
ÿ c
1eq
c
0
ÿ c
1eq
2LR
2
r
X
1
n1
exp ÿD
1
b
2
n
t=R
2
2
b
2
n
L L ÿ 1
sin b
n
r=R
2
sin b
n
:
10
By integrating Eq. (10) over the whole volume of any
grape berry, it was possible to derive the following time
distribution for its humidity:
H ÿ H
eq
H
0
ÿ H
eq
6L
2
X
1
n1
exp ÿD
1
b
2
n
t=R
2
2
b
2
n
b
2
n
L L ÿ 1
;
11
with
L
R
2
k
D
1
;
12
when b
n
is the nth root of the following trascendental
equation:
b
n
cot b
n
L ÿ 1 0:
13
When any grape berry is peeled, its dehydration
process can be mathematically described by accounting
only for the diusion of water in the grape pulp and
steam in the gaseous ®lm surrounding the grape berry.
The diusion of water in the pulp is described by dif-
ferential equation (1) with i 1 together with the fol-
lowing initial and boundary conditions:
c
1
r; 0 c
10
; r 2 0; R
1
; t 0;
oc
1
or
0; r 0; t > 0;
D
1
oc
1
or
hc
3
R
1
; t ÿ c
31
; r R
1
; t > 0 if h 6 1;
c
1
R
1
; t c
1eq
; r R
1
; t > 0 if h ! 1:
14
Under the assumptions that in each instant there is a
thermodynamic equilibrium at the interface gas/grape
pulp and that this equilibrium is expressed as a linear
law, it follows that
c
3
R
1
; t
c
1
R
1
; t
K
3
if h 6 1;
15
or
c
1eq
K
3
c
31
if h ! 1:
16
Again, since the gaseous velocity was quite high, it is
possible to neglect the resistance to the mass transport
out of the grape (i.e. h ! 1). In these circumstances, an
analytic solution (in series) (Carslaw & Jaeger, 1980) can
be used to estimate water diusion in a spherical peeled
grape berry (Carslaw & Jaeger, 1980):
c
1
ÿ c
1eq
c
10
ÿ c
1eq
X
1
n1
2 ÿ1
n1
R
1
sin
npr
R
1
npr
exp
ÿ
n
2
p
2
D
1
t
R
2
1
:
17
By integrating Eq. (17) over the whole volume of any
grape berry devoid of its peel, it was possible to derive
the following time distribution for its humidity:
H ÿ H
eq
H
0
ÿ H
eq
6
p
2
X
1
n1
1
n
2
exp
ÿ
n
2
p
2
D
1
t
R
2
1
:
18
By considering just the ®rst term of the above series,
it is possible to describe the logarithmic reduction of the
®rst term of Eq. (18) as a linear function of time, as
previously proposed by Peri and Riva (1984):
ln
H ÿ H
eq
H
0
ÿ H
eq
ln
6
p
2
ÿ
p
2
D
1
R
2
1
t:
19
It has to be pointed out that even if this equation has
often been used in the literature to estimate the pa-
rameter D
1
, it should be used only for large values of
t; t ! 1: in fact for t 0 it does not forecast
H ! H
0
.
M. Di Matteo et al. / Journal of Food Engineering 46 (2000) 83±89
87

5. Parameter estimation
The values of unknown parameters of the models
described here were estimated by ®tting the experimental
drying data collected when using peeled, untreated and
chemically and physically treated grape berries. As can
be seen from Fig. 1, humidity±time data for abraded and
dipped berries practically coincided.
The unknown parameters to be estimated are the
following: D
1
and c
1eq
, for all three kinds of grape berries
used, and k for the untreated or treated ones.
A ®rst assessment of such parameters was performed
as follows:
(1) The equilibrium values of the moisture content
H
1eq
for all grape berries used was estimated by aver-
aging the experimental humidity determined at the end
of each drying process on the assumption that such
mean values coincided with the equilibrium ones. From
these values H
WP
eq
; H
UT
eq
; H
TR
eq
c
1eq
for grapes without
peel c
WP
1eq
for untreated grapes c
UT
1eq
and for treated
grapes c
TR
1eq
can be easily estimated by considering a
suitable spherical volume.
(2) The diusivity of water in the grape pulp D
1
can
be easily estimated via Eq. (19) using the above H
WP
eq
end
value and the experimental H±t data pertaining to
peeled grape berries. Such a parameter was also used to
describe water diusivity in the grape pulp of all the
samples tested, these being always composed of grape
berries of the same variety, that were almost simulta-
neously harvested in the same region.
(3) The starting value of the mass transfer coecient
k, which accounts for water diusivity in the untreated
or treated grape peel D
2
and equilibrium constant at
the pulp/peel interface K
1
, was obtained by plotting
the corresponding experimental humidity ratio
H ÿ H
eq
= H
0
ÿ H
eq
vs time, by estimating numerically
its slope for t 0 and by equating such a slope to the
derivative of the above humidity ratio with respect to
time as calculated from Eq. (11) and computed by ac-
counting for the ®rst term of the series only and for
t 0:
d
dt
H ÿ H
UT
eq
H
0
ÿ H
UT
eq
!
6L
2
ÿ D
1
b
2
1
R
2
2
1
b
2
1
b
2
1
L L ÿ 1
!
:
20
Since the parameter k is used to de®ne L and thus im-
plicitly b
1
, its estimate has to be obtained by means of
successive iterations.
The optimal estimates of all the unknown parameters
D
1
; k
UT
; K
TR
; c
WP
1eq
; c
UT
1eq
; c
TR
1eq
were derived by mini-
mising the following performance index:
U
X
N
i1
H
S
i
ÿ
ÿ H
T
i
2
21
which represents the sum of the squared dierences
among the experimental humidity H
S
i
data referred to
peeled, untreated and treated grape berries and those
calculated via their corresponding H
T
i
models. More
speci®cally, for the grapes without peel H
T
i
was com-
puted from Eq. (19), thus obtaining H
T
i
H D
1
; c
WP
1eq
;
for the untreated berries H
T
i
was estimated via Eq. (11)
obtaining H
T
i
H D
1
; k
UT
; c
UT
1eq
; and ®nally for chemi-
cally or physically treated grape berries H
T
i
was com-
puted from Eq. (11) obtaining H
T
i
H D
1
; k
TR
; c
TR
1eq
.
Moreover, any water content was forecasted by con-
sidering the ®rst n terms of any series only, n being
suciently high to assure a relative error between the
generic n and n 1 terms summation of less than 1%.
In all the forecasts computed a value of n 2±3 was
sucient.
The minimisation exercise was carried out by using a
non-linear estimation method based on a mixed (direct/
gradient) algorithm (Buzzi Ferraris, 1972) thus leading
to the optimal values of the above unknown parame-
ters. Their covariance matrix was also computed to
determine the con®dence intervals of all the estimates at
a 95% con®dence level (Buzzi Ferraris, 1972; Bard,
1974).
During the minimisation exercise, the progressive
reduction of the dimensions of any grape berries (due
to their loss of water) was taken into account by
considering their equivalent radius, R
i
, as described
before.
The continuous and broken lines in Fig. 1 show the
calculated time variation in moisture content for the
grape berries tested and shows quite a good agreement
with the corresponding experimental values. As previ-
ously stated, it was impossible to detect any moisture
content variation between physically and chemically
treated grape berries.
The optimal value of the water diusion coecient in
the pulp D
1
equal to
D
1
0:4 10
ÿ4
0:1 10
ÿ4
m
2
=h;
was found to be larger than the values reported else-
where (e.g. Riva & Peri, 1986), which referred to the
average water diusivity in the whole grape berry, that is
in its pulp and peel. Therefore, the value determined
here represents the true water diusivity in the grape
pulp only.
As far as the optimal values are concerned, that is
k
TR
2:817 10
ÿ4
2 10
ÿ5
m=h;
k
UT
7:067 10
ÿ5
1:13 10
ÿ6
m=h;
k
TR
was obviously found to be greater than k
UT
and
measures the greater capability of the pre-treatments
used to enhance water diusivity in the grape skin rel-
ative to that in the untreated samples.
88
M. Di Matteo et al. / Journal of Food Engineering 46 (2000) 83±89

6. Conclusions
Removal of the waxy layer from the grape peel by
abrasion was found to be as eective as the traditional
chemical dipping method, as con®rmed by the mass
transport coecient k
TR
which was about 4 times greater
than k
UT
determined for untreated samples. Not only
the drying time but also the pattern of the drying curves
was quite similar for both the chemically and physically
treated samples. Despite the fact that the physical
method gives rise to a more coloured ®nal product than
the chemical one, it makes no use of chemical additives
and therefore allows safer raisins to be produced.
References
Aguilera, J. M., Oppermann, K., & Sanchez, F. (1987). Kinetics of
browning of sultana grapes. Journal of Food Science, 52 (4), 990±
993.
AOAC, 1989. Ocial methods of analysis (15th ed.). Washington, DC:
Association of Ocial Analytical Chemists.
Bard, Y. (1974). Non-linear parameter estimation. New York: Aca-
demic Press.
Bird, B. R., Stewart, W. E., & Lightfoot, E. N. (1960). Transport
phenomena. New York: Wiley.
Bolin, H. R., Petrucci, V., & Fuller, G. (1975). Characteristics of
mechanically harvested raisins produced by dehydration and by
®eld drying. Journal of Food Science, 40, 1036±1038.
Bolin, H. R., & Staord, A. E. (1980). Fatty acid esters and carbonates
in grape drying. Journal of Food Science, 45, 754±755.
Buzzi Ferraris, G. (1972). Experience with an algorithm for
model ®tting and discrimination. Ingegneria Chimica Italiana, 8,
261.
Chambers, T. C., & Possingham, J. V. (1963). Studies on the ®ne
structure of the wax layer of sultana grapes. Australian Journal of
Biological Science, 16, 818±825.
Crank, J. (1975). The mathematics of diusion. Oxford: Clarendon
Press.
Carslaw, H. S., & Jaeger, J. C. (1980). Conduction of heat in solids.
Oxford: Clarendon Press.
Hunter, R. S. (1979). Scales for the measurement of colour dierence in
the measurement of appearance. New York: Wiley.
Di Matteo, M., Donsõ, G., Ferrari, G., Cinquanta, L., & La Notte, E.
(1997). The eects of pretreatments on the drying kinetics of grapes
and on the quality of raisins. Engineering & Food at ICEF 7,
Sheeld Academic Press, G69±G72.
Grncarevic, M., & Hawker, J. J. (1971). Browning of Sultana grapes
berries during drying. Journal of the Science of Food and Agricul-
ture, 22, 270±272.
Labuza, T. P., & Hyman, C. R. (1998). Moisture migration and
control in multi-domain foods. Trends in Food Science & Technol-
ogy, 9, 47±55.
Luikov, A. V. (1968). Analytical heat diusion theory. New York:
Academic Press.
King, C. J. (1977). Heat and mass transfer fundamentals applied to
food engineering. Journal of Food Process Engineering, 1, 3±14.
Mahmutoglu, T., Emõr, F., & Saygi, Y. B. (1996). Sun/solar drying of
dierently treated grapes and storage stability of dried grapes.
Journal of Food Engineering, 29, 289±300.
Peri, C., & Riva, M. (1984). Etude du sechage des raisins 2: Eet des
traitments de modi®cation de la surface sur la qualite du produit.
Sciences des Alimentes, 4, 273±286.
Pointing, J. D., & Mc Bean, D. M. (1970). Temperature and dipping
treatment eects on drying times of grapes prunes and other waxy
fruits. Food Technology, 24, 1403±1406.
Riva, M., & Peri, C. (1986). Kinetics of sun and air drying of dierent
varieties of seedless grapes. Journal of Food Technology, 21, 199±
208.
Rizvi, S. S. H. (1986). Thermodynamic properties of food in
dehydration. In M. A. Rao, & S. S. H. Rizvi, Engineering
properties of foods. New York: Marcel Dekker.
Saravacos, G. D., & Marousis, S. M. (1988). Eect of ethyloleate on
the rate of air-drying of foods. Journal of Food Engineering, 7, 263±
270.
Tutuncu, M. A., & Labuza, T. B. (1996). Eect of geometry on the
eective moisture transfer diusion coecient. Journal of Food
Engineering, 30, 433±447.
M. Di Matteo et al. / Journal of Food Engineering 46 (2000) 83±89
89
Wyszukiwarka
Podobne podstrony:
An experimental study on the drying kinetics of quince
Influence of different microwave seed roasting processes on the changes in quality and fatty acid co
The drying kinetics of kale (Brassica oleracea) in a convective hot air dryer
Use of exponential, Page’s and diffusional models to simulate the drying kinetics of kiwi fruit
31 411 423 Effect of EAF and ESR Technologies on the Yield of Alloying Elements
Effects of the Great?pression on the U S and the World
Effects of the Atomic Bombs Dropped on Japan
Effect of magnetic field on the performance of new refrigerant mixtures
76 1075 1088 The Effect of a Nitride Layer on the Texturability of Steels for Plastic Moulds
Curseu, Schruijer The Effects of Framing on Inter group Negotiation
A systematic review and meta analysis of the effect of an ankle foot orthosis on gait biomechanics a
71 1021 1029 Effect of Electron Beam Treatment on the Structure and the Properties of Hard
Effects of kinesio taping on proprioception at the ankle
Glińska, Sława i inni The effect of EDTA and EDDS on lead uptake and localization in hydroponically
Effecto of glycosylation on the stability of protein pharmaceuticals
Understanding the effect of violent video games on violent crime S Cunningham , B Engelstätter, M R
The Effect of Childhood Sexual Abuse on Psychosexual Functioning During Adullthood
On the Effectiveness of Applying English Poetry to Extensive Reading Teaching Fanmei Kong
EFFECTS OF CAFFEINE AND AMINOPHYLLINE ON ADULT DEVELOPMENT OF THE CECROPIA
więcej podobnych podstron