
Using ISO 3382 measures, and their extensions, to evaluate acoustical
conditions in concert halls
John S. Bradley
Institute for Research in Construction, National Research Council,
1200 Montreal Rd., Ottawa, K1A 0R6, Canada
( Received 22 July 2004, Accepted for publication 7 October 2004 )
Abstract:
Application of the ISO 3382 standard can lead to the acquisition of large amounts of data
describing conditions in a hall. The data could include the values of a number of measures at 6 or more
octave band frequencies and for many combinations of source and receiver location. This paper
discusses and gives examples of using this data to find important acoustical features. The amount of
data can be reduced by calculating average values over the entire data set or for each sub-area of the
hall. Various important spatial variations can often be better understood from plots of values versus
source-receiver distance. The analysis approach will depend on the purpose of the study, which could
be for comparisons with various criteria, for investigations of problems, or to better understand the
acoustical properties of the hall. The significance of new measurements can be determined by
comparing values: with proposed ideal criteria, with values in well-known halls, or with theoretical
predictions. The importance of differences between two values should be considered in terms of
published just noticeable differences for particular measures. Separately examining early- and late-
arriving sound levels can be a useful diagnostic tool for better understanding the acoustical properties
of halls.
Keywords:
Concert halls, ISO 3382, Room acoustics measurements, Acoustical evaluation
PACS number:
43.55.Gx
[DOI: 10.1250/ast.26.170]
1.
INTRODUCTION
The ISO 3382 standard [1] specifies how to measure a
number of well-accepted room acoustics parameters and
includes guidance concerning, the numbers of source and
receiver positions to be used and the calculation details for
each parameter. The combination of many different
acoustical measures, at many frequencies, and from many
positions in a hall, can result in a large amount of data that
may at first hide interesting acoustical features. This paper
discusses and gives examples of how to focus on these
more interesting, and often more important features. It also
introduces early- and late-arriving relative sound levels, as
useful extensions to the basic measures in ISO 3382. These
can help us to better understand acoustical conditions in
halls.
1.1.
Many Measures
ISO 3382 includes a number of well-accepted room
acoustics measures in the main body of the standard and in
appendices. As newer measures become accepted, these too
may be added in future revisions of the standard. However,
it is advisable to first focus on the more basic and more
generally important parameters. Table 1 lists some acous-
tical measures under 4 headings. The basic measures of
level (G, Strength or relative level) and reverberance (EDT,
early decay time and T
30
, reverberation time) along with
the balance between clarity and reverberance (C
80
, early-
to-late arriving sound ratio) are usually most important.
The lateral energy fraction, LF, (of the early-arriving
sound), and the inter-aural cross correlation measures of
the early and late-arriving sound (IACC
e
and IACC
l
) are
measures of spatial effects.
This paper introduces the early-arriving relative sound
level G
80
and the late-arriving relative sound level G
L
as
useful diagnostic measures that can be derived from values
of G and C
80
(see Appendix for definitions). By describing
early- and late-arriving sound levels separately, they give a
more detailed look at components of sound fields that will
relate to expected subjective impressions, but without
providing too much less-significant detail. Although C
80
values indicate how the ratio of early-to-late arriving sound
levels vary, G
80
and G
L
values make these variations more
e-mail: john.bradley@nrc-cnrc.gc.ca
170
Acoust. Sci. & Tech. 26, 2 (2005)
PAPER

understandable by assessing each component separately.
The early- and late-arriving lateral sound levels (G
EL
and
G
LL
) are also useful indicators of spatial effects that are not
currently included in ISO 3382. They conveniently combine
the level and lateral-direction-of-arrival information into
simple single measures of each aspect of spatial impression
(i.e. apparent source width and listener envelopment [2]).
1.2.
Many Frequencies
Measurements are usually made in the octave bands
from 125 to 4 kHz. There are good reasons to extend this
range to include the octave bands from 63 Hz to 8 kHz
because these frequencies certainly influence perceptions
of concert hall sounds. We don’t yet have much knowledge
concerning the preferred variation with frequency of the
various acoustical measures, but we do know that strong
low frequency levels, rather than long low-frequency T
30
values, influence the perceived strength of bass sounds in
halls [3,4]. A full audio bandwidth is necessary for impulse
response measurements if it is intended to listen to
convolutions of speech and music with these impulse
responses. Including the 63 Hz and 8 kHz octaves adds
significantly to the requirements of the measurement
system. It is particularly difficult to produce an omni-
directional sound source that can produce sufficient sound
levels over this entire frequency range. It also suggests that
testing laboratories should consider measuring the acous-
tical properties of materials over this broader frequency
range. However, this too presents some considerable
technical problems.
1.3.
Many Positions
In a large hall one might typically measure at the 36
combinations of 3 source positions and 12 receiver
positions. This usually gives enough information for an
understanding of spatial variations in a large hall. In a hall
with more complex geometry, more positions would be
preferred. Movements of the source or receiver position by
as little as 10 or 30 cm can lead to measurable differences
as shown in Table 2 [5]. The differences over 30 cm are
similar to the just noticeable difference (JND) values for
these quantities [6,7]. However, JND values are derived
from careful comparisons of nearly equal conditions in
laboratory experiments in which only one aspect of the
sound field is changed. Differences that can be detected by
listeners in actual halls are probably much larger. This is
partly because more than one aspect of the sound field will
change when the listener moves in a concert hall, making it
more difficult to identify the individual effects of each
changing parameter. No laboratory experiments have
considered subjectively detectable changes when more
than one aspect of the sound field is changed. The
variations over 30 cm in Table 2 probably represent, in
practical terms, the accuracy with which conditions at a
particular seat can be characterized.
1.4.
Purpose of Measurements and Data Reduction
Techniques
The purpose of room acoustics measurements might be:
a) to compare with design criteria, b) to better understand
acoustical phenomena, or c) to diagnose the cause of
acoustical problems. The approach to the data reduction
will depend on the purpose of the measurements. While
hall-average values of acoustical measures may allow
comparisons with design criteria, they may not reveal
important variations within a hall. Plotting values versus
source-receiver distance, or examining averages over small
sub-areas of audience seating, may better describe within-
hall variations of acoustical characteristics. The following
examples illustrate various possible approaches.
2.
EXAMPLE 1, SOUND LEVEL DETAILS IN
A MULTI-PURPOSE HALL
Measurements of sound levels in Southam Hall of the
National Arts Centre, Ottawa are used to examine the
question of how many measurement positions are required
and to examine the details of level variations in this hall.
Figure 1 illustrates 1 kHz G value contours from measure-
ments at 145 positions on one side the main floor of this
hall, plus duplicate values reflected about the centre line to
represent the other half of the main floor seating. While
there are strong variations of these sound levels from front
to rear of this hall, the pattern of variations is not that
complex and there is little justification to make such
detailed measurements.
Table 1
Room acoustics measures discussed in this text
(See Appendix and the ISO 3382 standard [1] for
definitions).
Level
Reverberance/
Diagnostic
Spatial
Clarity
effects
G
T
30
G
80
LF
EDT
G
L
IACC
e
C
80
IACC
l
C
50
G
EL
TS
G
LL
Table 2
Average variations of measured values for
small movements of the source or receiver [5].
Measure
10 cm
30 cm
G
0.4 dB
0.8 dB
C
80
0.6 dB
0.9 dB
T
30
0.04 s
0.06 s
EDT
0.07 s
0.15 s
LF
0.05
0.06
J. S. BRADLEY: USING ISO 3382 MEASURES
171
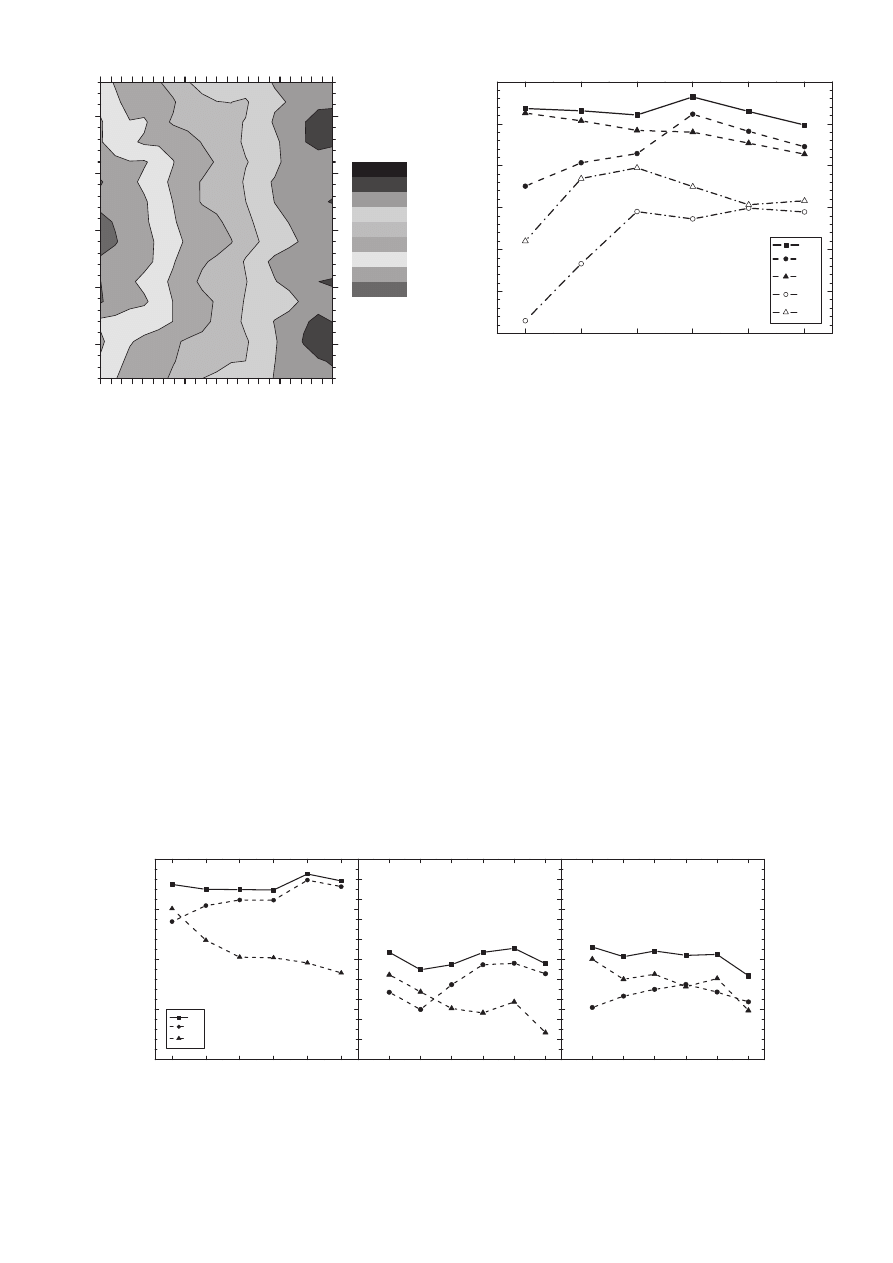
While Fig. 1 gives a more global view of the character-
istics, Fig. 2 illustrates the details that can be found at an
individual location. For seat O2 near the centre of the main
floor seating, Fig. 2 plots G values and their components
versus frequency. While total G values do not vary greatly
with frequency at this location, the dominant component
does. At lower frequencies the late-arriving sound (G
L
) is
dominant and the seat dip attenuation [8] has greatly
reduced the low frequencies of the early-arriving sound
(G
80
). At higher frequencies G
80
values are the dominant
component. If one goes into more detail and examines the
lateral component of the early- and late-arriving sound
(G
EL
and G
LL
respectively), we see that the lateral-arriving
energies are relatively small parts of the total early and late
energy values. One would therefore expect a very low
sense of spatial impression at this location.
Examining how the variations of sound levels with
frequency change throughout the hall can give a more
complete understanding of the acoustical characteristics.
Figure 3 shows measured G values with early and late
components at 3 other locations in the same hall.
Figure 3(a) shows values at a seat very close to the stage
where the combined direct plus early reflection energy
(G
80
) is dominant at almost all frequencies. The results in
Fig. 2 showed, that near the centre of the main floor
seating, the balance of early- and late-arriving sound had
changed considerably from the results in Fig. 3(a). In the
centre of the second balcony (Fig. 3(b)), early-arriving
sound (G
80
) dominates at mid- and high-frequencies and
the seat dip attenuation seems now to be greatest at 250 Hz.
However, in the third balcony, the Fig. 3(c) results show
more similar early and late sound levels with strong late-
B
D
F
H
K
M
O
Q
S
U
W
Y
5
10
15
20
25
Length, (1 m/row)
Width, m
-1.0
0
1.0
2.0
3.0
4.0
5.0
6.0
7.0
G(1k), dB
Fig. 1
Contour fit to measured 1 kHz G values.
125
250
500
1000
2000
4000
-25
-20
-15
-10
-5
0
5
Relative level, dB
Frequency, Hz
G
G
80
G
L
G
EL
G
LL
Fig. 2
Measured relative levels (G) and early (G
80
) and
late (G
L
) components at a centre main floor seat. G
EL
is
the early lateral relative level and G
LL
is late lateral
relative level.
125
250
500
1000
2000
4000
-10
-5
0
5
10
G
G
80
G
L
Relative level, dB
Frequency, Hz
(a)
125
250
500
1000 2000 4000
Frequency, Hz
(b)
125
250
500
1000 2000 4000
(c)
Frequency, Hz
Fig. 3
Measured relative levels (G) and early (G
80
) and late components (G
L
), (a) seat B2 close to the stage, (b) seat D2 in
the second balcony, and (c) seat D2 in the third balcony.
Acoust. Sci. & Tech. 26, 2 (2005)
172
arriving sound (G
L
) at low frequencies.
Clearly, the character of the sound must vary consid-
erably from area to area in this hall. At most locations, and
especially at mid-to-high frequencies, early arriving sound
energy dominates, creating a dry sound. The exception is in
the third balcony (Fig. 3(c)) where the late-arriving sound
is relatively stronger. At lower frequencies the seat dip
attenuation reduces the level of the early-arriving sound at
the measured seats. However, increasing low frequency
sound levels by reducing the amount of low frequency
sound absorbing material in the hall is not likely to
compensate for the large reductions in low frequency early-
arriving sound.
3.
EXAMPLE 2, HALL AVERAGES AND
WITHIN HALL VARIATIONS
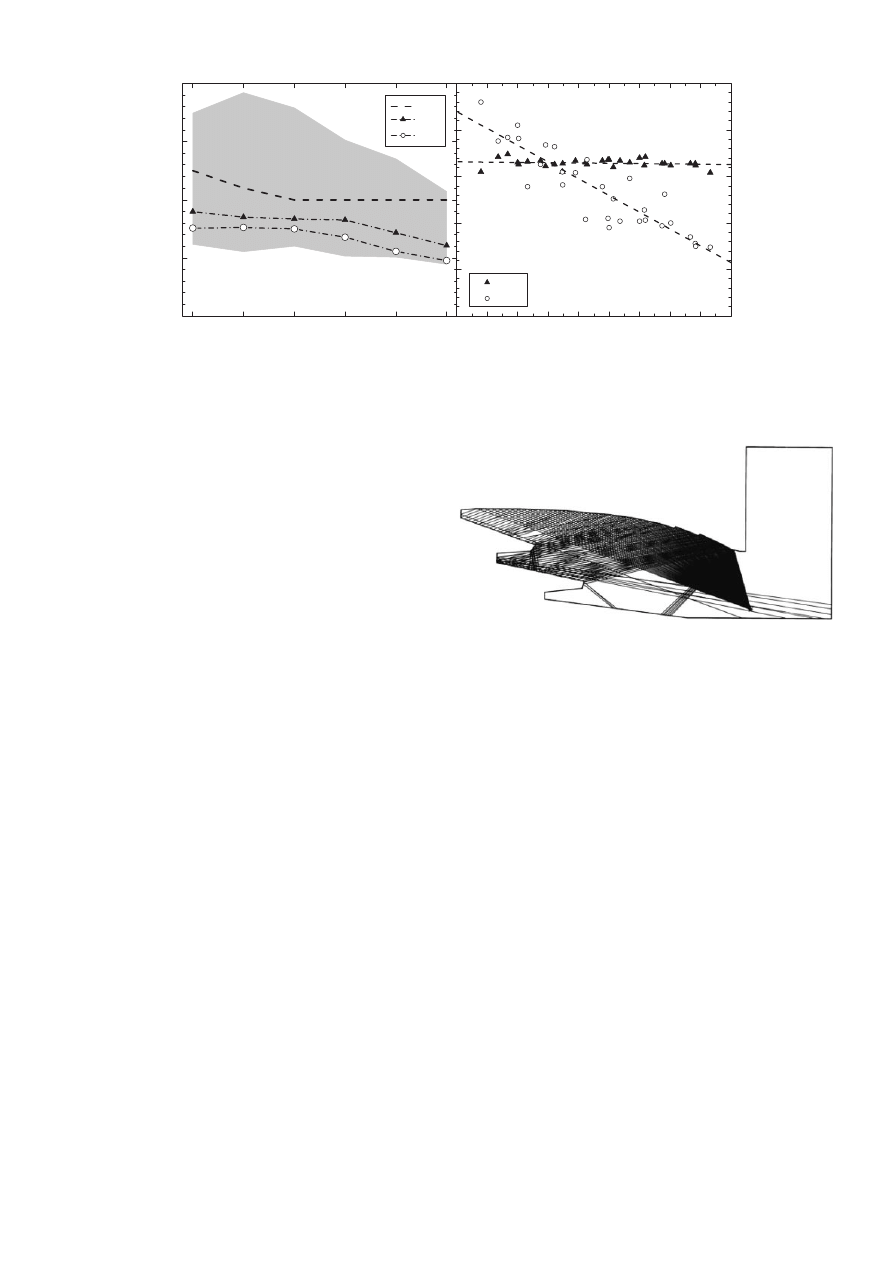
Figure 4(a) plots hall average EDT and T
30
values from
the Northern Alberta Jubilee Auditorium (NAJA) with the
range of EDT values obtained from measurements in 31
large halls [4] as well as a possible design goal for concert
hall EDT values. Average EDT values are smaller than T
30
values as is commonly found, and the measured averages
are less than the proposed design criterion values. How-
ever, this is very much a multi-purpose hall and it is easily
argued that somewhat shorter decay times than the ‘ideal’
would be appropriate. The large range of EDT values from
the 31 halls shows that there are many halls with much
larger or smaller values.
These results give no indication of the unusual
characteristics of this hall that are seen when decay time
values are plotted versus source-receiver distance as shown
in Fig. 4(b). While the 1 kHz T
30
values are quite constant
throughout the hall (as is almost always the case), EDT
values vary quite dramatically with distance. Presumably,
the sense of reverberance would be very different at the
rear of the hall compared with at seats near the stage. These
results, as well as those for early sound levels, can be
explained as due to the shape of the ceiling sending all
reflections to the rear of the hall as illustrated in Fig. 5.
In order to appreciate the significance of these within-
hall variations, we can compare the results in Fig. 4(b) with
those from other halls. These comparisons in Fig. 6 show
that variations of EDT in this hall (NAJA) are greater than
in the other halls shown. In some halls there is very little
variation of EDT values. Sometimes this occurs because
the hall is quite reverberant and diffuse such as in Boston
Symphony Hall (BOS) [9]. In other halls the reduced
variation of EDT with distance is because the shape of the
hall concentrates reflected energy near the stage (SWP) as
illustrated in Fig. 7(b). The results for the Neuesfestspiel-
haus in Salzburg (SLZ) shown in Fig. 6 are an example of a
hall that tends to direct early-arriving reflections to the rear
of the hall. This creates a situation where EDT values
reduce with increasing distance from the source but less
dramatically than found in NAJA. The variation with
distance of G values is often inversely related to the
variation of EDT values with distance. This is especially
true in directed sound halls that are shaped to direct strong
125
250
500
1000
2000
4000
0
1
2
3
4
Ideal
T
30
EDT
Decay time, s
Frequency, Hz
(a)
10
15
20
25
30
35
40
45
50
0.0
0.5
1.0
1.5
2.0
2.5
T
30
EDT
Distance, m
(b)
Fig. 4
Measured values from NAJA, (a) hall average T
30
and EDT values, and the range of EDT values from 31 halls,
(b) variation of 1 kHz EDT and T
30
with source-receiver distance.
Fig. 5
Longitudinal section showing ceiling reflections in NAJA.
J. S. BRADLEY: USING ISO 3382 MEASURES
173
early reflections to particular audience areas [10]. By
plotting EDT and G values as a function of source-receiver
distance, we can therefore better understand the effects of
the shape of a hall on early-arriving reflections.
4.
EXAMPLE 3, COMPARISON WITH
THEORETICAL PREDICTIONS
It is often useful to compare measurements with
theoretical predictions to determine if there are unusual
features. Barron’s procedure [11] for predicting relative
sound levels of the early, late, and total sound components
is particularly valuable because sound levels are so critical
to subjective impressions of halls. In well-accepted halls,
measured levels tend to agree well with the predictions of
Barron’s theory.
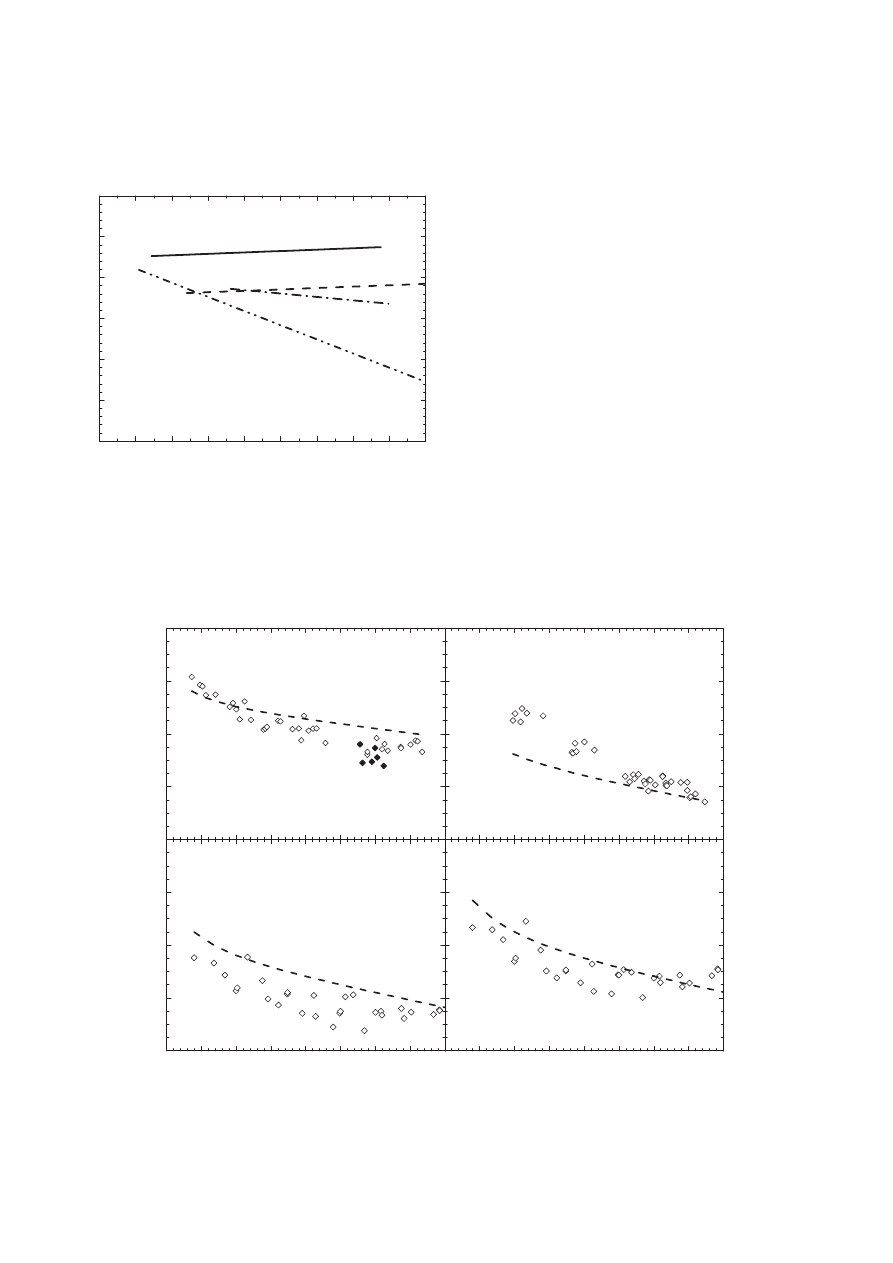
For example, the variation of 1 kHz G values with
distance in Boston Symphony Hall (BOS) in Fig. 7(a),
agree well with predictions. At seats close to the stage,
measured levels are a little higher than predicted, probably
due to strong reflections from the stage enclosure. At seats
under the balcony (solid symbols) levels are a little lower
than predicted. Figure 7(b) gives an example where
measured levels closer to the stage are much above
predictions, probably due to the shape of the orchestra
shell and to sound energy scattered back towards the stage
from the ceiling in this hall. This results in large variations
of levels from the front to the rear of this hall. Figure 7(c)
shows a hall where measured values tend to fall system-
atically below predictions at most seats. This is again due
0
4
8
12
G, dB
(a)
0
4
8
12
G, dB
(b)
5
10
15
20
25
30
35
40
45
-4
0
4
8
12
G, dB
DIstance, m
(c)
5
10
15
20
25
30
35
40
45
-8
-4
0
4
8
G
80
, dB
DIstance, m
(d)
Fig. 7
Comparison of measured 1 kHz values and predictions using Barron’s theory [9], (a) G values in BOS, (b) G values
in SWP, (c) G values in NAJA, and (d) G
80
values in NAJA.
0
5
10
15
20
25
30
35
40
45
0.0
0.5
1.0
1.5
2.0
2.5
3.0
EDT, s
Distance, m
BOS
SWP
SLZ
NAJA
Fig. 6
Straight line fits to measured 1 kHz EDT values
in 4 halls: BOS Boston Symphony Hall, SWP Salle
Wilfrid Pelletier (Montreal), SLZ Neuesfestspielhaus
(Salzburg), and NAJA, Northern Alberta Jubilee
Auditorium (Edmonton).
Acoust. Sci. & Tech. 26, 2 (2005)
174
to the ceiling shape of the NAJA hall tending to send early
reflections to the rear of the hall (see Fig. 5). In support of
this explanation Fig. 7(d) shows that early-arriving sound
levels (G
80
) are indeed higher than predicted at locations at
the rear of this hall (far right-hand side of graph).
As in the previous section, plotting values versus
source-receiver distance is seen to be useful for under-
standing the acoustical characteristics of halls. When these
results are also compared with the predicted levels from
Barron’s procedure, we get an indication of where
conditions are atypical.
5.
EXAMPLE 4, DIAGNOSING ACOUSTICAL
PROBLEMS
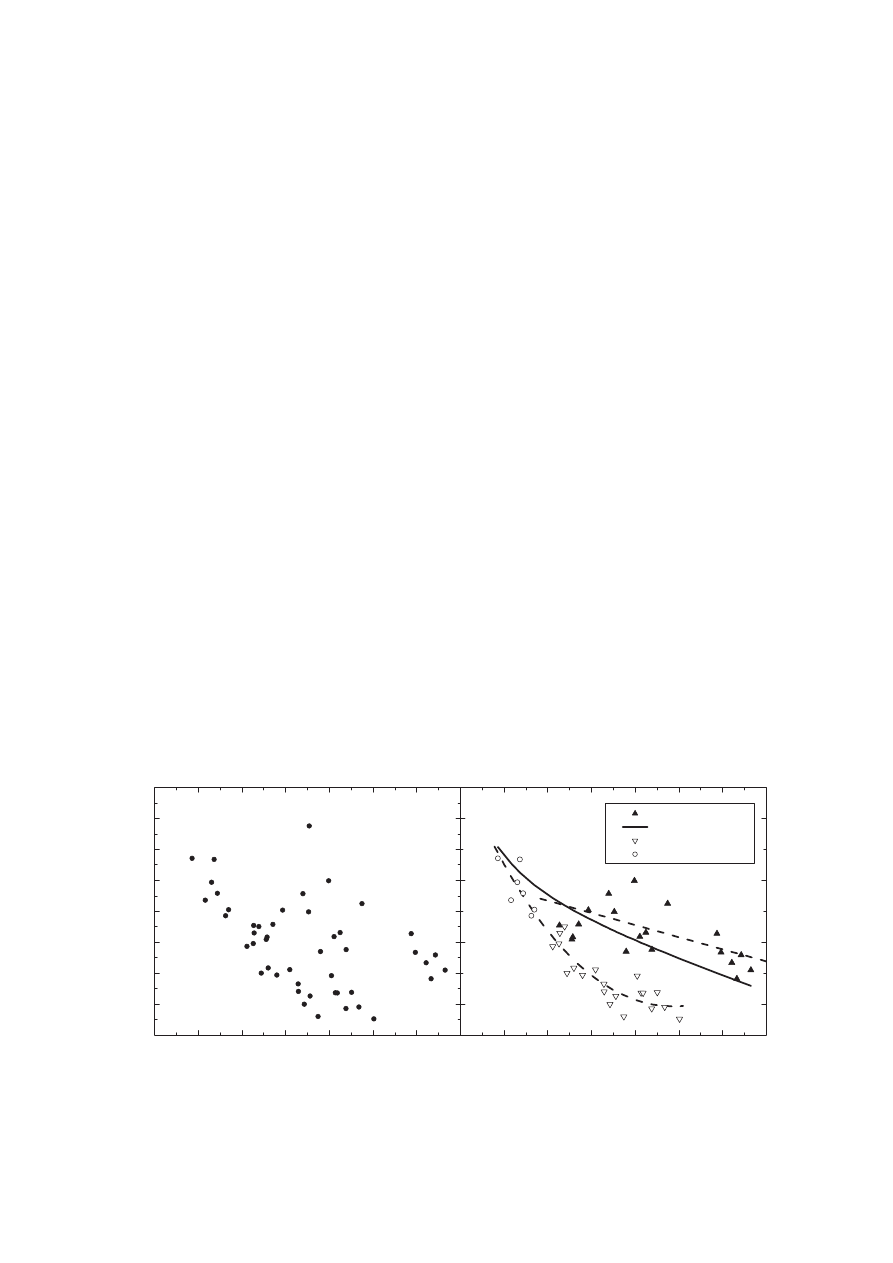
The Orpheum Theatre in Vancouver was originally
built as a theatre and later converted to a dedicated concert
hall. Acoustical measurements identified several significant
acoustical problems [12]. Again, hall-average values do not
reveal the problems, and a simple plot of levels versus
source-receiver distance (Fig. 8(a)) only shows a large
amount of scatter. The causes of this scatter can be
identified by separating the data into those obtained from
positions at balcony seats and those from seats on the main
floor of the hall including seats under the balcony.
Figure 8(b) indicates that there are 2 separate trends for
the two different groups of measurements. Sound levels
tend to be lower at seats under the balcony, and values
measured at seats in the balcony tend to agree reasonably
well with predictions using Barron’s theory.
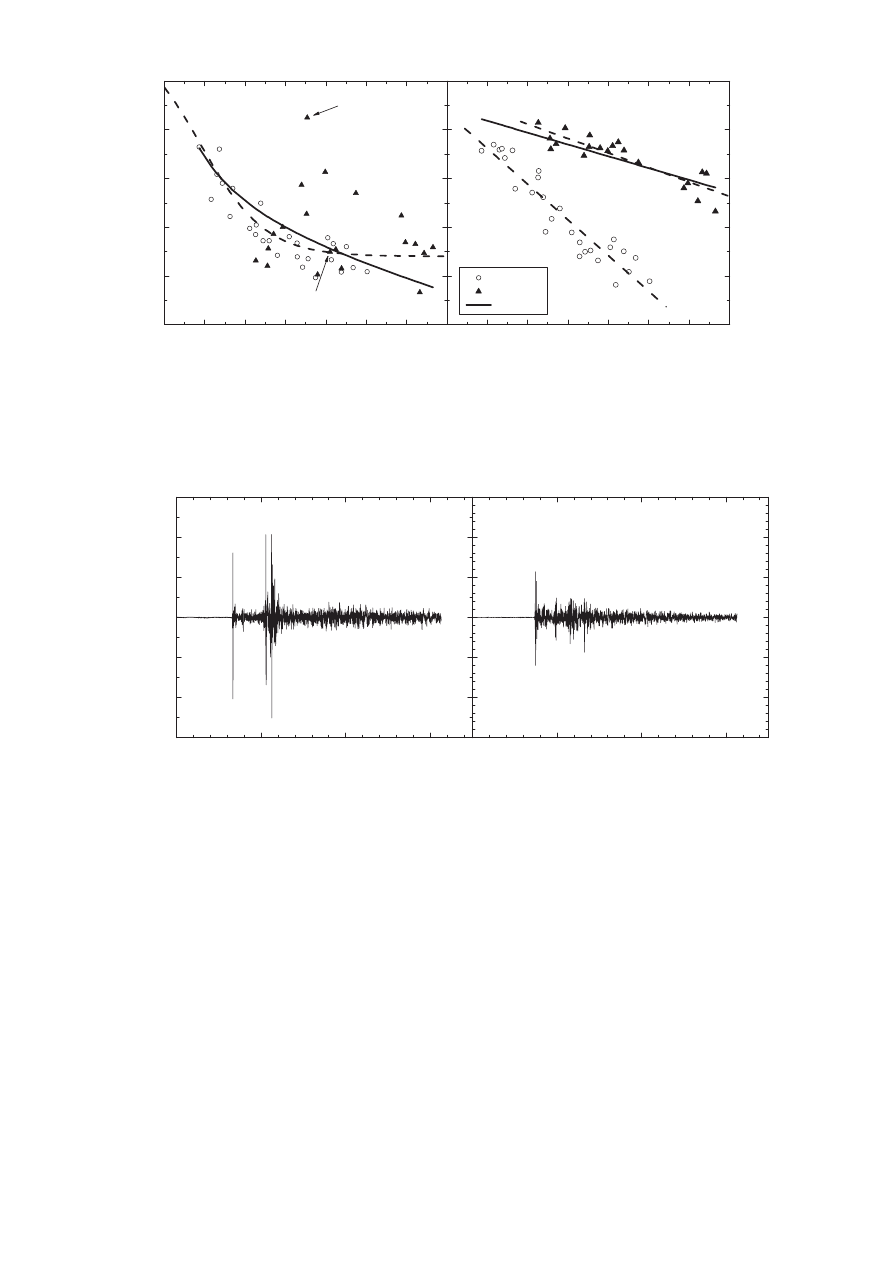
The situation can be more completely understood by
examining how early and late sound levels each vary with
distance. Figure 9(a) shows that most, but not all G
80
values, agree quite well with the predictions of Barron’s
theory. There are 5 positions in the balcony where early
sound levels significantly exceed these predictions (i.e. by
more than 1 dB). However, there is no systematic differ-
ence in early levels depending on whether they are
measured at seats in the balcony or under the balcony.
On the other hand, Fig. 9(b) shows that late-arriving levels
are systematically different depending on whether meas-
urements are made at locations in or under the balcony.
Measured values at locations under the balcony do not
agree well with predictions using Barron’s theory but at
other locations there is quite good agreement.
There are two different acoustical problems illustrated
in these results. First, the very large balcony overhang
produces very obvious reductions in the late-arriving sound
at locations under the balcony. This is seen, to a much
lesser degree, in Fig. 7(a) for BOS. However, there is no
systematic reduction of early-arriving sound levels at seats
under balconies. The other problem evident in these results,
leads to increased early sound levels at particular locations
in the balcony. These are due to various concave surfaces
(mostly in the ceiling) that focus sound to specific locations
in this hall and cause significant variations in early levels.
Figure 10(a) shows the initial part of the impulse response
at the location with the most extreme focussing effect and
another (Fig. 10(b)) with no obvious focussing effect. The
two strong reflections in Fig. 10(a) are stronger than the
direct sound and are perceived as a localization of the
source in the ceiling.
Plotting results versus source-receiver distance was
again helpful in understanding the acoustical problems in
this hall. However, it was most helpful when the values of
the diagnostic parameters G
80
and G
L
were examined.
While the focussing problems were isolated in the early-
arriving sound, the weak levels at seats under the balcony
were shown to be due to a lack of late-arriving sound.
5
10
15
20
25
30
35
40
-1
0
1
2
3
4
5
6
7
G(1k), dB
Distance, m
(a)
10
15
20
25
30
35
40
In balcony
Barron
Under balcony
In front of balcony
Distance, m
(b)
Fig. 8
Measured 1 kHz G values versus source-receiver distance in the Orpheum Theatre (a), and (b) same data separated
by measurement location (Balcony seats, and main floor seats in front of, or under the balcony) compared with predicted
levels using Barron’s theory (solid line).
J. S. BRADLEY: USING ISO 3382 MEASURES
175
6.
CONCLUSIONS
The level of detail required in measurements of concert
halls depends on the purpose of the measurements. A
typical set of measurements at the combinations of 3 on-
stage source positions and 10 to 12 receiver positions in the
audience area will usually be adequate to characterize
acoustical conditions in a large hall. Measurements at a
large number of positions usually indicate systematic
gradual changes in values. Seat-to-seat variations in
measured values tend to be no more than one just-
noticeable-difference (JND). A laboratory obtained JND
from tests where only one aspect of the sound field is
varied, may not be indicative of detectable changes in a
hall where several different characteristics of the hall may
vary in different ways from one seat to the next.
The analysis approach will depend on the purpose of
the study, which could be for comparisons with various
criteria, for investigations of problems, or to better under-
stand the acoustical properties of the hall. The significance
of new measurements can be determined by comparing
values: with proposed ideal criteria, with values in well-
known halls, or with theoretical predictions. Because ideal
values of the various parameters defined in ISO 3382 are
not well established, it is often useful to compare measure-
ments with values from well-regarded halls. Of course, just
because a hall is well liked, does not ensure that measured
values of all parameters are near to ideal values.
0.0
0.1
0.2
0.3
-6000
-4000
-2000
0
2000
4000
6000
Relative pressure
TIme, s
(a)
0.0
0.1
0.2
0.3
Time, s
(b)
Fig. 10
Impulse responses from balcony seats in the Orpheum Theatre, (a) with strong focusing, and (b) without obvious
focussing.
5
10
15
20
25
30
35
40
-4
-2
0
2
4
6
G
L
(1k), dB
G
80
(1k), dB
Distance, m
(a)
Fig. 10(a)
Fig. 10(b)
10
15
20
25
30
35
40
-8
-6
-4
-2
0
2
Main floor
Balcony
Barron
Distance, m
(b)
Fig. 9
Measured values of (a) early levels (G
80
), and (b) late sound levels (G
L
) versus source- receiver distance in the
Orpheum Theatre. Solid lines are predictions using Barron’s theory [9]. Different symbols identify measurement locations
in balcony seats or main floor seats in front of or under the balcony. Data corresponding to the impulse responses in
Figs. 10(a) and 10(b) are also identified in panel (a).
Acoust. Sci. & Tech. 26, 2 (2005)
176

Although hall-average values give a general overall
picture of a concert hall, we can much better understand the
unique acoustical characteristics of a hall by examining
within hall variations of each important parameter. This
can be done by plotting values versus source-receiver
distance or by averaging over sub-areas of the audience
seating. The shape of a hall may have the effect of directing
more of the early-arriving energy to one particular area of
the hall. Such effects can be more easily understood by
separately considering early- and late-arriving sound levels
(G
80
and G
L
values). For example, a hall may direct more
early energy to a particular area, or a large balcony
overhang may reduce late-arriving sound at seats under the
balcony. Comparisons of measured early- and late-arriving
levels with predictions based on Barron’s theory can
further aid the understanding of acoustical conditions in a
concert hall.
There is an obvious need for new research to develop a
better understanding of the subjective importance of
variations with frequency of the various room acoustics
parameters and also to try to determine preferred spectral
characteristics for each of them.
ACKNOWLEDGMENTS
The author would like to thank the management and
staff of the halls that have cooperated in the various
measurement studies. It is also important to point out that
these results were obtained before renovations were made
to the Orpheum Theatre and before the planned renovation
to the Alberta Jubilee Auditoria.
REFERENCES
[1] ISO 3382:1997, ‘‘Acoustics — Measurement of the reverber-
ation time of rooms with reference to other acoustical
parameters,’’ International Organisation for Standardisation,
Geneva, Switzerland.
[2] J. S. Bradley and G. A. Soulodre, ‘‘Objective measures of
listener envelopment,’’ J. Acoust. Soc. Am., 98, 2590–2597
(1995).
[3] J. S. Bradley, G. A. Soulodre and S. Norcross, ‘‘Factors
influencing the perception of bass,’’ J. Acoust. Soc. Am., 101
Pt. 2, 3135 (1997).
[4] J. S. Bradley, ‘‘The sound field for listeners in concert halls
and auditoria,’’ Computational Architectural Acoustics, J. J.
Sendra, Ed. (WIT Press, Southampton, 1999).
[5] J. S. Bradley and R. E. Halliwell, ‘‘Accuracy and reproduci-
bility of auditorium acoustics measures,’’ Proc. Bri. Inst.
Acoust., Spring ’88 Meeting, Cambridge, U.K., Vol. 10, Part 1,
pp. 339–406 (1988).
[6] T. J. Cox, W. J. Davies and Y. W. Lam, ‘‘The sensitivity of
listeners to early sound field changes in auditoria,’’ Acustica,
79
, 27–41 (1993).
[7] J. S. Bradley, R. Reich and S. G. Norcross, ‘‘A just noticeable
difference in C
50
for speech,’’ Appl. Acoust., 58, 99–108
(1999).
[8] J. S. Bradley, ‘‘Some further investigations of the seat dip
effect,’’ J. Acoust. Soc. Am., 90, 324–333 (1991).
[9] J. S. Bradley, ‘‘A Comparison of three classical concert halls,’’
J. Acoust. Soc. Am., 89, 1176–1192 (1991).
[10] J. S. Bradley, ‘‘Hall average characteristics of 10 halls,’’ Proc.
13th Int. Congr. Acoust., Belgrade, pp. 199–202 (1989).
[11] M. Barron and L.-J. Lee, ‘‘Energy relations in concert
auditoria, I,’’ J. Acoust. Soc. Am., 84, 618–628 (1988).
[12] J. O’Keefe and J. S. Bradley, ‘‘Acoustical renovations to the
Orpheum, Vancouver: I. Measurements prior to renovations,’’
Can. Acoust., 28, 21–33 (2000).
APPENDIX:
DEFINITIONS OF SOME ROOM
ACOUSTICS MEASURES
This appendix defines the principal room acoustics
measures discussed in the results of this paper, including
some quantities not included in the ISO 3382 standard.
The sound strength (or relative sound level) G is
measured using a calibrated omni-directional sound source,
and is calculated as follows,
G ¼ 10 log
10
Z
1
0
p
2
ð
tÞdt
Z
1
0
p
2
10
ð
tÞdt
8
>
>
<
>
>
:
9
>
>
=
>
>
;
; dB
ð
A:1Þ
where pðtÞ is the instantaneous pressure in the measured
impulse response and p
10
ð
tÞ is the response to the same
source at a distance of 10 m in a free field.
The strength of the direct and early-arriving sound over
the first 80 ms, G
80
, can be defined with an equation similar
to equation A1, but with the upper integration limit of the
upper integral set to 0.08 s. The sound strength of the late-
arriving sound, G
L
, consisting of sound energy arriving at
the receiver more than 80 ms after the direct sound can
again be defined with an equation similar to A1, but with
the lower integration limit of the upper integral set to
0.08 s.
The relative level or strength of the early-arriving
lateral sound, G
EL
, and the late-arriving lateral sound, G
LL
,
can be calculated similar to G
80
and G
L
respectively but
using the impulse response obtained from a figure-of-eight
pattern microphone in the upper integral of an equation
similar to A1. For example, the late arriving lateral sound
level G
LL
, which is related to listener envelopment, is
calculated as follows,
G
LL
¼
10 log
10
Z
1
0:08
p
2
L
ð
tÞdt
Z
1
0
p
2
10
ð
tÞdt
8
>
>
<
>
>
:
9
>
>
=
>
>
;
; dB
ð
A:2Þ
where p
L
ð
tÞ is the instantaneous pressure in the measured
impulse response using a figure-of-eight pattern micro-
phone with the null pointing toward the sound source and
p
10
ð
tÞ is the response to the same source at a distance of
10 m in a free field with an omni-directional measurement
microphone.
J. S. BRADLEY: USING ISO 3382 MEASURES
177

The balance between early and late-arriving sound
energy can be measured using C
80
(and several other
related measures found in the ISO 3382 standard). C
80
is
defined as follows,
C
80
¼
10 log
Z
0:08
0
p
2
ð
tÞdt
Z
1
0:08
p
2
ð
tÞdt
; dB
ð
A:3Þ
also
C
80
¼
G
80
G
L
; dB
ð
A:4Þ
The lateral energy fraction is defined as follows,
LF ¼
Z
0:080
0:005
p
2
L
ð
tÞdt
Z
0:080
0
p
2
ð
tÞdt
ð
A:5Þ
The early and late relative sound levels G
80
and G
L
can
be calculated from measured G and C
80
values as follows,
G
80
¼
10 log
10
C
80
=10
10
C
80
=10
þ
1
10
G=10
; dB
ð
A:6Þ
G
L
¼
10 log
1 10
C
80
=10
10
C
80=10
þ
1
10
G=10
; dB
ð
A:7Þ
Similarly, the relative level or strength of the early-
arriving lateral sound, G
EL
, can calculated from LF, C
80
and G values as follows,
G
EL
¼
10 log LF
10
C
80
=10
10
C
80
=10
þ
1
10
G=10
; dB
ð
A:8Þ
Acoust. Sci. & Tech. 26, 2 (2005)
178
Wyszukiwarka
Podobne podstrony:
Barron Measured Early Lateral Energy Fractions In Concert Halls And Opera Houses
Barron Late lateral energy fractions and the envelopment question in concert halls
Barron Using the standard on objective measures for concert auditoria, ISO 3382, to give reliable r
Barron Using the standard on objective measures for concert auditoria, ISO 3382, to give reliable r
024 Grain Property Values and Their Measurement
Herbs And Their Magickal Properties
MoS2 Preparation and their characterization
54 767 780 Numerical Models and Their Validity in the Prediction of Heat Checking in Die
Copyright Laws and their Downfalls Relating to?nada
Clothes and their Descriptions Worksheet
PRACTICAL SPEAKING EXERCISES with using different grammar tenses and constructions, part Ix
Medieval Writers and Their Work
German Converts to Islam and Their Ambivalent Relations with Immigrant Muslims
Measure And Marking
Environmental Law Enforcement measures and?fectiveness in
charged and rotating ADS black holes and their CFT duals
04 Shifting and Sign Extension
więcej podobnych podstron