
ELF/VLF RADIATION
PRODUCED BY THE 1999 LEONID METEORS
COLIN PRICE
AND
MOSHE BLUM
Department of Geophysics and Planetary Science, Tel Aviv University, Ramat Aviv
69978, ISRAEL
E-mail: cprice@flash.tau.ac.il
(Received 4 June 2000; Accepted 18 August 2000)
Abstract. For more than 200 years large meteors entering the atmosphere have been
observed to produce audible sounds simultaneously with the optical flash. Since sound
waves travel much slower that visible light, the only explanation was that
electromagnetic waves produced by the meteors induce a vibration in a transducer close
to the observer, producing an audible sound, known as electrophonics. To check this
hypothesis, continuous measurements of low frequency electromagnetic waves were
performed during the Leonids meteor storm on the night of 18 November, 1999. The
analyses of the data indicate distinct electromagnetic pulses produced by the incoming
meteors. Many of the weaker incoming meteors that could not be seen visibly were
also detected electromagnetically, with a peak rate of approximately 15,000 meteors per
hour occurring at the peak of the storm, nearly 50 times the visible rate.
Keywords: Electrophonics, ELF, Leonids 1999, meteors, radio waves, VLF
1. Introduction
For generations there have been claims that meteors entering the earth’s
atmosphere produce an audible sound simultaneously with the optical
signature produced by the incoming meteor (Blagdon, 1784; Udden,
1917; Romig and Lamar, 1963; Andres et al., 1969; Keay, 1980; Keay,
1993). It was difficult to explain these sounds being produced by shock
waves or other acoustic signals produced by the meteorite itself, since
given the distance of the meteor from the observer, there should always
be a time delay between the optical and audible signals. However, if the
meteor produced an electromagnetic wave in the audible frequencies,
then this wave would reach the observer at the same instance as the
visible light (Hawkins, 1958; Beech et al., 1995). This low frequency
wave could induce oscillations, vibrations, and sounds from many
Earth, Moon and Planets 82–83: 545–554, 2000.
c
2000 Kluwer Academic Publishers. Printed in the Netherlands.

PRICE AND BLUM
546
objects near the observer. Hence, any electrically conducting body
(plants, hair, wires, metal sheets, speakers, fences, spectacles, etc.) could
vibrate at audible frequencies, giving the observer the perception that the
sound was produced by the meteor (Udden, 1917). This phenomenon is
known as electrophonics. It is interesting to note that some observations
mention sounds being heard before any optical flash in the sky
(Nininger, 1939; Keay, 1980), allowing the observers to focus their
attention in a particular direction before seeing the meteor burning up in
the atmosphere.
We have tested this hypothesis by attempting to measure the ELF/VLF
radiation from the meteors during the 1999 Leonid meteor storm. Here,
we report a strong increase of VLF detections with unusual spectral
signature that coincide with the peak of the storm.
2. Measurements
During the Leonids meteor storm on 18 November, 1999,
electromagnetic measurements were continuously recorded to try and
detect these radio waves produced by meteors. Since the best viewing
location for the 1999 meteor shower was the Middle East, we were
ideally located for this task. A permanent field site for observing
ELF/VLF signals is located at the Desert Research Institute of Ben-
Gurion University, at Sde Boker in the Negev Desert (30 N, 34 E). The
antenna is designed to pick up very weak signals in the extremely low
frequency (ELF: 100 Hz < f < 3000 Hz) and the very low frequency
(VLF: 3 kHz < f < 50 kHz) range for use in lightning research.
However, these frequencies are exactly those expected to be produced by
meteors (Keay,1980) and, therefore, our setup was ideal for studying the
meteor signals. The ELF/VLF antenna is 10 meters high, with two
orthogonal triangular loops, each with a baseline of 18 meters, height 9
meters, giving an area of approximately 81 m
2
for each loop. One loop is
aligned in the magnetic north-south direction, with the other along the
magnetic east-west bearing. The sensitivity of the system in the
broadband range (0.1–50 kHz) is 6
µ
V/meter. The dynamic range of the
antenna/preamp set is approximately 100 dB, allowing us to detect
lightning discharges from great distances. The data were collected on
digital audio tapes (DAT) with GPS timing, to correlate with the optical
measurements. The data were later digitized at 100 kHz.
ELF/VLF RADIATION PRODUCED BY THE 1999 LEONIDS
547
3. Results
Since our antenna is sensitive to both lightning discharges and possible
meteor pulses, we needed to differentiate between the lightning and
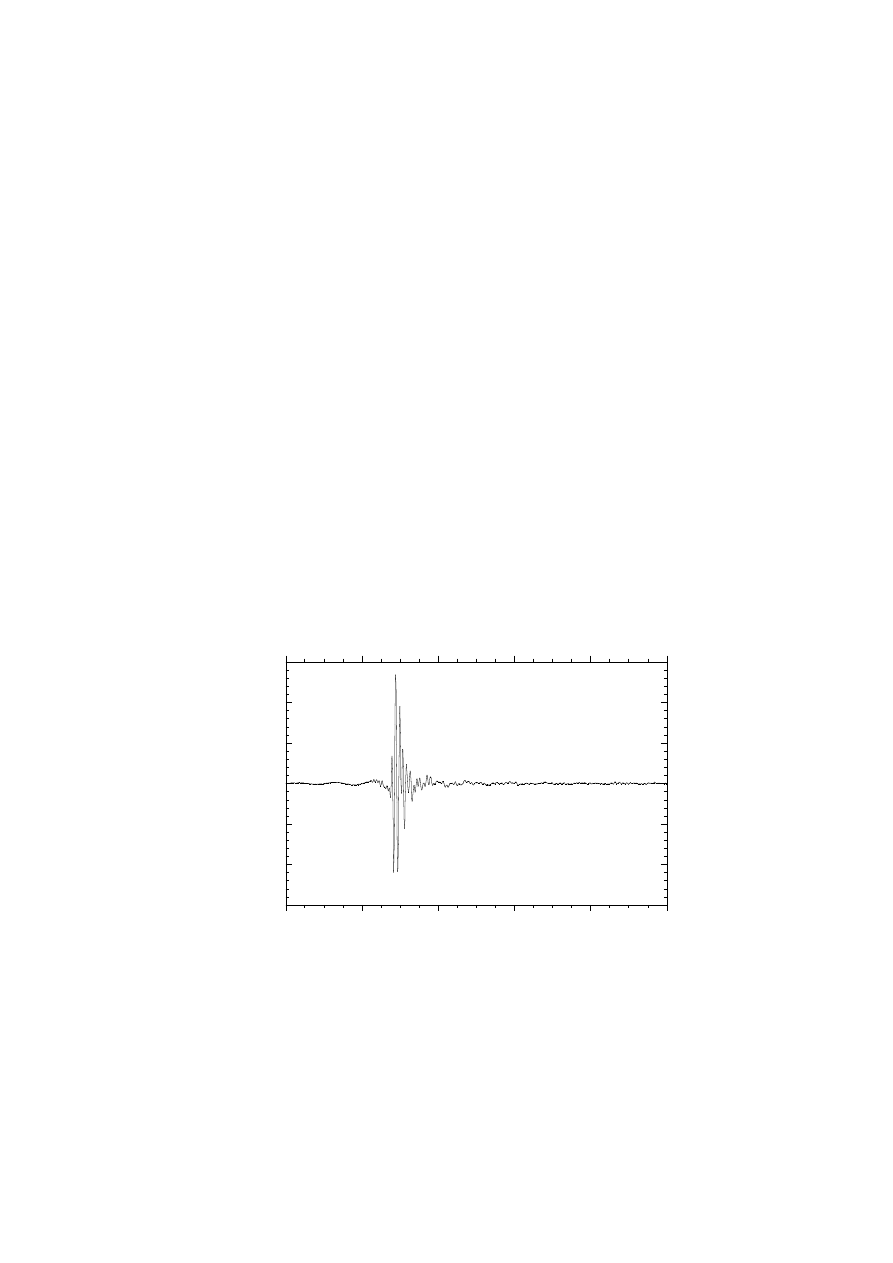
meteor signals. In Figure 1 we see an example of the north-south
magnetic field time series, in the 0.1--50 kHz range, produced by a
lightning discharge (Figure 1a) and a meteor (Figure 1b) on the night of
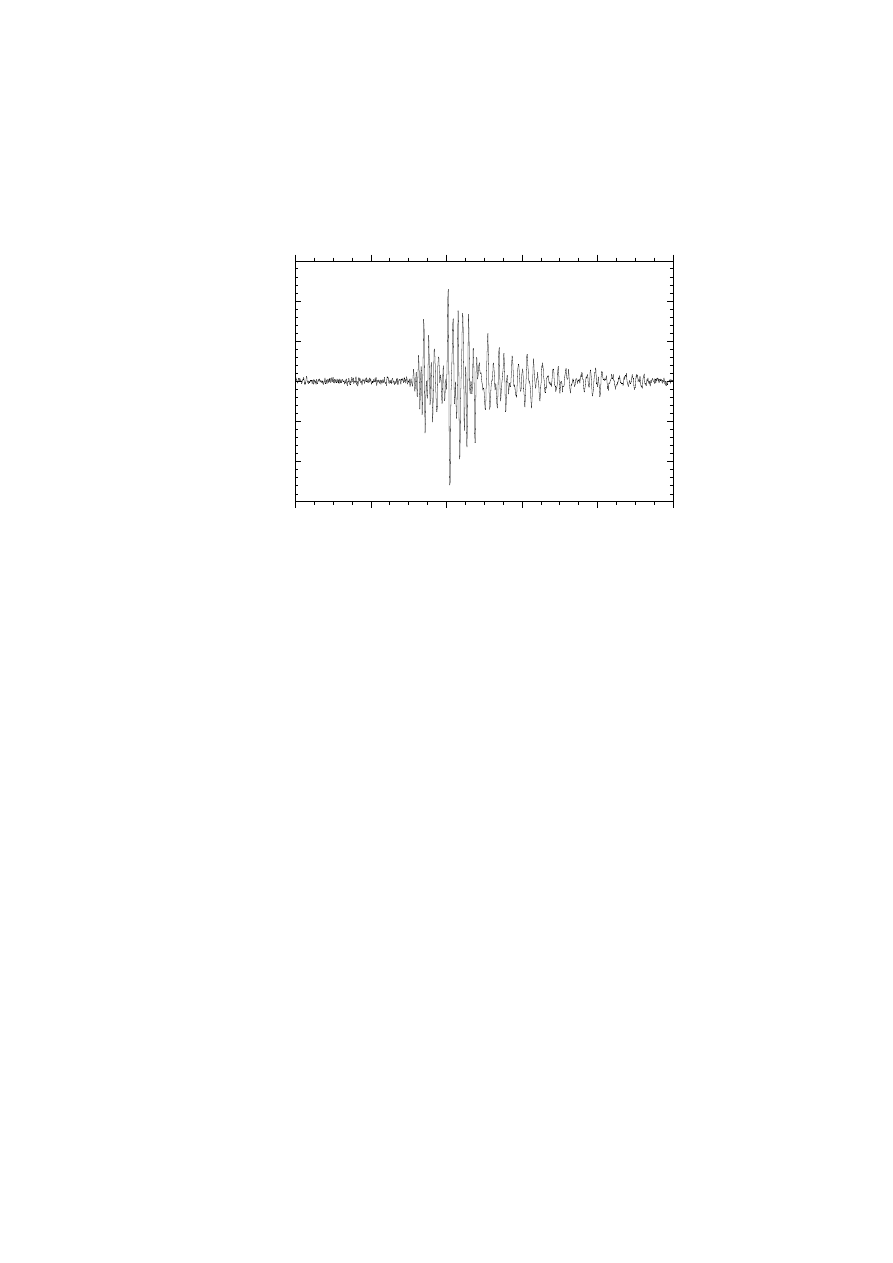
the meteor storm. There are two distinct differences between the
lightning and the meteor signal. First, while the lightning pulse lasts no
longer than 1 millisecond, the meteor pulse continues for up to 10
milliseconds. Although this is longer that the lightning pulse, this is
much shorter than the duration of the optical meteor trail which can last
for seconds. Second, the amplitude of the lightning pulse is much larger
than the meteor pulse. These time series are from the same data file and,
therefore, the relative amplitudes can be directly compared. It is
important to note that at the time of sampling thunderstorms were
observed over the Balkans by the Leonid MAC team, but there were no
thunderstorms within a 2,000 km radius of the Negev field site.
Figure 1a. Time series of lightning on the night of 18 November, 1999.
- 3
- 2
- 1
0
1
2
3
0
2
4
6
8
1 0
Time Series of Lightning Pulse
Relative Amplitude (Volts)
Time (milliseconds)
PRICE AND BLUM
548
Figure 1b. Time series of a meteor electromagnetic pulses on the night of 18
November, 1999.
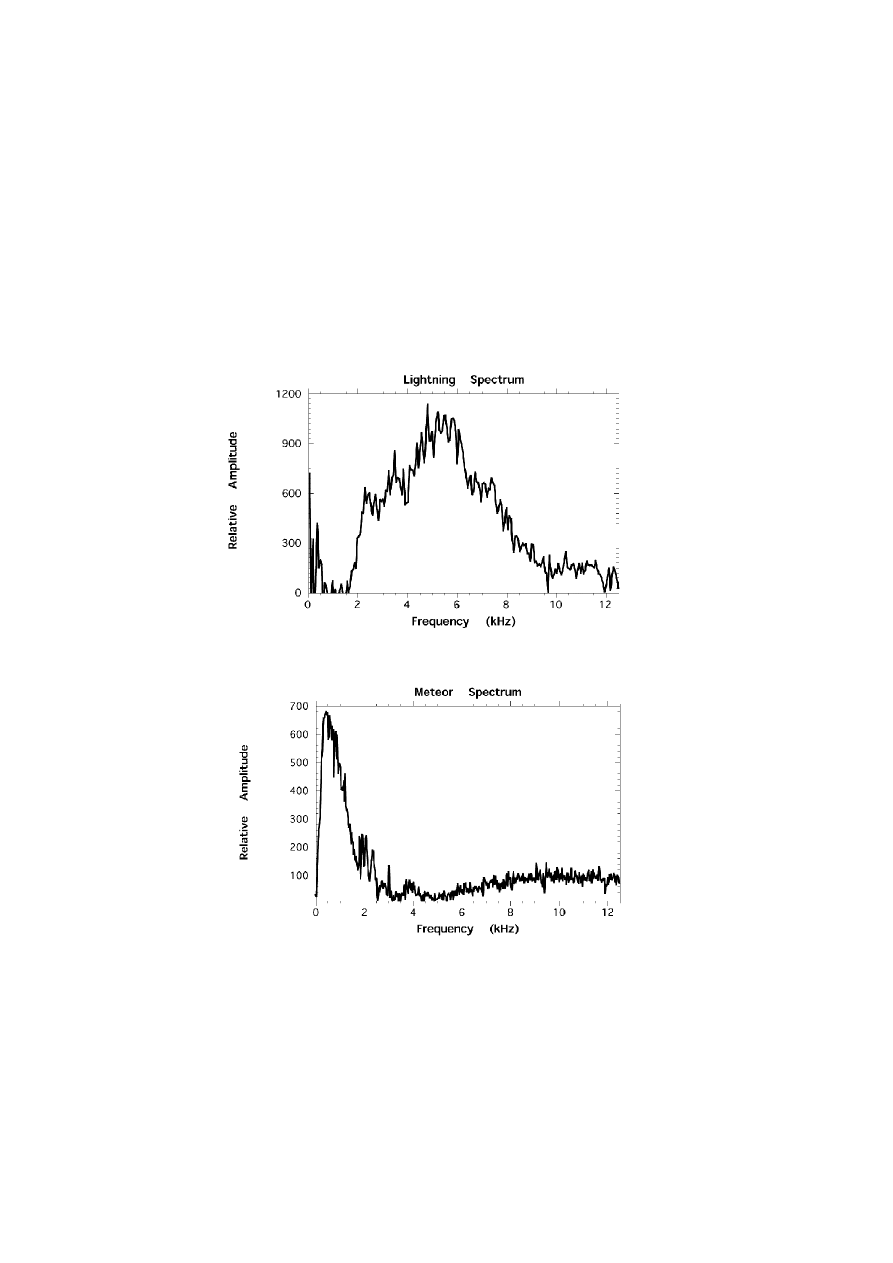
In addition to the obvious differences between the lightning and meteor
time series, their respective spectra also show significant differences. It
is well documented that the spectrum of distant lightning shows a
maximum near 6 kHz (Volland, 1982). This is shown from our
measurements in the Negev desert during August, 1999, when no
precipitation or lightning activity occur in the Middle East (Fig 2a). This
spectrum is an average of approximately 35 individual spectra. The
maximum around 5 kHz agrees well with measurements of lightning
from other parts of the globe. During the night of the Leonids meteor
storm (18 November, 1999), very different spectra were obtained due to
the incoming meteors (Fig 2b). Here too the spectrum represents an
average of approximately 35 events.
Unlike the lightning spectra, the meteor spectra shows a minimum near
5kHz, with a large maximum in the ELF range (0.3-1.5 kHz) and an
additional weaker maximum around 2 kHz. In the VLF range there
appears a weaker, broader maximum between 6-15 kHz. No signal was
- 0 . 3
- 0 . 2
- 0 . 1
0
0 . 1
0 . 2
0 . 3
0
2
4
6
8
1 0
Time Series of Meteor Pulse
Relative Amplitude (Volts)
Time (milliseconds)
ELF/VLF RADIATION PRODUCED BY THE 1999 LEONIDS
549
observed above 20 kHz. The characteristic differences between the
lightning and meteor spectra allow for the automatic determination of
whether the electromagnetic signal is caused by lightning or by meteors.
This enabled us to label the meteor pulses and, therefore, count the
number of ELF/VLF meteor signals observed during the night of the
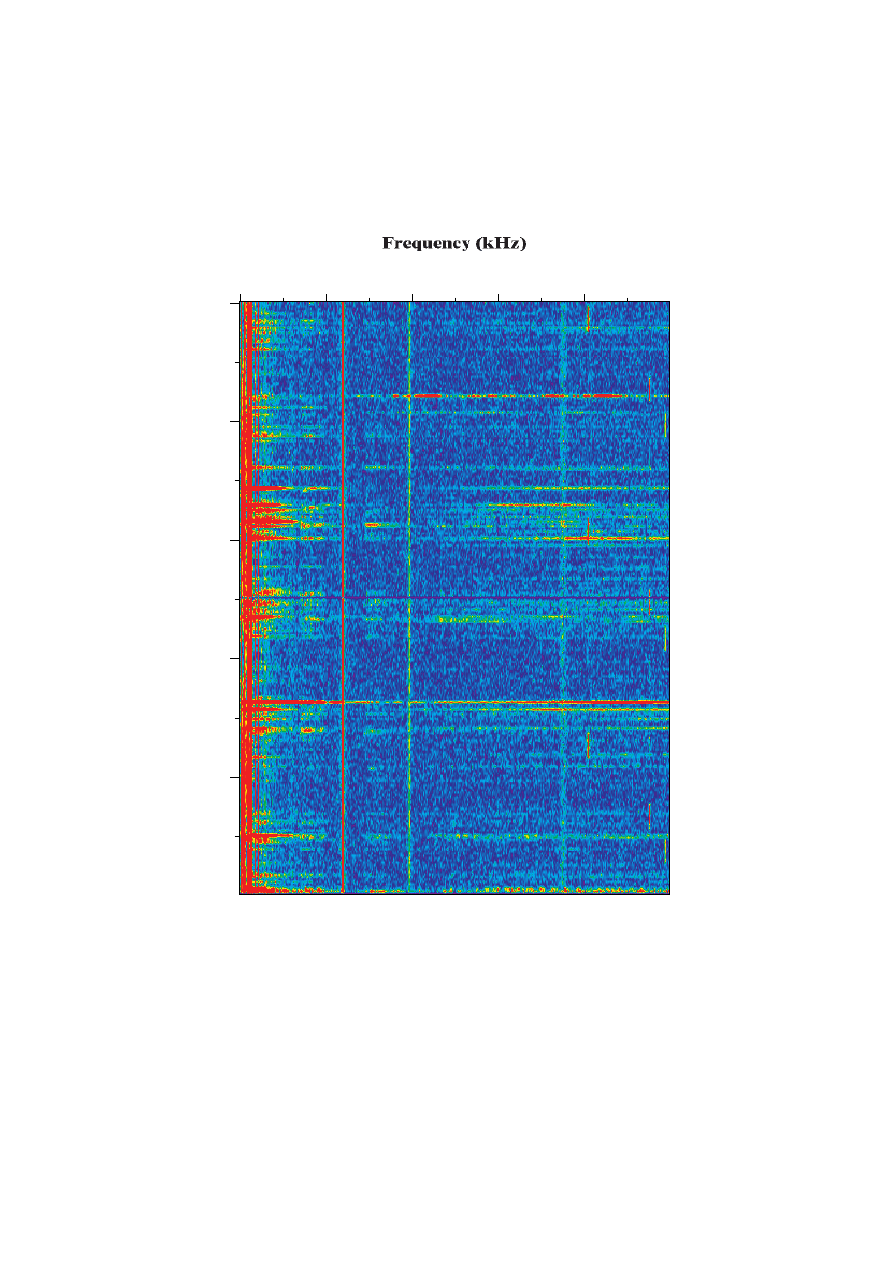
17-18 November, 1999. An example of the dynamic spectrum at the
peak of the meteor shower is shown in Figure 3.
Figure 2a. The mean spectrum of lightning pulses.
Figure 2b. The mean spectrum of meteor pulses.
PRICE AND BLUM
550
Figure 3. The dynamic spectrum during peak of Leonid meteor shower, around
02:00 UT, 18 August, 1999.
0
2.0
4.0
6.0
8
.0
1
0.0
10
7.5
5
2.
5
0
Time (seconds)
Frequency (kHz)
VLF Dynamic Spectrum - 18 Nov. 1999 0200 UT (10 seconds)
ELF/VLF RADIATION PRODUCED BY THE 1999 LEONIDS
551
The dynamic spectrum represents only 10 seconds of data, where the
spectrum is calculated every 10 milliseconds. The frequency of the 10
millisecond windows is shown on the vertical axis between 0-12.5 kHz,
while the color code represents relative amplitude of the signals, red
being the largest values. A few features are clearly seen in this 10-
second snapshot. The horizontal red lines between 0-0.5 kHz represent
the large noise produced by the electric power lines that operate at 50 Hz
in Israel, together with all the higher harmonics. The horizontal lines
shown at higher frequencies represent the anthropogenic signals from
VLF transmitters around the globe, used for navigational purposes. The
Russian VLF signals are transmitted in a pulsed format, as can be seen in
Figure 3 above 10 kHz. The vertical lines represent the pulses for the
individual meteors entering the earth’s atmosphere. The mean spectrum
of these events is shown in Figure 2b. Up to thirty VLF pulses are
observed within this 10-second period. Whether all these VLF pulses are
produced by individual meteors, or whether each meteor produces a
series of pulses, is still unknown. Correlations with optical
measurements will allow us to decipher this uncertainty in the future.
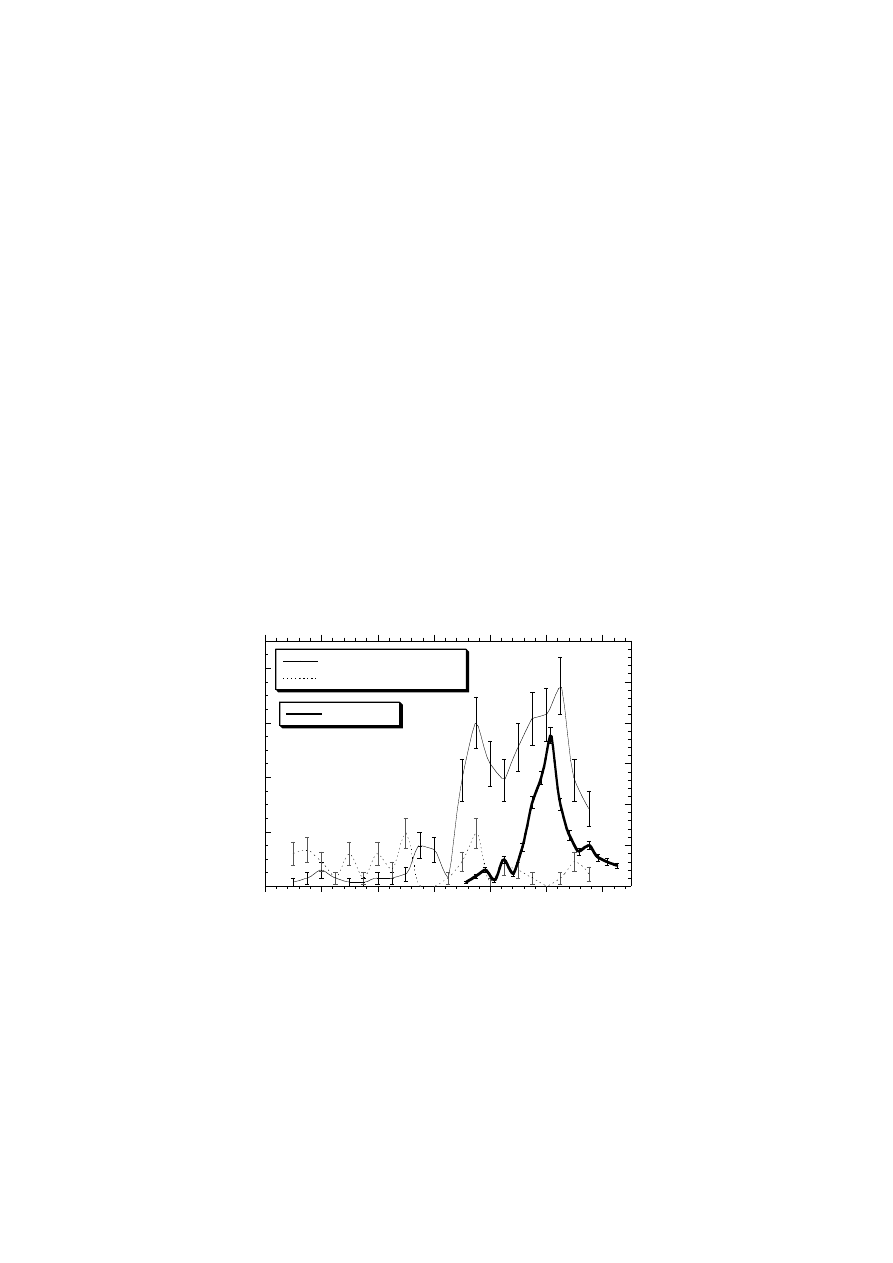
Figure 4. Hourly counts of optically observed meteors during the night of 17-18
November, 1999 (bold line), and the electromagnetically observed meteor
counts during the night preceding the meteor shower (16-17 November: dotted
line) and the night of the shower (17-18 November: solid thin line).
0
4 0 0 0
8 0 0 0
1 2 0 0 0
1 6 0 0 0
0
1 0 0
2 0 0
3 0 0
4 0 0
5 0 0
6 0 0
ELF/VLF counts 17-18 Nov.
ELF/VLF counts 16/17 Nov.
Optical counts
ELF/VLF Counts (#/hour)
Optical Counts (#/hour)
Time (UT)
2 1 0 0
2 2 0 0
2 3 0 0
0 0 0 0
0 1 0 0
0 2 0 0
0 3 0 0

PRICE AND BLUM
552
Based on the spectrum shown for the meteors in Figure 2b we used the
1.2 kHz frequency band to automatically identify the presence of a
meteor in the dynamic spectrum. As shown above, this is exactly where
the lightning signal is weakest. Although the meteor signal is stronger at
lower frequencies (0.5 kHz), noise interference from the power line
harmonics produces problems deciphering weak meteor signals at these
frequencies. Using a specified threshold for the meteor signal at 1.2 kHz,
we were able to count the number of electromagnetic pulses produced by
the meteors. Since we have six hours of continuous recordings from
21:30 UT on the 17
th
November through 03:30 UT on the 18
th
, we were
able to produce a time series of the hourly rate of electromagnetic meteor
pulses, to compare with the local incident optical meteor observations
(Brosch et al., this issue)(Figure4). The ELF/VLF hourly rate obviously
depends on the threshold chosen, making our algorithm more or less
sensitive to weak pulses.
As is clearly shown using the ELF/VLF method of counting the meteor
flux, a peak flux of 15,000 per hour was detected, relative to 350 per
hour using optical methods. Therefore, the ELF/VLF method detected
nearly 50 times more meteors than the optical method. It should be
pointed out that the radio pulse counts were obtained by sampling small
segments of data (10 seconds) at 15 minute intervals. This was done to
save time in data analysis, since each 10 seconds of ELF/VLF data
represents 1 million data points. Analysis at finer temporal resolution
will be done in the future. The ELF/VLF count maximum was observed
in the sample taken at 02:15 UT, five to ten minutes after the optical
peak of the meteor shower. This time correlation confirms that the
electromagnetic pulses observed were produced by the incoming
meteors. A similar analysis for the previous night (16-17 November,
Figure 4) shows no such enhancement of the pulse counts. Although the
ELF/VLF antenna observes signals from all directions, and from greater
distances than the optical measurements, it is very likely that many weak
meteors that cannot be seen optically still produce electromagnetic
signals. However, with all the observers in the field during this night, no
reports of audible sounds associated with the meteors could be found.
It is possible to estimate the effective area of detection at the peak of
the shower, if we know the count rate, and the limiting magnitude of the
meteors we detect. It is normally assumed that the limiting magnitude
for observing optical meteors is +6.5. However, for the ELF/VLF
meteors the limiting magnitude may be higher (smaller meteors). The

ELF/VLF RADIATION PRODUCED BY THE 1999 LEONIDS
553
effective area can be calculated as A = counts / 0.82 x r
∆
m
x sin(hr) km
2
,
where 0.82 (km
-2
hr
-1
) is the peak influx of Leonids brighter than +6.5
magnitude (Gural and Jenniskens, this issue), r is the magnitude
distribution index of approximately 2.1, hr is the height of the radiant
position (70
o
), and
∆
m is the magnitude difference between our
ELF/VLF limiting magnitude and the standard +6.5 limiting factor for
the optical meteors. If we see only the meteors brighter than +6.5 then
∆
m = 0, and the effective area is 17,000 km
2
. If we manage to detect
meteors brighter than +7.5, then our effective area of detection is 36,000
km
2
.
The electromagnetic flux rate shows an additional interesting feature
not shown in the optical counts. A secondary peak of the shower is
shown at 00:45:00 UT, an hour and a half before the optical peak. It is
possible that the visible meteors represent only a small subset of the total
meteors. From the ELF/VLF counts it appears that there existed a
maxima of small sub-visible meteors 90 minutes before the optical peak.
4. Discussion
In addition to the advantage of being able to detect weak meteors, the
electromagnetic method of determining the meteor fluxes can also be
used during daylight hours, and in all weather conditions. Our
measurements provide convincing proof that meteors do produce
electromagnetic radiation as they enter the atmosphere, which can
explain the sounds heard during observations of large fireballs
(electrophonics).
The only theoretical explanation of how these radio waves are
produced has been presented by Keay (1993, 1995). However, our
measurements challenge the theory with new questions: How do sub-
visible and small meteors produce radio signals? The theory applies
only to large bolides (fireballs). Why do the radio signals never last
more than 10 milliseconds? The theory explains radio signals lasting up
to tens of seconds. Why do some people hear sounds before seeing the
optical meteor? The theory describes the radio signals produced
simultaneously with the bright optical signal. It is clear that more work
is needed in this field.

PRICE AND BLUM
554
Acknowledgments
We thank George J. Drobnock and an anonymous referee for comments
that improved the manuscript. We thank Dr. David Faiman and the Solar
Energy Research Center, Sde Boker, for allowing us to use their facility
for our measurements; Boris Starobinets for assisting with the data
collection; and Dr. Noah Brosch for inviting us to participate in the 1999
Leonid campaign. Support for construction of the VLF antenna was
provided by the Israel Science Foundation. Editorial handling: Peter
Jenniskens.
References
Andrews, A.D., Rackham, and T.W., Wayman, P.A.: 1969, Nature 222, 727–730.
Beech, M., Brown, P., and Jones, J.: 1995, Earth, Moon and Planets 68, 181–188.
Blagdon, C.: 1784, Philos. Trans. R. Soc. London 74, 201–232.
Drobnock, G.J.: 1992, Sky and Telescope 77, 329–331.
Hawkins, G.S.: 1958, Nature 181, 1619–1611.
Keay, C.S.L.: 1980, Science 210, 11–15.
Keay, C.S.L.: 1993, J. Scientific Explor 7, 337–354.
Keay, C.S.L.: 1995, Earth, Moon and Planets 68, 361–368.
Nininger, H.H.: 1939, Popular Astronomy 47, 97–99.
Romig, M.F. and Lamar, D.L.: 1963, RAND Memo. RM-3724-ARPA.
Udden, J.A.: 1917, Science 46, 616–617.
Volland, H.: 1982, in H. Volland (ed.), Handbook of Atmospherics, CRC Press, Boca
Raton, Fla., pp. 179–250.
Wyszukiwarka
Podobne podstrony:
lasery, Light Amplification by the Stimulated Emision of Radiation, Light Amplification by the Stimu
The Metamorphosis of the Planets by John de Monte Snyders produced by RAMS (1982)
Chambers Kaye On The Prowl 2 Tiger By The Tail
Konspekt LA oszczep zabawowa by the wejsyl(2)
Food production in the mediterranean area
MONEY BY THE MOUTHFUL
20020105 T Fascinated by the Emotions of God Part 2 EEP2
29 387 402 HSS Produced by Conventional Casting, Spray Forming and PM
Zaproszenie, Public document to be completed by the Contracting Authority
By the girl
by the time of world war ii NZRMQ22WVNW73JEDUAEMIMBG2CLONPKSGVQGVJA
2 LASER (LIGHT AMPLIFICATION by the STIMULATED EMISIONid 21138 ppt
Palaikastro Shells and Bronze Age Purple Dye Production in the Mediterranean Basin
Język angielski Story by the timeI got there it was too late
[60]Selective degradation of oxidatively modified protein substrates by the proteasome
[Mises org]Hayek,Friedrich A Tiger By The Tail
POZNAN 2, DYNAMICS OF SYSTEM OF TWO BEAMS WITH THE VISCO - ELASTIC INTERLAYER BY THE DIFFERENT BOUN
44905242 Recipes from Power Foods by the Editors of Whole Living Magazine
Chambers Kaye On The Prowl 2 Tiger By The Tail
więcej podobnych podstron