
Effects of machining parameters on surface
integrity of hard machined surfaces
Y Choi
1
* and C R Liu
2
1
Department of Mechanical and Aerospace Engineering, Florida Institute of Technology, Melbourne, Florida, USA
2
School of Industrial Engineering, Purdue University, West Lafayette, Indiana, USA
The manuscript was received on 27 June 2009 and was accepted after revision for publication on 2 October 2009.
DOI: 10.1243/09544054JEM1705
Abstract: This study investigates the effects of machining parameters on the surface integrity
of hard machined surfaces. The residual stress distribution of hard machined surfaces is
characterized by compressive stresses in the range between 150 and 1000 MPa. Typically,
residual stresses in the feed direction are more compressive above a depth of 12.7
mm, while
residual stresses in the cutting direction are more compressive below a depth of 12.7
mm. The
micro-hardness distribution of hard machined surfaces is characterized by a lower surface
hardness and a stable bulk hardness. It is noted that a higher cutting speed induces a more
softened layer. The machining-induced residual stress and micro-hardness distribution can
increase the crack initiation life by 39 per cent, while increasing the crack propagation life by
more than four times. Accordingly, it can increase the fatigue life by more than three times. The
results are presented that demonstrate that the machining parameters significantly influence
the residual stress and micro-hardness distribution of hard machined surfaces and that the
fatigue performance of hard machined surfaces can be significantly enhanced by optimizing
the machining parameters.
Keywords: hard machining, machining parameters, residual stresses, micro-hardness, fatigue
parameters
1 INTRODUCTION
Hard machining has been proposed as a replacement
for the abrasion-based superfinishing process, since
it reduces the number of processes, processing time,
material handling time, setup time, and equipment
cost while increasing system flexibility.
As a finishing process, hard machining demands a
detailed understanding of surface integrity; conse-
quently, it has not been widely implemented by
industry. Surface integrity, the inherited or altered
properties of a surface produced by machining or
other manufacturing processes, includes residual
stress, micro-hardness, surface finish, and micro-
structure. Ultimately, surface integrity determines
the service life of structural components.
Brinksmeier [1] reported that a larger depth of cut
induces larger compressive residual stresses on the
surface. It has also been noted that a larger in-feed
increases the depth of the affected zone and the level
of compressive residual stresses [2]. Matsumoto et al.
[3] demonstrated that tool edge geometry is the
dominant factor that determines the residual stress
profile. It was later noted that compressive residual
stresses can be increased by an optimal tool edge
geometry and an aggressive feed rate [4].
Residual stresses of a hard turned surface can be
changed to a better state by optimizing the second
cut [5]. Recently, Zhang et al. [6] demonstrated that a
model based on a back-propagation neural network
can predict residual stress profiles of hard turned
surfaces more accurately than the conventional lin-
ear regression method.
Thermal damage caused by hard machining mainly
refers to rehardening burn and over-tempered burn.
A rehardening burn, a hard martensitic layer,
is formed if austenite is formed by a high surface
*Corresponding author: Department of Mechanical and
Aerospace Engineering, Florida Institute of Technology,
Melbourne, FL 32901, USA.
email: choi@fit.edu
JEM1705
Proc. IMechE Vol. 224 Part B: J. Engineering Manufacture
699
temperature exceeding the eutectoid temperature
and then quenched by the cooler substrate. An over-
tempered burn, a softened layer, is formed if the
surface temperature exceeds the tempering tem-
perature
but
does
not
reach
the
eutectoid
temperature.
The rehardening burn layer is commonly called a
‘white layer’ due to its white appearance under an
optical microscope, created by its resistance to etch-
ing in contrast to a bulk material. A rehardening burn
layer was observed after cutting a steel of hardness 53
HRC using a ceramic chamfered tool, while this layer
was not visible in the case of machining with a sharp
tool [7, 8].
It has been reported that white layers are not
formed if tool wear is below 0.15 mm [9]. Tonshoff
et al. [10] investigated the alteration of the chemical
composition of ASTM 5115 steel when white layers
are produced by hard machining, and found no ele-
ment concentration transition from the over-tem-
pered layer to white layers.
A comprehensive study has been performed on the
effect of machining conditions on the formation of
white layers in hard machining [11–13]. Typically, the
white layer thickness increases as cutting speed, tool
flank wear, feed rate, or tool nose radius increases,
but decreases as the thermal conductivity of the
cutting tool or rake angle increases. Recently, it was
reported that a white layer forms whenever the aus-
tenitization temperature of the material is exceeded
on the machined surface [14].
Nakayama et al. [15] found that the surface finish
of hard machined surfaces is at least as good as that
of ground surfaces as a result of minimal plastic flow
and the absence of a built-up edge due to the high
hardness of the material. This finding was further
investigated in hard turning of AISI 52100 steel, and
surface finish was found to deteriorate with the
increase of tool flank wear [16].
Although general surface integrity factors of hard
machined surfaces have been investigated, the spe-
cific difference in fatigue parameters due to the sur-
face integrity induced by hard machining at various
machining parameters has not been explored.
Since the machining-induced residual stress and
micro-hardness distribution is a critical factor for
fatigue performance, the residual stress and micro-
hardness distribution below the hard machined sur-
face is investigated in this paper. The fatigue para-
meters are computed based on the residual stress
and micro-hardness distribution. The overall objec-
tive of this paper is two fold: to investigate the effect
of machining parameters on the residual stress and
micro-hardness distribution below hard machined
surfaces, and to investigate its effect on the rolling
contact fatigue performance.
2 EXPERIMENTAL
2.1 Specimen preparation
Specimens of through hardened AISI 1053 steel were
prepared for the experiment, since this steel is used
for bearing applications. The composition of AISI
1053 steel as specified by the manufacturer is given in
Table 1. Two types of specimens were prepared for
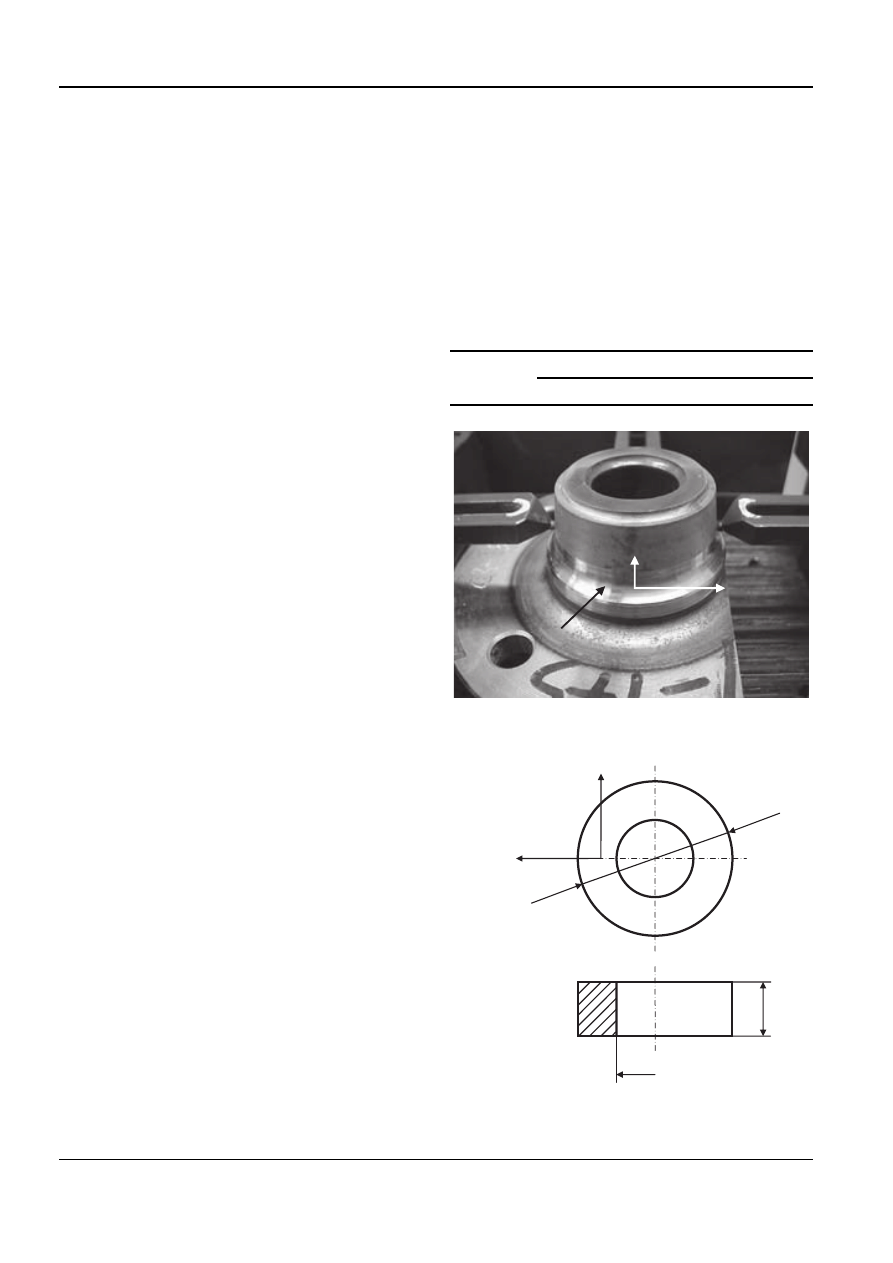
the experiment: a delta spindle (Fig. 1) and a disk
(Fig. 2).
Table 1
Composition (% by weight) of specimens
C
Mn
P
S
AISI 1053
0.48–0.55
0.70–1.00
0.04
0.05
Feed direction
Cutting direction
Dimensions in mm
Ø 16
7.
2
1
0
3
Fig. 2 Dimensions of disk
Bearing ball race
Circumferential direction
(Cutting direction)
Radial direction
(Feed direction)
Fig. 1 Delta spindle
Proc. IMechE Vol. 224 Part B: J. Engineering Manufacture
JEM1705
700
Y Choi and C R Liu
2.2 Machining parameters
The bearing ball race of the delta spindle and the flat
surface of the disk were machined by using a cubic
boron nitride tool. The machining parameters, such
as tool nose radius, tool chamfer angle, cutting speed,
feed rate, depth of cut, and coolant type, were selec-
ted according to Taguchi’s orthogonal array [17] that
was employed to evenly distribute the effect of
machining parameters on surface integrity.
Ten different combinations of machining para-
meters were determined, and the specimens were
numbered sequentially according to the combina-
tions of machining parameters (see Table 2).
This study aims to investigate the surface integrity
of the bearing ball race of the delta spindle, which is
used in automobile axles as a practical example. For
the micro-hardness measurement, the flat surface of
the disk was machined at the same machining para-
meters as the bearing ball race of the delta spindle.
2.3 Residual stress measurement
X-ray diffraction was used to measure the residual
stress distribution in the subsurface of the bearing ball
race of the delta spindle. A Denver-Proto XRD 3000
residual stress analyser was used with a CrK
a radiation
tube. The sin
2
c technique, which is elaborated by
Noyan and Cohen [18], was applied to compute the
residual stress value. Nine
c angles were used for the
computation:
20, 15, 10, 5, 0, 5, 10, 15, and 20
.
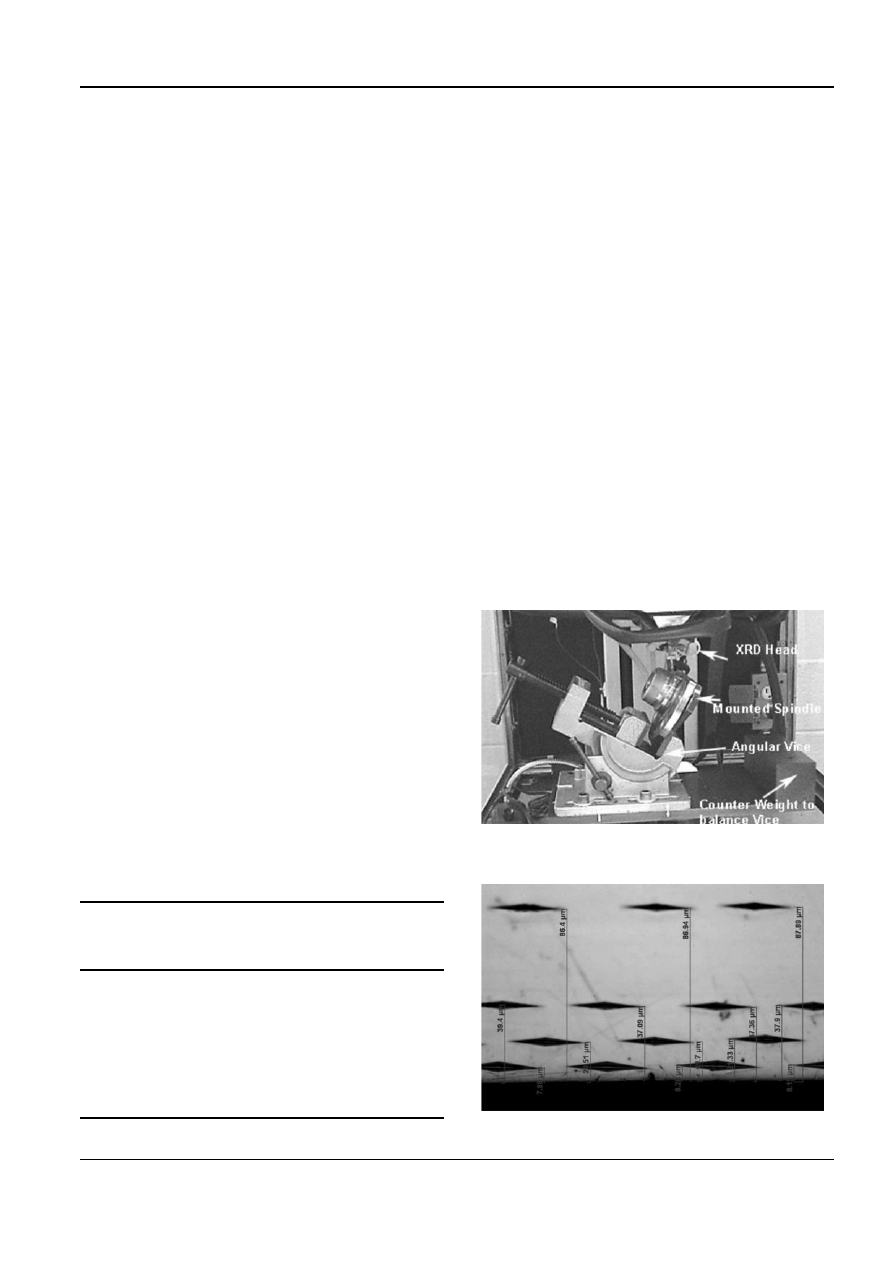
Residual stresses were measured in two directions:
circumferential and radial (Fig. 1). Figure 3 shows the
spindle setup for the residual stress measurement
[19]. Residual stresses were measured at the exposed
surface and five different depths: 5.08, 12.7, 25.4, 50.8,
and 127
mm.
A particular amount of a layer was removed with
the help of an electrolytic etcher, saturated NaCl
solution, to measure residual stresses at different
depths. Since pure NaCl leaves a patterned appear-
ance on the surface caused by a corrosive effect, a
little amount of soap was added to the electrolyte to
prevent this effect.
2.4 Micro-hardness measurement
A Leco hardness testing machine model M-400-H was
used for the micro-hardness measurement in the
subsurface of the flat surface of the disk. After the disk
was cut and polished for the measurements, its micro-
hardness was measured using a Knoop indenter with
a 100 g load, which is the largest load that creates a
clear reliable indentation close to the surface.
The measurements were taken at the depths of
8.89, 19.05, 38.1, and 88.9
mm. The average of eight
readings at the same depth was taken to be the final
measured value. To measure the distance of the
indentation from the surface accurately, a Zeiss
metallographic microscope was used (Fig. 4).
3 PREDICTION OF ROLLING CONTACT
FATIGUE LIFE
Since surface integrity is a critical factor for fatigue
performance, the rolling contact fatigue lives of
Table 2
Machining parameters
Specimen
Tool
nose
radius
(mm)
Tool
chamfer
angle
(degree)
Cutting
speed
(m/s)
Feed
rate
(mm/rev)
Depth
of cut
(mm)
Coolant
type
1
0.79
0
1.27
0.10
0.2
Dry
2
0.79
20
2.79
0.15
0.3
Air
3
1.59
20
1.27
0.10
0.1
MQL*
4
1.59
0
2.03
0.05
0.3
Air
5
0.79
15
1.27
0.05
0.2
Air
6
0.79
20
2.03
0.15
0.1
Dry
7
1.59
15
1.27
0.15
0.3
MQL*
8
1.59
0
2.79
0.05
0.1
Dry
9
4.76
0
2.03
0.15
0.2
MQL*
10
4.76
15
2.79
0.10
0.1
Air
* MQL
¼ Minimum quantity lubrication.
Fig. 4 Knoop indentations
Fig. 3 Spindle setup for residual stress measurement
JEM1705
Proc. IMechE Vol. 224 Part B: J. Engineering Manufacture
Effects of machining parameters on surface integrity
701

specimens are predicted by assuming that a ball
made from AISI 52100 steel is rolling on the bearing
ball race of the delta spindle under a properly lubri-
cated contact condition. The diameter of the ball is
3.69 mm with an axial load producing a maximum
Hertzian stress of 2724 MPa.
Rolling contact fatigue normally begins with
crack initiation in the subsurface for properly
lubricated conditions. The cracks propagate by a
continued rolling and reach the exposed surface.
Surface fragments are then dislodged, eventually
resulting in the formation of a spall on the surface.
This instance is generally defined as the initiation
of a fatigue spall.
To predict the initiation of a fatigue spall, Choi
and Liu [20] proposed models for crack initiation
life and crack propagation life, and verified the
models experimentally [21]. Liu and Choi [22] later
developed a crack initiation life model based on a
dislocation model, and found that this model
shows better accuracy than their previous model.
In this paper, the crack initiation life model, based
on a dislocation model [22], and the crack propa-
gation life model [20] are combined to predict the
fatigue life.
3.1 Crack initiation life model
The crack initiation life model was developed
based on a dislocation model [23]. Typically, sub-
surface cracks initiate from inclusions that intensify
the local stress [24–26]. The periphery of the
inclusion becomes strained, eventually initiating
cracks [27].
Since a fractographic examination of high-strength
steels has shown that the initiation sites for subsur-
face cracks are always inclusions located in the
interior of the material [28], it is assumed that a crack
initiates along the interface of the inclusion.
Based on a previous finding [29], the maximum
shear stress replaces the local shear stress in the
dislocation model. The crack initiation point is
assumed to be where the ratio of the maximum shear
stress to hardness is the highest, since the ratio of
critical stress to hardness has been generally taken as
the mechanical criterion of crack initiation in contact
fatigue cracks.
Accordingly, the crack initiation life model can be
written as
N
i
¼
I
Dt
max
2t
k
ð
Þ
2
ð1Þ
where N
i
is the number of loading cycles to crack
initiation, I the initiation constant,
Dt
max
the range of
maximum shear stress during a cycle at the initiation
point, and
t
k
is the frictional stress.
3.2 Crack propagation life model
The crack propagation life model was developed by
using the modified Paris’ formula [20]. Paris’ formula
[30], a formula that correlates the crack propagation
rate and the stress intensity factor range, was mod-
ified, since the crack propagation rate is influenced
by the local hardness [31].
The crack propagation life is calculated by inte-
grating the crack propagation rate from the initial
crack size to the final crack size. The final crack size is
derived from the crack size when the crack reaches
the surface. Accordingly, the crack propagation life
model can be written as
N
p
¼
Z
a
2
a
1
1
C
ðH
b
=H
l
Þ DK
ð
Þ
n
da
ð2Þ
where N
p
is the crack propagation life in loading
cycles, a
1
the half length of the initial crack size, a
2
the half length of the final crack size, C the material
constant, H
b
the Knoop hardness number at the bulk
material, H
l
the local Knoop hardness number,
DK
the stress intensity factor range at the leading tip, n
the slope index, and a is the half length of the crack.
3.3 Rolling contact fatigue life model
The crack initiation life model is combined with the
crack propagation life model to predict the fatigue
life as follows
N
¼
I
Dt
max
2t
k
ð
Þ
2
þ
Z
a
2
a
1
1
C
ðH
b
=H
l
Þ DK
ð
Þ
n
da
ð3Þ
where N is the fatigue life in loading cycles.
4 RESULTS AND DISCUSSION
4.1 Residual stresses
All the specimens showed compressive residual
stresses in the circumferential and radial directions.
The compressive residual stress ranged between 150
and 1000 MPa. Typically, residual stresses in the
radial direction (feed direction) were more com-
pressive than those in the circumferential direction
(cutting direction) above a depth of 12.7
mm. How-
ever, residual stresses in the circumferential direction
were more compressive than those in the radial
direction below a depth of 12.7
mm.
The residual stresses of some specimens showed
an appreciable difference between circumferential
and radial directions, especially around the surface.
However, residual stresses of other specimens
showed a similar magnitude between circumferential
Proc. IMechE Vol. 224 Part B: J. Engineering Manufacture
JEM1705
702
Y Choi and C R Liu
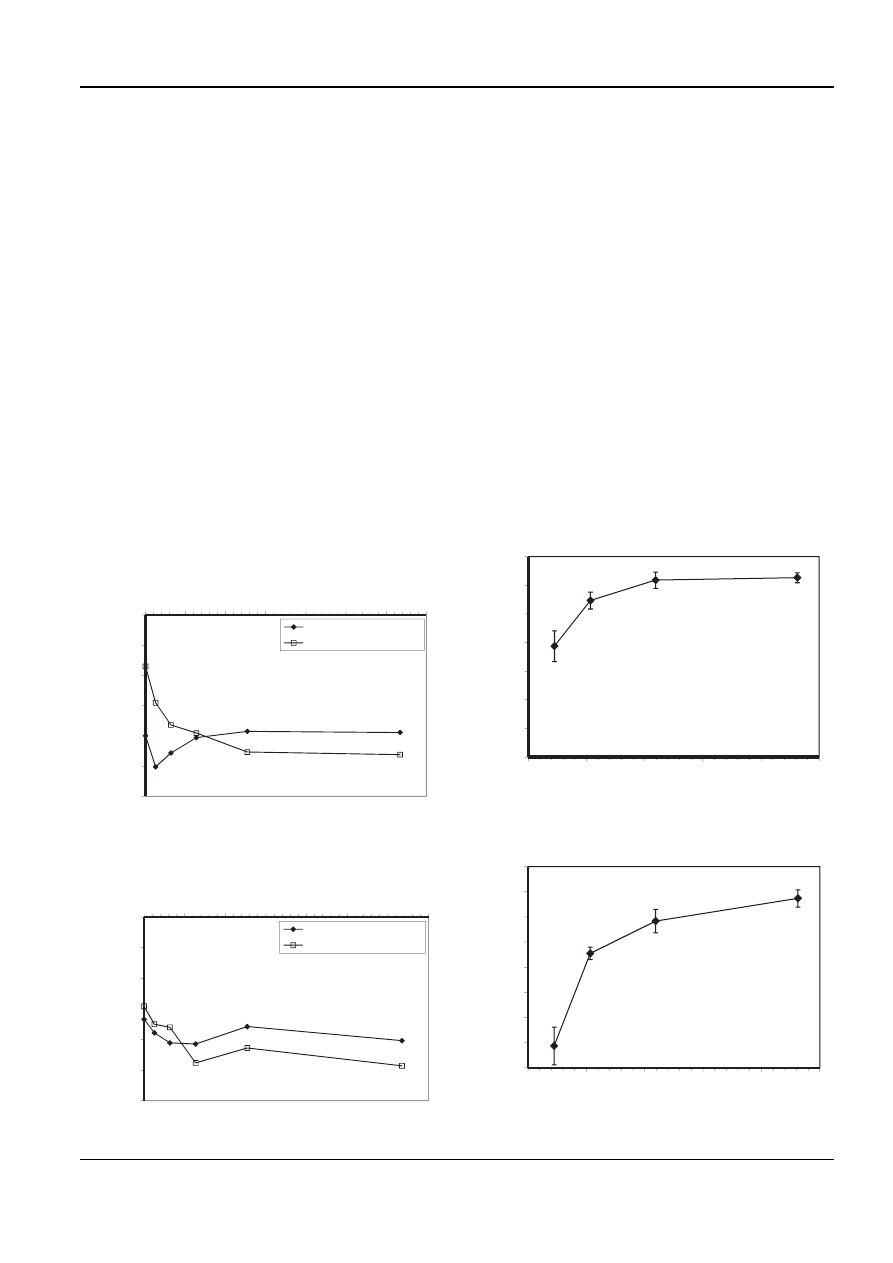
and radial directions. The residual stress distribu-
tions of specimens 2 and 8 are shown in Figs 5 and 6.
4.2 Micro-hardness
All the specimens showed a softened layer below the
machined surface due to the formation of an over-
tempered burn. The micro-hardness distributions
were characterized by a lower surface hardness
(650–850 HK
100
)
and
stable
bulk
hardness
(900–950 HK
100
). The micro-hardness distributions of
specimens 3 and 10 are shown in Figs 7 and 8. The
error bars in the figure represent one standard
deviation higher and lower than each average value.
Specimens 2, 8, and 10 showed a more softened
layer than other specimens. The machining para-
meters for specimens 2, 8, and 10 indicate that the
cutting speed for those specimens is higher than
other specimens. This can be accounted for by the fact
that a higher cutting speed induces higher tempera-
tures, which result in a more severe over-tempered
burn.
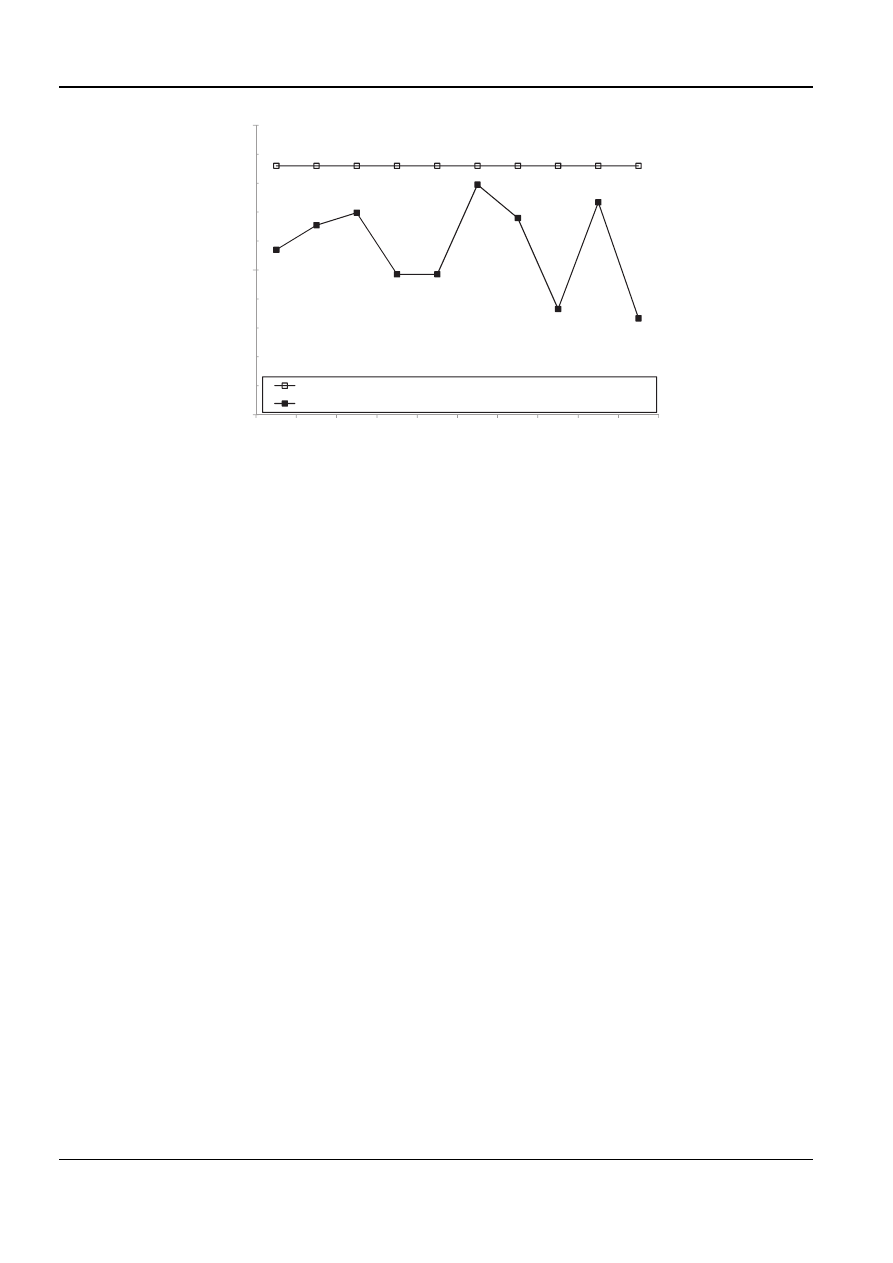
4.3 Crack initiation depth
The crack initiation depth was computed based on
the residual stress and micro-hardness distribu-
tion. It was computed before the machining-
induced residual stress and micro-hardness dis-
tribution was taken into account and then again
afterwards. The computed crack initiation depths
are shown in Fig. 9.
The crack initiation depth is changed to a shal-
lower location after the machining–induced residual
stress and micro-hardness distribution is taken into
account, since a softened layer moves the crack
initiation
depth
shallower.
Depending
on
the
machining parameters, the crack initiation depth
varies between 13.3 and 17.9
mm, while the crack
initiation depth was 18.6
mm before the machining-
induced residual stress and micro-hardness dis-
tribution was taken into account.
The effect of the machining-induced residual stress
and micro-hardness distribution on crack initiation
-1200
-1000
-800
-600
-400
-200
0
0
20
40
60
80
100
120
140
)
a
P
M(
s
s
er
t
S l
a
u
di
s
e
R
Depth (
µm)
Circumferential Direction
Radial Direction
Fig. 6 Residual stress distribution of specimen 8
-1200
-1000
-800
-600
-400
-200
0
0
20
40
60
80
100
120
140
)
a
P
M(
s
s
er
t
S l
a
u
di
s
e
R
Depth (
µm)
Circumferential Direction
Radial Direction
Fig. 5 Residual stress distribution of specimen 2
600
650
700
750
800
850
900
950
0
20
40
60
80
100
K
H(
s
s
e
n
dr
a
h
p
o
o
n
K
0
0
1
)
Depth (
µm)
Fig. 7 Micro-hardness distribution of specimen 3
600
650
700
750
800
850
900
950
1000
0
20
40
60
80
100
K
H(
s
s
e
n
dr
a
h
p
o
o
n
K
0
0
1
)
Depth (
µm)
Fig. 8 Micro-hardness distribution of specimen 10
JEM1705
Proc. IMechE Vol. 224 Part B: J. Engineering Manufacture
Effects of machining parameters on surface integrity
703
depth is shown to be highly variable depending on
the machining parameters. The crack initiation depth
is a critical factor for the fatigue performance, since
the crack initiation depth determines the initial spall
size and the crack propagation length required to
reach the exposed surface.
The initial spall size determines the number of
continued loading cycles required to increase the
spall size until the final failure, and the crack propa-
gation life is dependent on the crack propagation
length required to reach the exposed surface under
an identical stress condition.
4.4 Maximum shear stress at crack
initiation depth
The maximum shear stress at crack initiation depth
was computed. First, it was computed before the
machining-induced
residual
stress
and
micro-
hardness distribution was taken into account and
then computed afterwards. See Fig. 10 for the max-
imum shear stresses at crack initiation depth.
The maximum shear stress is reduced after the
machining-induced residual stress and micro-hard-
ness distribution is taken into account. Depending on
the machining parameters, the maximum shear
stress varies between 762.4 and 797.0 MPa, while the
maximum shear stress was 853.8 MPa before the
machining-induced residual stress and micro-hard-
ness distribution was taken into account.
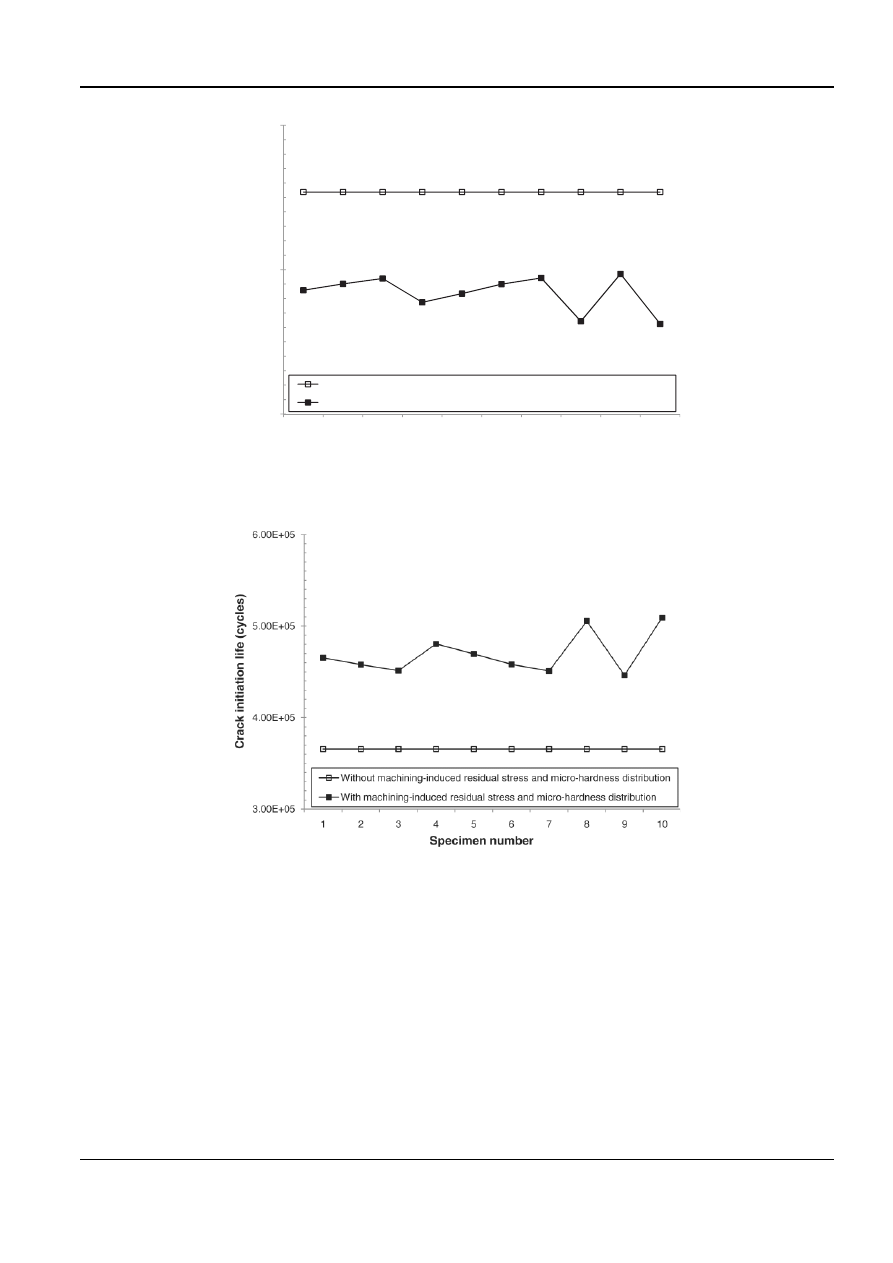
4.5 Crack initiation life
The crack initiation life was predicted by using
the crack initiation life model. It was predicted before
the machining-induced residual stress and micro-
hardness distribution was taken into account and
then again afterwards. Figure 11 shows the predicted
crack initiation lives.
The crack initiation life increases after the
machining-induced residual stress and micro-hard-
ness distribution is taken into account. Depending on
the machining parameters, the crack initiation life
varies between 4.46
· 10
5
and 5.09
· 10
5
cycles, while
the crack initiation life was 3.66
· 10
5
cycles before
the machining-induced residual stress and micro-
hardness distribution was taken into account:
the machining-induced residual stress and micro-
hardness distribution can increase the crack initia-
tion life by 39 per cent.
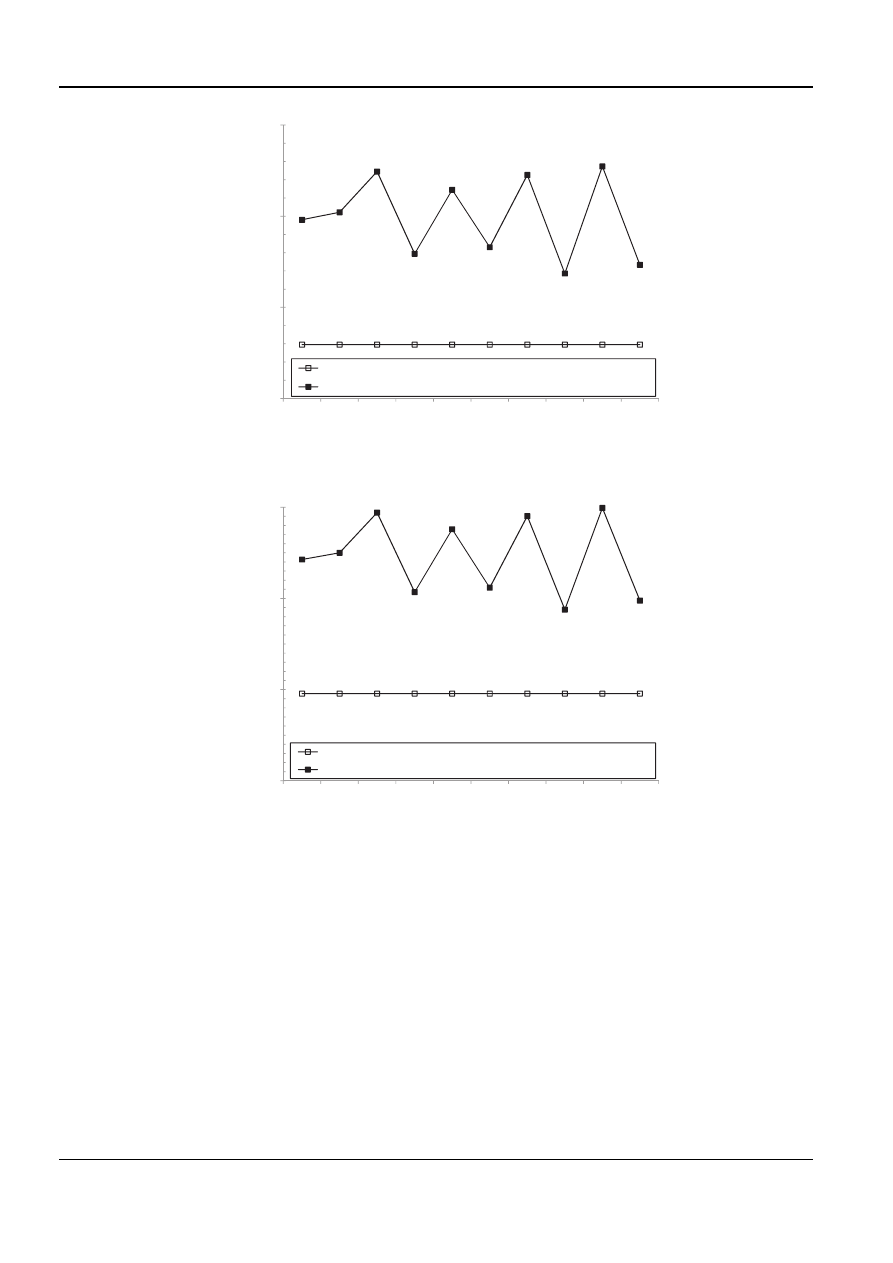
4.6 Crack propagation life
The crack propagation life was predicted by using the
crack propagation life model. It was predicted before
the machining-induced residual stress and micro-
hardness distribution were taken into account and
then again afterwards. The predicted crack propaga-
tion lives are shown in Fig. 12.
The crack propagation life increases after the
machining-induced residual stress and micro-hard-
ness distribution are taken into account. This can be
accounted for by the fact that the crack propagation
takes place at a shallower location where the stress
value is lower.
Depending on the machining parameters, the
crack propagation life varies between 1.37
· 10
6
and
2.55
· 10
6
cycles, while the crack propagation life was
5.91
· 10
5
cycles before the machining-induced resi-
dual stress and micro-hardness distribution was
taken into account: the machining-induced residual
10
15
20
1
2
3
4
5
6
7
8
9
10
)
m
µ(
ht
p
e
d
n
oi
t
ai
ti
ni
k
c
ar
C
Specimen number
Without machining-induced residual stress and micro-hardness distribution
With machining-induced residual stress and micro-hardness distribution
Fig. 9 Crack initiation depth comparison
Proc. IMechE Vol. 224 Part B: J. Engineering Manufacture
JEM1705
704
Y Choi and C R Liu
stress and micro-hardness distribution can increase
the crack propagation life by more than four times.
4.7 Rolling contact fatigue life
The rolling contact fatigue life was predicted by using
the rolling contact fatigue life model: both before and
after the machining-induced residual stress and
micro-hardness distribution were taken into account.
The predicted fatigue lives are shown in Fig. 13. Since
the predicted fatigue life is the sum of crack initiation
life and crack propagation life, it is lower than a
general fatigue life, which includes crack initiation
life, crack propagation life, and spall progression life
[32].
The fatigue life increases after the machining-
induced residual stress and micro-hardness dis-
tribution are taken into account. Depending on
the machining parameters, the fatigue life varies
between 1.88
· 10
6
and 2.99
· 10
6
cycles, while the
fatigue life was 9.56
· 10
5
cycles before the machin-
ing-induced residual stress and micro-hardness dis-
tribution were taken into account: the machining-
induced residual stress and micro-hardness dis-
tribution can increase the fatigue life by more than
three times.
700
800
900
1
2
3
4
5
6
7
8
9
10
)
a
P
M(
s
s
er
t
s
r
a
e
h
s
m
u
mi
x
a
M
Specimen number
Without machining-induced residual stress and micro-hardness distribution
With machining-induced residual stress and micro-hardness distribution
Fig. 10 Maximum shear stress comparison
Fig. 11 Crack initiation life comparison
JEM1705
Proc. IMechE Vol. 224 Part B: J. Engineering Manufacture
Effects of machining parameters on surface integrity
705
The variation of the fatigue life depending on the
machining parameters closely matches that of the
crack propagation life. This can be accounted for by
the fact that the crack propagation life covers a
greater portion of the fatigue life and varies more
significantly depending on the machining para-
meters than the crack initiation life.
The results demonstrate that the machining para-
meters significantly influence the residual stress and
micro-hardness distribution of hard machined sur-
faces and thus the fatigue life, which indicates that
the fatigue performance of hard machined surfaces
can be significantly enhanced by optimizing the
machining parameters.
5 CONCLUSIONS
This paper investigates the effect of machining
parameters on the residual stress and micro-hard-
ness distribution below hard machined surfaces
and its effect on the rolling contact fatigue per-
formance. The residual stress and micro-hardness
distribution below the hard machined surface was
measured. The fatigue parameters were then
computed based on the residual stress and micro-
hardness distribution. Based on the residual stress
and micro-hardness measurement and the com-
putation of fatigue parameters, the following con-
clusions can be drawn.
0.00E+00
1.00E+06
2.00E+06
3.00E+06
1
2
3
4
5
6
7
8
9
10
)
s
el
c
y
c(
efi
l
n
oi
t
a
g
a
p
or
p
k
c
ar
C
Specimen number
Without machining-induced residual stress and micro-hardness distribution
With machining-induced residual stress and micro-hardness distribution
Fig. 12 Crack propagation life comparison
0.00E+00
1.00E+06
2.00E+06
3.00E+06
1
2
3
4
5
6
7
8
9
10
)
s
el
c
y
c(
efi
l
e
u
gi
t
af
t
c
at
n
o
c
g
nil
l
o
R
Specimen number
Without machining-induced residual stress and micro-hardness distribution
With machining-induced residual stress and micro-hardness distribution
Fig. 13 Rolling contact fatigue life comparison
Proc. IMechE Vol. 224 Part B: J. Engineering Manufacture
JEM1705
706
Y Choi and C R Liu

1. The residual stress distributions of hard machined
specimens showed compressive stresses in the
range between 150 and 1000 MPa. Residual stres-
ses in the feed direction were typically more
compressive above a depth of 12.7
mm, while
residual stresses in the cutting direction were
more compressive below a depth of 12.7
mm.
2. Specimens machined at a higher cutting speed
showed a more softened layer than other speci-
mens, since a higher cutting speed induces higher
temperatures, resulting in a more severe over-
tempered burn.
3. The machining-induced residual stress and micro-
hardness distribution moved the crack initiation
depth to a shallower location and reduced the
maximum shear stress at crack initiation depth.
4. The machining-induced residual stress and micro-
hardness distribution could increase the crack
initiation life by 39 per cent, while increasing the
crack propagation life by more than four times.
Accordingly, it could increase the fatigue life by
more than three times.
5. The results demonstrate that the machining para-
meters significantly influence the residual stress
and micro-hardness distribution of hard machined
surfaces and induce a highly variable change in
fatigue parameters, which indicates that the fatigue
performance of hard machined surfaces can be
enhanced significantly by optimizing the machin-
ing parameters.
Authors 2010
REFERENCES
1 Brinksmeier, E. Residual stresses in hard metal cutting.
In Proceedings of the Conference on Residual stresses
in science and technology, Garmisch-Partenkirchen,
Germany, 1–3 June 1986, pp. 839–846 (DGM Metallurgy
Information, Oberursel, Germany).
2 K
€onig, W., Klinger, M., and Link, R. Machining hard
materials with geometrically defined cutting edges –
field of applications and limitations. Ann. CIRP, 1990,
39(1), 61–64.
3 Matsumoto, Y., Hashimoto, F., and Lahoti, G. Surface
integrity generated by precision hard turning. Ann.
CIRP, 1999, 48(1), 59–62.
4 Hua, J., Umbrello, D., and Shivpuri, R. Investigation of
cutting conditions and cutting edge preparations for
enhanced compressive subsurface residual stress in the
hard turning of bearing steel. J. Mater. Process. Technol.,
2006, 171(2), 180–187.
5 Liu, C. R. and Guo, Y. B. Finite element analysis of the
effect of sequential cuts and tool-chip friction on resi-
dual stresses in a machined layer. Int. J. Mech. Sci., 2000,
42, 1069–1089.
6 Zhang, J. Y., Liang, S. Y., Zhang, G., and Yen, D. Mod-
eling of residual stress profile in finish hard turning.
Mater. Mfg Process., 2006, 21, 39–45.
7 Matsumoto, Y., Barash, M. M., and Liu, C. R. Residual
stress in the machined surface of hardened steel.
In
High
speed
machining
(Eds
Komanduri,
R.,
Subramanian, K., and Von Turkovich, B. F.), 1984,
pp. 193–204 (ASME, NewYork).
8 Matsumoto, Y., Barash, M. M., and Liu, C. R. Cutting
mechanism during machining of hardened steel. Mater.
Sci. Technol., 1987, 3, 299–305.
9 Ogata, M. Einsatz von PCBN – werkzeugen in der pro-
duction. VDI Berichie, 1989, 762, 261–269.
10 Tonshoff, H. K., Wobker, H. G., and Brandt, D. Hard
turning – influences on the workpiece properties. Trans.
NAMRI/SME, 1995, 23, 215–220.
11 Wang, J. Y. and Liu, C. R. A new concept for decoupling
the cutting forces due to tool flank wear and chip for-
mation in hard turning. J. Machining Sci. Technol., 1998,
2(1), 77–90.
12 Wang, J. Y. and Liu, C. R. On the forces and tempera-
tures due to flank wear in hard turning. Mfg Sci. Engng,
1998, 8, 161–169.
13 Wang, J. Y. and Liu, C. R. Effect of tool flank wear on the
heat transfer, thermal damage and cutting mechanics in
finish hard turning. Ann. CIRP, 1999, 48(1), 80–83.
14 Guo, Y. B. and Janowski, G. M. Microstructural char-
acterization of white layers by hard turning and grind-
ing. Trans. NAMRI/SME, 2004, 32, 367–374.
15 Nakayama, K., Aria, M., and Kanda, T. Machining
characteristics of hard materials. Ann. CIRP, 1988, 37(1),
89–92.
16 Davies, M. A., Chou, Y., and Evans, C. J. On chip mor-
phology, tool wear, cutting mechanics in finish hard
turning. Ann. CIRP, 1996, 45(1), 77–82.
17 Taguchi, G. Taguchi on robust technology development –
bringing quality engineering upstream, 1993 (ASME
Press, New York).
18 Noyan, I. C. and Cohen, J. B. Residual stress – mea-
surement
by
diffraction
and
interpretation,
1987
(Springer-Verlag, New York).
19 Shunmugam, R. Application of Taguchi methods for
cutting parameters selection in hard turning. M.S.
Thesis, Purdue University, 2004.
20 Choi, Y. and Liu, C. R. Rolling contact fatigue life of
finish hard machined surfaces – part 1. model devel-
opment. Wear, 2006, 261, 485–491.
21 Choi, Y. and Liu, C. R. Rolling contact fatigue life of
finish hard machined surfaces – part 2. experimental
verification. Wear, 2006, 261, 492–499.
22 Liu, C. R. and Choi, Y. A new methodology for pre-
dicting crack initiation life for rolling contact fatigue
based on dislocation and crack propagation. Int. J.
Mech. Sci., 2008, 50, 117–123.
23 Tanaka, K. and Mura, T. Dislocation model for fatigue
crack initiation. J. Appl. Mech., 1981, 48, 97–103.
24 Kaynak, C., Ankara, A., and Baker, T. J. Initiation and
early growth of short fatigue cracks at inclusions. Mater.
Sci. Technol., 1996, 12, 421–426.
25 Melander, A. A finite element study of short cracks with
different inclusion types under rolling contact fatigue
load. Int. J. Fatigue, 1997, 19, 13–24.
26 Nelias, D., Dumont, M. L., Champiot, F., Vincent, A.,
Girodin, D., Fougeres, R., and Flamand, L. Role of
JEM1705
Proc. IMechE Vol. 224 Part B: J. Engineering Manufacture
Effects of machining parameters on surface integrity
707

inclusions, surface roughness and operating conditions
on rolling contact fatigue. J. Tribology, 1999, 121, 240–251.
27 Harris, T. A. Rolling bearing analysis, 2001 (Wiley-
Interscience, New York).
28 Wang, Q. Y., Bathias, C., Kawagoishi, N., and Chen, Q.
Effect of inclusion on subsurface crack initiation
and gigacycle fatigue strength. Int. J. Fatigue, 2002, 24,
1269–1274.
29 Leng, X., Chen, Q., and Shao, E. Initiation and propa-
gation of case crushing cracks in rolling contact fatigue.
Wear, 1988, 122, 33–43.
30 Paris, P. and Erdogan, F. A critical analysis of crack
propagation laws. J. Basic Engng, 1963, 85, 528–534.
31 Chen, Q., Leng, X., and Shao, E. Influence of micro-
structure and residual stress on the stages of case
crushing. Wear, 1988, 122, 45–55.
32 Choi, Y. and Liu, C. R. Spall progression life model for
rolling contact verified by finish hard machined sur-
faces. Wear, 2007, 262, 24–35.
Proc. IMechE Vol. 224 Part B: J. Engineering Manufacture
JEM1705
708
Y Choi and C R Liu
Wyszukiwarka
Podobne podstrony:
Modeling the Effects of Timing Parameters on Virus Propagation
Effect of surface finish on the osseointegration of laser
Biochemical Effects of Lead Exposure on Systolic & Diastolic Blood Pressure, Heme Biosynthesis and H
Effect of Kinesio taping on muscle strength in athletes
53 755 765 Effect of Microstructural Homogenity on Mechanical and Thermal Fatique
Effect of File Sharing on Record Sales March2004
31 411 423 Effect of EAF and ESR Technologies on the Yield of Alloying Elements
Effect of?renaline on survival in out of hospital?rdiac arrest
Effects of the Great?pression on the U S and the World
Effects of the Atomic Bombs Dropped on Japan
1 Effect of Self Weight on a Cantilever Beam
effect of varying doses of caffeine on life span D melanogaster
Possible Effects of Strategy Instruction on L1 and L2 Reading
Effect of magnetic field on the performance of new refrigerant mixtures
76 1075 1088 The Effect of a Nitride Layer on the Texturability of Steels for Plastic Moulds
effect of AVR on survival
Effect of caffeine on fecundity egg laying capacity development time and longevity in Drosophila
Effect of caffeine on short hole borer beetle
więcej podobnych podstron