
Journal of Chromatography A, 845 (1999) 337–347
Influence of extraction parameters and medium on efficiency of
solid-phase microextraction sampling in analysis of aliphatic
aldehydes
´
*
´
´
Agnes Keszler , Karoly Heberger
Institute of Chemistry
, Chemical Research Center, Hungarian Academy of Sciences, P.O. Box 17, H-1525 Budapest, Hungary
Abstract
The main sorption conditions were optimized in the solid-phase microextraction (SPME) analysis of aldehydes that have
different degrees of saturation. Aliphatic aldehydes were analyzed quantitatively in oil matrix and in aqueous solution by
GC–MS using SPME sampling. The effectiveness of the immersion and the headspace techniques was compared in water.
Samples were analyzed by gas chromatography with mass spectral detection using a medium polar CP WAX 52 CB column.
The optimal exposure time was 30 min at 408C using a 100 mm poly(dimethylsiloxane) coating. A ratio of liquid to
headspace volume of 1:1 resulted in the best extraction in headspace analysis. Principal component analysis (PCA) was
carried out to find similarities among various aldehydes and among conditions of optimization. The PCA identifies three
clusters corresponding to analysis conditions (immersion in water, headspace above water and headspace above oil). The
aldehydes behave similarly with the exception of dienals.
1999 Elsevier Science B.V. All rights reserved.
Keywords
: Solid phase microextraction; Extraction methods; Principal component analysis; Headspace analysis; Aldehydes
1. Introduction
fiber and the solution or the headspace. Analytes are
not completely extracted from the matrix. Recovery
Since solid-phase microextraction (SPME) is
depends on the partitioning of the analytes among
based on the partitions of the analyte in the solution,
the two or three phases present in the sampling vial.
in the headspace of the sample and in the coating of
Quantification is based on the determination of the
the fiber, the efficiency of the extraction depends on
sorbed amount of solute in the coating of the fiber
all the parameters of the equilibrium processes.
[2,4]. SPME can be optimized by properly selecting
SPME has been developed in 1989–1992 for the fast
the type of the fiber coating, the sampling time, the
and easy analysis of volatile and semivolatile com-
temperature of the extraction, and the ratio of liquid
pounds being present in water [1–3]. In the process
to headspace volume in case of headspace sampling
of this method a direct extraction and sorption of the
[5].
analyte from a solution or from the headspace over
A rapid and simple method was introduced for
the solution take place followed by a desorption step
quantification of volatile aliphatic aldehydes in sun-
into the injector of the gas chromatograph. The
flower oil in our earlier works [6,7]. Headspace
principle of SPME is an equilibrium partitioning
SPME sampling technique combined with ion trap
process of the solute between the coating of a silica
GC–MS analysis was found to be satisfactory for
detection and quantitation of volatile components
*Corresponding author.
with carbon chain up to C
in vegetable oils. Use of
11
0021-9673 / 99 / $ – see front matter
1999 Elsevier Science B.V. All rights reserved.
P I I : S 0 0 2 1 - 9 6 7 3 ( 9 9 ) 0 0 3 3 2 - 5

´
´
338
A
. Keszler, K. Heberger / J. Chromatogr. A 845 (1999) 337 –347
library search can confirm the identity of certain
different response factors and various partition con-
compounds. Carryover from the SPME fiber has
stants every parameter was optimized for each
been eliminated by heating the fiber in the injection
individual component. No tendency or comparison
port of the gas chromatograph between two runs.
was studied in the series of the aldehydes.
Distribution constants of aliphatic aldehydes with
different degrees of saturation were determined at
fixed sampling parameters. Moreover, depletion of
2. Experimental
the analyte was examined by repeated extraction
from the same vial as well.
2.1. Materials
The well known methods for the determination of
volatile content of vegetable oils are the injection of
2-Heptenal, 2-octenal, 2-nonenal, 2-decenal, 2-un-
an aliquot of the headspace over the oil [8], by
decenal, trans
,trans-2,4-heptadienal, trans,trans-2,4-
purging all volatiles from the oil itself [9], or the
octadienal, trans
,trans-2,4-nonadienal, trans,trans-
purge and trap technique [10] when the volatiles are
2,4-decadienal and the specially refined sunflower oil
purged from the oil under mild conditions before
[6] were obtained from Unilever, Vlaardingen,
injecting into the gas chromatograph. Applying the
Netherlands. Heptanal, octanal and nonanal were
two former methods the oil being exposed to heat
Sigma products.
can be oxidized during the analysis, while the purge
and trap technique is rather expensive, complex and
2.2. Conditions
needs long analysis time. Because of the quickness,
the simplicity and the low cost SPME can be an
Samples for SPME optimization were prepared by
advantageous sampling technique in the analysis of
spiking 20 ng / ml of a mixture of all aldehydes into
volatile compounds.
the sunflower oil and into distilled water. Individual
Principal component analysis (PCA) [11–13] is an
solutions of 20 ng / ml heptanal and 2-undecenal in
important tool to analyze large data tables to extract
sunflower oil were prepared as well.
additional information not otherwise assessable. The
For SPME sampling 7 mm and 100 mm poly(di-
optimization conditions, the response factors charac-
methylsiloxane) fibers (Supelco) and 6 ml volume
teristic to the apparatus and the equilibrium process
screw-cap vials with silicone septum covered by TFE
of partition can be arranged easily in a matrix form.
liner were used. For headspace gas sampling by
The various aldehydes are ordered in rows, whereas
SPME the septum of the vial was pierced in the
the columns correspond to the response factors at
center to facilitate the insertion of the SPME needle.
different sampling time, different temperature, ratio
The vial was immersed into an ultrathermostate
of headspace and bulk material volume, and type of
heated to the sorption temperature. Then the SPME
analysis (e.g. immersion, etc.).
needle was pushed into the septum surface and the
The first aim of present work was to study the
fiber was depressed by the plunger. The end of the
influence of the size of fiber coating, of the sampling
fiber was about 1 cm above the surface of the liquid
time, of the temperature and of the ratio of liquid to
phase. For immersion SPME experiments the vials
headspace volume on the efficiency of extraction of
were completely filled by aqueous solutions of
aliphatic aldehydes from sunflower oil and from
aldehydes. After the sorption time the fiber was
water. As a second aim we seek regularities by
retracted into the needle and the holder was with-
subjecting the quantitative results to PCA. The
drawn followed by the insertion of the needle into
measured aldehyde levels were expressed in ion
the injector of the gas chromatograph. The fiber was
counts which depend on the response factor of the
extended by the plunger and the analysis program
detector and on the partition coefficients of the
started. After 1 min desorption time at 2208C the
solutes (both types of characteristics have been
fiber was retracted, then the needle was removed
determined previously [7]). This way, any influence
from the injection port.
of the recoveries could also be determined by PCA.
For reducing the tailing effect [5,14] a narrow
To exclude any misinterpretation coming from the
(0.75 mm I.D.) inlet liner was applied. The tailing of

´
´
A
. Keszler, K. Heberger / J. Chromatogr. A 845 (1999) 337 –347
339
peaks could be completely eliminated in case of
principal components are orthogonal (independent).
fairly high boiling compounds. A remarkable reduc-
Further on, they are ordered in such a way that the
tion was achieved at low boiling analytes. After
variance of the first principal component is the
every run the SPME fiber was conditioned for 30
greatest, the variance of the second is smaller, and so
min at 2208C in the injector of the gas chromato-
on, whereas that of the last one is the smallest. The
graph followed by a blank analysis to exclude the
solution is achieved by an eigenvalue calculation.
memory effect of the fiber.
The columns of data matrices are intercorrelated,
The analysis was performed by a Finnigan MAT
i.e. the data are redundant. The method of PCA
GCQ GC–MS apparatus having a quadrupole ion-
[11–13] makes use of the intercorrelations by start-
trap mass analyzer. The separation has been carried
ing from the correlation matrix of the variables, and
out on a 30 m long CP WAX 52CB (ChromPack)
it eliminates the redundancy from the data.
column with 0.25 mm I.D. and 0.25 mm film
A basic assumption in the use of PCA is that the
thickness. Column temperature setting was pro-
score and loading vectors corresponding to the
grammed from 408C with 48C / min increase rate up
largest eigenvalues contain the most useful infor-
to 1608C (hold for 5 min), followed by a 208C / min
mation relating to a specific problem and that the
increase rate to 2108C (hold for 10 min). The carrier
remaining ones comprise mainly the noise, i.e. for a
gas was helium with 35 cm / s constant linear ve-
practical problem it is sufficient to retain only a few
locity. Splitless injection was used.
components accounting for a large percentage of the
Mass spectral detection was taken in electronim-
total variance [11].
1
pact (EI ) mode at 70 eV ionization energy both by
full scan (in 10–650 amu mass range) and in
selected ion monitoring (SIM) modes with 0.5 s /
3. Results and discussion
scan velocity and an acquisition treshold50. The
temperatures of the ion source and of the transfer
The sorbed masses of the aldehydes were com-
line were 1608C and 2208C, respectively. Com-
pared after headspace SPME sampling in the case of
pounds were identified after detecting spectra by full
sunflower oil and water matrices, and from aqueous
scan mode. Peak areas were determined from single
solution by immersion SPME. The reproducibility of
ion chromatograms of the most intensive ions of
headspace sampling was found to be RSD519%,
1
certain components (i.e. m /z 581 in case of dienals
calculated from 12 runs [7]. RSD means the relative
and 41 for the other aldehydes). Retention times of
standard deviation of the values of detected analyte
certain analytes were obtained from the proper full
level. The average error in SPME method [18] can
scan measurements. The detection limit was reduced
be characterized by RSD52.5–37%.
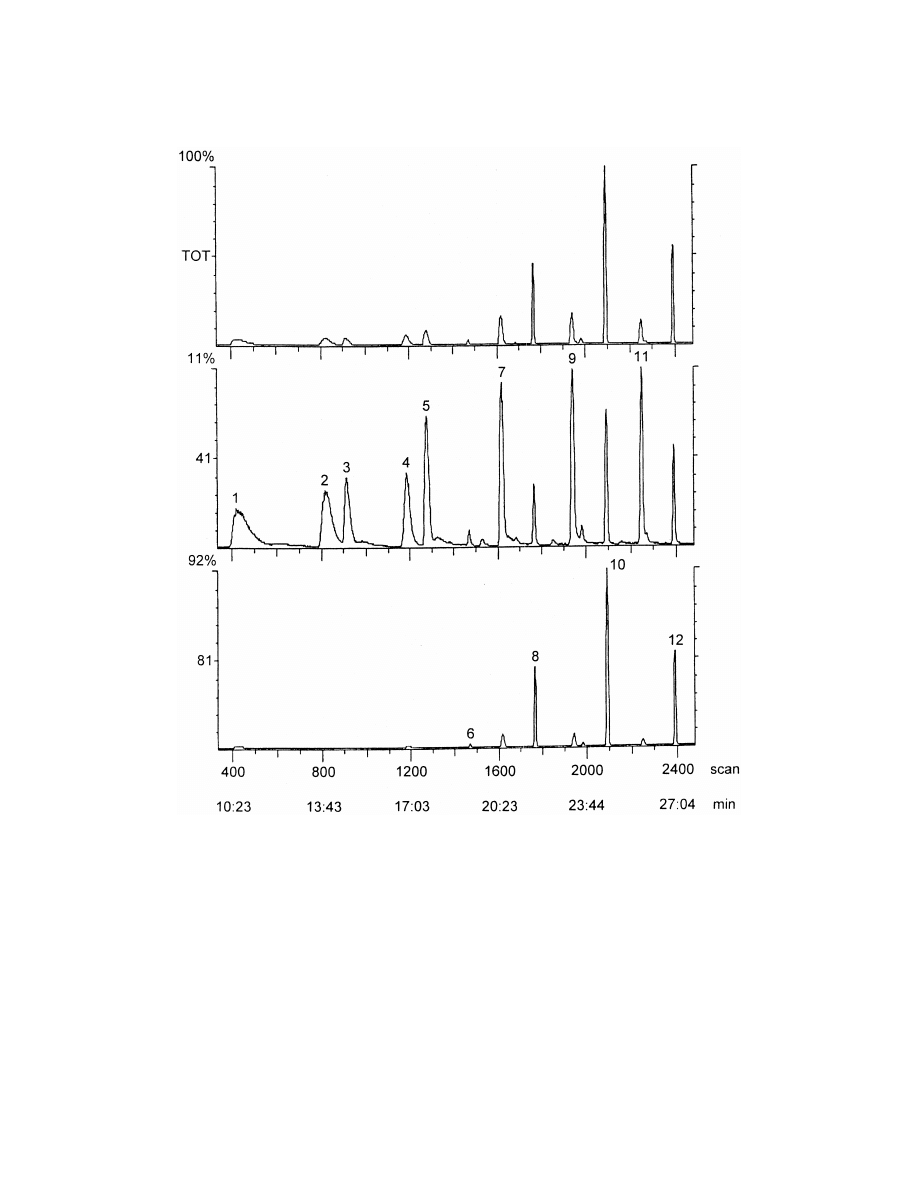
by using SIM method [15] and a fairly articulated
There were indications [16] that in case of multi-
chromatogram could be obtained as it is demon-
component systems a competition can be observed
strated in Fig. 1.
for the active places of the coating of the SPME
fiber. By increasing extraction time the higher-boil-
2.3. Principles of PCA
ing compounds might displace the previously sorbed
lower-boiling ones. The sorbed quantities of the
In the course of defining principal components the
low-boiling heptanal (t 510.75 min) and the high-
ret
original variables are transformed into new ones. The
boiling 2-undecenal (t 529.33 min) were deter-
ret
principal components are, in fact, linear combina-
mined from individual solutions and from aldehyde
tions of the original variables. Their values are the
mixtures using sunflower oil matrix to make clear the
component scores. The linear coefficients are called
existence of the mentioned displacing effect.
the component score coefficients. The linear co-
efficients of the inverse relation are the loadings, i.e.
3.1. Effect of the size of the fiber
the correlation coefficients between the original
variables and the principal components. The algo-
The molecular weight and the polarity of the
rithms for PCA can be found in ref. [11]. The
analyte determine the type of the fiber coating used
´
´
340
A
. Keszler, K. Heberger / J. Chromatogr. A 845 (1999) 337 –347
Fig. 1. Total ion chromatogram of aliphatic aldehydes by headspace SPME sampling from water matrix in selected ion monitoring mode. 1:
heptanal, 2: octanal, 3: heptenal, 4: nonanal, 5: octenal, 6: heptadienal, 7: nonenal, 8: octadienal, 9: decenal, 10: nonadienal, 11: undecenal,
12: decadienal.
[5]. Poly(dimethylsiloxane) coating is recommended
semivolatile) compounds can be more effectively
for analysis of medium polar compounds, while
extracted with a 7 mm coating. In our case both the
polyacrylate coated fiber is suggested to extract very
molecular weights and the volatilities of the analytes
polar analytes from polar matrix. Low molecular
are rather different, therefore the size of the fiber
weight or volatile compounds usually require a 100
coating should be optimized. SPME sampling was
mm fiber coating. Larger molecular weight (or
performed using 7 mm and 100 mm poly(di-

´
´
A
. Keszler, K. Heberger / J. Chromatogr. A 845 (1999) 337 –347
341
Table 1
2
Sorbed masses of aldehydes (given in ion counts, 10 ) by headspace SPME sampling from sunflower oil with 7 and 100 mm
poly(dimethylsiloxane) fibers at different solution to headspace ratios (s / h). Sampling time: 30 min, temperature: 408C
s / h51.0
s / h50.5
s / h50.2
7 mm
100 mm
7 mm
100 mm
7 mm
100 mm
Heptanal
104
264
57
241
39
206
Octanal
69
106
45
107
30
105
Heptenal
48
304
45
275
41
271
Nonanal
116
175
97
150
82
116
Octenal
27
189
23
173
19
167
Heptadienal
139
1217
70
1124
66
1095
Nonenal
50
181
30
148
17
134
Octadienal
83
1246
58
1048
49
1041
Decenal
18
123
16
105
13
86
Nonadienal
81
1224
54
944
44
899
Undecenal
30
111
17
108
13
73
Decadienal
66
614
49
566
31
360
methylsiloxane) fibers. In Tables 1, 2 the sorbed
difference was found in recoveries by using various
amounts of the analytes (expressed in ion counts)
size fiber coatings in the extraction of organochlorine
were compared at different solution to headspace
pesticides from water [18]. When the matrix is a
ratios and at different sampling times. The levels of
non-polar lipid type material, distribution constants
the sorbed aldehydes were found to be higher in all
of the analytes are lower than in the case of an
cases when using the 100 mm poly(dimethylsiloxane)
aqueous medium [19], and according to our ex-
fiber.
periences, thicker fiber coating seems to be neces-
It can be established that both the 7 mm and 100
sary.
mm poly(dimethylsiloxane) fibers can be recom-
mended for analysis of the aldehydes studied but in
former cases the sample capacity is reduced. Other
3.2. Effect of the ratio of liquid to headspace
conclusions were drawn from the determination of
volume
hydrocarbons in water [17]: the use of weaker (7
mm) coating was more efficient. No significant
The quantity of the sorbed mass of the analyte in
Table 2
2
Sorbed masses of aldehydes (given in ion counts, 10 ) by headspace SPME sampling from sunflower oil with 7 and 100 mm
poly(dimethylsiloxane) fibers at different sampling times. Solution to headspace ratio: 1.0, extraction temperature: 408C
10 min
20 min
30 min
40 min
7 mm
100 mm
7 mm
100 mm
7 mm
100 mm
7 mm
100 mm
Heptanal
19
254
47
391
104
364
22
263
Octanal
18
114
31
180
69
106
49
109
Heptenal
15
334
27
398
48
304
23
308
Nonanal
26
158
42
218
116
175
36
195
Octenal
13
221
20
257
27
189
17
186
Heptadienal
41
155
57
1680
139
1217
58
963
Nonenal
9
195
13
245
50
181
6
168
Octadienal
28
1497
38
1665
83
1446
32
1020
Decenal
66
107
15
119
18
123
8
184
Nonadienal
27
1138
32
1157
81
1224
34
1291
Undecenal
20
98
27
106
30
111
28
217
Decadienal
19
432
27
599
66
614
20
899

´
´
342
A
. Keszler, K. Heberger / J. Chromatogr. A 845 (1999) 337 –347
the SPME fiber coating depends both on the volumes
level extracted by the fiber coating can be followed
of the solution and of the headspace over the liquid
in Tables 2, 3. Equilibration time being linearly
[4]:
related to the partitioning coefficients [20] can be an
important parameter for optimization of the SPME
n 5 C V V K /(KV 1 K V 1 V )
(1)
0 1 2
1
2 3
2
procedure. Components of a multicomponent mix-
ture reach the equilibrium at different times [21] and
where n means the sorbed mass, C
is the initial
0
the analytes having various sizes and boiling points
concentration of the analyte in the solution, V , V
1
2
may displace each other [16].
and V are the volumes of the coating, of the solution
3
Regarding these systems 30 min sorption time was
and of the headspace, respectively. K is composed
found to be optimal in all cases. In that time the
from partition coefficients of the analyte between
major part of aldehydes have achieved their equilib-
coating / headspace
(K )
and
headspace / solution
1
ria, and considerable desorption of the most volatile
(K ). That means K 5K K .
2
1
2
components has not been commenced yet. It can be
As it can be seen in Table 1 the increase of the
seen in Table 2 that the desorption of certain analytes
ratio of liquid to headspace volume slightly improves
was much more expressive if 7 mm film coating was
the efficiency of extraction with any size fiber
used.
coating. According to Eq. (1) an increase of the
The desorption of the low-boiling heptanal started
headspace volume (V ) accompanied by a decrease of
3
as soon as 20 min, but the high-boiling 2-undecenal
the solution volume (V ) in a given system results in
2
has not reached the equilibrium even at 40 min. The
lower sorbed mass (n) on the fiber. The headspace
sorbed masses of both of these aldehydes were also
volume was not reduced further because in case of
determined when the SPME determination has been
V <V , sampling from the headspace does not
3
2
carried out from sunflower oil sample containing
affect the amount sorbed by the coating [4]. The
exclusively heptanal or 2-undecenal. The extracted
entire volume of sampling vials has not been in-
quantity of heptanal was an order of magnitude
creased because the efficiency of the extraction is not
higher in absence of competition for the active places
presumed to be enhanced if the relative volumes of
of the SPME fiber, while there was no significant
liquid and headspace remain the same [5].
difference found in case of 2-undecenal.
3.3. Effect of the sampling time
3.4. Effect of the extraction temperature
The influence of sampling time on the aldehyde
Compared to other techniques of determination of
Table 3
2
Sorbed masses of aldehydes (given in ion counts 10 ) by headspace (HS) and immersion SPME sampling from water with 100 mm
poly(dimethylsiloxane) fibers at different sampling times. Solution to headspace ratio: 1.0, the aqueous volume at immersion: 6 ml,
extraction temperature: 408C
10 min
20 min
30 min
40 min
HS
Immersion
HS
Immersion
HS
Immersion
HS
Immersion
Heptanal
2955
2187
4531
4813
3237
5674
2106
4295
Octanal
7117
3678
8183
4200
7537
4680
6997
3671
Heptenal
3795
1903
3913
1221
4019
942
3926
815
Nonanal
7125
2217
7146
2631
8616
2134
9676
1191
Octenal
3968
2567
3957
2731
3887
2826
3253
2579
Heptadienal
6628
139
7143
147
8281
151
11 750
89
Nonenal
4624
2358
4803
2667
5778
2879
6945
2101
Octadienal
63 117
8517
63 668
9295
68 043
9406
59 068
8370
Decenal
5170
2162
6009
2529
6829
2890
7944
3045
Nonadienal
68 430
8741
74 480
9531
78 785
11 195
83 754
11 711
Undecenal
5280
1371
5639
1579
7463
1989
8323
2183
Decadienal
30 320
562
34 368
756
66 507
924
70 368
1533

´
´
A
. Keszler, K. Heberger / J. Chromatogr. A 845 (1999) 337 –347
343
Table 4
2
Sorbed masses of aldehydes (given in ion counts 10 ) by headspace SPME sampling from sunflower oil with 100 mm poly(dimethylsilox-
ane) fibers at different temperatures and sampling times. Solution to headspace ratio: 1.0
408C
508C
608C
708C
10 min
30 min
10 min
30 min
10 min
30 min
10 min
30 min
Heptanal
254
364
315
278
368
181
403
96
Octanal
114
106
192
255
97
94
294
90
Heptenal
334
304
395
296
436
263
481
237
Nonanal
158
175
193
171
224
166
256
162
Octenal
221
189
289
184
389
179
418
175
Heptadienal
1549
1217
1662
1180
2081
115
2110
1101
Nonenal
195
181
236
175
271
169
309
165
Octadienal
1497
1446
1543
1410
1614
1372
1652
1343
Decenal
107
123
139
117
165
112
190
107
Nonadienal
1138
1224
1189
1188
1247
1154
1269
1124
Undecenal
98
111
101
106
113
103
119
99
Decadienal
432
614
486
590
512
555
539
524
volatile compounds SPME is considered to be a
higher than 158C extraction temperature. The same
rapid method. However, at low sorption temperature
tendency was observed during determination of
the extraction can be the most time consuming part
BTEX fraction from water by immersion SPME [27]
of the analysis. Distribution coefficients, especially
at 30 min sampling time. When the extraction time
Henry’s constants are temperature dependent [22–
was 5 min the quantity of the sorbed mass increased
24].
at temperatures up to 458C and decreased at higher
It is a common experience (including our results)
temperatures.
in the study of the extraction conditions of different
The dependence of the sorbed mass of aldehydes
systems both by using immersion and headspace
in the fiber coating was determined in 40–708C
methods that the sorbed mass on the SPME fiber
range of extraction temperature at 10 min and 30 min
decreases by increasing the sampling temperature
sampling times in case of headspace SPME analysis
[21,25–27]. Reduced amounts of sorbed analytes
from sunflower oil, and at 30 min extraction by
have been measured in headspace SPME analysis of
headspace immersion methods from aqueous solution
hydrocarbons, alcohols, ketones and esters [21] at
(Tables 4, 5).
Table 5
2
Sorbed masses of aldehydes (given in ion counts, 10 ) by headspace (HS) and immersion SPME sampling from water with 100 mm
poly(dimethylsiloxane) fibers at different temperatures. Solution to headspace ratio: 1.0, the aqueous volume at the immersion: 6 ml,
extraction time is 30 min
408C
508C
608C
708C
HS
Immersion
HS
Immersion
HS
Immersion
HS
Immersion
Heptanal
3237
5674
2786
5264
2478
4966
2170
4753
Octanal
7537
4680
7125
4313
6654
4059
6233
3897
Heptenal
4019
942
3521
911
3148
895
2899
876
Nonanal
8616
2134
8257
2090
7896
1854
7541
1460
Octenal
3887
2826
3562
2666
3255
2412
2877
2199
Heptadienal
8281
151
8110
136
7956
115
7902
100
Nonenal
5778
2879
5343
2587
4742
2357
3971
2012
Octadienal
68 043
9406
65 087
9113
60 032
8915
55 421
8610
Decenal
6829
2890
6525
2599
5754
2265
4963
2000
Nonadienal
78 785
11 195
74 625
10 583
71 327
10 013
67 892
9416
Undecenal
7463
1989
6825
1823
6516
1691
6378
1433
Decadienal
66 507
924
62 355
879
58 974
836
55 690
743

´
´
344
A
. Keszler, K. Heberger / J. Chromatogr. A 845 (1999) 337 –347
At lower extraction times the level of sorbed
attained. The sorbed quantities on the fiber were
aldehydes was found to be higher at elevated tem-
found to be not the same but very close values in the
peratures. Opposite tendencies were observed at
two different sampling systems indicating that all
longer exposure times.
components of the aldehyde mixture have not
The extraction can be more efficient by applying
achieved the equilibrium completely. On the other
longer sorption times at lower temperatures [25]. On
hand, the displacing effect discussed earlier might be
the other hand, long sampling times are disadvan-
different in the two systems. Although dienals have
tageous [16] in extraction of rather volatile com-
also reached approximately the equilibrium after 30
pounds and make the entire analysis time too long.
min exposure time, their subtraction was found to be
According to our results, and taking into considera-
less efficient by immersion than by headspace. The
tion that by 10 min of extraction most of the analytes
extraction might be hindered by the interaction
have not achieved the equilibrium yet, headspace
between the water and dienal molecules.
SPME analysis can be found to be fairly efficient at
The sorbed mass is decreased by increasing the
30 min sampling time at 408C.
values of the partition coefficient (K ) between the
2
headspace and the solution (Eq. (1)). In the present
3.5. Effect of the media
case, when the ratio of the headspace to the solution
was not higher than 5, and the largest value of
The influence of the matrix can be followed by
K 50.373 for heptenal [7] the mentioned effect
2
comparing similar data of Tables 1, 3. These tables
plays subordinate role.
contain the sorbed masses measured in ion counts.
By taking mass spectra in full scan mode 0.1–1
Since the response of the mass detector depends
ng / ml of studied compounds could be detected in
exclusively on the type of the analyte, the extractions
sunflower oil matrix [6]. Lower values belong to
have been carried out from different matrices con-
unsaturated, while higher ones to saturated alde-
taining similar concentration of aldehydes, so the
hydes. Using SIM mode during the analysis the
actual ion counts measured for each compound may
detection limit of the same aldehydes has been
give information about the efficiency of the analysis.
reduced to 50–500 pg / ml. In aqueous solution, due
It can be established that about an order of
to the more efficient extraction, detection limits were
magnitude higher amount of analytes could be
found to be lower (5–50 pg / ml). The detection limit
obtained from water than from sunflower oil. When
of dienals by immersion method is higher.
halogenated volatiles were determined from food–
water matrix [16] lower partitions of the analytes
3.6. Principal component analysis
have been found with increasing food lipid content.
The partitioning of the analytes between liquid and
The results summarized in Tables 1–5 were
headspace can be described by Henry’s law. Henry’s
subjected to PCA. The input matrix consisted of 26
constants strongly depend on the matrix material.
columns differing in sampling time, in temperature,
When headspace SPME is applied to lipids the
in the type of analysis (immersion in water, head-
concentrations of volatile compounds in the head-
space above water, headspace above oil), and in ratio
space are typically lower than if they are present in
of headspace to liquid volume. The rows correspond
water. Therefore the sorbed mass in the fiber coating
to the eleven aldehydes, whereas the matrix elements
must be reduced as well.
were the response factors at the given analysis
Regarding aldehydes which contain less than two
conditions and are expressed in total ion counts. The
double bonds no considerable difference was ob-
effect of the size of the fiber was not analyzed
served between immersion and headspace methods in
because of the triviality of the achievable outcome.
case of SPME analysis of the same compounds from
The influence of the different response factors of
aqueous solution. Literature data [4] suggest that the
aldehydes was included into PCA by giving the
concentration of analytes in the fiber coating does
amounts of the analyzed compounds directly in ion
not change when the fiber is immersed either in
counts.
liquid or in the headspace after the equilibrium is
First the correlation matrices were computed. Four

´
´
A
. Keszler, K. Heberger / J. Chromatogr. A 845 (1999) 337 –347
345
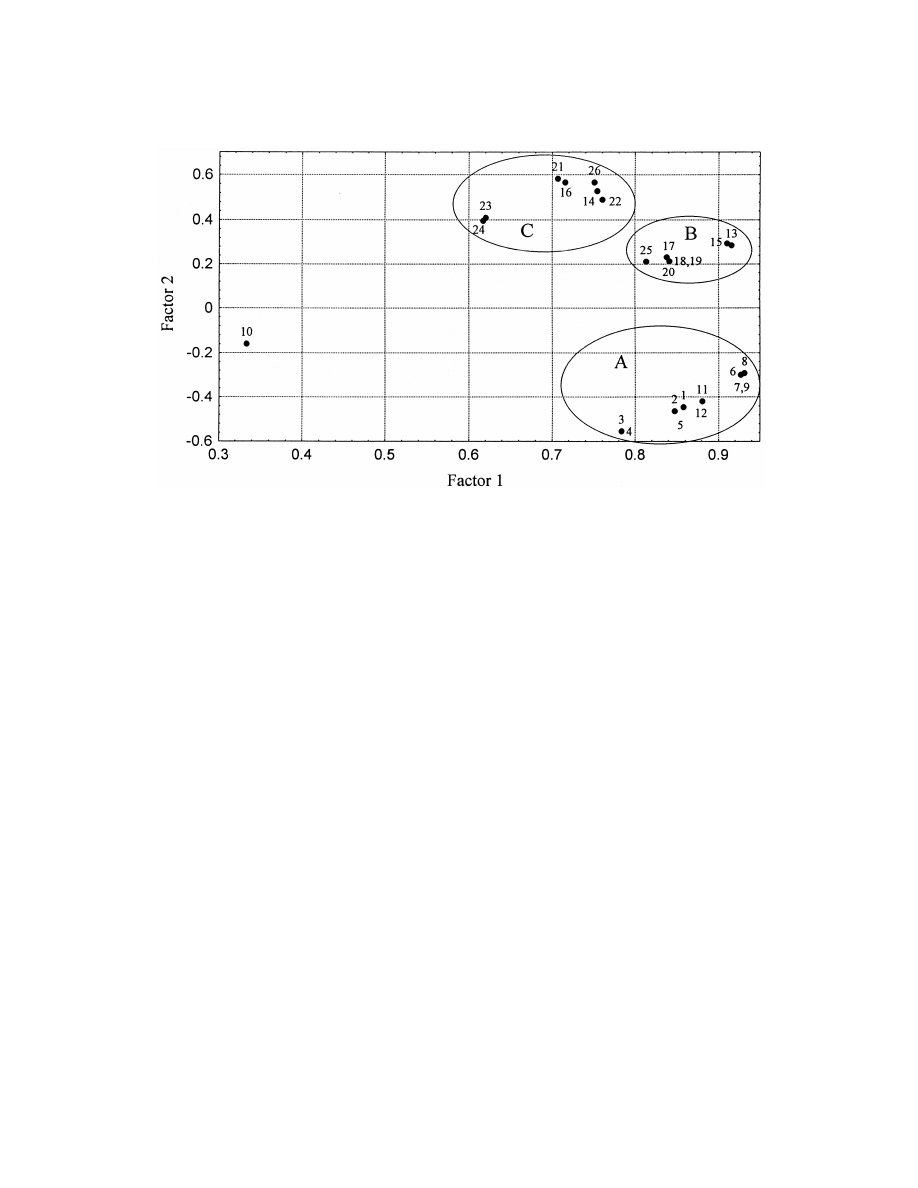
principal components explain more than 95% of the
headspace experiments whereas ‘‘C’’ to immersion
total variance. That is the input matrix can be
probes. Cluster ‘‘A’’ contains all the headspace-oil
represented by four new variables. All of the analysis
samples. The subgroups in each cluster cannot be
conditions are similar to each other. The first princi-
rendered to analysis conditions unambiguously.
pal component correlates better than 0.7 with the
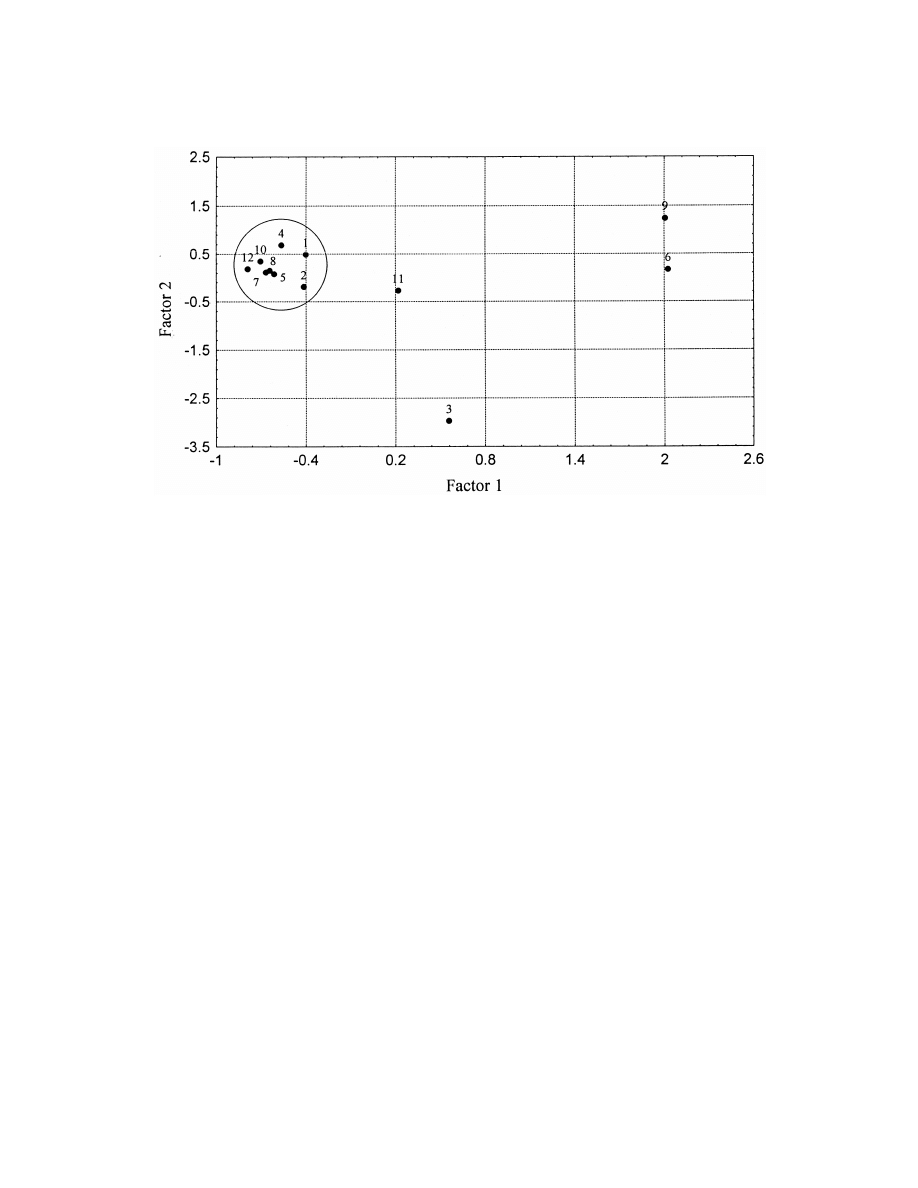
Similarly to analysis conditions the analytes em-
majority of the analysis conditions but not in experi-
body similarities from the point of view of response
ment 10 (Table 6).
factors under the conditions studied. Fig. 3 shows
The second principal component differentiates
one main cluster and 4 outliers.
between samples in oil and in water. Negative values
The outliers coincide with dienals, the sorption
are samples corresponding to oil analyses. Three
and response characteristics of which are very differ-
well-defined clusters can be seen in addition to one
ent from those of the normal chain aldehydes and
outlier in Fig. 2.
aldehydes containing one double bond only.
The reason for the outlier is not well understood, it
may derive from an experimental error or number 10
constitutes an extreme, the longest extraction time
4. Conclusions
applied. Both clusters ‘‘B’’ and ‘‘C’’ belong to
aqueous solutions, ‘‘B’’, however, corresponds to
The levels of sorbed aldehydes were found to be
Table 6
a
Unrotated factor loadings (correlation coefficients between the old variables (columns) and new variables (abstract factors)
Number of variables
Factor 1
Factor 2
Factor 3
Factor 4
(columns)
1
0.85804
20.446178
20.113867
20.089334
2
0.84747
20.464241
20.124200
20.089813
3
0.78344
20.554795
20.139586
20.121546
4
0.78260
20.554652
20.147092
20.117949
5
0.85090
20.461800
20.091752
20.078304
6
0.92681
20.300148
20.020957
20.037535
7
0.92790
20.303969
20.013238
20.028008
8
0.93133
20.292543
0.000696
20.030082
9
0.92583
20.301439
0.009378
20.034761
10
0.33354
20.159977
20.371061
0.838536
11
0.88074
20.419945
0.020105
20.007503
12
0.87752
20.415145
20.098731
20.056225
13
0.91554
0.285232
0.165460
0.045602
14
0.75422
0.527468
20.222629
20.151363
15
0.91031
0.294285
0.187216
0.056311
16
0.71575
0.565738
20.222738
20.267930
17
0.83825
0.231279
0.414054
0.171280
18
0.84163
0.213027
0.426888
0.148599
19
0.84030
0.212005
0.429883
0.152019
20
0.83927
0.208907
0.432484
0.155429
21
0.70690
0.582276
20.198819
20.277875
22
0.76041
0.490521
20.214821
20.299447
23
0.62058
0.408917
20.556547
0.321150
24
0.61738
0.395769
20.561495
0.332343
25
0.81387
0.210192
0.458107
0.192662
26
0.75076
0.566114
20.108513
20.195662
Explained variance
170.14593
40.198385
20.045925
10.416039
Proportion of total variance, %l
65.9
16.1
7.87
5.45
a
Values larger than 0.7 are indicated in bold.
´
´
346
A
. Keszler, K. Heberger / J. Chromatogr. A 845 (1999) 337 –347
Fig. 2. Principal Component Analysis of data obtained in the analysis of aliphatic aldehydes by all studied circumstances I. Loadings. 1:
headspace from oil 408C 10 min, 2: headspace from oil 508C 10 min, 3: headspace from oil 608C 10 min, 4: headspace from oil 708C 10
min, 5: headspace from oil 408C 20 min, 6: headspace from oil 408C 30 min, 7: headspace from oil 508C 30 min, 8: headspace from oil 608C
30 min, 9: headspace from oil 708C 30 min, 10: headspace from oil 408C 40 min, 11: headspace from oil 408C 30 min s / h50.5, 12:
headspace from oil 408C 30 min s / h50.2, 13: headspace from water 408C 10 min, 14: immersion from water 408C 10 min, 15: headspace
from water 408C 20 min s, 16: immersion from water 408C 20 min, 17: headspace from water 408C 30 min, 18: headspace from water 508C
30 min, 19: headspace from water 608C 30 min, 20: headspace from water 708C 30 min, 21: immersion from water 408C 30 min, 22:
immersion from water 508C 30 min, 23: immersion from water 608C 30 min, 24: immersion from water 708C 30 min, 25: headspace from
water408C 40 min, 26: immersion from water 408C 40 min.
higher when using 100 mm rather than 7 mm thick
headspace SPME from sunflower oil. The headspace
poly(dimethylsiloxane) coating on the fiber. Increas-
method was found to be more sensitive in water for
ing the ratio of liquid to headspace volume more
dienals as well.
efficient extraction has been achieved by using any
Aliphatic aldehydes with carbon chains up to C
11
size fiber coating. Exposure time of 30 min at 408C
could be easily analyzed by SPME sampling tech-
was found to be optimal. Under these conditions
nique combined with the ion trap GC-MS method.
most of the aldehydes have already achieved equilib-
Using selected ion monitoring method 50–500 pg / ml
rium with the exception of a considerable desorption
detection limit has been attained in sunflower oil and
of the lower-boiling components. The desorption of
5–50 pg / ml in water.
higher-boiling analytes from 7 mm coating was much
Principal component analysis is able to classify
more significant than from thicker film. Much higher
analysis conditions for quantification and, similarly,
quantity of heptanal was extracted from oil con-
to differentiate between aldehydes from the point of
taining exclusively this compound than from the
view of sorption and response characteristics.
aldehyde mixture. Similar effect was not observed in
case of 2-undecenal.
The extraction of unsaturated and one double
Acknowledgements
bond-containing aldehydes was much more efficient
from water both by immersion of the fiber into the
The authors would like to thank Dr. H. Turksma
aqueous solution and into the headspace than by
(Unilever Research Laboratory, Vlaardingen, Nether-
´
´
A
. Keszler, K. Heberger / J. Chromatogr. A 845 (1999) 337 –347
347
Fig. 3. Principal Component Analysis of data obtained in the analysis of aliphatic aldehydes by all studied circumstances II. Scores. 1:
heptanal, 2: octanal, 3: heptenal, 4: nonanal, 5: octenal, 6: heptadienal, 7: nonenal, 8: octadienal, 9: decenal, 10: nonadienal, 11: undecenal,
12: decadienal.
´
[12] K. Heberger, A. Lopata, J. Chem. Soc., Perkin Trans 2
lands) for providing the unsaturated aldehydes and
(1995) 91–96.
Dr. J. Jakus for reading the manuscript. Further
´
´
[13] K. Heberger, A. Keszler, M. Gude, Lipids 34 (1999) 83–92.
thanks go to Hungarian OTKA foundation No T
[14] D.M. Wyatt, J. Chromatogr. Sci. 25 (1987) 257–261.
´
016231 for the financial support.
´
[15] A. Keszler, B. Kazinczy, L. Kotai, Fresenius J. Anal. Chem.
363 (1999) in press.
[16] K.G. Furton, J.R. Almirall, J. High Resolut. Chromatogr. 18
(1995) 625–629.
References
[17] J.J. Langenfeld, S.B. Hawthorn, D.J. Miller, Anal. Chem. 68
(1996) 144–155.
[1] R.P. Belardi, J. Pawliszyn, Water Pollut. Res. J. Canada 24
[18] R. Young, V. Lopez-Avila, W.F. Beckert, J. High Resolut.
(1989) 179–191.
Chromatogr. 19 (1996) 247–256.
[2] C.L. Arthur, J. Pawliszyn, Anal. Chem. 62 (1990) 2145–
[19] B.D. Page, G. Lacroix, J. Chromatogr. 648 (1993) 199–211.
2148.
[20] J. Dewulf, H. Van Langenhove, M. Everaert, J. Chromatogr.
[3] D. Louch, S. Motlagh, J. Pawliszyn, Anal. Chem. 64 (1992)
A 761 (1979) 205–217.
1187–1199.
[21] R.J. Bartelt, Anal. Chem. 69 (1998) 364–372.
[4] Z. Zhang, J. Pawliszyn, Anal. Chem. 65 (1993) 1843–1852.
[22] G.A. Robbins, S. Wang, D.J. Stuart, Anal. Chem. 65 (1993)
[5] Z.E. Penton, Adv. Chromatogr. 37 (1997) 205–235.
3113–3118.
´
´
[6] A. Keszler, K. Heberger, M. Gude, J. High Resolut. Chroma-
[23] J.C. Hutter, G.F. Vandergrift, N. Luis, D.H. Redfield, AIChE
togr. 21 (1998) 368–370.
J. 40 (1994) 166–177.
´
´
[7] A. Keszler, K. Heberger, M. Gude, Chromatographia 47
[24] T.K. Poddar, K.K. Sirkar, J. Chem. Eng. Data 41 (1996)
(1998) 127–132.
1329–1332.
¨
[8] J.J. Langenfeld, S.B. Hawthorn, D.J. Miller, J. Chromatogr.
[25] B. Schafer, P. Henning, W. Engewald, J. High Resolut.
A 740 (1996) 139–145.
Chromatogr. 18 (1995) 587–592.
[9] J.A. Fioriti, J. Am. Oil Chem. Soc. 54 (1977) 450–455.
[26] D. Gorlo, L. Wolska, J. Namiesnik, International Symposium
[10] J.A. Singleton, H.A. Pattel, J. Am. Oil Chem. Soc. 57 (1980)
on
Advances
in
Chromatography
and
Electrophoresis
405–409.
Szeged, Hungary, 1998, Abstract 26.
[11] S. Wold, K. Esbensen, P. Geladi, Chemometrics, Intell. Lab.
[27] C.L. Arthur, L.M. Killam, K.D. Buchholz, J. Pawliszyn, J.R.
Systems 2 (1987) 37–52.
Berg, Anal. Chem. 64 (1992) 1960–1966.
Wyszukiwarka
Podobne podstrony:
The influence of British imperialism and racism on relationships to Indians
84 1199 1208 The Influence of Steel Grade and Steel Hardness on Tool Life When Milling
Sky Realms of Jorune Law and Order on Jorune
Kulesza, Mariusz; Rykała, Andrzej Eastern, Western, cosmopolitan – the influence of the multiethnic
Hamao And Hasbrouck Securities Trading In The Absence Of Dealers Trades, And Quotes On The Tokyo St
Effect of Drying Techniques and Storage on Mulberry (Morus alba) Quality
Hossam El Dien The acoustical influence of balcony depth and parapet form
Junco, Merson The Effect of Gender, Ethnicity, and Income on College Students’ Use of Communication
Optimization of Extraction Conditions and Fiber Selection fo
Spontaneous Combustion of Brown Coal Dust Experiment, Determination of Kinetic Parameters, and Numer
72 1031 1039 Influence of Thin Coatings Deposited by PECVD on Wear and Corrosion Resistance
network memory the influence of past and current networks on performance
Soliwoda, Katarzyna i inni The influence of the chain length and the functional group steric access
1998 The influence of sugar beet fibre, guar gum and inulin on
Influences of Cultural Differences between the Chinese and the Western on Translation
Influence of different microwave seed roasting processes on the changes in quality and fatty acid co
więcej podobnych podstron