
1
Finite Element Analysis
of Structural Steelwork
Beam to Column Bolted
Connections
Jim Butterworth
Constructional Research Unit,
School of Science & Technology,
University of Teesside, UK.
Abstract
A combination of simple fabrication techniques and speedy site erection have made bolted
endplates one of the most popular methods of connecting members in structural steelwork
frames. Although simple in their use bolted endplates are extremely complex in their analysis
and behaviour. In 1995 the Steel Construction Institute (SCI) and the British Constructional
Steelwork Association (BCSA) jointly published a design guide for moment resisting
connections [1]. The Green Book design method offers increased connection capacity using
a combination of theoretical overstress in the beam compression zone and plastic bolt force
distribution. This paper reports on a PhD research program at the University of Teesside
which uses a combination of full scale testing and materially non-linear three dimensional
finite element analyses (FEA) in order to investigate extended end plate beam-to-column
connections. The FEA analyses, incorporating MYSTRO and LUSAS software [2], use
enhanced strain solid and contact gap elements to model the connection behaviour.
Introduction
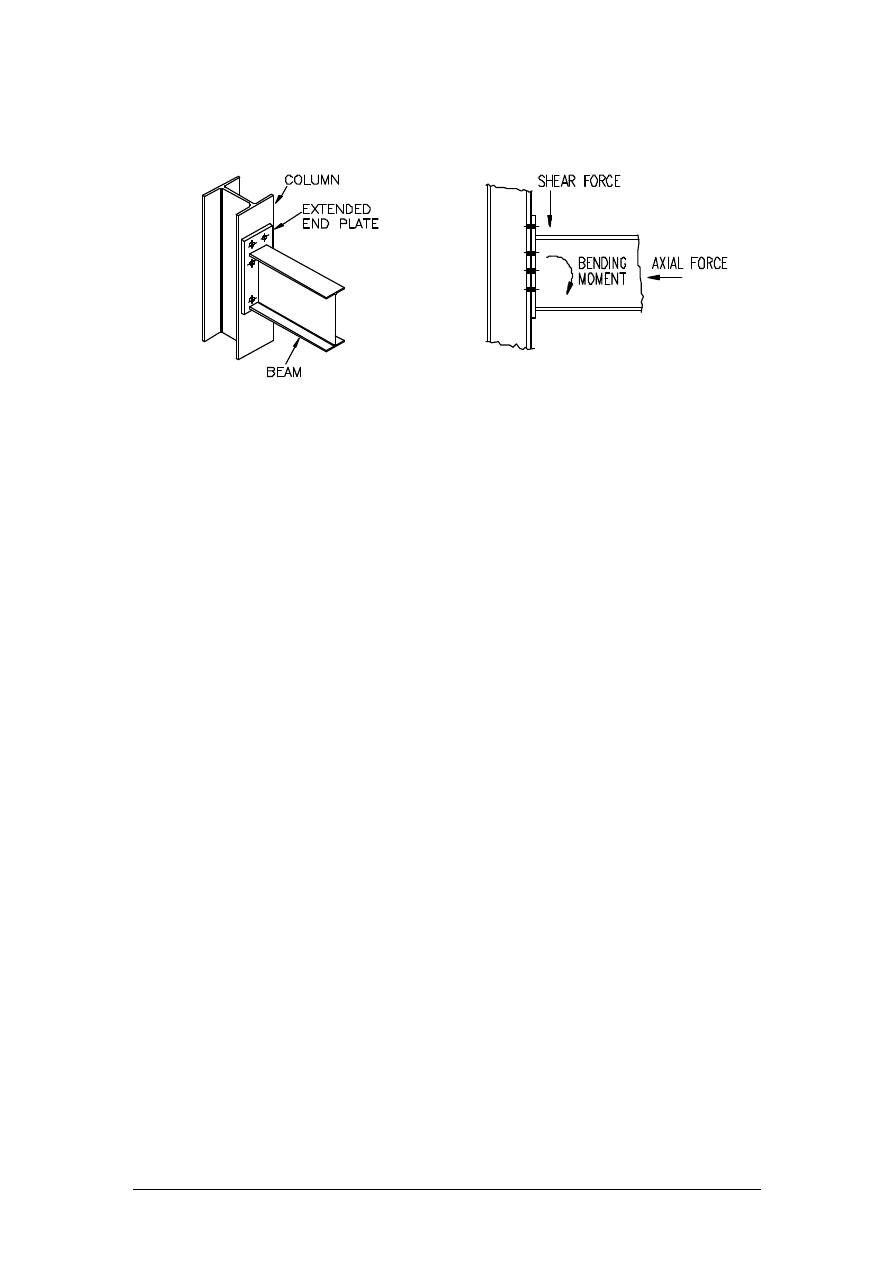
An extended end plate connection consists of a plate welded in the fabrication shop to the
end of the steel beam as shown in Figure 1. The end plate is pre-drilled and then bolted at
site through corresponding holes in the column flange. The plate extends above the tension
flange in order to increase the lever arm of the bolt group and subsequently the load carrying
capacity. The connection is usually loaded by a combination of vertical shear force, axial
CS502 - Issue 1
2
force in the beam member and a moment as shown in the diagram of an elevation on a
beam-to-column joint in Figure 2.
Figure 1 - Extended End Plate Connection
Figure 2 - Connection Loading
Accurate analysis of the connection is difficult due to the number of connection components
and their inherit non-linear behaviour. The bolts, welds, beam and column sections,
connection geometry and the end plate itself can all have a significant effect on connection
performance. Any one of these can cause connection failure and some interact. The most
accurate method of analysis is of course to fabricate full scale connections and test these to
destruction. Unfortunately this is time consuming, expensive to undertake and has the
disadvantage of only recording strain readings at pre-defined gauge locations on the test
connection. A three dimensional materially non-linear finite element analysis approach has
therefore been developed as an alternative method of connection appraisal.
Connection Design Theory
Despite numerous years of extensive research [3], particular in the 1970’s, no fully agreed
design method exists. Many areas of connection behaviour still require investigation. More
recently Bose, Sarkar and Bahrami [4] used FEA to produce moment rotation curves,
Bose, Youngson and Wang [5] reported on 18 full scale tests to compare moment
resistance, rotational stiffness and capacity. The latest design method utilises plastic bolt
force distribution to create an increased moment connection capacity and reduced column
stiffening. In 1995 when the SCI and the BCSA produced the Green Book guide, based on
the EC3 [6] design model, the editorial committee felt a number of areas, particularly bolt
force distribution and compression flange overstress required further investigation. The
authors PhD research program is currently nearing completion at the University of Teesside
and is part of this investigation. The research has been undertaken with the financial
assistance of the SCI.
Full Scale Tests
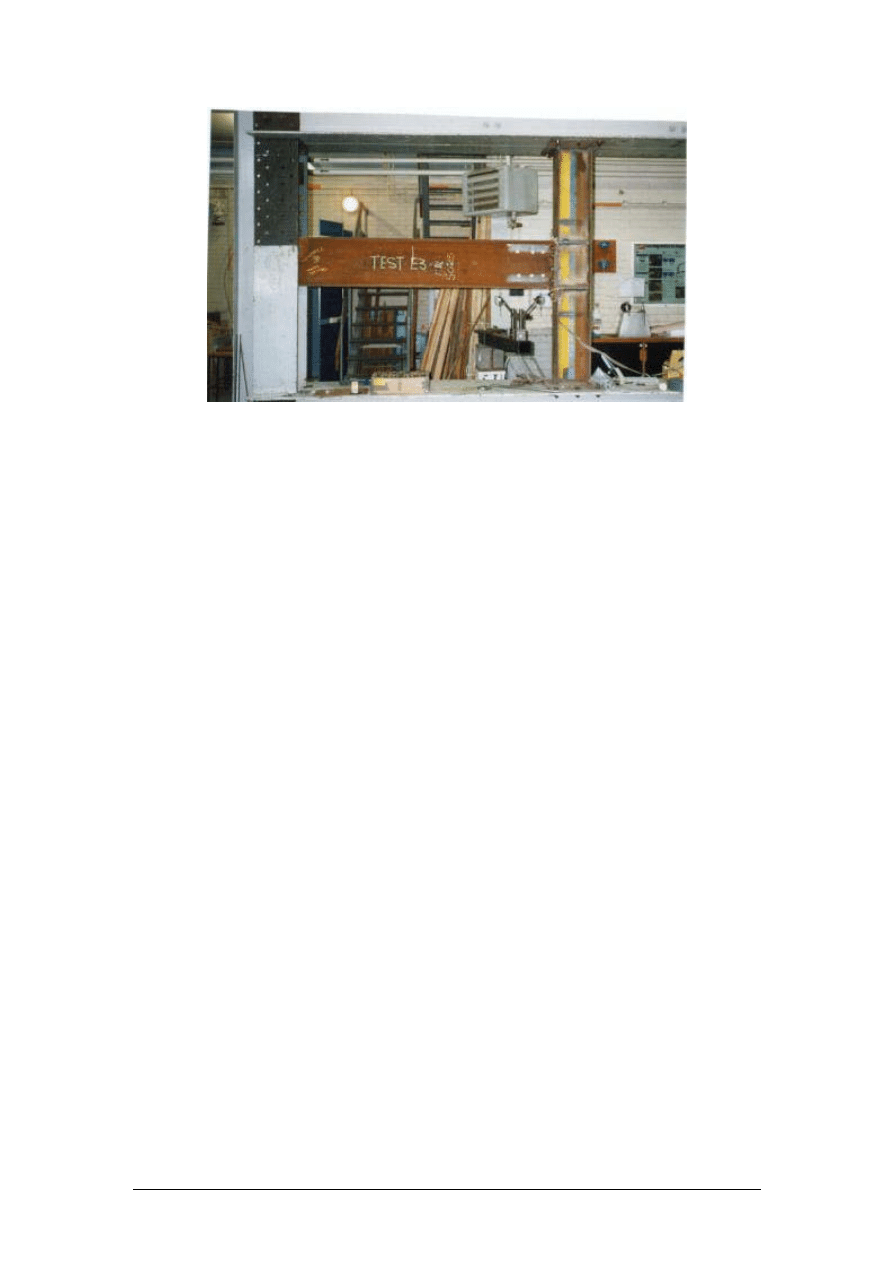
A series of five full scale tests were completed using the self straining frame in the Heavy
Structures Laboratory at the University of Teesside. The basic arrangement of the testing rig
and a test connection can be seen in situ in Figure 3.
3
Figure 3 - Elevation on the Testing Frame
The beam to column joint was bolted into the frame and tested in an inverted position.
Loading on the connection was provided with a 20 tonne jack situated on the top of the
straining frame and activated by hand from a pull ram positioned on the laboratory floor. The
jack was connected to the beam with a 25mm dia. high tensile steel bar and shackle
arrangement. The shackle arrangement allowed adequate rotation to be obtained to ensure a
truly vertical pull was always applied. To measure the force a load cell is placed between the
jack and a steel block positioned on the top of the straining frame. The load cell is then
connected to the statimeter. All connections used M20 grade 8.8 bolts which were torqued
up to 110 Nm. 110 Nm is considered to represent a typical tightening force obtained using a
steelwork erectors podger spanner. Test E1 used a lever arm of 1000mm, unfortunately this
was found to be too small to produce failure with the loading equipment available. Therefore
in subsequent tests the lever arm was increased to 1900mm. Connection details and
dimensions were taken from ref. [1] with the exception of Test E2 which used an end plate
thickness of 15mm. The Green Book recommended an end plate thickness of 20mm.
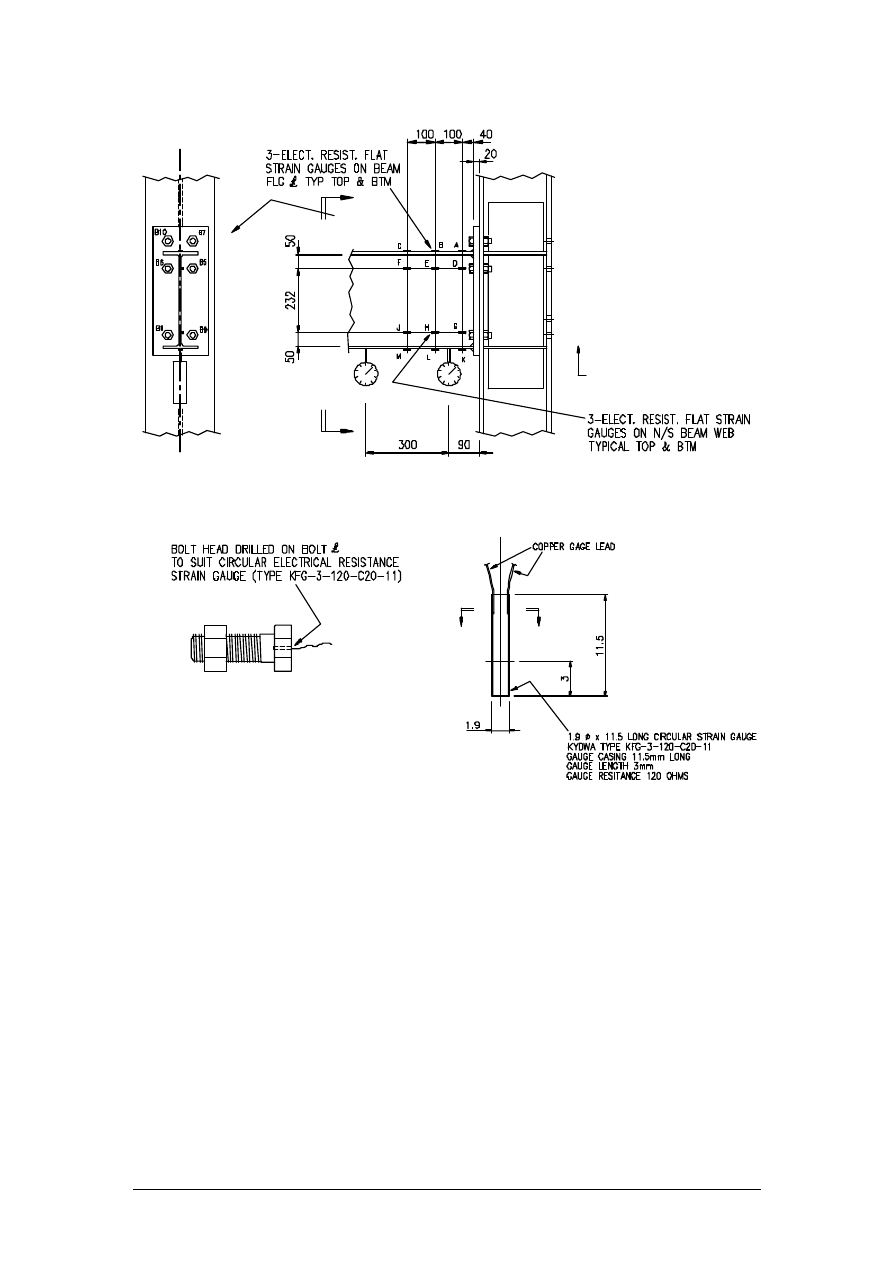
All tests used the same arrangement for the location of the strain and dial gauges. Three
strain gauges were applied to both beam compression and tension flanges. Six gauges were
applied to the beam web, local to the tension and compression areas. Dial gauges were
situated under the tension flange to measure rotation. The bolt strains were measured by
bonding Kyowa type KFG-3-120-C20-11 gauges into the bolts. The 11 mm long circular
strain gauges were inserted into a 2 mm dia. hole drilled into the centre of each bolt head.
The bolts were previously all individually calibrated in a specially fabricated bolt testing
assembly to obtain a bolt force to strain calibration factor. Strain readings were taken by
connection of the gauges to two Vishay portable strain indicators and readings at each load
increment noted.
The arrangement of test strain/dial gauges are shown in Figure 4. Details of a bolt strain
gauge are shown in Figure 5.
4
Figure 4 - Strain / Dial gauge locations
Figure 5 - Strain gauge in situ detail and enlarged detail of gauge
Details of the five section sizes tested are given in the following table:

5
T e s t
Ref
Beam Size
(GR355)
Column Size
(GR355)
Column
Stiffene
d
End Plate
WxThkxL
No. of M20
Gr 8.8
Bolts
Beam Welds
Top-Web-
Btm
E1
356 x 127 x 33UB
254UC73
Yes
200 x 20 x 460
6
12-6-6
E2
356 x 127 x 33UB
254UC73
Yes
200 x 15 x 460
8
8-6-6
E3
356 x 171 x 51UB
254UC73
Yes
200 x 20 x 460
10
10-6-6
E4
254 x 146 x 37UB
203UC60
No
200 x 20 x 370
6
8-6-6
E5
457 x 191 x 67UB
203UC60
No
200 x 20 x 570
8
10-6-6
Table 1 - Full Scale Test Details
Full Scale Test Results
Test E1 had to be unfortunately halted at 215 kNm due to the capacity of the jack. Test E2
failed at 220 kNm when the compression flange buckled. Test E2 at its ultimate load of 220
kNm had a flange stress of 607 N/mm2 when the compression flange buckled. At this time
the flange was overstressed by 70%. The Green Book design allows a compression flange
to be overstressed by 40% with 20% of this apportioned to material strain hardening and
the remaining 20% to dispersal into the beam web. Test E3 failed at a connection moment of
290 kNm due to thread stripping of both the bolts and nuts local to the tension area. At the
time of failure considerable bending of the end plate local to the tension flange was clearly
visible. Tests E4 and E5 both failed as expected due to column flange bending. Table 2
shows details of the test results compared with the Green Book theoretical capacities and
from these the relevant safety factors.
T e s t
Ref
Green
Book
Capacity
T e s t
Failure
Load
Safety Factor /
Green Book
Mode of Test Failure
E1
160 kN
215 kN
1.34
Test halted at 215 kNm due to jack
capacity
E2
159 kN
220 kN
1.38
Beam compression flange buckled
E3
222 kN
290 kN
1.31
Upper rows bolt failure (thread stripping)
E4
101 kN
135 kN
1.34
Column flange bending
E5
147 kN
253 kN
1.72
Column flange bending
Table 2 - Full Scale Test Results
Finite Element Model
MYSTRO and LUSAS FEA software was used for the finite element analysis. The FEA
models were created using command files rather than the CAD interface tools even though
this method was longer and initially tedious. The command file could simply be copied and
edited. The command file also was more logical in order than command files produced by
the software after a model has been created. The command file was also well described by
6
comments within the file to provide a complete history of the model creation. FEA models
can often be a black box that provides answers without the user being fully aware of what
the model exactly entails. The extra work in creating the command files has been well worth
the effort and allowed the subsequent models to be created quickly.
The technique of FEA lies in the development of a suitable mesh arrangement. The mesh
discretisation must balance the need for a fine mesh to give an accurate stress distribution
and reasonable analysis time. The optimal solution is to use a fine mesh in areas of high
stress and a coarser mesh in the remaining areas. To further reduce the size of the model file
and the subsequent processing time symmetry was employed. The connection arrangement
was symmetrical about a vertical centre line and therefore viewed from 1,1,1 only the right
hand side was modelled.
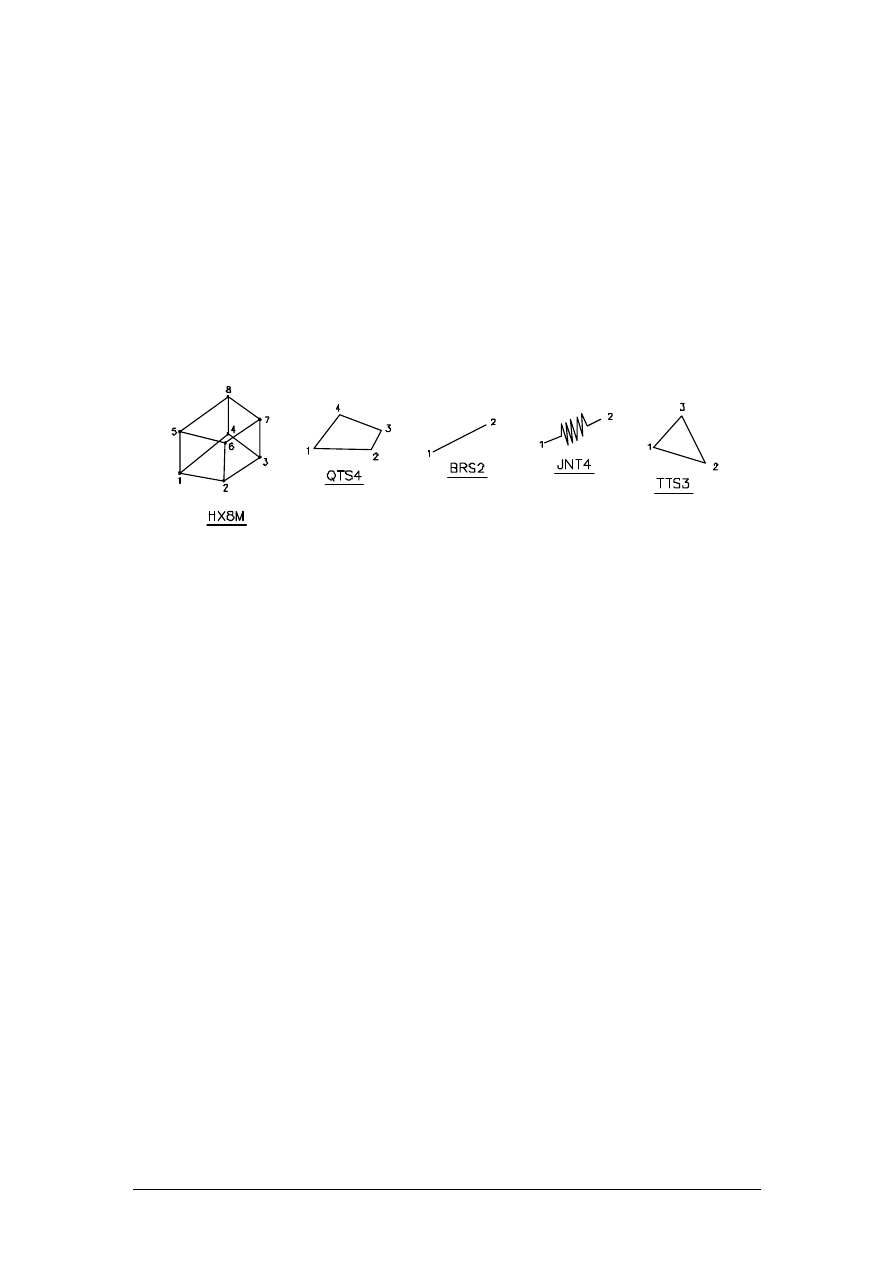
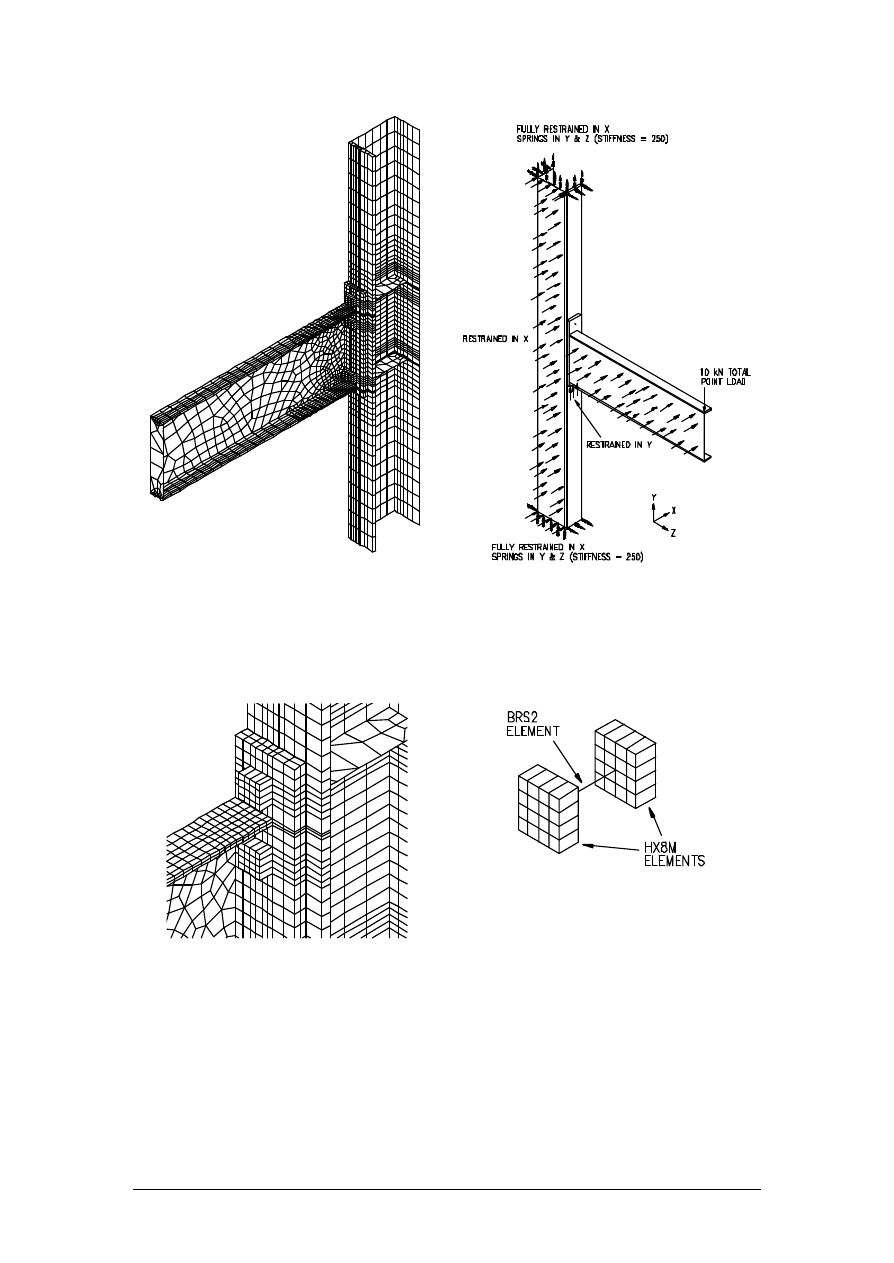
Figure 6 - FEA Elements
Element Types
At the beginning of the research a number of trial models were created. Models with fewer
elements as well as models with only shell elements were tried and also a number of different
methods of modelling the bolts were created before the final arrangement of mesh and
elements used was decided upon. The final FEA models use the five element types as shown
in Figure 6. HX8M elements are three dimensional solid hexahedral elements comprising 8
nodes each with 3 degrees of freedom. Although the HX8M elements are linear with respect
to geometry, they employ an assumed internal strain field which gives them the ability to
perform as well as 20 noded quadratic iso-parametric elements. These elements are used to
model the beam flanges, end plate and connecting column flange. QTS4 and TTS3 elements
are three dimensional flat facet thick shell elements comprising either 3 or 4 nodes each with
5 degrees of freedom and are used to model the beam and column webs, beam closing
plate, column back flange and stiffeners. JNT4 elements are non-linear contact gap joint
elements and are used to model the interface between the end plate and the column flange.
The bolts were modelled using BRS2 elements for the bolt shank and HX8M elements for
the head and nut as shown in Figure 10. BRS2 are three dimensional bar elements
comprising 2 nodes each with 3 degrees of freedom. Each BRS2 element was equivalenced
with the appropriate HX8M bolt head and nut to comprise the complete bolt assembly. All
bolts used are M20 grade 8.8 and were assigned an area of 245mm2 which is equal to the
tensile stress area [7]. The bolts in the full scale test were torqued to produce an consistent
starting bolt force. This was included in the model as an initial prestress in the BRS2
elements. The bolt holes were modelled as square cut-outs in the end plate and column
flange. Figure 7 shows a FEA model with the final arrangement of mesh discretisation.
Figure 8 shows the FEA supports and loading.
7
Figure 7 - Mesh Discretisation
Figure 8 - FEA Supports and Loading
Figures 9 and 10 show the FEA bolt arrangement.
Figure 9 - Extended End Plate and Bolts
Figure 10 - Enlarged FEA Bolt Arrangement
In order to further reduce the models size and analysis time, tied slidelines were used to
model the interface between the two sections of beam flange. The 1000mm long flange is
split into two sections 300mm and 700mm long. The 300mm sections of the beam flanges
adjacent to the end plate have two elements through the flange thickness to allow for greater

8
accuracy of analysis results. Similarly two elements are also used throughout the whole of
the end plate thickness.
Non-Linear Analysis
Material non-linearity occurs when the stress-strain relationship ceases to be linear and the
steel yields and becomes plastic. The three sets of material data were as follows: For the
elastic dataset all elements were defined as elastic isotropic with a Young’s Modulus of
Elasticity of 2.05 x 10⁵ N/mm2 and Poisson’s lateral to longitudinal strain ratio of 0.3. The
actual materials test certificates were obtained for all steel and enabled stress/strain curves to
be based on actual values rather than theoretical. Tensile tests were completed on a
selection of bolts to enable material properties to be as accurate as possible. Von Mises
yield criteria was used for all material.
Boundary Conditions
Displacements in the X,Y and Z directions were restrained at the top and bottom of the half
column. Displacements in the X direction were restrained along all surfaces on the centre line
of the model. The FEA model had problems converging when the beam end plate had no
supports restraining movement in the Y direction due to the lack of bending resistance in the
bolt BRS2 elements. Therefore supports had to be added to the underside of the end plate.
This removed the shear force from the bolts but not of course from the remaining connection
elements. Shear in moment connections is usually of minor importance but it is felt that the
supports are a compromise. The column to end plate interface was modelled using JNT4
joint elements with a contact spring stiffness K of 1E9 N/mm2. Loading was via a 10 kN
point load on the cantilever end. The load was then factored in the control file to achieve the
required range of connection bending moments.
FEA and Test Results
The Green Book capacity for Test E1 was limited to 160 kNm due to the capacity of the
bolts. At this loading the compression flange was expected to have stresses in the order of
370 N/mm2. This agreed with the FEA model which also indicated considerable stresses,
up to 500 N/mm2, in the bottom corner of the beam web. As the load on Test E1
increased the stresses in the compression flange reached up to 500 N/mm2. The area of
beam web which had stresses above 400 N/mm2 increased to approximately a quarter of
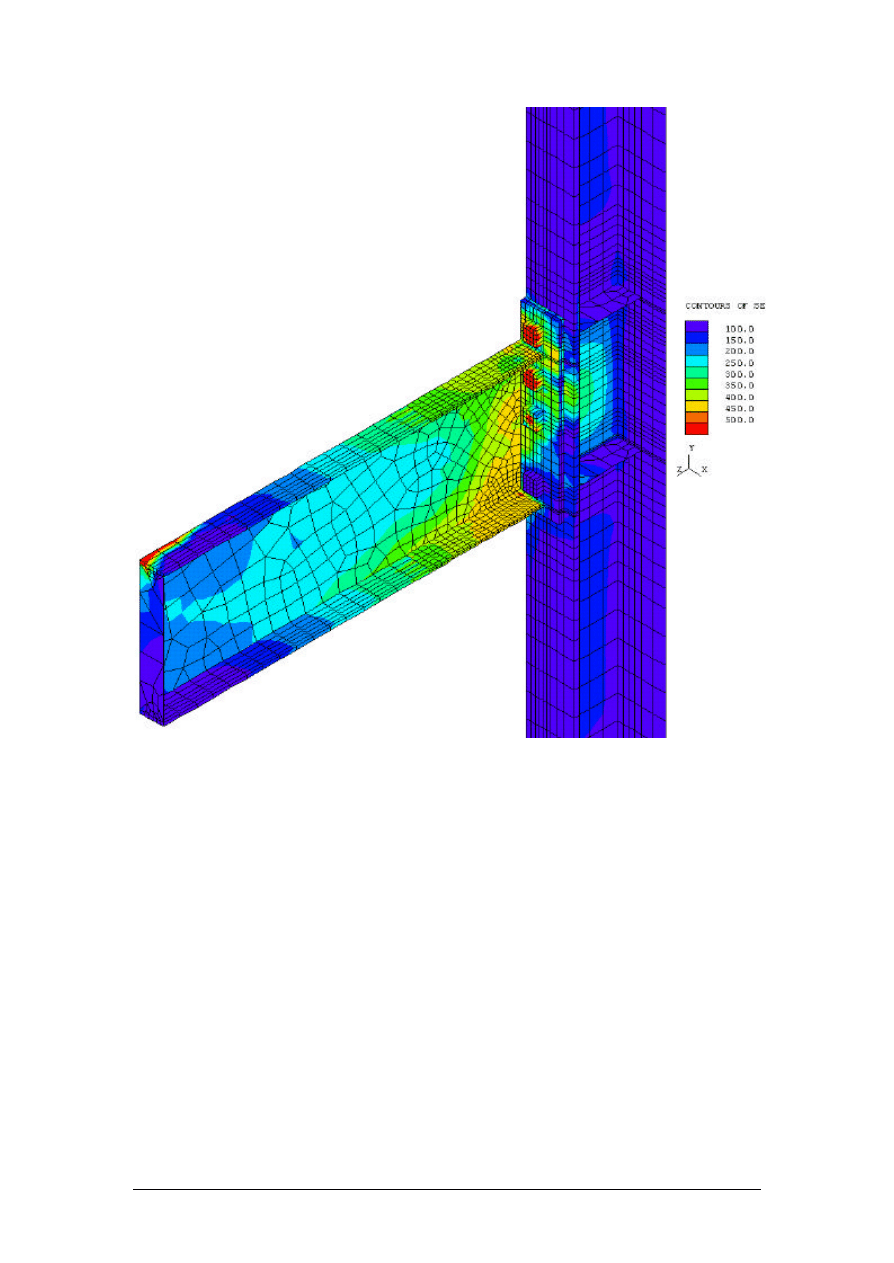
the beam depth. Test E2’s theoretical capacity was limited by its compression flange and at
its failure load of 220 kNm had a compression flange stress of 607 N/mm2. At this point the
flange was theoretically overstressed by 71% and finally caused buckling and ultimately
failure. Figure 11 indicates the Von Mises stress contours at a load close to the test failure
bending moment.
9
Figure 11 - Von Mises Stress Contours E2
As in Test E1, Test E3’s Green Book capacity was limited by the bolt strength and this was
confirmed when at a moment of 290 kNm the bolts failed. At this load the compression
flange indicated stresses up to 500 N/mm2 with again beam web stresses up to a quarter of
the beam depth reaching 500 N/mm2. Approximately half of the beam web at the end plate
interface had stresses over 400 N/mm2. In all cases it was found that the higher the
connection force the greater the distribution of stresses into the beam web. Test E4 & E5
Green Book capacities were both governed by shear on the column web panel. For Test E4
at 135 kNm the column section failed due to column flange bending rather than web failure.
Similarly Test E5 failed by flange deformation but at a considerably higher connection
moment than the theoretical capacity.
Connection Bolt Forces
Strain gauged bolts from the tests are compared in Table 3 with the forces obtained from the
FEA and the Green Book theory. FEA and test results for the bolt forces indicated good
correlation. In comparison with the Green Book theory it was found that in nearly all cases

10
the forces obtained from the top rows of bolts were higher in the FEA and test results than
in the predicted theory. It was also found that the Green Book design guide assumed larger
forces in the lower bolt rows than in both the FEA and test models. The plastic bolt force
distribution theory assumes some deformation of the end plate or column flange takes place
in order that the connection forces can be distributed down the connection into the lower
bolts. This was found not to happen to the extent expected in the theory. From tensile tests
on the connection bolts it was found that the bolts had considerable reserve capacity. In all
the tests the steel rolling mill certificates were also obtained and it was found that all cases
the steels yield strength was considerably larger than required by the British Standard. In
some cases almost a grade higher. It is considered that the increased strength in the material
prevented the connection force transmitting itself down the connection into the lower rows.
This would explain the larger forces in the higher rows and the reduced forces in the lower
rows. In spite of these observations the Green Book theory was found to have
approximately a 30% safety margin over the test failure load.
Green Book
Bolt forces kN
FEA
Bolt forces kN
Full Scale Test
Bolt forces
Test E1
Top row
2nd row
Btm row
230
252
0
246
258
8
260
260
12
Test E2
Top row
2nd row
3rd row
Btm row
184
239
107(186)
0
252
258
120
4
266
254
82
16
Test E3
Top row
2nd row
3rd
row
4th row
Btm row
233
252
217
129
0
308
308
185
60
8
310
312
130
24
12
Test E4
Top row
2nd row
Btm row
222
193(231)
0
244
220
30
240
230
34
Test E5
Top row
2nd row
3
rd
row
Btm row
226
189(227)
0(221)
0
177
166
92
14
176
164
90
26
Figures in brackets () indicate the potential bolt forces if the connection was not limited by some other
failure criteria e.g. beam compression flange, column web panel, etc.
Table 3 - Bolt Forces
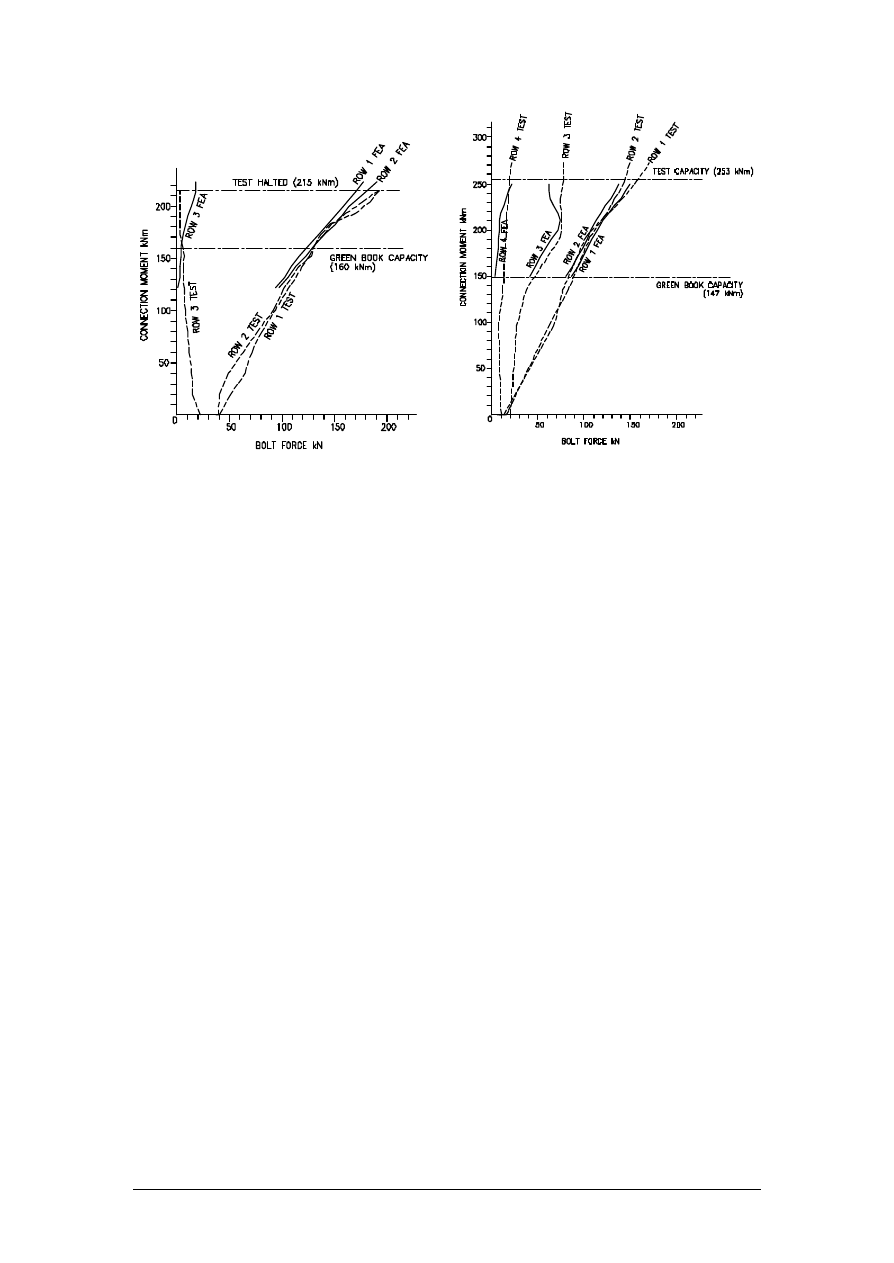
Figures 12 and 13 indicates a comparison between test and FEA bolt forces for models E1
and E5.
11
Figure 12 - Test E1 and FEA bolt force comparison
Figure 13 - Test E5 and FEA bolt force comparison
Rotations
Initially the FEA models had the top and bottom of the columns restrained fully in all
directions. In comparison with the full scale tests it was found that the rotations on the test
connections were considerable larger than on the FEA models. Although connection
rotations are not considered an important aspect of this particular research program it was
felt that the models should reflect the tests as close as possible. Upon investigation it was
found that the steel column in the full scale test had only a 10mm thick end plate welded
onto the column ends for fixing the column to the frame. During the test it was found that the
end plate started to bend and lift at the centre causing the greater rotations. The FEA
models were therefore modified with springs added to the top and bottom of the columns.
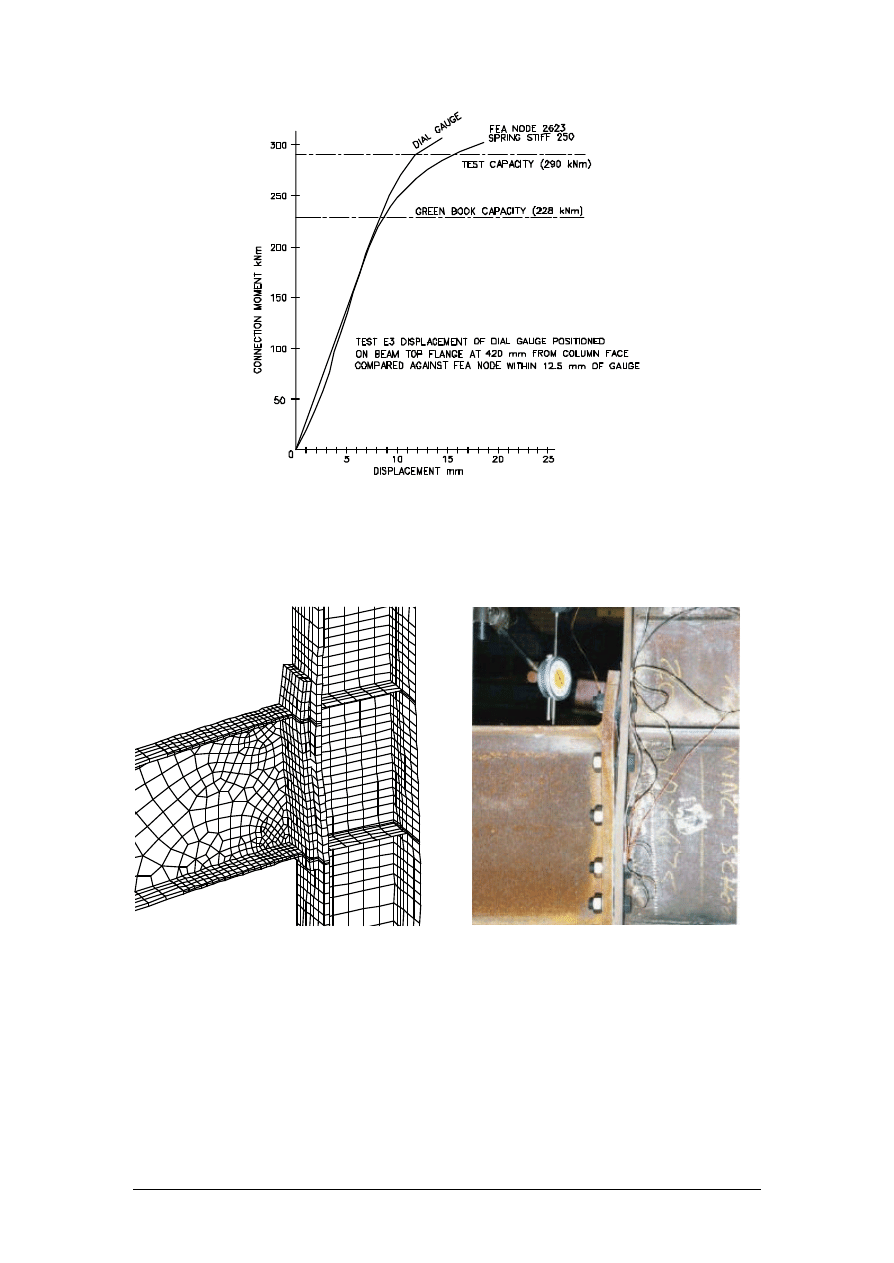
Figure 14 shows a comparison of the FEA and test rotations for E3 after correlation.
12
Figure 14 - Test E3 and FEA rotation comparison
Figures 15 and 16 indicate comparable deformations of Test E3.
Figure 15 - FEA deformed mesh Model E3
Figure 16 - Test E3 just prior to bolt failure
Conclusions
In both the FEA and the laboratory tests it was consistently found that the Green Book
design theory underestimated the bolt forces in the top rows of the connection and
overestimated the forces in the lower rows. Overall plastic bolt distribution was not seen to
happen in the manner assumed by the new theory. Tested bolts had a substantial reserve of

13
capacity. The lowest bolt failure load found in tensile tests was 206 kN. The Green Book
theory allows 137 kN in tension.
In Test E3 connection failure was caused by thread stripping of both the bolt and the nut.
This could be resolved if bolts used were specified to European Standards rather than BS
3692.
The new rule of thumb allowing the compression flange to be theoretically overstressed by
40% did not appear to be unreasonable. The 40% rule is derived from a 20% dispersal of
stress into the beam web and the remaining 20% apportioned to material strain hardening. It
was found the higher the loading on the connection the greater the distribution of stress into
the beam web.
It was also discovered that the steel beams and columns rolled in the mill have a substantially
greater yield stress than required, in some cases almost a grade higher. Whilst in elastic
design this reserve of capacity is of benefit to the Engineer. In plastic design when members
and connections are designed to yield this reserve of capacity has the effect of not allowing
the connection to behave in the manner assumed. In connections using plastic bolt force
distribution the end plate and/or column flange are assumed to deform in order that the force
in the bolts can be dispersed down the connection into the lower rows.
In spite of this the new Green Book theory with the increased connection capacities still had
a reserve of approximately 30%.
Overall the finite element analysis of extended end plate connections can be seen to provide
advantages in terms of time and expense over full scale testing and can produce a more
complete picture of stress, strain and force distributions.
Acknowledgements
The steelwork used in the tests was kindly donated and fabricated by Cleveland Bridge &
Engineering in Darlington and Kvaerner Oil and Gas in Middlesbrough. Use of the
MYSTRO and LUSAS software and technical support is also acknowledged as is the
financial and technical assistance of the Steel Construction Institute.
References
1. Joints in Steel Construction - Moment Connections, BCSA/SCI Pub. No. 207/95.
2. MYSTRO/LUSAS is produced by FEA Ltd, Kingston-upon-Thames, KT1 1HN.
3. Nethercott D.A., Steel beam to column connections - A review of test data,
Construction Industry Research & Information Association, 1985.
4. Bose B, Sarkar S, and Bahrami M, Finite Element Analysis of unstiffened extended end
plate connections, Structural Engineering Review, 3, 211-224, 1991.
5. Bose B, Youngson G K, and Wang Z M, An appraisal of the design rules in Eurocode 3
for bolted end plate joints by comparison with experimental results, Proceedings from the
Institute of Civil Engineers Structures and Buildings, 1996.

14
6. DD ENV 1993 - 1.1:1992 Eurocode 3: Design of steel structures Part 1.1 General rules
for buildings.
7. British Standards Institute, Specification for ISO metric precision hexagonal bolts,
screws and nuts BSI London, 1967, BS 3692.
Contact Information
Jim Butterworth,
Constructional Research Unit,
School of Science & Technology,
University of Teesside
Email: jimbutterworth@wgplc.freeserve.co.uk
FEA Ltd
Forge House
66 High Street
Kingston upon Thames
Surrey, KT1 1HN, UK.
Tel: +44 (0)20 8541 1999
Fax: +44 (0)20 8549 9399
Email: info@lusas.com
http://www.lusas.com
Wyszukiwarka
Podobne podstrony:
Finite Element Analysis with ANSYS
Finite Element Analysis with ANSYS
Analysis of the Immigration Problem to America doc
Romeo and Juliet Analysis of how Prejudice Leads to Violen doc
Risk analysis of landfill design response to seismic loading
Probabilistic slope stability analysis by finite elements
7 Modal Analysis of a Cantilever Beam
8 Harmonic Analysis of a Cantilever Beam
9 Transient Analysis of a Cantilever Beam
GL Syntax The analysis of sentence structure
„SAMB” Computer system of static analysis of shear wall structures in tall buildings
3 NonLinear Analysis of a Cantilever Beam
Analysis of Reinforced Concrete Structures Using ANSYS Nonlinear Concrete Model
Analysis of spatial shear wall structures of variable cross section
GL Morphology The analysis of word structure
Probabilistic slope stability analysis by finite elements
więcej podobnych podstron