
Nature © Macmillan Publishers Ltd 1998
8
letters to nature
144
NATURE
|
VOL 396
|
12 NOVEMBER 1998
|
www.nature.com
The line ¯ux from the SNR can be translated into an ejected mass
of
44
Ti, if we know the age and distance of the SNR. Recent
measurements of the
44
Ti lifetime (see refs 18, 19, and references
therein) were used to derive a weighted mean of 90:4 6 1:3 years.
We note that the effective
44
Ti lifetime in SNRs could be larger,
depending on the degree of ionization of the
44
Ti and its Lorentz
factor. The derived value of the ejected
44
Ti mass is mainly sensitive
to the actual value of the lifetime and is less critically dependent on
the distance to, and the age of, the SNR.
The parameters (age and distance) are not available from the g-
ray measurements alone. Fortunately however, a possible counter-
part of the newly discovered SNR was recently (independently)
detected in Rosat data
20
: an extended feature of ,28 diameter
centred at Galactic longitude l 266:38, latitude b 1:28 only
0.48 away from the
44
Ti excess, well within the measurement
uncertainties.
By combining the g-ray line ¯ux and the X-ray diameter
20
with an
assumed typical
44
Ti yield of ,5 3 10
2 5
M
(
for supernovae of
different types
6±9
, and taking as representative an expansion velocity
of ,5,000 km s
-1
(ref. 21) for the supernova ejecta, we derive a
distance of ,200 pc, and an age of the SNR of ,680 yr. For larger
44
Ti yields and larger expansion velocities, the distance estimate
becomes larger and the age estimate becomes less. We note that the
SNR expansion velocity, when evaluated from the SNR X-ray
spectrum
20
, has the same value of ,5,000 km s
-1
.
We can only speculate about the reasons why this supernova was
not observed ,700 years ago: we can consider the possible existence
both of optically subluminous supernovae
22
and of absorbing
material in front of the supernova. In addition, the celestial position
and the time of the event might have been unfavourable for an
observation. Information about the existence and type of the
compact stellar-like remnant of the supernova, and the elemental
abundances of the SNR, will have to await future optical, radio, X-
ray and g-ray measurements.
M
Received 3 April; accepted 20 August 1998.
1. van den Bergh, S. & Tammann, G. A. Galactic and extragalactic supernova rates. Annu. Rev. Astron.
Astrophys. 29, 363±407 (1991).
2. Ashworth, W. B. A probable Flamsteed observation of the Cassiopeia supernova. J. Hist. Astron. 11, 1±
14 (1980).
3. Strom, R. G. ``Guest Stars'', sample completeness and the local supernova rate. Astron. Astrophys. 288,
L1±L4 (1994).
4. Iyudin, A. F. et al. COMPTEL observations of
44
Ti gamma-ray line emission from Cas A. Astron.
Astrophys. 284, L1±L4 (1994).
5. Iyudin, A. F. et al. in Proc. 2nd INTEGRAL Workshop 37±41 (SP-382, ESA, 1997).
6. Nomoto, K., Thielemann, F.-K. & Yokoi, K. Accreting white dwarfs models for type I supernovae. III.
Carbon de¯agration supernovae. Astrophys. J. 286, 644±658 (1984).
7. Woosley, S. E. & Weaver, T. A. The evolution and explosion of massive stars. II. Explosive
hydrodynamics and nucleosynthesis. Astrophys. J. Suppl. 101, 181±235 (1995).
8. Thielemann, F.-K., Nomoto, K. & Hashimoto, M. A. Core-collapsed supernovae and their ejecta.
Astrophys. J. 460, 408±436 (1996).
9. Woosley, S. E. & Weaver, T. A. Sub-Chandrasekhar mass models for type Ia supernovae. Astrophys. J.
423, 371±379 (1994).
10. Clayton, D. D., Colgate, S. A. & Fishman, G. J. Gamma-ray lines from young supernova remnants.
Astrophys. J. 155, 75±82 (1969).
11. Dupraz, C. et al. COMPTEL three-year search for galactic sources of
44
Ti gamma-ray line emission at
1.167 MeV. Astron. Astrophys. 324, 683±689 (1997).
12. SchoÈnfelder, V. et al. Instrument description and performance of the imaging gamma-ray telescope
COMPTEL aboard the Compton Gamma-Ray Observatory. Astrophys. J. Suppl. 86, 657±692 (1993).
13. KnoÈdlseder, J. The Origin of
26
Al in the Galaxy. Thesis, Toulouse Univ. (1997).
14. van Dijk, R. Gamma-ray Observations of X-Ray Binaries with COMPTEL. Thesis, Toulouse Univ.
(1996).
15. Oberlack, U. UÈber die Natur der Galaktischen
26
Al-Quellen Untersuchung des 1.8-MeV-Himmels mit
COMPTEL. Thesis, MuÈnchen Techn. Univ. (1997).
16. Diehl, R. et al. 1.809 MeV gamma-rays from the Vela region. Astron. Astrophys. 298, L25±L28 (1995).
17. Oberlack, U. et al. Implications of the
26
Al emission of 1.8 MeV from the Vela region. Astrophys. J.
Suppl. 92, 433±439 (1994).
18. Norman, E. B. et al. Half-life of
44
Ti. Phys. Rev. C. 57, 2010±2016 (1998).
19. GoÈrres, J. et al. Lifetime of
44
Ti as probe for supernova models. Phys. Rev. Lett. 80, 2554±2557 (1998).
20. Aschenbach, B. Discovery of a young nearby supernova remnant. Nature 396, 141±142 (1998).
21. Weaver, T. A. & Woosley, S. E. in AIP Conf. Proc. 63: Supernovae Spectra (eds Meyerott, R. & Gillespie,
G. H.) 15±37 (AIP, New York, 1980).
22. Schaefer, B. E. Volume-limited sample of supernovae. Astrophys. J. 464, 404±411 (1996).
Acknowledgements. We thank the COMPTEL team for their support. A.F.I. acknowledges support from
the German Bundesministerium fuÈr Bildung, Wissenschaft, Forschung and Technologie.
Correspondence and requests for materials should be addressed to A.F.I. (e-mail: ani@mpe-garching.
mpg.de).
Paramagnetic Meissner effect
in small superconductors
A. K. Geim*, S. V. Dubonos², J. G. S. Lok*, M. Henini³
& J. C. Maan*
* Research Institute for Materials, University of Nijmegen, 6525 ED Nijmegen,
The Netherlands
² Institute for Microelectronics Technology, Russian Academy of Sciences,
142432 Chernogolovka, Russia
³ Department of Physics, University of Nottingham, Nottingham NG7 2RD, UK
. . . . . . . . . . . . . . . . . . . . . . . . . . . . . . . . . . . . . . . . . . . . . . . . . . . . . . . . . . . . . . . . . . . . . . . . . . . . . . . . . . . . . . . . . . . . . . . . . . . . . . . . . . . . . . . . . . . . . . . . .
A superconductor placed in a magnetic ®eld and cooled down
through the transition temperature expels magnetic ¯ux. This
phenomenon, known as the Meissner effect, is arguably the most
essential property of superconductors and implies zero resistivity.
Surprisingly, several recent experiments have shown that some
superconducting samples
1±7
may attract magnetic ®eldÐthe so-
called paramagnetic Meissner effect. The scarce, if not controver-
sial, experimental evidence for this effect makes it dif®cult to
identify the origin of this enigmatic phenomenon, although a
large number of possible explanations have been advanced
8±16
.
Here we report observations of the paramagnetic Meissner effect
with a resolution better than one quantum of magnetic ¯ux. The
paramagnetic Meissner effect is found to be an oscillating func-
tion of the magnetic ®eld (due to ¯ux quantization) and replaces
the normal Meissner effect only above a certain ®eld when several
¯ux quanta are frozen inside a superconductor. The paramagnetic
state is found to be metastable and the Meissner state can be
restored by external noise. We conclude that the paramagnetic
Meissner effect is related to the surface superconductivity and,
therefore, represents a general property of superconductors: on
decreasing temperature, the ¯ux captured at the third (surface)
critical ®eld inside the superconducting sheath compresses into a
smaller volume, allowing extra ¯ux to penetrate at the surface.
The evidence for the paramagnetic Meissner effect (PME) in
high-temperature superconductors
1±5
has prompted the appearance
of a number of theories attributing the effect to a non-conventional
superconductivity in these materials
8±13
. Although it is possible
that the proposed mechanisms do play a role in high-T
c
superconductors
17
, more recent observations of PME in Nb (refs
6, 7) clearly indicate the existence of another, less-exotic mechan-
ism: the limited choice of assumptions in this case makes the origin
of PME more mysterious. To explain PME in terms of conventional
superconductivity, theory employs the idea of ¯ux capture inside a
superconducting sample and its consequent compression with
decreasing temperature
14±16
. The ¯ux capture can be caused by
inhomogeneities
14,15
but, in principle, could also be an intrinsic
property of any ®nite-size superconductor due to the presence of the
sample boundary
16
.
Here we attempt to elucidate the origin of PME by studying small
(micrometre-size) superconducting disks. Con®nement of super-
conductivity in a small volume, comparable to the characteristic
superconducting lengths l and y, leads to pronounced quantiza-
tion, so that a mesoscopic superconductor resides in one of a series
of well-resolved states, depending on temperature and magnetic
®eld. These superconducting states are characterised by a different
number and distribution of vortices
18±21
. In comparison with the
previous studies of PME on macroscopic (centimetre-size) disks,
the small size of our samples gives the advantage that we can
measure magnetization of individual vortex states. In addition,
our samples behave very much like ideal superconductors: in the
context of this work, it is important that they clearly exhibit surface
superconductivity and no noticeable pinning
18±20
. That they act in
this way is probably due to their small size.
Nature © Macmillan Publishers Ltd 1998
8
letters to nature
NATURE
|
VOL 396
|
12 NOVEMBER 1998
|
www.nature.com
145
Magnetization was measured by ballistic Hall magnetometers
that work as ¯uxmeters with a detection loop of ,1 mm
2
(ref. 22).
The technique has a resolution of ,10
4
Bohr magnetons and is still
the only technique allowing studies of individual mesoscopic
superconductors below the transition temperature T
c
. We have
studied a number (,20) of superconducting disks made from Al
and Nb with diameters from 0.3 to 3 mm and thicknesses t from 0.03
to 0.15 mm, using magnetometers of various widths from 1 to
2.5 mm. The behaviour described below is reproducible for identical
samples and changes consistently with changing the sample
parameters.
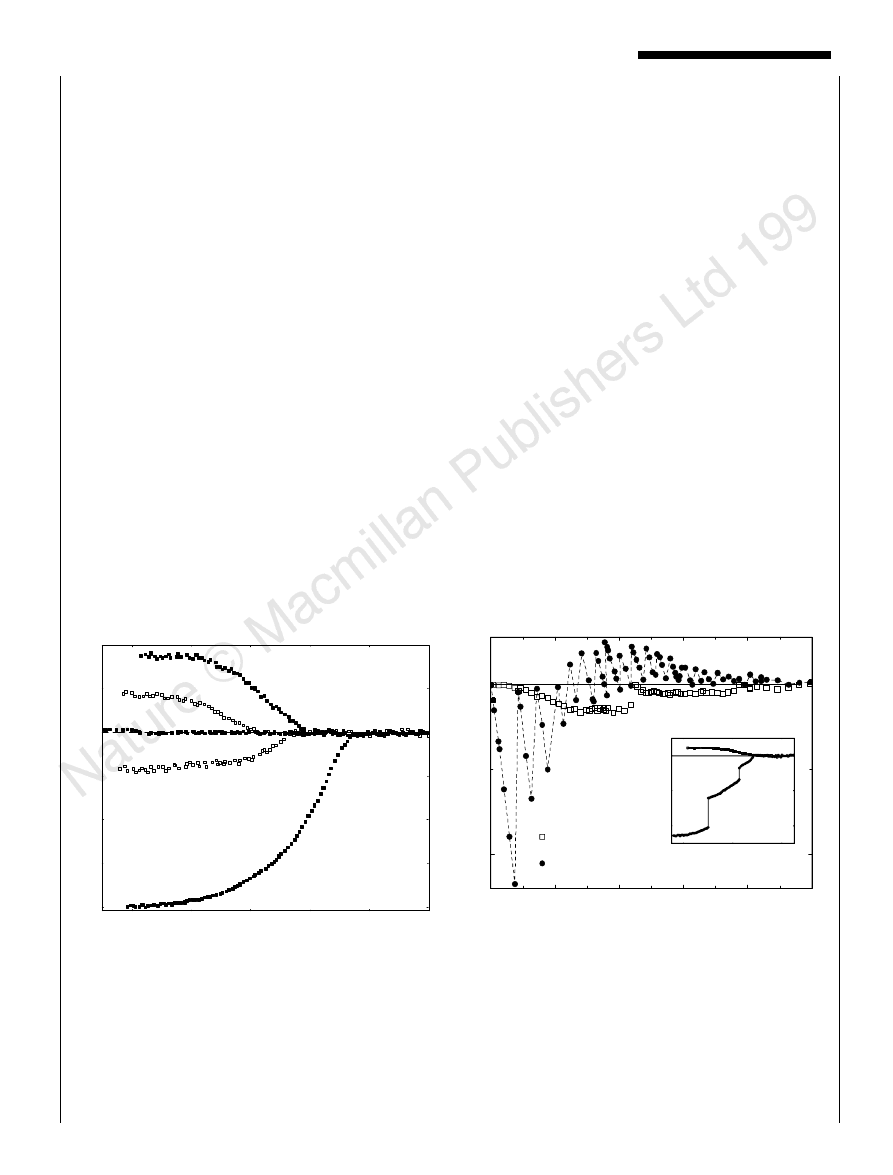
Figure 1 shows a representative set of magnetization curves
measured for a 2.5-mm-diameter Al disk on cooling it down in
different magnetic ®elds H (so-called ®eld-cooling (FC) regime). In
low ®elds, we observe the normal (negative) Meissner response, and
below 10 G the magnetization curves are practically identical. In
intermediate ®elds, the sign of the Meissner effect oscillates between
positive and negative, depending on the particular ®eld value, while
in higher ®elds it stays positive, until the superconductivity is
destroyed above 140 G. The detailed ®eld dependence of the
Meissner effect is shown in Fig. 2, which plots the low-temperature
value of the FC magnetization (deduced from curves such as those
in Fig. 1) for Al disks of diameter 1.0 and 2.5 mm. The strongly
oscillating behaviour clearly seen for the larger sample is due to size
quantization. Each jump corresponds to a change in the number of
vortices inside the disk, which can either form an array of single-
quantum vortices or assemble into a single giant vortex
16,18±21
. The
latter con®guration is generally expected at ®elds between the
second and third critical ®elds, H
c2
, H , H
c3
, that is, it corre-
sponds to the surface superconductivity in a con®ned geometry.
The smaller sample does not exhibit this rapidly oscillating ®eld
dependence, and its Meissner response remains negative over the
entire ®eld interval. Such qualitatively different behaviour is related
to the fact that, in the smaller sample, the superconductivity is
suppressed by ,3 ¯ux quanta, f
0
, entering the disk area while
,20f
0
are necessary to destroy superconductivity of the larger
disk
18±20
.
To summarize the behaviour observed on other samples: we
always found a diamagnetic response in low magnetic ®elds which
gives way to a paramagnetic response only after the entry of at least
several ¯ux quanta into the disk interior, provided that the super-
conductivity survives to such ®elds (compare the two samples in
Fig. 2). This seems to be in contrast to the previous studies on
macroscopic samples, where the PME was normally found in very
low ®elds and gradually disappeared with increasing ®eld. However,
one should take into account that even the lowest ®elds in the
previous experiments allowed many thousands of ¯ux quanta inside
the sample interior. We also observe that, with decreasing disk
thickness, the reversal of the sign of the Meissner effect tends to
occur at lower ®elds and the PME magnitude becomes larger. No
qualitative difference in behaviour is observed between disks of
circular and square shapes.
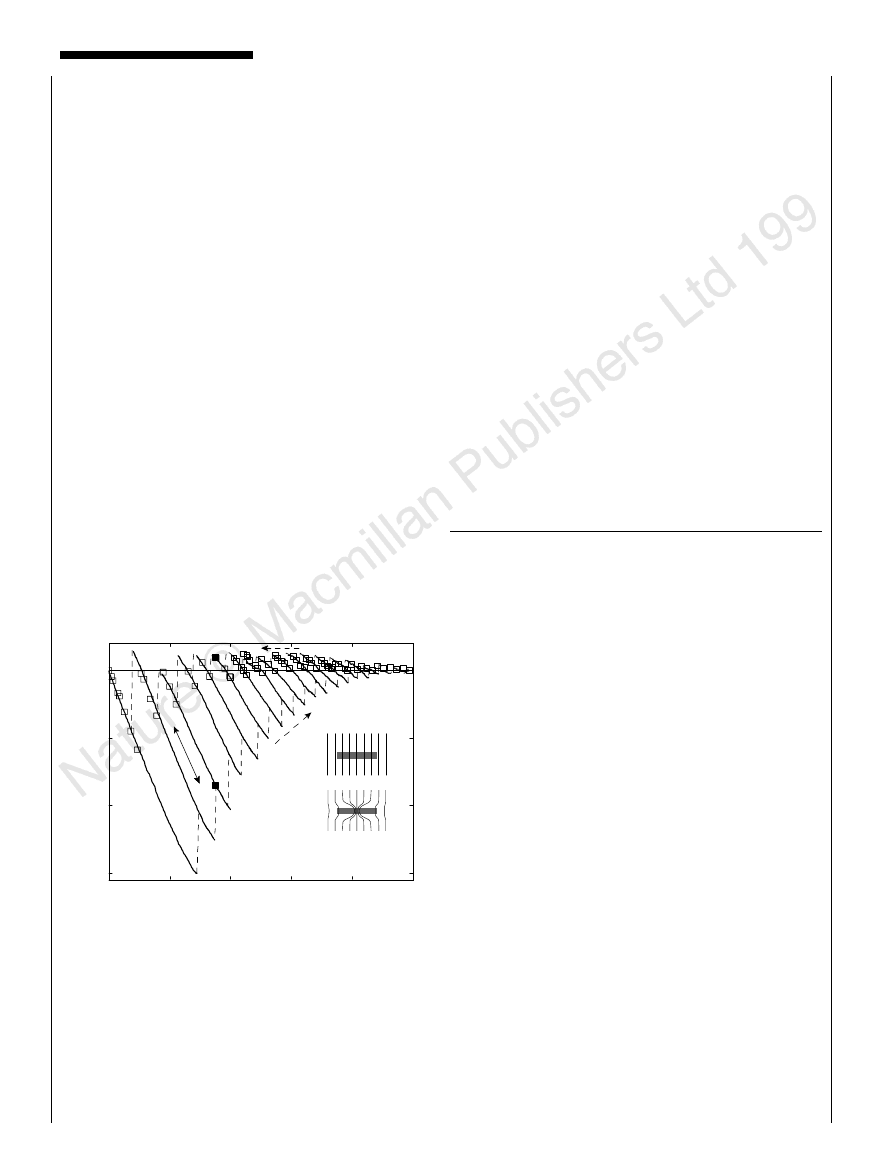
The origin of the PME becomes evident if we compare the ®eld
dependence of the Meissner effect discussed above with the magne-
tization response measured by sweeping the magnetic ®eld at a
constant temperature (CT regime) (Fig. 3). Instead of a single
magnetization curve characteristic of macroscopic superconduc-
tors, the spatial con®nement gives rise to a family of magnetization
curves corresponding to different vortex states. Several supercon-
ducting states can be realised at the same applied ®eld (up to ®ve as
seen in Fig. 3) but only the state with the most negative CT
magnetization is thermodynamically stable
19,20
. Other states are
metastable and become observable due to the presence of the surface
(Bean±Livingston) barrier
18±21
. Recent theory
19,20
is in good agree-
ment with the similar CT curves reported previously
18
.
Figure 3 clearly shows that the paramagnetic states reached via
®eld cooling are all metastable. Indeed, the FC data predictably fall
on the CT curves because only these distributions of the order
-1.0
-0.5
0
0.5
0.4
0.8
1.2
120 G
x10
35 G
x10
65 G
x10
9 G
x1
40 G
x10
T (K)
χ
2.5
µ
m disk
thickness 0.1
µ
m
Figure 1 Magnetic susceptibility x of an aluminium disk for various magnetic
®elds perpendicular to the disk surface. There is no hysteresis when sweeping
the temperature up and down. Magnetization amplitude is normalized to its value
at low ®elds (,5 G) at 0.3 K. The top curves are multiplied by a factor of 10. At 0.3 K,
the bulk critical ®eld H
c2
for this Al ®lm is ,80 G (measured resistively); surface
critical ®eld H
c3
< 140 G (magnetization data); T
c
< 1:25 K; l 0 < 70 nm; Ginz-
burg±Landau parameter
k
l=y < 0:3.
-0.5
0
0
25
50
75
100
125
2.5
µ
m
1.0
µ
m
4
π
M
(arbitrary units)
H (G)
- 0.4
- 0.2
0
0 .4
0 .8
1 .2
T ( K)
35 G
FC
Z FC
Figure 2 Detailed ®eld dependence of the Meissner response. The ®gure plots
the magnetic ¯ux captured inside or expelled out of a Hall magnetometer of
2.5 mm width at 0.4 K, due to the presence of superconducting disks
(D© hBi 2 H 4pM; ref. 22). The two disks were fabricated simultaneously by
thermal evaporation and differ only in their diameters. The dashed line is a guide
to the eye. The inset compares FC and zero-®eld-cooling (ZFC) magnetization. In
the latter case, the sample is cooled down in zero ®eld, then a ®eld is applied and
the magnetization is measured as temperature increases. The inset is for the 2.5-
mm disk at the ®eld where the paramagnetic response is close to its maximum
value. The ZFC response is always diamagnetic. The jumps in the ZFC curve
correspond to entry of individual vortices into the disk interior.
Nature © Macmillan Publishers Ltd 1998
8
letters to nature
146
NATURE
|
VOL 396
|
12 NOVEMBER 1998
|
www.nature.com
parameter are allowed by quantization. However, among all possible
states at a given ®eld, the system unexpectedly `chooses' the
metastable state with the most positive possible magnetization.
Only if we remove the proper screening in our experimental setup
does a metastable high-magnetization state eventually relax to the
corresponding stable state on the lowest curve. The same result was
obtained when the experiment was carried out in a more con-
trollable manner, by applying an oscillating magnetic ®eld at a
constant H. One can verify that, according to Fig. 3, an oscillating
(¯uctuating) ®eld moves the system down the ladder of curves,
towards equilibrium.
How, on cooling down, the system can end up in the most
thermodynamically unfavourable state may be seen from the
following consideration. Superconducting states in a con®ned
geometry can be characterised by a quantum number L correspond-
ing to the number of nodes in the distribution of the complex order
parameter ª along the sample circumference. For the case of a giant
vortex and an array of single-quantum vortices, L has a simpler
meaning: it is the angular momentum and the number of vortex
cores, respectively
18±25
. Transitions between states with different L
are of ®rst order and lead to jumps in magnetization (for example,
see Fig. 3 and Fig. 2 inset)
19,20,25
. The FC curves of Fig. 1 do not
exhibit any magnetization jumps; further analysis of our experi-
mental data shows that no jumps between different L occur at
temperatures as little as 0.03 K away from the superconducting
transition that on our curves corresponds to H
c3
(refs 18±20). This
proves that, on cooling down, the superconducting system preserves
its L-fold symmetry as it was initially induced by the surface
superconductivity at H
c3
in the form of a giant vortex.
It is this persistence of L down to low temperatures that is
responsible for the PME. We now describe a simple model, which
combines the ideas of refs 14 and 16, that explains the essential
physics involved. Close to H
c3
, the magnetic ®eld is distributed
homogeneously and it requires the `high-temperature' magnetic
¯ux ©
HT
< f
0
L L
1=2
(ref. 24) to initiate a giant vortex with
momentum L inside a superconducting disk of radius r. As the
temperature decreases below the surface superconducting transi-
tion, the superconducting sheath at the disk perimeter rapidly
expands inside, compressing the giant vortex into a small volume
(see Fig. 3 inset; we consider the case l p r). The compressed ¯ux
inside a giant vortex is equal to f
0
L, that is, ©
HT
is practically
conserved for L q 1. When at H
c2
the giant vortex spits into L
single-quantum vortices, the captured ¯ux changes little
20
. At this
point, we have to take into account the fact that the magnetic ®eld
also penetrates at the disk boundary, giving rise to an additional ¯ux
through the disk of the order of prlH
B
, where H
B
is the ®eld
strength in the l-layer at the surface. The magnetization response is
paramagnetic if the low-temperature value of the total ¯ux,
©
LT
< f
0
L prlH
B
, is larger than ©
HT
. For a superconducting
cylinder, H
B
H and the PME appears at relatively large L . r=l
2
and its amplitude is rather small (m < l=r).
The plate geometry signi®cantly enhances the PME because H
B
is
increased by demagnetization effects
14
. If the central region occu-
pied by a vortex or vortices is small compared to the disk area, one
can approximate H
B
< H r=t. This yields the paramagnetic
response m < l=t, considerable even for macroscopic thin disks.
The plate geometry also leads to an earlier start of PME. This model
is in good, semi-quantitative agreement with the behaviour
observed in our experiment, and also explains the PME in macro-
scopic Nb disks
6,7
and, possibly, in high-T
c
superconductors. The
latter often consist of micrometre-size grains or, owing to inhomo-
geneity of single crystals, can effectively mimic such a medium. M
Received 22 June; accepted 24 August 1998.
1. Braunisch, W. et al. Paramagnetic Meissner effect in Bi high-temperature superconductors. Phys. Rev.
Lett. 68, 1908±1911 (1992).
2. Schliepe, B., Stindtmann, M., Nikolic, I. & Baberschke, K. Positive ®eld-cooled susceptibility in high-
T
C
superconductors. Phys. Rev. B 47, 8331±8334 (1993).
3. Heizel, C., Theiling, T. & Zieman, P. Paramagnetic Meissner effect analyzed by 2nd harmonics of the
magnetic susceptibiity. Phys. Rev. B 48, 3445±3454 (1993).
4. Magnusson, J. et al. Time-dependence of the magnetization of BiSrCaCuO displaying the
paramagnetic Meissner effect. Phys. Rev. B 52, 7675±7681 (1995).
5. Riedling, S. et al. Observation of the Wohlleben effect in YBaCuO single crystals. Phys. Rev. B 49,
13283±13286 (1994).
6. Thompson, D. J., Minhaj, M. S. M., Wenger, L. E. & Chen, J. T. Observation of paramagnetic Meissner
effect in niobium disks. Phys. Rev. Lett. 75, 529±532 (1995).
7. Kostic, P. et al. Paramagnetic Meissner effect in Nb. Phys. Rev. B 53, 791±801 (1996).
8. Sigrist, M. & Rice, T. M. Paramagnetic effect in High-T
C
superconductorsÐa hint for d-wave
superconductivity. J. Phys. Soc. Jpn 61, 4283±4286 (1992).
9. Kusmartsev, F. V. Destruction of the Meissner effect in granular high-temperature superconductors.
Phys. Rev. Lett. 69, 2268±2271 (1992).
10. Dominguez, D., Jagla, E. A. & Balseiro, C. A. Phenomenological theory of the paramagnetic Meissner
effect. Phys. Rev. Lett. 72, 2773±2776 (1994).
11. Khomskii, D. Wohlleben effect (paramagnetic Meissner effect) in high-temperature superconductors.
J. Low Temp. Phys. 95, 205±223 (1994).
12. Chen, D. X. & Hernando, A. Paramagnetic Meissner effect and pi Josephson junctions. Europhys. Lett.
26, 365±370 (1994).
13. Shrivastava, K. N. Para-Meissner oscillations in the magnetization of a high-temperature super-
conductor. Phys. Lett. A 188, 182±186 (1994).
14. Koshelev, A. E. & Larkin, A. I. Paramagnetic moment in ®eld-cooled superconducting platesÐ
paramagnetic Meissner effect. Phys. Rev. B 52, 13559±13562 (1995).
15. Khalil, A. E. Inversion of Meissner effect and granular disorder in BiSrCaCuO superconductors. Phys.
Rev. B 55, 6625±6630 (1997).
16. Moshchalkov, V. V., Qui, X. G. & Bruyndoncz, V. Paramagnetic Meissner effect from the self-
consistent solution of the Ginzburg±Landau equations. Phys. Rev. B 55, 11793±11801 (1997).
17. Rice, T. M. & Sigrist, M. Paramagnetic Meissner effect in NbÐComment. Phys. Rev. B 55, 14647±
14848 (1997).
18. Geim, A. K. et al. Phase transitions in individual sub-micrometre superconductors. Nature 390, 259±
262 (1997).
19. Schweigert, V. A. & Peeters, F. M. Phase transitions in thin superconducting disks. Phys. Rev. B 57,
13817±13832 (1998).
20. Schweigert, V. A., Peeters, F. M. & Deo, P. S. Vortex phase diagram for mesoscopic superconducting
disks. Phys. Rev. Lett. 81, 2783±2786 (1998).
21. Bolech, A. C., Buscaglia, G. C. & Lopez, A. Numerical simulation of vortex arrays in thin super-
conducting ®lms. Phys. Rev. B 52, 15719±15722 (1995).
22. Geim, A. K. et al. Ballistic Hall micromagnetometry. Appl. Phys. Lett. 71, 2379±2381 (1997).
23. Bezryadin, A., Buzdin, A. & Pannetier, B. Phase diagram of multiply connected superconductors. Phys.
Rev. B 51, 3718±3724 (1995).
24. Benoist, R. & Zwerger, W. Critical ®elds of mesoscopic superconductors. Z. Phys. B 103, 377±381
(1997).
25. Palacios, J. J. Vortex matter in superconducting mesoscopic disks: structure, magnetization, and phase
transitons. Phys. Rev. B, 58, R5948±R5951 (1998).
Acknowledgements. We thank I. V. Grigorieva, V. V. Moschalkov and F. M. Peeters for discussions and
FOM for ®nancial support.
Correspondence and requests for materials should be addressed to A.K.G. (geim@sci.kun.nl).
-1.5
-1.0
-0.5
0
0
20
40
6 0
80
1 00
H ( G )
4
π
M
(arbitrary units)
Tc
T<<
Tc
T <
~
Figure 3 Comparison of the magnetization states reached by cooling in a ®eld
and by sweeping the ®eld at a constant temperature. The ®eld-cooling (FC) data
shown by open squares are for the 2.5-mm disk of Fig. 2. The lines are for the CT
regime. The solid curves were measured by pausing at various ®elds and then
sweeping the ®eld up and down (0.4 K). When the magnetic ®eld is swept
continuously, the magnetization evolves along one of the solid curves until it
reaches the end of this curve and jumps to the next one, belonging to another
vortex state. Then, the process repeats itself all over again as shown by dashed
lines. Arrows show the direction of the sweep. The ®lled squares at 35 G indicate
the low-temperature states for the FC and ZFC curves of Fig. 2. The inset
illustrates the compression of a giant vortex (T close but below T
c
) into a smaller
volume (T further away from T
c
) which allows extra ¯ux to enter the sample at the
surface.
Wyszukiwarka
Podobne podstrony:
Naturephot 2008 id 314911 Nieznany
Nature 2004 id 314905 Nieznany
45 Nature 438 197200 2005 id 38 Nieznany (2)
Abolicja podatkowa id 50334 Nieznany (2)
4 LIDER MENEDZER id 37733 Nieznany (2)
katechezy MB id 233498 Nieznany
metro sciaga id 296943 Nieznany
perf id 354744 Nieznany
interbase id 92028 Nieznany
Mbaku id 289860 Nieznany
Probiotyki antybiotyki id 66316 Nieznany
miedziowanie cz 2 id 113259 Nieznany
LTC1729 id 273494 Nieznany
D11B7AOver0400 id 130434 Nieznany
analiza ryzyka bio id 61320 Nieznany
pedagogika ogolna id 353595 Nieznany
Misc3 id 302777 Nieznany
więcej podobnych podstron