
Advanced Financial
Statements Analysis
By David Harper
http://www.investopedia.com/university/financialstatements/
Thanks very much for downloading the printable version of this tutorial.
As always, we welcome any feedback or suggestions.
http://www.investopedia.com/investopedia/contact.asp
Table of Contents
1) Introduction
2) Who's in Charge?
3) The Financial Statements Are a System
4) Cash Flow
5) Earnings
6) Revenue
7) Working Capital
8) Long-Lived Assets
9) Long-Term Liabilities
10) Pension Plans
11) Conclusion and Resources
Introduction
Whether you watch analysts on CNBC or read articles in the Wall Street Journal,
you'll hear experts insisting on the importance of "doing your homework" before
investing in a company. In other words, investors should dig deep into the
company's financial statements and analyze everything from the auditor's report to
the footnotes. But what does this advice really mean, and how does an investor
follow it?
The aim of this tutorial is to answer these questions by providing a succinct yet
advanced overview of financial statements analysis. If you already have a grasp of
This tutorial will give you a deeper understanding of how to analyze these reports
and how to identify the "red flags" and "gold nuggets" of a company. In other words,
it will teach you the important factors that make or break an investment decision.
If you are new to financial statements, have no worries. You can get the background
knowledge you need in these introductory tutorials on
,
,
.
(Page 1 of 66)
Copyright © 2004, Investopedia.com - All rights reserved.

Investopedia.com
– the resource for investing and personal finance education.
Who's in Charge?
In the United States, a company that offers its
to the public typically
needs to file periodic financial reports with the
Securities and Exchange Commission
(SEC). We will focus on the three important reports outlined in this table:
The SEC governs the content of these filings and monitors the accounting profession.
In turn, the SEC empowers the
Financial Accounting Standards Board
(FASB)--an
independent, nongovernmental organization--with the authority to update U.S.
accounting rules. When considering important rule changes, FASB is impressively
careful to solicit input from a wide range of constituents and accounting
professionals. But once FASB issues a final standard, this standard becomes a
mandatory part of the total set of accounting standards known as
(GAAP).
Generally Accepted Accounting Principles (GAAP)
GAAP starts with a conceptual framework that anchors financial reports to a set of
principles such as materiality (the degree to which the transaction is big enough to
matter) and verifiability (the degree to which different people agree on how to
measure the transaction). The basic goal is to provide users--equity investors,
creditors, regulators and the public--with "relevant, reliable and useful" information
for making good decisions.
As the framework is general, it requires interpretation and often re-interpretation in
light of new business transactions. Consequently, sitting on top of the simple
framework is a growing pile of literally hundreds of accounting standards. But
complexity in the rules is unavoidable for at least two reasons.
First, there is a natural tension between the two principles of relevance and
reliability. A transaction is relevant if a reasonable investor would care about it; a
reported transaction is reliable if the reported number is unbiased and accurate. We
want both, but we often cannot get both. For example,
is carried on the
at historical cost because this historical cost is reliable. That is, we can
know with objective certainty how much was paid to acquire property. However,
This tutorial can be found at:
http://www.investopedia.com/university/financialstatements/
(Page 2 of 66)
Copyright © 2004, Investopedia.com - All rights reserved.

Investopedia.com
– the resource for investing and personal finance education.
even though historical cost is reliable, reporting the current
property would be more relevant--but also less reliable.
, an area where relevance trumps reliability.
Derivatives can be complicated and difficult to value, but some derivatives
derivatives) increase
. Rules therefore require companies
to carry derivatives on the balance sheet at "
", which requires an estimate,
even if the estimate is not perfectly reliable. Again, the imprecise fair value estimate
is more relevant than historical cost. You can see how some of the complexity in
accounting is due to a gradual shift away from "reliable" historical costs to "relevant"
market values.
The second reason for the complexity in accounting rules is the unavoidable
restriction on the reporting period: financial statements try to capture operating
performance over the fixed period of a year.
is the practice of
matching expenses incurred during the year with revenue earned, irrespective of
. For example, say a company invests a huge sum of cash to purchase a
factory, which is then used over the following 20 years.
is just a way of
allocating the purchase price over each year of the factory's useful life so that profits
can be estimated each year. Cash flows are spent and received in a lumpy pattern
and, over the long run, total cash flows do tend to equal total accruals. But in a
single year, they are not equivalent. Even an easy reporting question such as "how
much did the company sell during the year?" requires making estimates that
distinguish cash received from revenue earned: for example, did the company use
, attach financing terms, or sell to customers with doubtful credit?
(Please note: throughout this tutorial we refer to U.S. GAAP and U.S.-specific
securities regulations, unless otherwise noted. While the principles of GAAP are
generally the same across the world, there are significant differences in GAAP for
each country. Please keep this in mind if you are performing analysis on non-U.S.
companies. )
The Financial Statements Are a System (Balance Sheet &
Statement of Cash Flow)
Financial statements paint a picture of the transactions that flow through a business.
Each transaction or exchange--for example, the sale of a product or the use of a
rented facility--is a building block that contributes to the whole picture.
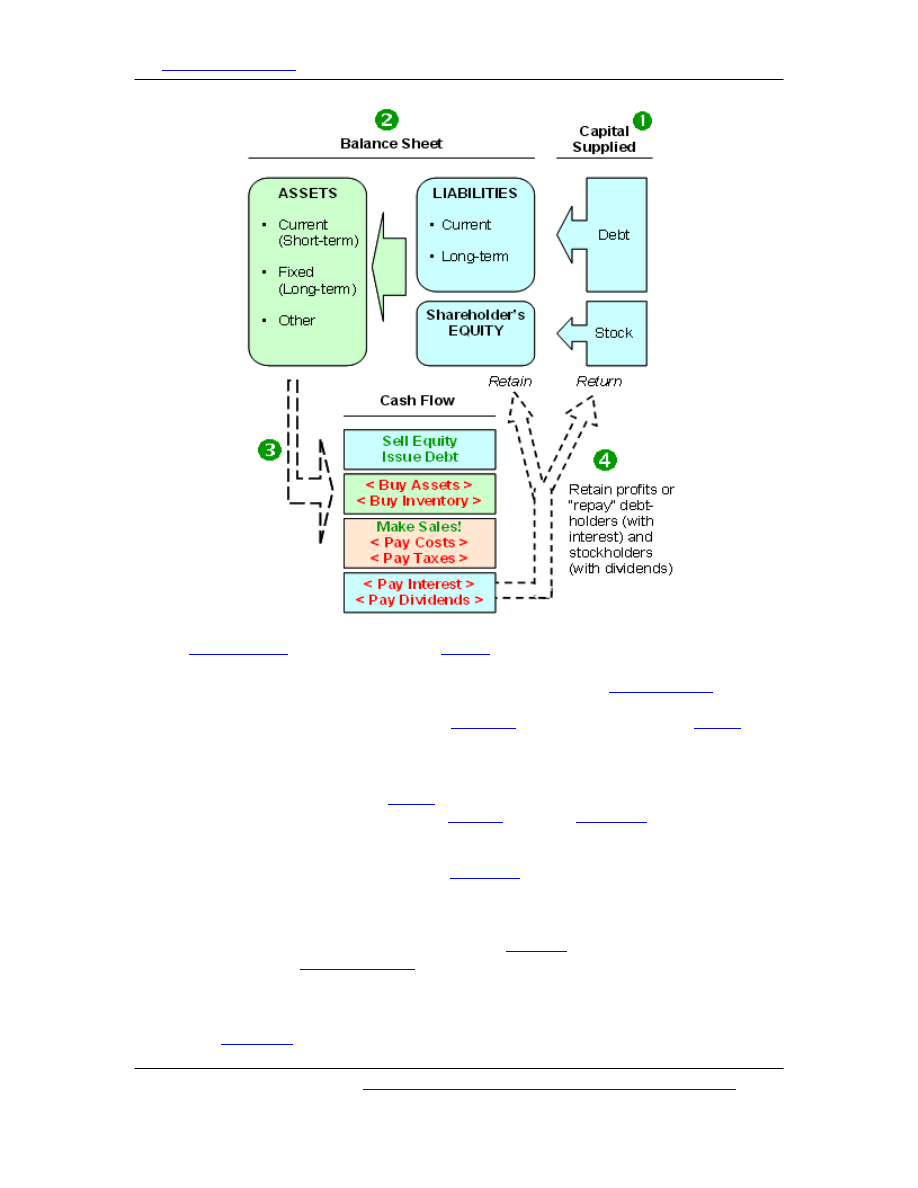
Let's approach the financial statements by following a flow of cash-based
transactions. In the illustration below, we have numbered four major steps:
This tutorial can be found at:
http://www.investopedia.com/university/financialstatements/
(Page 3 of 66)
Copyright © 2004, Investopedia.com - All rights reserved.
Investopedia.com
– the resource for investing and personal finance education.
1.
and lenders supply
(cash) to the company.
2.
The capital suppliers have claims on the company. The
is an
updated record of the capital invested in the business. On the right-hand side
of the balance sheet, lenders hold
equity claim is "residual", which means shareholders own whatever assets
remain after deducting liabilities.
, which are itemized on the left-hand side of
the balance sheet. The assets are
, or long-term,
such as a manufacturing plant.
3.
The assets are deployed to create
in the current year (cash inflows
are shown in green, outflows shown in red). Selling equity and issuing debt
start the process by raising cash. The company then "puts the cash to use" by
purchasing assets in order to create (build or buy) inventory. The inventory
helps the company make sales (generate
), and most of the revenue
is used to pay
, which include salaries.
4.
After paying costs (and taxes), the company can do three things with its cash
profits. One, it can (or probably must) pay interest on its debt. Two, it can
pay
to shareholders at its discretion. And three, it can retain or re-
This tutorial can be found at:
http://www.investopedia.com/university/financialstatements/
(Page 4 of 66)
Copyright © 2004, Investopedia.com - All rights reserved.
Investopedia.com
– the resource for investing and personal finance education.
invest the remaining profits. The retained profits increase the shareholders'
equity account (
). In theory, these reinvested funds are held
for the shareholders' benefit and reflected in a higher share price.
This basic flow of cash through the business introduces two financial
statements: the balance sheet and the statement of cash flows. It is often
said the balance sheet is a static financial snapshot taken at the end of the
year (please see "
" for more details), whereas the
statement of cash flows captures the "dynamic flows" of cash over the period
(see "
What is a Cash Flow Statement?
").
Statement of Cash Flows
The statement of cash flows may be the most intuitive of all statements. We have
already shown that, in basic terms, a company raises capital in order to buy assets
that generate a profit. The statement of cash flows "follows the cash" according to
these three core activities: (1) cash is raised from the capital suppliers (which is the
'cash flow from financing', or CFF), (2) cash is used to buy assets ('cash flow from
investing', or CFI), and (3) cash is used to create a profit ('
', or CFO).
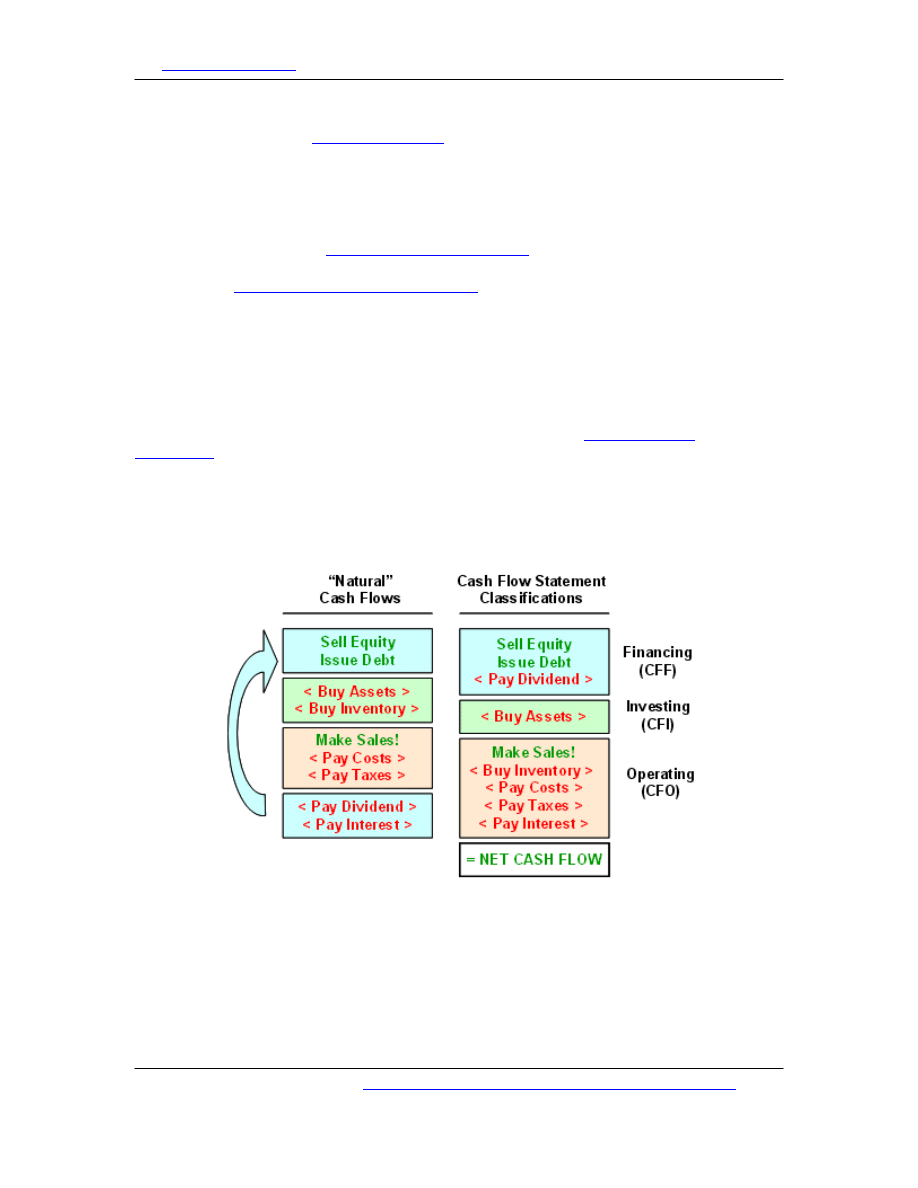
However, for better or worse, the technical classifications of some cash flows are not
intuitive. Below we recast the "natural" order of cash flows into their technical
classifications:
You can see the statement of cash flows breaks into three sections:
1.
Cash flow from financing (CFF) includes cash received (inflow) for the
issuance of debt and equity. As expected, CFF is reduced by dividends paid
(outflow).
This tutorial can be found at:
http://www.investopedia.com/university/financialstatements/
(Page 5 of 66)
Copyright © 2004, Investopedia.com - All rights reserved.

Investopedia.com
– the resource for investing and personal finance education.
2.
Cash flow from investing (CFI) is usually negative because the biggest portion
is the expenditure (outflow) for the purchase of long-term assets such as
plants or machinery. But it can include cash received from separate (that is,
not consolidated) investments or joint ventures. Finally, it can include the
one-time cash inflows/outflows due to
and
.
3.
Cash flow from operations (CFO) naturally includes cash collected for sales
and cash spent to generate sales. This includes operating expenses such as
salaries, rent and taxes. But notice two additional items that reduce CFO:
cash paid for inventory and interest paid on debt.
The total of the three sections of the cash flow statement equals net cash flow: CFF
+ CFI + CFO = net cash flow. We might be tempted to use net cash flow as a
performance measure, but the main problem is that it includes financing flows.
Specifically, it could be abnormally high simply because the company issued debt to
raise cash, or abnormally low because it spent cash in order to retire debt.
CFO by itself is a good but imperfect performance measure. Consider just one of the
problems with CFO caused by the unnatural re-classification illustrated above. Notice
that interest paid on debt (interest expense) is separated from dividends paid:
interest paid reduces CFO but dividends paid reduce CFF. Both repay suppliers of
capital, but the cash flow statement separates them. As such, because dividends are
not reflected in CFO, a company can boost CFO simply by issuing new stock in order
to retire old debt. If all other things are equal, this equity-for-debt swap would boost
CFO.
In the next installment of this series, we will discuss the adjustments you can make
to the statement of cash flows to achieve a more "normal" measure of cash flow.
Cash Flow
In the
of this tutorial, we showed that cash flows through a business
in four generic stages. First, cash is raised from investors and/or borrowed from
lenders. Second, cash is used to buy assets and build inventory. Third, the assets
and inventory enable company operations to generate cash, which pays for expenses
and taxes, before eventually arriving at the fourth stage. At this final stage, cash is
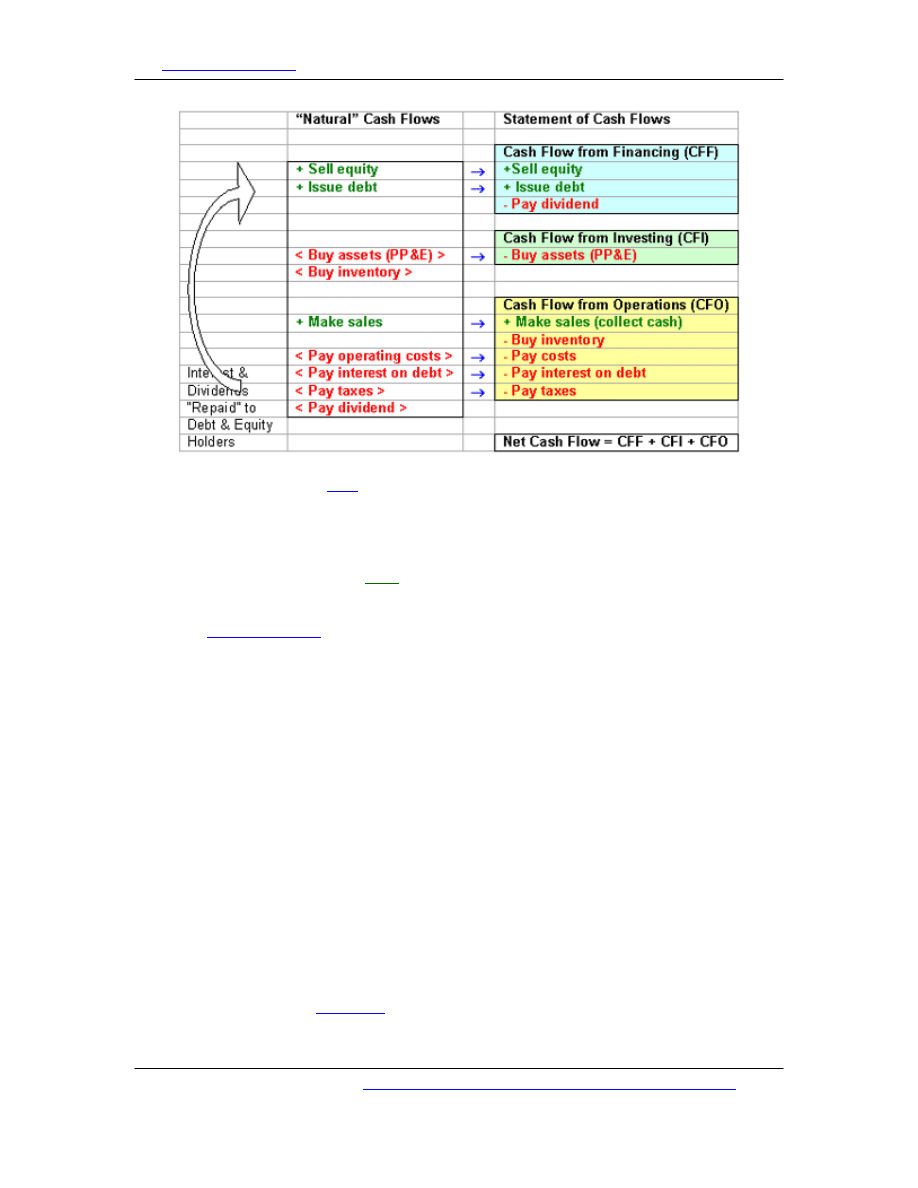
returned to the lenders and investors. Accounting rules require companies to classify
their natural
into one of three buckets (as required by SFAS 95); together
these buckets constitute the statement of cash flows. The diagram below shows how
the natural cash flows fit into the classifications of the statement of cash flows.
Inflows are displayed in green and outflows displayed in red:
This tutorial can be found at:
http://www.investopedia.com/university/financialstatements/
(Page 6 of 66)
Copyright © 2004, Investopedia.com - All rights reserved.
Investopedia.com
– the resource for investing and personal finance education.
The sum of CFF, CFI and
is net cash flow. Although net cash flow is almost
impervious to manipulation by management, it is an inferior performance measure
because it includes financing cash flows (CFF), which, depending on a company's
financing activities, can affect net cash flow in a way that is contradictory to actual
operating performance. For example, a profitable company may decide to use its
extra cash to retire long-term
. In this case, a negative CFF for the cash outlay
to retire debt could plunge net cash flow to zero even though operating performance
is strong. Conversely, a money-losing company can artificially boost net cash flow by
issuing a
or selling stock. In this case, a positive CFF could offset a
negative operating cash flow (CFO) even though the company's operations are not
performing well.
Now that we have a firm grasp of the structure of natural cash flows and how they
are represented/classified, this section will examine which cash flow measures are
best used for particular analyses. We will also focus on how you can make
adjustments to figures so your analysis isn't distorted by reporting manipulations.
Which Cash Flow Measure Is Best?
You have at least three valid cash flow measures to choose from. Which one is
suitable for you depends on your purpose and whether you are trying to value the
stock or the whole company.
The easiest choice is to pull cash flow from operations (CFO) directly from the
statement of cash flows. This is a popular measure, but it has weaknesses when
used in isolation: it excludes capital expenditures--which are typically required to
maintain the firm's productive capability--and it can be manipulated, as we show
below.
If we are trying to do a
or replace an accrual-based earnings measure, the
basic question is "which group/entity does cash flow to?" If we want cash flow to
This tutorial can be found at:
http://www.investopedia.com/university/financialstatements/
(Page 7 of 66)
Copyright © 2004, Investopedia.com - All rights reserved.

Investopedia.com
– the resource for investing and personal finance education.
shareholders, then we should use '
to equity' (FCFE), which is the
analog to
and would be best for a
(P/CF).
If we want cash flows to all capital investors, we should use '
' (FCFF). FCFF is similar to the cash generating base used in
(EVA). In EVA, it's called
net operating profit after taxes
(NOPAT) or
net operating profit less adjusted taxes
(NOPLAT), but both are
essentially FCFF where adjustments are made to the CFO component.
(*) Cash flow from investment (CFI) is used as an estimate of the level of net capital expenditures
required to maintain and grow the company. The goal is to deduct expenditures needed to fund
"ongoing" growth, and if a better estimate than CFI is available, then it should be used.
Free cash flow to equity (FCFE) equals CFO minus cash flows from
(CFI). Why subtract CFI from CFO? Because shareholders care about the cash
available to them after all cash outflows, including long-term investments. CFO can
be boosted merely because the company purchased assets or even another
company. FCFE improves on CFO by counting the cash flows available to
shareholders net of all spending, including investments.
Free cash flow to the firm (FCFF) uses the same formula as FCFE but adds after-tax
interest, which equals interest paid multiplied by [1 –
]. After-tax interest
paid is added because, in the case of FCFF, we are capturing the total net cash flows
available to both shareholders and lenders. Interest paid (net of the company's tax
deduction) is a cash outflow that we add back to FCFE in order to get a cash flow
that is available to all suppliers of capital.
A Note Regarding Taxes
We do not need to subtract taxes separately from any of the three measures above.
CFO already includes (or, more precisely, is reduced by) taxes paid. We usually do
want after-tax cash flows since taxes are a real, ongoing outflow. Of course, taxes
paid in a year could be abnormal. So for valuation purposes, adjusted CFO or EVA-
type calculations adjust actual taxes paid to produce a more "normal" level of taxes.
For example, a firm might sell a subsidiary for a taxable profit and thereby incur
, increasing taxes paid for the year. Because this portion of taxes paid is
non-recurring, it could be removed to calculate a normalized tax expense. But this
kind of precision is not always necessary. It is often acceptable to use taxes paid as
they appear in CFO.
Adjusting Cash Flow from Operations (CFO)
Each of the three cash flow measures includes CFO, but we want to capture
sustainable or recurring CFO, that is, the CFO generated by the ongoing business.
For this reason, we often cannot accept CFO as reported in the statement of cash
flows, and generally need to calculate an "adjusted CFO" by removing one-time cash
This tutorial can be found at:
http://www.investopedia.com/university/financialstatements/
(Page 8 of 66)
Copyright © 2004, Investopedia.com - All rights reserved.
Investopedia.com
– the resource for investing and personal finance education.
flows or other cash flows that are not generated by regular business operations.
Below, we review four kinds of adjustments you should make to reported CFO in
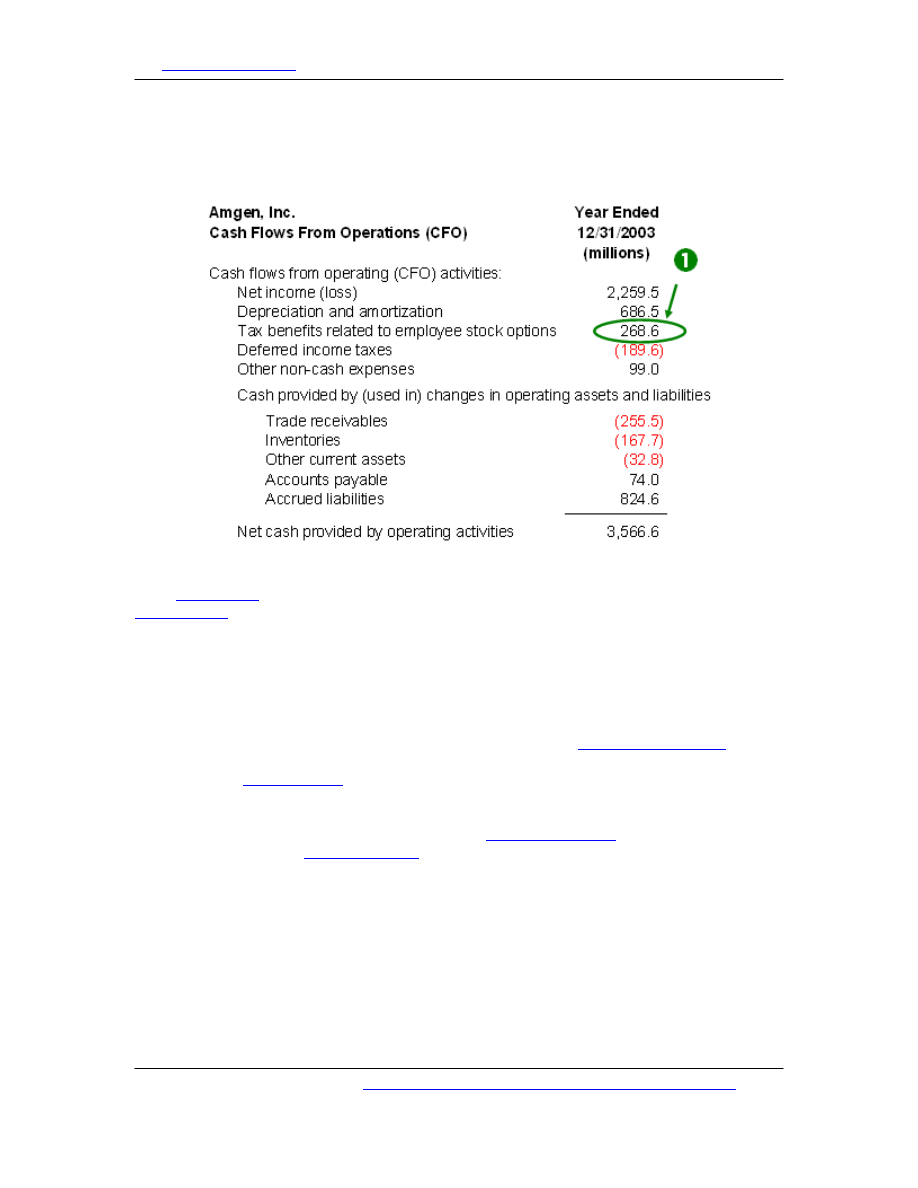
order to capture sustainable cash flows. First, consider a "clean" CFO statement from
Amgen, a company with a reputation for generating robust cash flows:
Amgen shows CFO in the indirect format. Under the indirect format, CFO is derived
from
with two sets of 'add backs'. First, non-cash expenses, such as
, are added back because they reduce net income but do not consume
cash. Second, changes to operating (current) balance sheet accounts are added or
subtracted. In Amgen's case, there are five such additions/subtractions that fall
under the label "cash provided by (used in) changes in operating assets and
liabilities": three of these balance-sheet changes subtract from CFO and two of them
add to CFO.
For example, notice that trade receivables (also known as
)
reduces CFO by about $255 million: trade receivables is a 'use of cash'. This is
account, it increased by $255 million during the year.
This $255 million is included in revenue and therefore net income, but the company
hadn't received the cash as of year-end, so the uncollected revenues needed to be
excluded from a cash calculation. Conversely,
is a 'source of cash'
in Amgen's case. This
account increased by $74 million during the
year; Amgen owes the money (and net income reflects the expense), but the
company temporarily held onto the cash, so its CFO for the period is increased by
$74 million.
We will refer to Amgen's statement to explain the first adjustment you should make
to CFO:
1.
Tax benefits of (related to) employee stock options (See #
1
on
Amgen CFO statement)
This tutorial can be found at:
http://www.investopedia.com/university/financialstatements/
(Page 9 of 66)
Copyright © 2004, Investopedia.com - All rights reserved.
Investopedia.com
– the resource for investing and personal finance education.
Amgen's CFO was boosted by almost $269 million because a company gets a
tax deduction when employees exercise
. As such,
almost 8% of Amgen's CFO is not due to operations and not necessarily
recurring, so the amount of the 8% should be removed from CFO. Although
Amgen's cash flow statement is exceptionally legible, some companies bury
this tax benefit in a footnote.
To review the next two adjustments that must be made to reported CFO, we
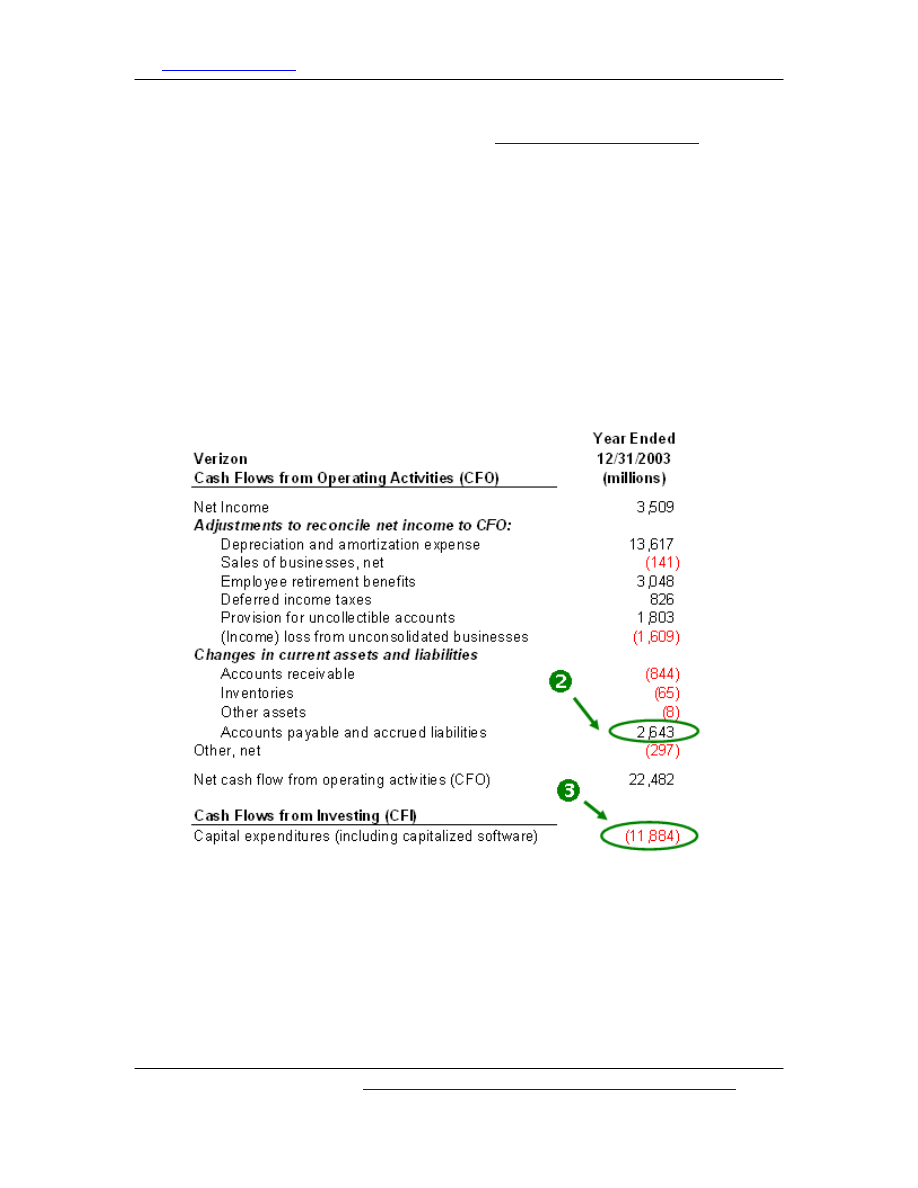
will consider Verizon's statement of cash flows below.
2.
Unusual changes to working capital accounts (receivables,
inventories and payables) (Refer to #
2
on Verizon's CFO statement.)
Although Verizon's statement has many lines, notice that reported CFO is
derived from net income with the same two sets of add backs we explained
above: non-cash expenses are added back to net income and changes to
operating accounts are added to or subtracted from it:
Notice that a change in accounts payable contributed more than $2.6 billion
to reported CFO. In other words, Verizon created more than $2.6 billion in
additional operating cash in 2003 by holding onto vendor bills rather than
paying them. It is not unusual for payables to increase as revenue increases,
but if payables increase at a faster rate than expenses, then the company
effectively creates cash flow by "stretching out" payables to vendors. If these
cash inflows are abnormally high, removing them from CFO is recommended
because they are probably temporary. Specifically, the company could pay
the vendor bills in January, immediately after the end of the fiscal year. If it
This tutorial can be found at:
http://www.investopedia.com/university/financialstatements/
(Page 10 of 66)
Copyright © 2004, Investopedia.com - All rights reserved.

Investopedia.com
– the resource for investing and personal finance education.
does this, it artificially boosts the current-period CFO by deferring ordinary
cash outflows to a future period.
Judgment should be applied when evaluating changes to working capital
accounts, because there can be good or bad intentions behind cash flow
created by lower levels of working capital. Companies with good intentions
can work to minimize their working capital--they can try to collect receivables
quickly, stretch out payables and minimize their inventory. These good
intentions show up as incremental and therefore sustainable improvements to
working capital.
Companies with bad intentions attempt to temporarily dress-up cash flow
right before the end of the reporting period. Such changes to working capital
accounts are temporary because they will be reversed in the subsequent fiscal
year. These include temporarily withholding vendor bills (which causes a
temporary increase in accounts payable and CFO), cutting deals to collect
receivables before year-end (causing a temporary decrease in receivables and
increase in CFO), or drawing down inventory before the year-end (which
causes a temporary decrease in inventory and increase in CFO). In the case
of receivables, some companies sell their receivables to a third party in a
transaction--which has the effect of temporarily boosting CFO.
3.
Capitalized expenditures that should be expensed (outflows in CFI
that should be manually re-classified to CFO) (Refer to #
3
on the
Verizon CFO statement.)
Under cash flow from investing (CFI), you can see that Verizon invested
almost $11.9 billion in cash. This cash outflow was classified under CFI rather
than CFO because the money was spent to acquire long-term assets rather
than pay for inventory or current operating expenses. However, on occasion,
this is a judgment call. WorldCom notoriously exploited this discretion by
reclassifying current expenses into investments, and, in a single stroke,
artificially boosting both CFO and earnings.
Verizon chose to include 'capitalized software' in capital expenditures. This
refers to roughly $1 billion in cash spent (based on footnotes) to develop
internal software systems. Companies can choose to classify software
developed for internal use as an expense (reducing CFO) or an investment
(reducing CFI). Microsoft, for example, responsibly classifies all such
development costs as expenses rather than "capitalizing" them into CFI--
which improves the quality of its reported CFO. In Verizon's case, it's
advisable to reclassify the cash outflow into CFO, reducing it by $1 billion.
The main idea here is that, if you are going to rely solely on CFO, you should
check CFI for cash outflows that ought to be reclassified to CFO.
4.
One-time (nonrecurring) gains due to dividends received or trading
gains
CFO technically includes two cash flow items that analysts often re-classify
into cash flow from financing (CFF): (1)
received from investments
and (2) gains/losses from trading securities (investments that are bought and
This tutorial can be found at:
http://www.investopedia.com/university/financialstatements/
(Page 11 of 66)
Copyright © 2004, Investopedia.com - All rights reserved.

Investopedia.com
– the resource for investing and personal finance education.
sold for short-term profits). If you find that CFO is boosted significantly by
one or both of these items, they are worth examination. Perhaps the inflows
are sustainable. On the other hand, dividends received are often not due to
the company's core operating business and may not be predictable. And gains
from trading securities are even less sustainable. They are notoriously volatile
and should generally be removed from CFO (unless, of course, they are core
to operations, as with an investment firm). Further, trading gains can be
manipulated: management can easily sell tradable securities for a gain prior
to year-end, thus boosting CFO.
Summary
Cash flow from operations (CFO) should be examined for distortions in the following
ways:
• Remove gains from tax benefits due to stock option exercises.
• Check for temporary CFO blips due to working capital actions--for e.g.,
withholding payables, "
" to temporarily reduce inventory.
• Check for cash outflows classified under CFI that should be reclassified to
CFO.
• Check for other one-time CFO blips due to nonrecurring dividends or trading
gains.
Aside from being vulnerable to distortions, the major weakness of CFO is that it
excludes capital investment dollars. We can generally overcome this problem by
using free cash flow to equity (FCFE), which includes (or, more precisely, is reduced
by) capital expenditures (CFI). Finally, the weakness of FCFE is that it will change if
the capital structure changes. That is, FCFE will go up if the company replaces debt
with equity (an action that reduces interest paid and therefore increases CFO) and
vice versa. This problem can be overcome by using free cash flow to firm (FCFF),
which is not distorted by the ratio of debt to equity.
Earnings
In this section, we try to answer the question, "what earnings number should be
used to evaluate company performance?" We start by considering the relationship
between the
, we explained that companies must classify cash flows into one of three
categories: operations, investing, or financing. The diagram below traces selected
cash flows from operations and investing to their counterparts on the income
statement (cash flow from financing (CFF) does not generally map to the income
statement):
This tutorial can be found at:
http://www.investopedia.com/university/financialstatements/
(Page 12 of 66)
Copyright © 2004, Investopedia.com - All rights reserved.

Investopedia.com
– the resource for investing and personal finance education.
Many cash flow items have a direct counterpart, that is, an accrual item on the
income statement. During a reporting period like a
, the
cash flow typically will not match its accrual counterpart. For example, cash spent
during the year to acquire new
will not match
(COGS).
This is because
gives rise to timing differences in the short run:
on the income statement, revenues count when they are earned, and they're
matched against expenses as the expenses are incurred.
Expenses on the income statement are meant to represent costs incurred during the
period that can be tracked either (1) to cash already spent in a prior period or (2) to
cash that probably will be spent in a future period. Similarly, revenues are meant to
recognize cash that is earned in the current period but either (1) has already been
received or (2) probably will be received in the future. Although cash flows and
accruals will disagree in the short run, they should converge in the long run, at least
in theory.
Consider two examples:
• Depreciation - Say a company invests $10 million to buy a manufacturing
plant, triggering a $10 million cash outflow in the year of purchase. If the life
of the plant is 10 years, the $10 million is divided over each of the
subsequent 10 years, producing a non-cash
expense each year
in order to recognize the cost of the asset over its useful life. But
cumulatively, the sum of the depreciation expense ($1 million per year x 10
years) equals the initial cash outlay.
This tutorial can be found at:
http://www.investopedia.com/university/financialstatements/
(Page 13 of 66)
Copyright © 2004, Investopedia.com - All rights reserved.

Investopedia.com
– the resource for investing and personal finance education.
• Interest Expense - Say a company issues a
raising $7 million with the obligation to repay $10 million in five years. During
each of the five interim years, there will be an annual interest expense but no
corresponding cash outlay. However, by the end of the fifth year, the
cumulative interest expense will equal $3 million ($10 million - $7 million),
and the cumulative net financing cash outflow will also be $3 million.
In theory, accrual accounting ought to be superior to cash flows in gauging operating
performance over a reporting period. However, accruals must make estimations and
assumptions, which introduce the possibility of flaws.
The primary goal when analyzing an income statement is to capture
--that is, earnings that are both recurring and operational in nature. Trying
to capture normalized earnings presents two major kinds of challenges: timing issues
and classification choices. Timing issues cause temporary distortions in reported
profits. Classification choices require us to remove one-time items or earnings not
generated by ongoing operations, such as gains from
investments.
Timing Issues
Most timing issues fall into four major categories:
Premature revenue recognition and delayed expenses are more intuitive than the
This tutorial can be found at:
http://www.investopedia.com/university/financialstatements/
(Page 14 of 66)
Copyright © 2004, Investopedia.com - All rights reserved.

Investopedia.com
– the resource for investing and personal finance education.
distortions caused by the
, such as overvalued assets. Overvalued
assets are considered a timing issue here because, in most (but not all) cases, "the
bill eventually comes due." For example, in the case of overvalued assets, a
company might keep depreciation expense low by carrying a long-term asset at an
inflated net
(where net book value equals gross asset minus accumulated
depreciation), but eventually the company will be required to "
" or write-down
the asset, which creates an earnings charge. In this case, the company has managed
to keep early period expenses low by effectively pushing them into future periods.
It is important to be alert to earnings that are temporarily too high or even too low
due to timing issues.
Classification Choices
Once the income statement is adjusted or corrected for timing differences, the other
major issue is classification. In other words, which profit number do we care about?
The question is further complicated because
does not currently dictate a
specific format for the income statement. As of May 2004,
has already spent
over two years on a project that will impact the presentation of the income
statement, and they are not expected to issue a public discussion document until the
second quarter of 2005.
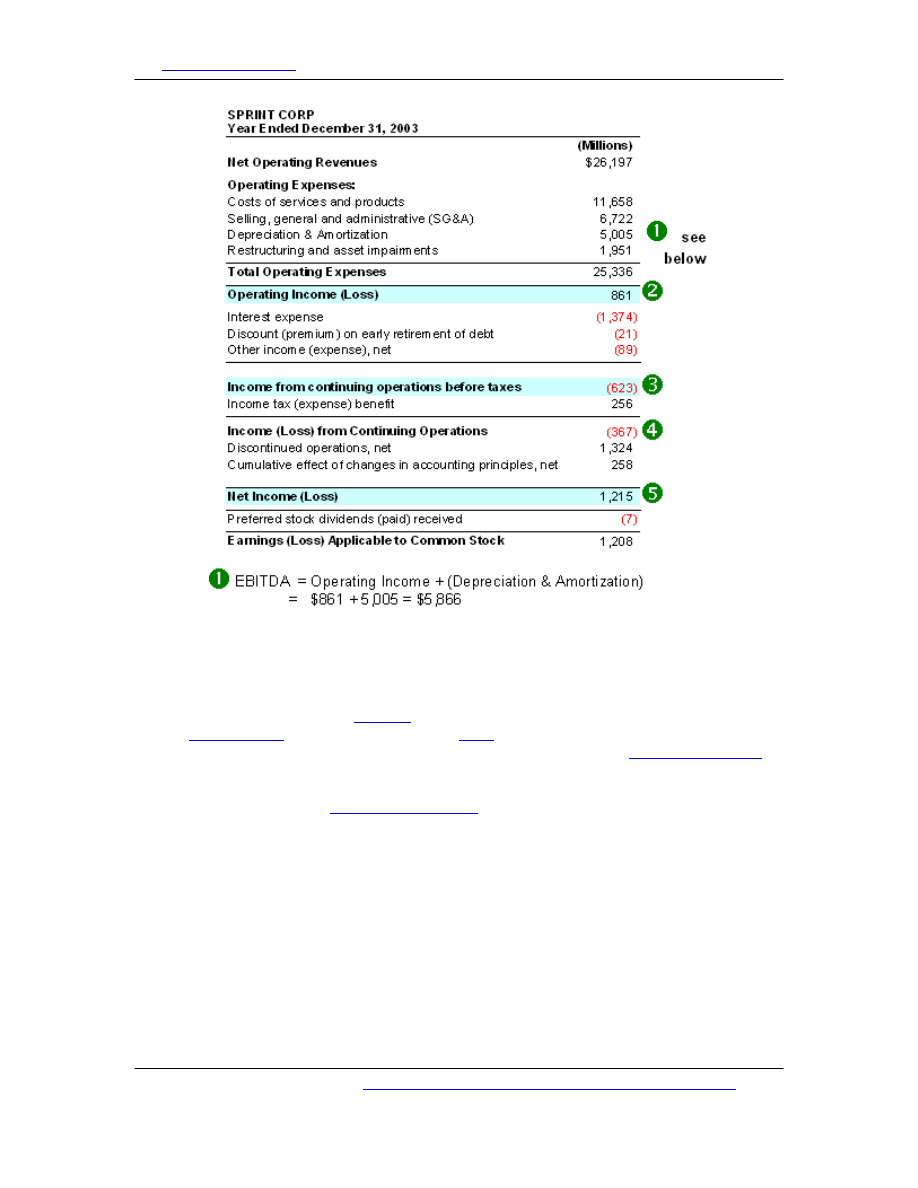
We will use Sprint's latest income statement to answer the question concerning the
issue of classification.
This tutorial can be found at:
http://www.investopedia.com/university/financialstatements/
(Page 15 of 66)
Copyright © 2004, Investopedia.com - All rights reserved.
Investopedia.com
– the resource for investing and personal finance education.
We identified five key lines from Sprint's income statement. (The generic label for
the same line is in parentheses):
1.
Operating Income before Depreciation and Amortization (EBITDA)
Sprint does not show
directly, so we must add "depreciation and
). Some people use EBITDA as a
proxy for cash flow--as depreciation and amortization are
--
but EBITDA does not equal cash flow because it does not include changes to
working capital accounts. For example, EBITDA would not capture the
were to be collected.
The virtue of EBITDA is that it tries to capture operating performance--that is,
profits after cost of goods sold (COGS) and operating expenses, but before
non operating items and financing items such as interest expense. However,
there are two potential problems. First, not necessarily everything in EBITDA
is operating and recurring. Notice that Sprint's EBITDA includes an expense of
$1.951 billion for "restructuring and asset impairments." Sprint surely
includes the expense item here to be conservative, but if we look at the
footnote, we can see that much of this expense is related to employee
terminations. Since we do not expect massive terminations to recur on a
regular basis, we could safely exclude this expense.
This tutorial can be found at:
http://www.investopedia.com/university/financialstatements/
(Page 16 of 66)
Copyright © 2004, Investopedia.com - All rights reserved.

Investopedia.com
– the resource for investing and personal finance education.
Second, EBITDA has the same flaw as
(OCF), which we
discussed in this tutorial's section on cash flow: there is no subtraction for
long-term investments, including the purchase of companies (since
is
a charge for capital employed to make an acquisition). Put another way, OCF
totally omits the company's use of investment capital. A company, for
example, can boost EBITDA merely by purchasing another company.
2.
Operating Income after Depreciation and Amortization (EBIT)
In theory, this is a good measure of operating profit. By including
depreciation and amortization, EBIT counts the cost of making long-term
investments. However, we should trust EBIT only if depreciation expense
(also called accounting or book depreciation) approximates the company's
actual cost to maintain and replace its long-term assets. (Economic
depreciation is the term used to describe the actual cost of maintaining long-
term assets). For example, in the case of a
, where real estate actually
appreciates rather than depreciates--that is, where accounting depreciation is
far greater than economic depreciation--EBIT is useless.
Furthermore, EBIT does not include interest expense and therefore is not
distorted by capital structure changes. That is, it will not be affected merely
because a company substitutes debt for equity or vice versa. By the same
token, however, EBIT does not reflect the earnings that accrue to
shareholders since it must first fund the lenders and the government.
As with EBITDA, the key task is to check that recurring, operating items are
included and items that are either non-operating or non-recurring are
excluded.
3.
Income from Continuing Operations before Taxes (Pre-tax Earnings)
Pre-tax earnings subtracts (includes) interest expense. Further, it includes
other items that technically fall within "income from continuing operations,"
which is an important technical concept.
Sprint's presentation conforms to accounting rules: items that fall within
income from continuing operations are presented on a pre-tax basis (above
the income tax line), whereas items not deemed part of continuing operations
are shown below the tax expense and on a net tax basis.
The thing to keep in mind is that you want to double-check these
classifications. We really want to capture recurring, operating income, so
income from continuing operations is a good start. In Sprint's case, the
company sold an entire publishing division for an after-tax gain of $1.324
billion (see line "discontinued operations, net"). Amazingly, this sale turned a
$623 million loss under income from continuing operations before taxes into a
$1.2+ billion gain under net income. Since this gain will not recur, it is
correctly classified.
On the other hand, notice that income from continuing operations includes a
line for the "discount (premium) on the early retirement of debt." This is a
common item, and it occurs here because Sprint refinanced some debt and
recorded a loss. But, in substance, it is not expected to recur and therefore it
This tutorial can be found at:
http://www.investopedia.com/university/financialstatements/
(Page 17 of 66)
Copyright © 2004, Investopedia.com - All rights reserved.

Investopedia.com
– the resource for investing and personal finance education.
should be excluded.
4.
Income from Continuing Operations (Net Income from Continuing
Operations)
This is the same as above, but taxes are subtracted. From a shareholder
perspective, this is a key line, and it's also a good place to start since it is net
of both interest and taxes. Furthermore, it excludes the non-recurring items
discussed above, which instead fall into net income but can make net income
an inferior gauge of operating performance.
5.
Net Income
Compared to income from continuing operations, net income has three
additional items that contribute to it: extraordinary items, discontinued
operations, and accounting changes. They are all presented net of tax. You
can see two of these on Sprint's income statement: "discontinued operations"
and the "cumulative effect of accounting changes" are both shown net of
taxes--after the income tax expense (benefit) line.
You should check to see if you disagree with the company's classification,
particularly concerning extraordinary items. Extraordinary items are deemed
to be both "unusual and infrequent" in nature. However, if the item is deemed
to be either "unusual" or "infrequent," it will instead be classified under
income from continuing operations.
Summary
In theory, the idea behind accrual accounting should make reported profits superior
to cash flow as a gauge of operating performance. But in practice, timing issues and
classification choices can paint a profit picture that is not sustainable. Our goal is to
capture normalized earnings generated by ongoing operations.
To do that, we must be alert to timing issues that temporarily inflate (or deflate)
reported profits. Furthermore, we should exclude items that are not recurring,
resulting from either one-time events or some activity other than business
operations. Income from continuing operations--either pre-tax or after-tax--is a good
place to start. For gauging operating performance, it is a better starting place than
net income, because net income often includes several non-recurring items such as
discontinued operations, accounting changes, and extraordinary items (which are
both unusual and infrequent).
We should be alert to items that are technically classified under income from
continuing operations but perhaps should be manually excluded. This may include
investment gains and losses, items deemed either "unusual" or "infrequent," and
other one-time transactions such as the early retirement of debt.
Revenue
Revenue recognition refers to a set of accounting rules that governs how a company
accounts for its sales. Many corporate accounting scandals have started with
companies admitting they have reported "irregular"
. This kind of
This tutorial can be found at:
http://www.investopedia.com/university/financialstatements/
(Page 18 of 66)
Copyright © 2004, Investopedia.com - All rights reserved.

Investopedia.com
– the resource for investing and personal finance education.
dishonesty is a critical accounting issue. In several high-profile cases, management
misled investors--and its own
--by deliberately reporting inflated revenues in
order to buoy its company's stock price. As of June 2004, the
(FASB) has begun working to consolidate and streamline the
various accounting rules into a single authoritative pronouncement.
But this series is not concerned with detecting fraud: there are several books that
catalog fraudulent accounting practices and the high-profile corporate meltdowns
that have resulted from them. The problem is that most of these scams went
undetected, even by professional investors, until it was too late. In practice,
individual investors can rarely detect bogus revenue schemes; to a large extent, we
must trust the financial statements as they are reported. However, when it comes to
revenue recognition, there are a few things we can do.
1. Identify Risky Revenues
If only
counted, revenue reporting would not pose any risk of misleading
investors. But the
concept allows companies to book revenue before
receiving cash. Basically, two conditions must be met: (1) the critical earnings event
must be completed (for example, service must be provided or product delivered) and
(2) the payment must be measurable in its amount, agreed upon with the buyer, and
its ultimate receipt must be reasonably assured (SFAC 5,
Bulletin 101).
For some companies, recording revenue is simple; but for others, the application of
the above standards allows for--and even requires--the discretion of management.
The first thing an investor can do is identify whether the company poses a high
degree of accounting risk due to this discretion. Certain companies are less likely to
suffer revenue
simply because they operate with more basic,
. (We could call these "simple revenue" companies.)
Below, we list four aspects of a company and outline the degree of accounting risk
associated with each aspect:
This tutorial can be found at:
http://www.investopedia.com/university/financialstatements/
(Page 19 of 66)
Copyright © 2004, Investopedia.com - All rights reserved.

Investopedia.com
– the resource for investing and personal finance education.
Many of the companies that have restated their revenues sold products or services in
some combination of the modes listed above under "difficult revenues." In other
words, the sales of these companies tended to involve long-term service contracts
(making it difficult to determine how much revenue should be counted in the current
period when the service is not yet fully performed), complex franchise arrangements,
pre-sold memberships or subscriptions, and/or the bundling of multiple products
and/or services.
We're not suggesting that you should avoid these companies--to do so would be
almost impossible! Rather, the idea is to identify the business model, and if you
determine that any risky factors are present, then you should scrutinize the revenue
recognition policies carefully.
For example, Robert Mondavi (
: MOND) sells most of its wines in the U.S. to
distributors under terms called 'FOB Shipping Point'. This means that, once the wines
are shipped, the buyers assume most of the risk, which means they generally cannot
return the product. Mondavi collects simple revenue: it owns its product and gets
paid fairly quickly after delivery, and the product is not subject to overly complex
bundling arrangements. Therefore, when it comes to trusting the reported revenues
"as reported," a company such as Robert Mondavi poses low risk. If you were
analyzing Mondavi, you could spend your time focusing on other aspects of its
financial statements.
On the other hand, enterprise software companies such as Oracle or PeopleSoft
naturally pose above-average accounting risk. Their products are often bundled with
intangible services that are tied to long-term contracts and sold through third-party
This tutorial can be found at:
http://www.investopedia.com/university/financialstatements/
(Page 20 of 66)
Copyright © 2004, Investopedia.com - All rights reserved.
Investopedia.com
– the resource for investing and personal finance education.
resellers. Even the most honest companies in this business cannot avoid making
revenue-reporting judgments and must therefore be scrutinized.
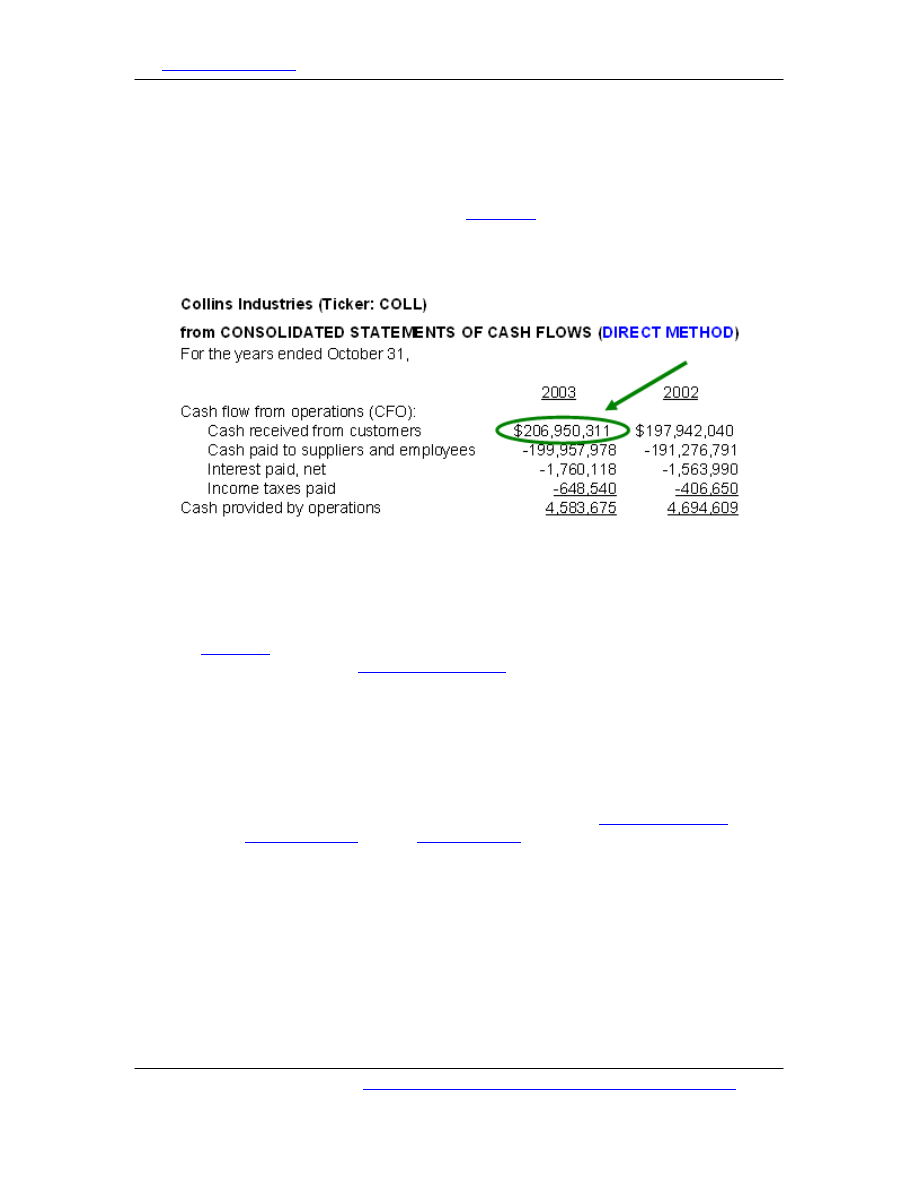
2. Check against Cash Collected
The second thing you can do is to check reported revenues against the actual cash
received from customers. In the section on
, we see that companies can
show cash from operations (CFO) in either the direct or indirect format;
unfortunately, almost all companies use the indirect method. A rare exception is
Collins Industries:
The virtue of the direct method is that it displays a separate line for "cash received
from customers." Such a line is not shown under the indirect method, but we only
need three items to calculate the cash received from customers:
(2) Plus the decrease in
(or minus the increase)
(3) Plus the increase in cash advances from customers
(or minus the decrease)
____________________________________________________________
= Cash received from customers
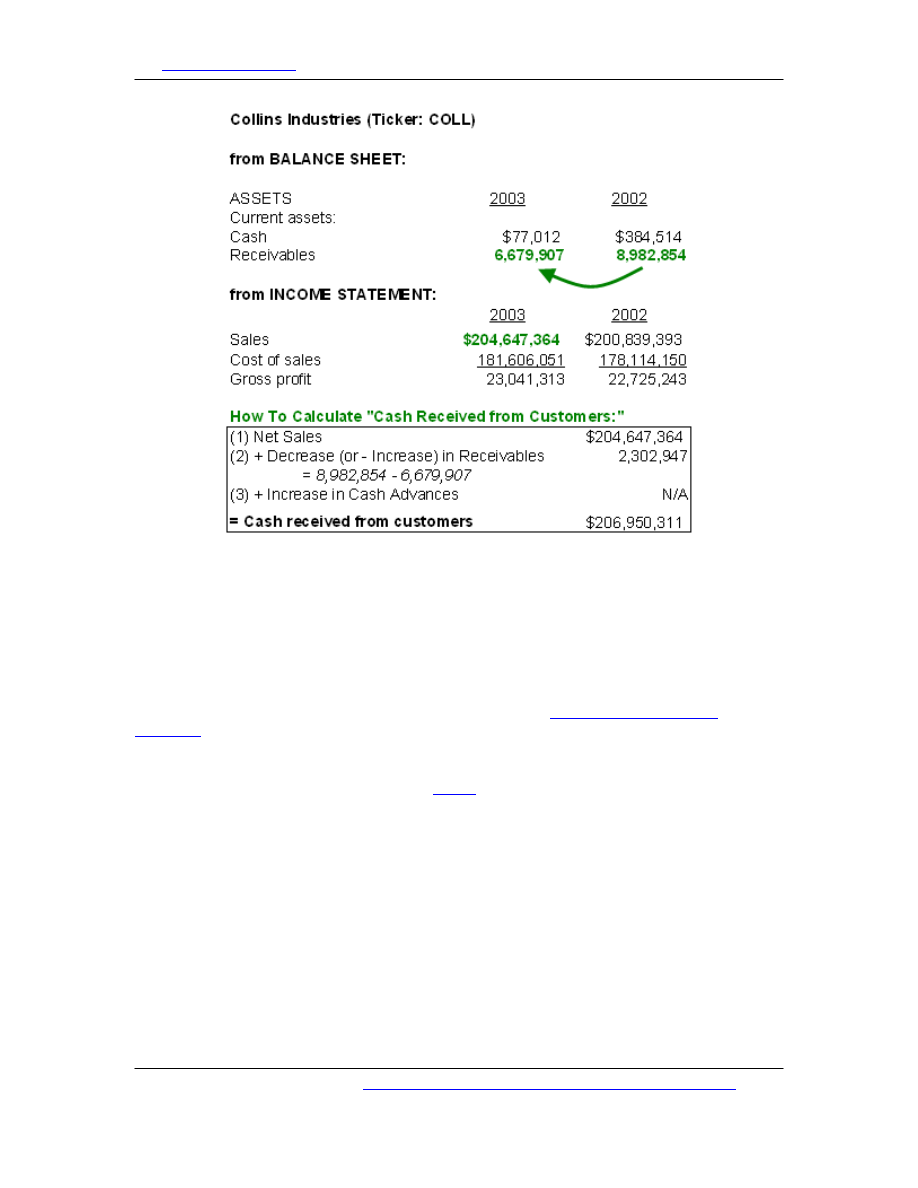
We add the decrease in accounts receivable because it signifies cash received to pay
down receivables. 'Cash advances from customers' represents cash received for
services not yet rendered; this is also known as unearned or
. Below, we do this calculation for
Collins Industries. You can see that our calculated number (shown under "How to
Calculate 'Cash Received from Customers'") equals the reported cash collected from
customers (circled in green above):
This tutorial can be found at:
http://www.investopedia.com/university/financialstatements/
(Page 21 of 66)
Copyright © 2004, Investopedia.com - All rights reserved.
Investopedia.com
– the resource for investing and personal finance education.
We calculate 'cash received from customers' to compare the growth in cash received
to the growth in reported revenues. If the growth in reported revenues jumps far
ahead of cash received, we need to ask why. For example, a company may induce
revenue growth by offering favorable financing terms--like the ads you often see for
consumer electronics that offer "0% financing for 18 months." A new promotion such
as this will create booked revenue in the current period, but cash won't be collected
until future periods. And of course, some of the customers will default, and their cash
won't be collected. So, the initial revenue growth may or may not be "good" growth-
-in which case, we should pay careful attention to the '
Allowance for Doubtful Accounts
Of course, many sales are offered with
terms: the product is sold and an
accounts receivable is created. Because the product has been delivered (or service
has been rendered) and payment is agreed upon, known, and reasonably assured,
the seller can book revenue.
However, the company must estimate how much of the receivables will not be
collected. For example, it may book $100 in gross receivables but, because the sales
were on credit, the company might estimate that $7 will ultimately not be collected.
Therefore, a $7 allowance is created and only $93 is booked as revenue. Hopefully,
you can see that a company can report higher revenues by lowering this allowance.
Therefore, it is important to check that sufficient allowances are made. If the
company is growing rapidly and funding this growth with greater accounts
receivables, then the allowance for doubtful accounts should be growing too.
This tutorial can be found at:
http://www.investopedia.com/university/financialstatements/
(Page 22 of 66)
Copyright © 2004, Investopedia.com - All rights reserved.
Investopedia.com
– the resource for investing and personal finance education.
3. Parse Organic Growth from Other Revenue Sources
The third thing investors can do is scrutinize the sources of revenues. This involves
identifying and then parsing different sources of growth. The goal is to identify the
sources of temporary growth and separate them from
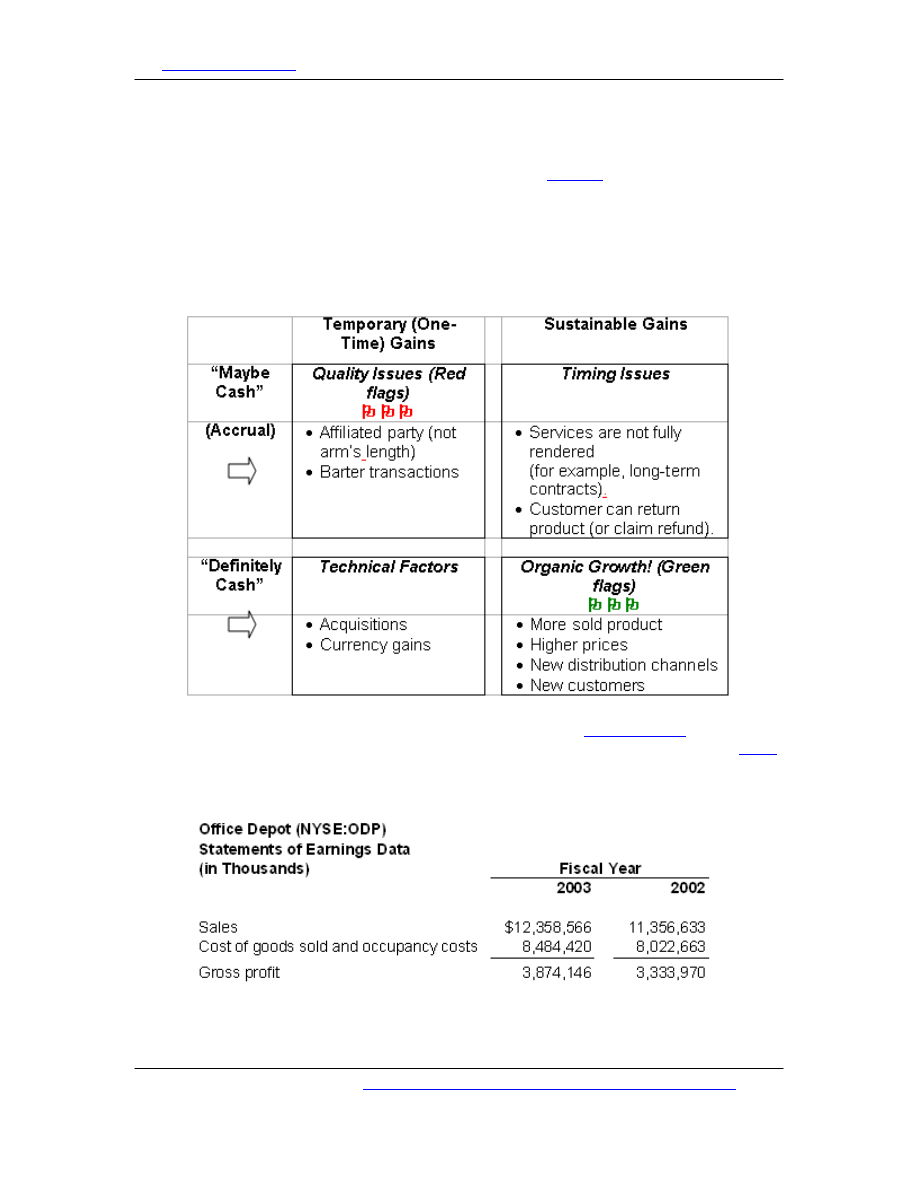
Let's consider the two dimensions of revenue sources. The first dimension is cash
versus accrual: we call this "cash" versus "maybe cash" (represented on the left side
of the box below). "Maybe cash" refers to any booked revenue that is not collected
as cash in the current period. The second dimension is sustainable versus temporary
revenue (represented on the top row of the box below):
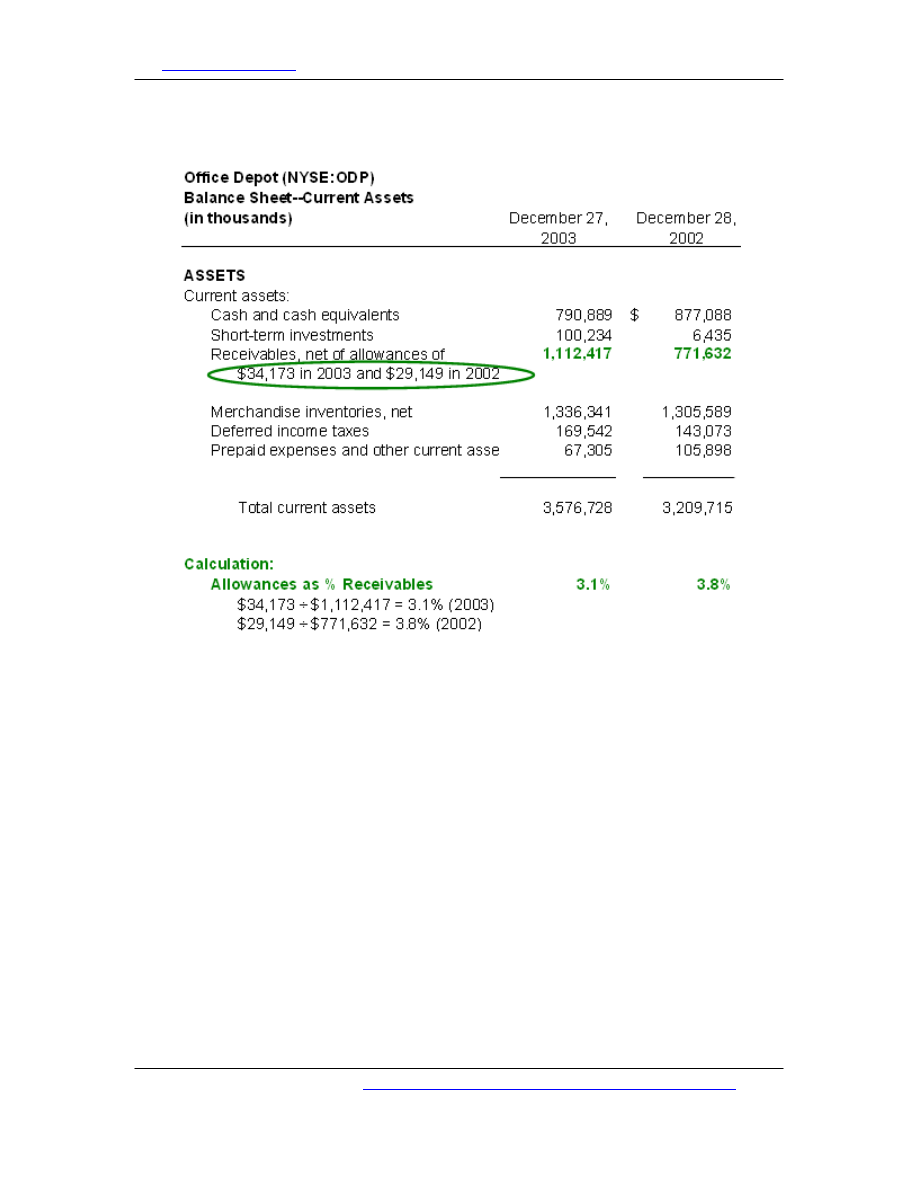
To illustrate the parsing of revenues, we will use the latest
from Office
Depot (ticker: ODP), a global retail supplier of office products and services. For
2003, reported sales of $12.358 billion represented an 8.8% increase over the prior
year.
First, we will parse the accrual (the "maybe cash") from the cash. We can do this by
looking at the receivables. You will see that, from 2002 to 2003, receivables jumped
This tutorial can be found at:
http://www.investopedia.com/university/financialstatements/
(Page 23 of 66)
Copyright © 2004, Investopedia.com - All rights reserved.
Investopedia.com
– the resource for investing and personal finance education.
from $777.632 million to $1.112 billion. And the allowance for doubtful accounts
increased from $29.149 million in 2002 to $34.173 million in 2003.
Office Depot's receivables jumped more than its allowance. If we divide the
allowance into the receivables (see bottom of exhibit above), you see that the
allowance (as a percentage of receivables) decreased from 3.8% to 3.1%. Perhaps
this is reasonable, but the decrease helped to increase the booked revenues.
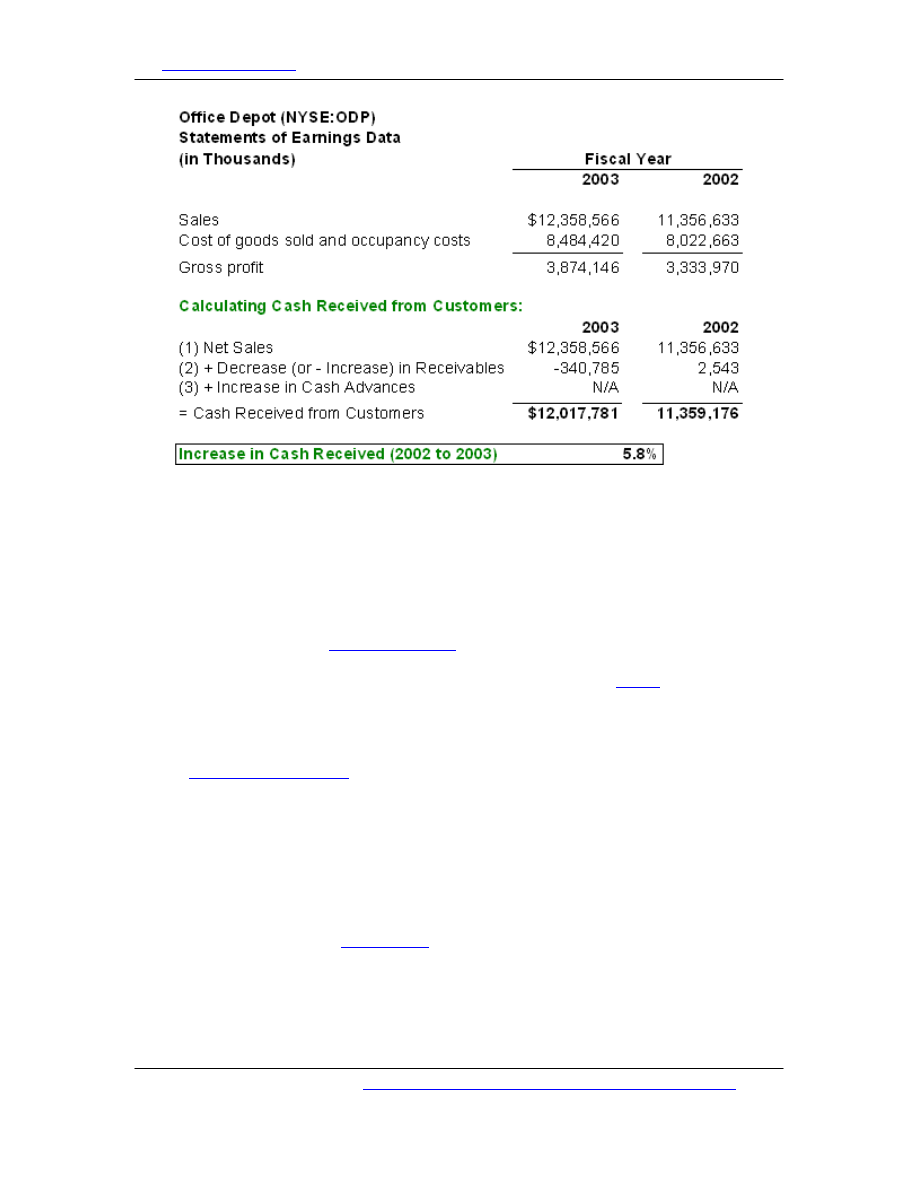
Furthermore, we can perform the calculation reviewed above (in #2) to determine
the cash received from customers:
This tutorial can be found at:
http://www.investopedia.com/university/financialstatements/
(Page 24 of 66)
Copyright © 2004, Investopedia.com - All rights reserved.
Investopedia.com
– the resource for investing and personal finance education.
Cash received did not increase as much as reported sales. This is not a bad thing by
itself. It just means that we should take a closer look to determine whether we have
a quality issue (upper left-hand quadrant of the box above) or a timing issue (upper
right-hand quadrant of the box). A quality issue is a "red flag" and refers to the
upper left-hand quadrant: temporary accruals. We want to look for any one-time
revenue gains that are not cash.
When we read Office Depot's footnotes, we will not find any glaring red flags,
(sales at stores open for at least a year)
actually decreased in the United States. The difference between cash and accrual
appears to be largely due to timing. Office Depot did appear to
receivables--that is, sell receivables to a third party in exchange for cash, but
factoring by itself is not a red flag. In Office Depot's case, the company converted
receivables to cash and transferred some (or most) of the credit risk to a third party.
Factoring affects cash flows (and we need to be careful with it, to the extent that it
) but, in terms of revenue, factoring should raise a red
flag only when (i) the company retains the entire risk of collections, and/or (ii) the
company factors with an affiliated party that is not at arm's length.
Cash-Based but Temporary Revenue
When it comes to analyzing the sources of sustainable revenues, it helps to parse the
"technical" factors (lower left-hand quadrant). These are often strangely neglected
by investors.
The first technical factor is
. Take a look at this excerpt from a footnote in
Office Depot's annual report:
…impacting sales in our International Division during 2003 was our acquisition of
Guilbert in June which contributed additional sales of $808.8 million. (Item 7)
This tutorial can be found at:
http://www.investopedia.com/university/financialstatements/
(Page 25 of 66)
Copyright © 2004, Investopedia.com - All rights reserved.

Investopedia.com
– the resource for investing and personal finance education.
Therefore, almost all of Office Depot's $1 billion in sales growth can be attributed to
an acquisition. Acquisitions are not bad in and of themselves, but they are not
organic growth. Here are some key follow-up questions you should ask about an
acquisition: How much is the acquired company growing? How will it contribute to
the
's growth going forward? What was the purchase price? In Office
Depot's case, this acquisition should alert us to the fact that the core business
(before acquisition) is flat or worse.
The second technical factor is revenue gains due to currency translation. Here is
another footnote from Office Depot:
As noted above, sales in local currencies have substantially increased in recent
years. For U.S. reporting, these sales are translated into U.S. dollars at average
exchange rates experienced during the year. International Division sales were
positively impacted by foreign exchange rates in 2003 by $253.2 million and $67.0
million in 2002 (International Division).
Here we see one of the benefits of a weaker U.S. dollar: it boosts the international
sales numbers of U.S. companies! In Office Depot's case, international sales were
boosted by $253 million because the dollar weakened over the year. Why? A weaker
dollar means more dollars are required to buy a foreign currency, but conversely, a
foreign currency is translated into more dollars. So, even though a product may
maintain its price in foreign currency terms, it will translate into a greater number of
dollars as the dollar weakens.
We call this a technical factor because it is a double-edged sword: if the U.S. dollar
strengthens, it will hurt international sales. Unless you are a currency expert and
mean to bet on the direction of the dollar, you probably want to treat this as a
random variable. The follow-up question to the currency factor is this: Does the
company
its foreign currency? (Office Depot generally does not, so it is
Summary
Revenue recognition is a hot topic and the subject of much post-mortem analysis in
the wake of multiple high-profile restatements. We don't think you can directly guard
against fraud; that is the job of a company's auditor and the audit committee of the
. But you can do the following:
• Determine the degree of accounting risk posed by the company's business model.
• Compare growth in reported revenues to cash received from customers.
• Parse organic growth from the other sources, and be skeptical of any one-time
revenue gains not tied directly to cash (quality of revenues). Scrutinize any material
gains due to acquisitions. And finally, omit currency gains.
Working Capital (Balance Sheet: Current)
A recurring theme in
is the importance of investors shaping their
analytical focus according to companies'
. Especially when time is
limited, it's smart to tailor your emphasis so it's in line with the economic drivers
This tutorial can be found at:
http://www.investopedia.com/university/financialstatements/
(Page 26 of 66)
Copyright © 2004, Investopedia.com - All rights reserved.

Investopedia.com
– the resource for investing and personal finance education.
. It's tough to get ahead of the "investing
pack" if you are reacting to generic financial results--such as
(EPS) or
growth--after they've already been reported. For any given
business, there usually are some key economic drivers, or
,that
capture and reflect operational performance and eventually translate into
such as EPS. For certain businesses, trends in the working capital accounts
can be among these key leading indicators of
.
Where Is Working Capital Analysis Most Critical?
On the one hand,
is always of significance. This is especially true
perspective, where the main concern is defensiveness:
can the company meet its short-term obligations, such as paying vendor bills?
But from the perspective of equity
and the company's growth prospects,
working capital is more critical to some businesses than to others. At the risk of
oversimplifying, we could say that the models of these businesses are
asset intensive rather than service or
(examples of service intensive
companies are H&R Block, which provides
services, and Manpower,
which provides employment services). In asset intensive sectors, firms such as
telecom and pharmaceutical companies invest heavily in
term, whereas others invest capital primarily to build and/or buy
. It is the
latter type of business--the type that is capital intensive with a focus on inventory
rather than fixed assets--that deserves the greatest attention when it comes to
working capital analysis. These businesses tend to involve retail, consumer goods,
and technology hardware (especially if they are low-cost producers or distributors).
Working capital is the difference between
and
:
Inventory
Inventory balances are significant because inventory cost accounting impacts
. For an explanation of how this happens, see
"
Inventory Valuation For Investors: FIFO and LIFO
." Investors tend to monitor gross
profit margins, which are often considered a measure of the value provided to
consumers and/or the company's "
" in the industry. However, we
should be alert to how much gross profit margins depend on the inventory costing
method.
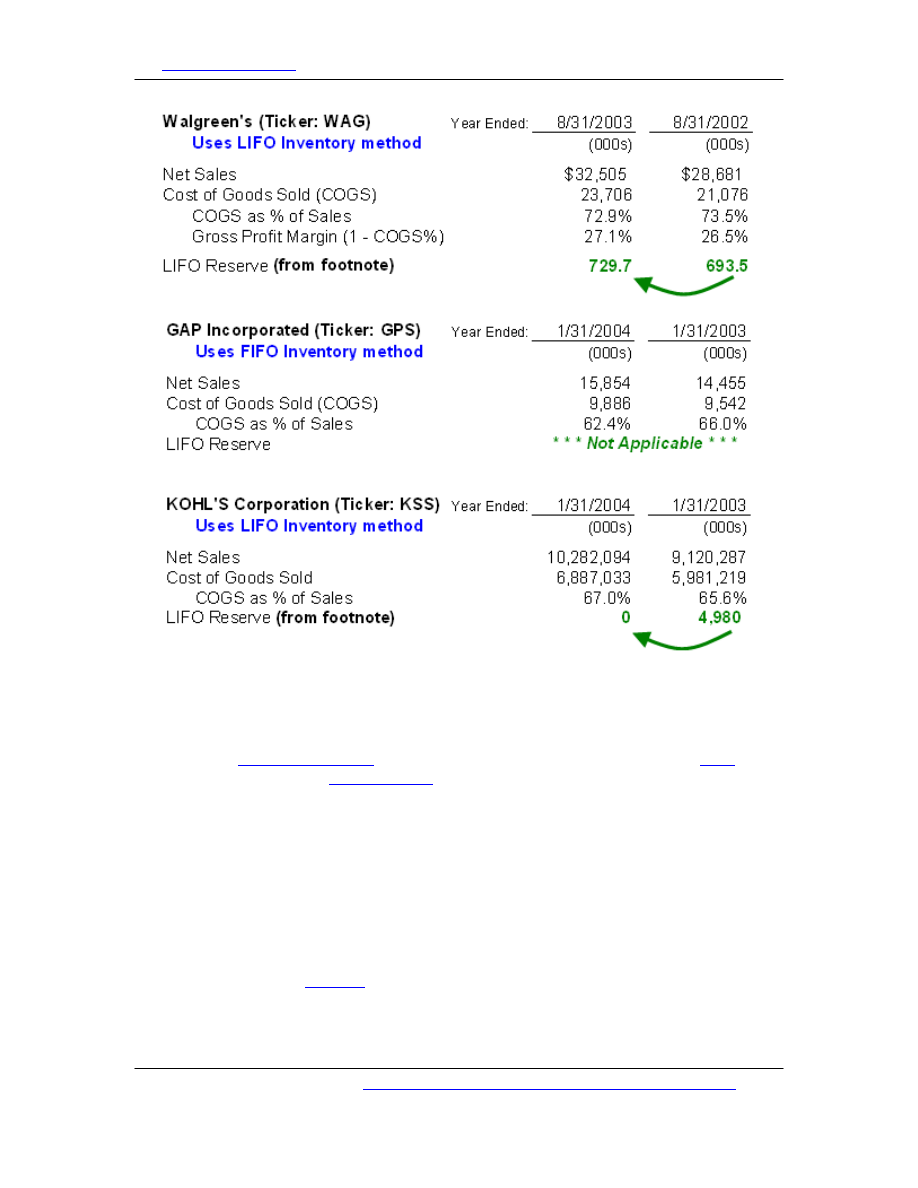
Below we compare three accounts--
,
(COGS), and the
reserve--used by three prominent retailers:
This tutorial can be found at:
http://www.investopedia.com/university/financialstatements/
(Page 27 of 66)
Copyright © 2004, Investopedia.com - All rights reserved.
Investopedia.com
– the resource for investing and personal finance education.
Walgreen's represents our normal case and arguably shows the "best practice" in this
regard: the company uses LIFO inventory costing, and its LIFO reserve increases
year over year. In a period of rising prices, LIFO will assign higher prices to the
consumed inventory (cost of goods sold) and is therefore more conservative. Just as
COGS on the
tends to be higher under LIFO than under
, the
inventory account on the
tends to be understated. For this reason,
companies using LIFO must disclose (usually in a footnote) a LIFO reserve, which
when added to the inventory balance as reported, gives the FIFO-equivalent
inventory balance.
As GAP Incorporated uses FIFO inventory costing, there is no need for a "LIFO
reserve." However, GAP's and Walgreen's gross profit margins are not
commensurable--that is, comparing FIFO to LIFO is not like comparing apples to
apples. GAP will get a slight upward bump to its gross profit margin because its
inventory method will tend to undercount the cost of goods. There is no automatic
solution for this. Rather, we can revise GAP's COGS (in dollar terms) if we make an
assumption about the
rate during the year. Specifically, if we assume that
the inflation rate for the inventory was R% during the year, and if "Inventory
Beginning" in the equation below equals the inventory balance under FIFO, then we
can re-estimate COGS under LIFO with the following equation:
This tutorial can be found at:
http://www.investopedia.com/university/financialstatements/
(Page 28 of 66)
Copyright © 2004, Investopedia.com - All rights reserved.
Investopedia.com
– the resource for investing and personal finance education.
Kohl's Corporation uses LIFO, but its LIFO reserve declined year over year--from
$4.98 million to zero. This is known as
or liquidation of LIFO layers,
and indicates that, during the fiscal year, Kohl's sold or liquidated inventory that was
held at the beginning of the year. When prices are rising, we know that inventory
held at the beginning of the year carries a lower cost (because it was purchased in
prior years). Cost of goods sold is therefore reduced, sometimes significantly.
Generally, in the case of a sharply declining LIFO reserve, we can assume that
reported profit margins are upwardly biased to the point of distortion.
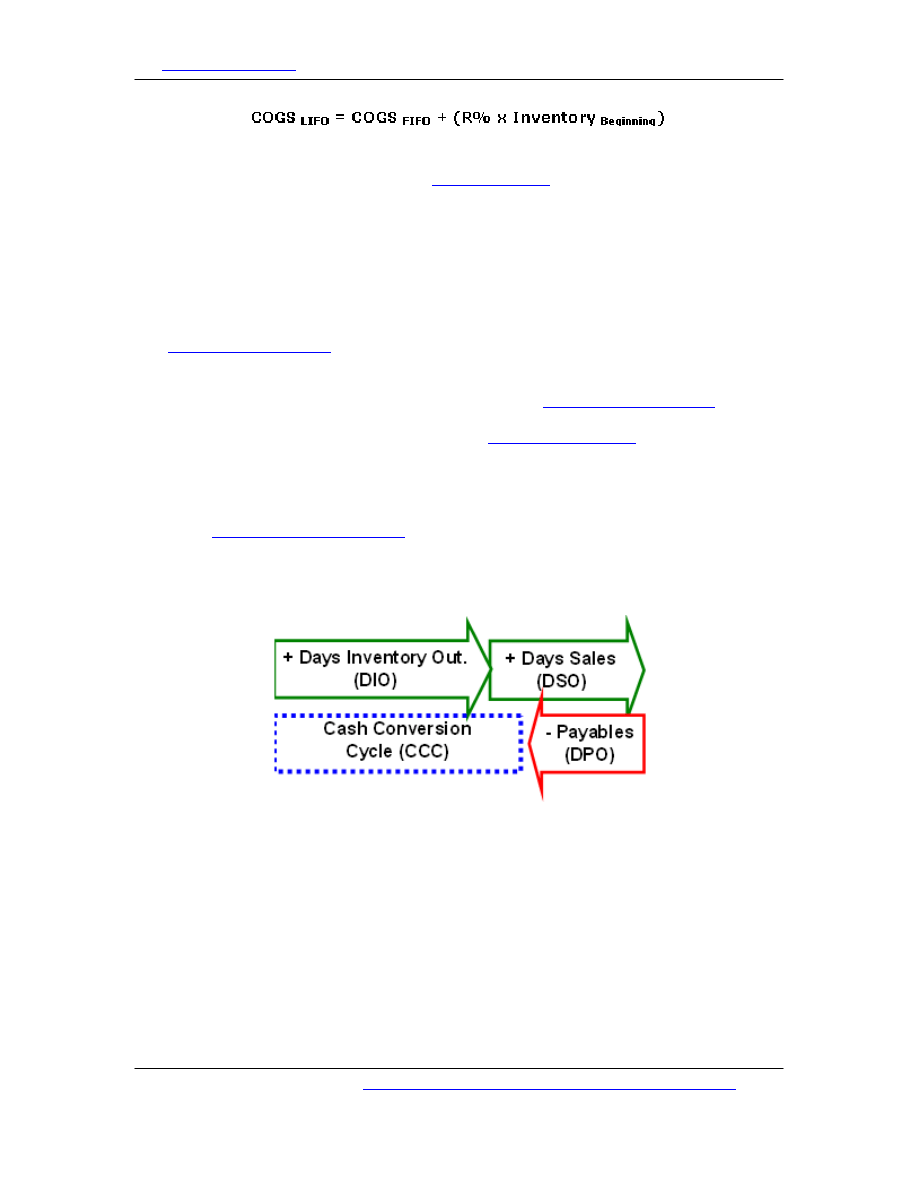
Cash Conversion Cycle
The
is a measure of working capital efficiency, often giving
valuable clues about the underlying health of a business. The cycle measures the
average number of days that working capital is invested in the operating cycle. It
starts by adding days inventory outstanding (DIO) to
(DSO).
This is because a company "invests" its cash to acquire/build inventory, but does not
collect cash until the inventory is sold and the
are finally
collected.
Receivables are essentially loans extended to customers that consume working
capital; therefore, greater levels of DIO and DSO consume more working capital.
However,
(DPO)--which essentially represent loans from
vendors to the company--are subtracted to help offset working capital needs. In
summary, the cash conversion cycle is measured in days and equals DIO + DSO –
DPO:
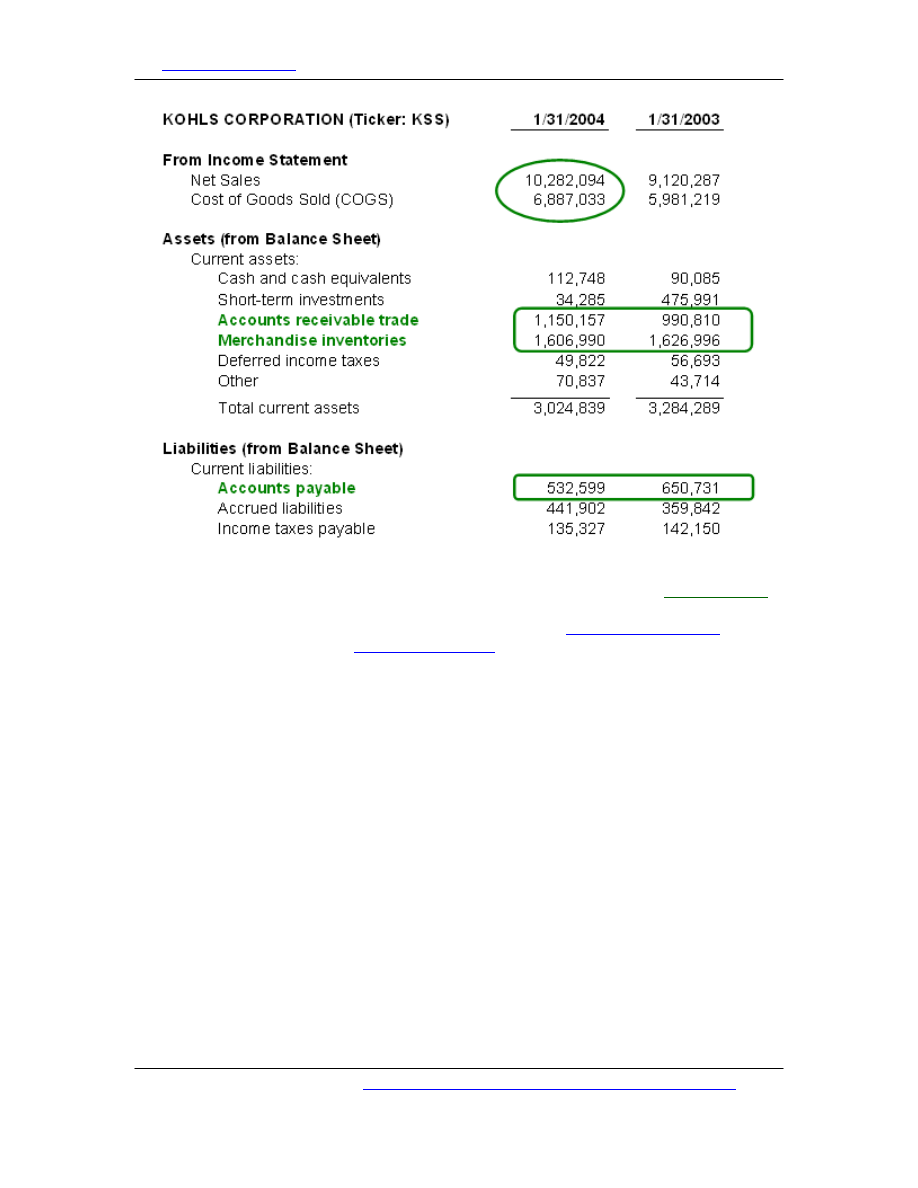
Here we extracted two lines from Kohl's (a retail department store) most recent
income statement and a few lines from their working capital accounts.
This tutorial can be found at:
http://www.investopedia.com/university/financialstatements/
(Page 29 of 66)
Copyright © 2004, Investopedia.com - All rights reserved.
Investopedia.com
– the resource for investing and personal finance education.
Circled in green are the accounts needed to calculate the cash conversion cycle.
From the income statement, you need net sales and COGS. From the
,
you need receivables, inventories, and payables. Below, we show the two-step
calculation. First, we calculate the three turnover ratios:
(sales/average receivables),
(COGS/average inventory), and
payables turnover (purchases/average payables). The turnover ratios divide into an
average balance because the numerators (such as sales in the receivables turnover)
are flow measures over the entire year.
Also, for payables turnover, some use COGS/average payables. That's okay, but it's
slightly more accurate to divide average payables into purchases, which equals
COGS plus the increase in inventory over the year (inventory at end of year minus
inventory at beginning of the year). This is better because payables finance all of the
operating dollars spent during the period (that is, they are credit extended to the
company). And operating dollars, in addition to COGS, may be spent to increase
inventory levels.
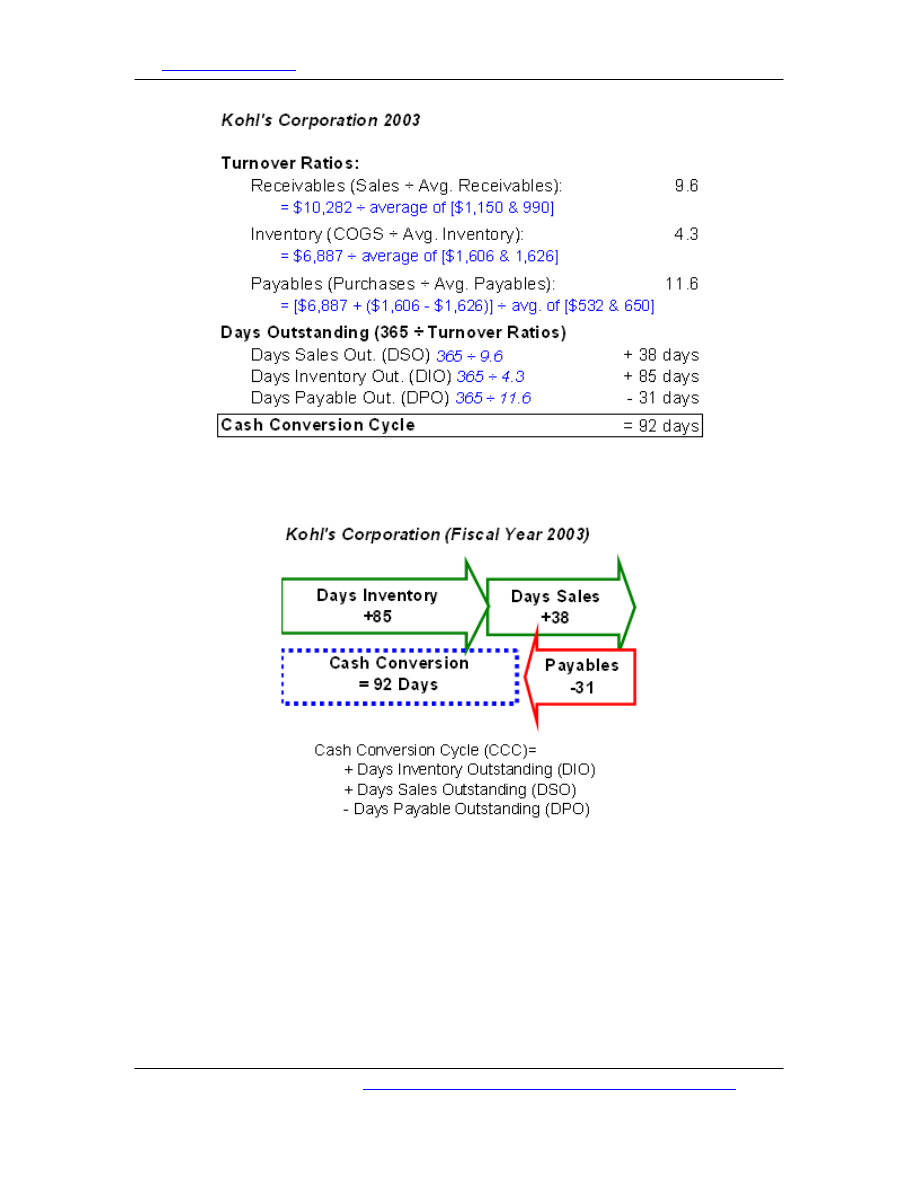
The turnover ratios do not mean much in isolation; rather, they are used to compare
one company to another. But if you divide the turnover ratios into 365 (for example,
365/receivables turnover), you get the "days outstanding" numbers. Below, for
example, a receivable turnover of 9.6 becomes 38 days sales outstanding (DSO).
This number has more meaning; it means that, on average, Kohl's collects its
receivables in 38 days.
This tutorial can be found at:
http://www.investopedia.com/university/financialstatements/
(Page 30 of 66)
Copyright © 2004, Investopedia.com - All rights reserved.
Investopedia.com
– the resource for investing and personal finance education.
Here is a graphic summary of Kohl's cash conversion cycle for 2003. On average,
working capital spent 92 days in Kohl's operating cycle:
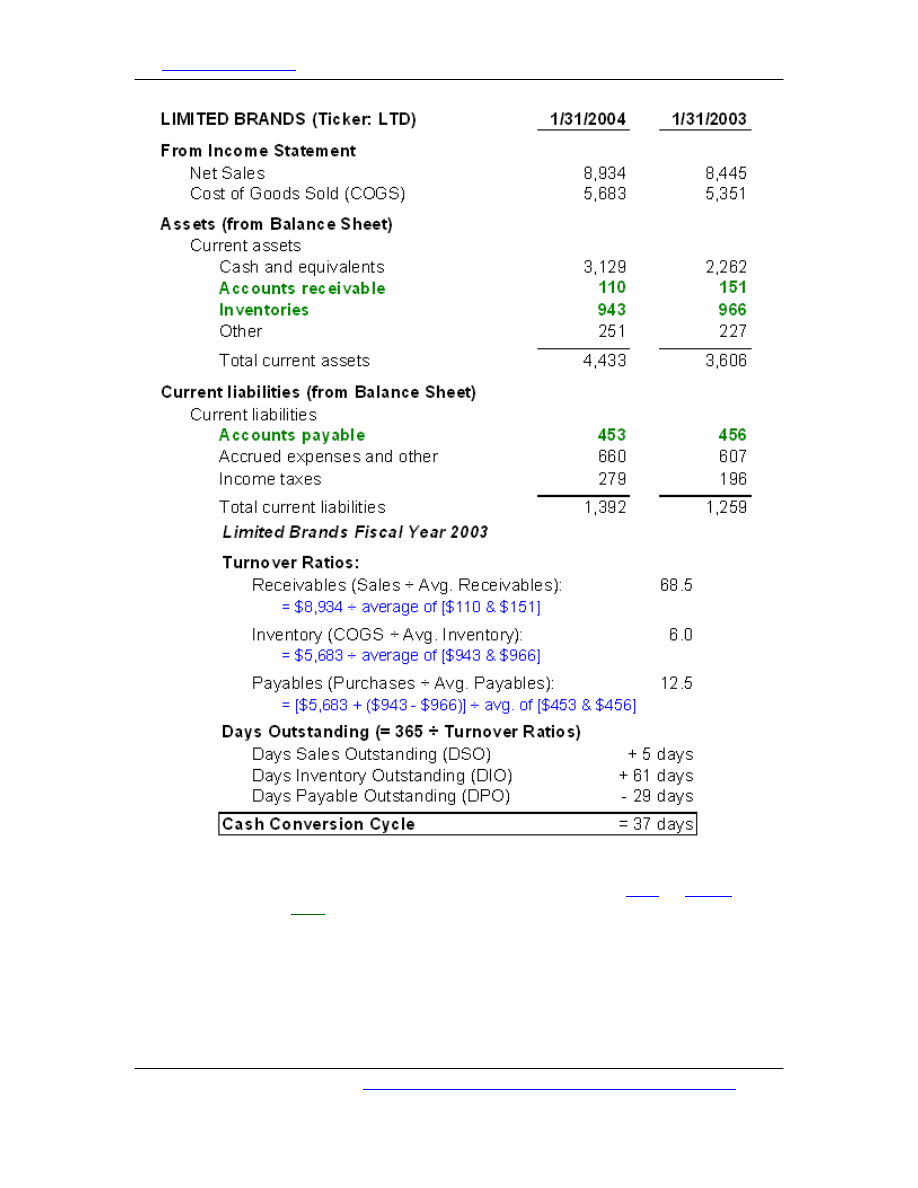
Let's contrast Kohl's with Limited Brands. Below we perform the same calculations in
order to determine the cash conversion cycle for Limited Brands:
This tutorial can be found at:
http://www.investopedia.com/university/financialstatements/
(Page 31 of 66)
Copyright © 2004, Investopedia.com - All rights reserved.
Investopedia.com
– the resource for investing and personal finance education.
While Kohl's cycle is 92 days, Limited Brand's cycle is only 37. Why does this matter?
Because working capital must be financed somehow, with either
both companies use
. Kohl's cost of sales (COGS) is about $6.887 billion per
year, or almost $18.9 million per day ($6.887 billion/365 days). Because Kohl's cycle
is 92 days, it must finance--that is, fund its working capital needs--to the tune of
about $1.7+ billion per year ($18.9 million x 92 days). If interest on its debt is 5%,
then the cost of this financing is about $86.8 million ($1.7 billion x 5%) per year.
However, if, hypothetically, Kohl's were able to reduce its cash conversion cycle to
37 days--the length of Limited Brands' cycle--its cost of financing would drop to
This tutorial can be found at:
http://www.investopedia.com/university/financialstatements/
(Page 32 of 66)
Copyright © 2004, Investopedia.com - All rights reserved.
Investopedia.com
– the resource for investing and personal finance education.
about $35 million ($18.9 million per day x 37 days x 5%) per year. In this way, a
reduction in the cash conversion cycle drops directly to the
But even better, the year over year trend in the cash conversion cycle often serves
as a sign of business health or deterioration. Declining DSO means customers are
paying sooner; conversely, increasing DSO could mean the company is using
to push product. A declining DIO signifies that inventory is moving out rather than
"piling up." Finally, some analysts believe that an increasing DPO is a signal of
increasing economic leverage in the marketplace. The textbook examples here are
Wal-mart and Dell: these companies can basically dictate the terms of their
relationships to their vendors and, in the process, extend their days payable (DPO).
Looking "Under the Hood" for Other Items
Most of the other working capital accounts are straightforward, especially the current
liabilities side of the balance sheet. But you do want to be on the alert for the
following:
•
•
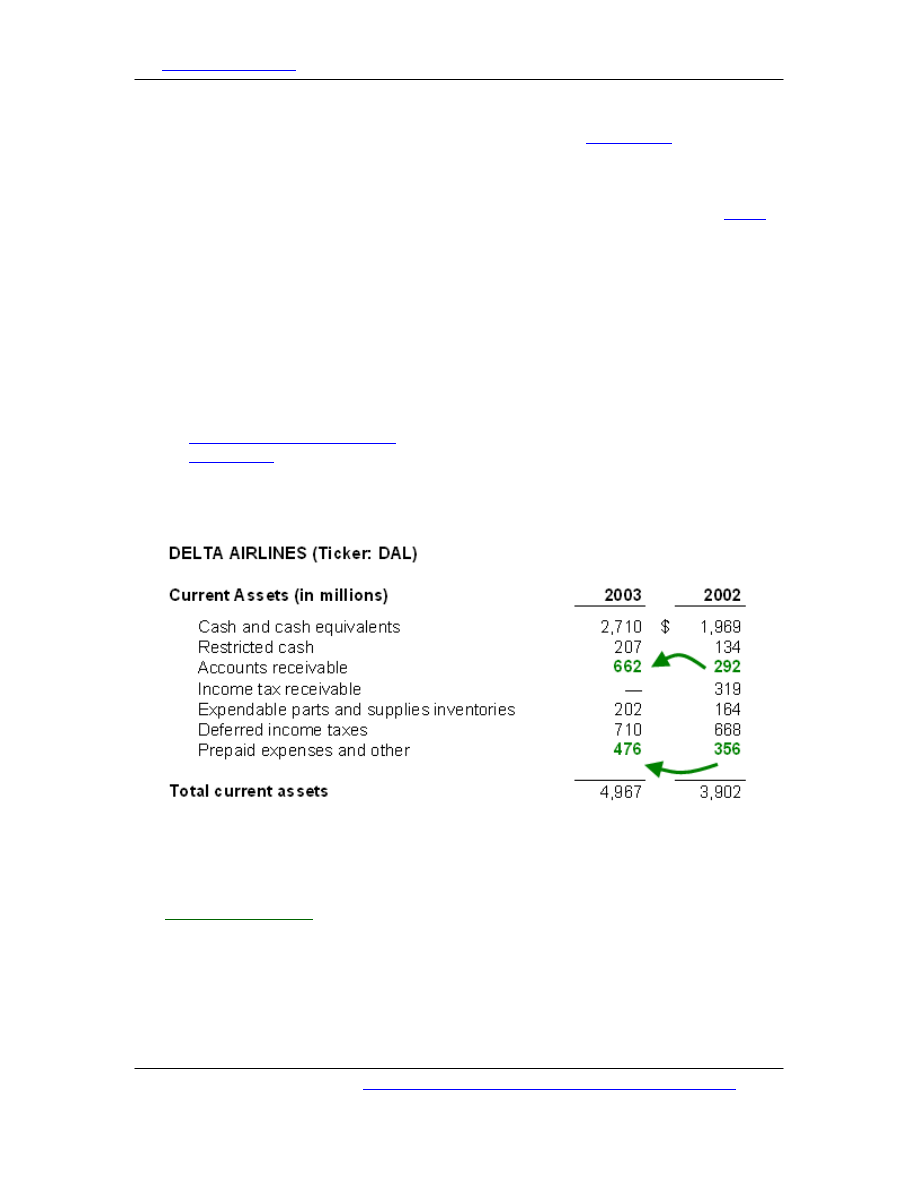
For examples of these two items, consider the current assets section of Delta
Airlines' fiscal year 2003 balance sheet:
Notice that Delta's receivables more than doubled from 2002 to 2003. Is this a
dangerous sign of collections problems? Let's take a look at the footnote:
We were party to an agreement, as amended, under which we sold a defined pool of
, on a revolving basis, through a special-purpose, wholly
owned subsidiary, which then sold an undivided interest in the receivables to a third
party.... This agreement terminated on its scheduled expiration date of March 31,
2003. As a result, on April 2, 2003, we paid $250 million, which represented the total
amount owed to the third party by the subsidiary, and subsequently collected the
related receivables. (Note 8, Delta 10K FY 2003)
This tutorial can be found at:
http://www.investopedia.com/university/financialstatements/
(Page 33 of 66)
Copyright © 2004, Investopedia.com - All rights reserved.

Investopedia.com
– the resource for investing and personal finance education.
Here's the translation: during 2002, most of Delta's receivables were factored in an
off-balance sheet transaction. By factored, we mean Delta sold some of its accounts
receivables to another company (via a subsidiary) in exchange for cash. In brief,
Delta gets paid quickly rather than having to wait for customers to pay. However,
the seller (Delta in this case) typically retains some or all of the credit risk--the risk
that customers will not pay. For example, they may collateralize the receivables.
We see that during 2003, the factored receivables were put back onto the balance
sheet. In economic terms, they never really left but sort of disappeared in 2002. So,
the 2003 number is generally okay, but there was not a dramatic jump. More
importantly, if we were to analyze year 2002, we'd have to be sure to manually
"add-back" the off-balance sheet receivables, which would otherwise look artificially
favorable for that year.
We also highlighted Delta's increase in "Prepaid expenses and other" because this
innocent-looking account contains the
of Delta's fuel
derivatives.
Here's what the footnote says:
Prepaid expenses and other current assets increased by 34%, or $120 million,
primarily due to an increase in prepaid aircraft fuel as well as an increase in the fair
value of our fuel hedge derivative contracts.... Approximately 65%, 56% and 58% of
our aircraft fuel requirements were hedged during 2003, 2002 and 2001,
respectively. In February 2004, we settled all of our fuel hedge contracts prior to
their scheduled settlement dates… and none of our projected aircraft fuel
requirements for 2005 or thereafter.
The rules concerning derivatives are complex, but the idea is this: it is entirely likely
that working capital accounts contain embedded derivative instruments. In fact, the
basic rule is that, if a derivative is a hedge whose purpose is to mitigate
opposed to a hedge whose purpose is to speculate), then the value of the hedge will
impact the
of the hedged asset. For example, if fuel oil is an inventory
item for Delta, then derivatives contracts meant to lock-in future fuel oil costs will
directly impact the inventory balance. Most derivatives, in fact, are not used to
speculate but rather to mitigate risks that the company cannot control.
Delta's footnote above has good news and bad news. The good news is that, as fuel
prices rose, the company made some money on its fuel hedges, which in turn offset
the increase in fuel prices--the whole point of their design! But this is overshadowed
by news which is entirely bad: Delta settled "all of [their] fuel hedge contracts" and
has no hedges in place for 2005 and thereafter! Delta is thus exposed in the case of
high fuel prices, which is a serious risk factor for the stock.
Summary
Traditional analysis of working capital is defensive; it asks, "Can the company meet
its short-term cash obligations?" But working capital accounts also tell you about the
operational efficiency of the company. The length of the cash conversion cycle
(DSO+DIO-DPO) tells you how much working capital is tied up in ongoing
operations. And trends in each of the days-outstanding numbers may foretell
improvements or declines in the health of the business.
This tutorial can be found at:
http://www.investopedia.com/university/financialstatements/
(Page 34 of 66)
Copyright © 2004, Investopedia.com - All rights reserved.

Investopedia.com
– the resource for investing and personal finance education.
Investors should check the inventory costing method, and LIFO is generally preferred
to FIFO. However, if the LIFO reserve drops precipitously year over year, then the
implied inventory liquidation distorts COGS and probably renders the reported profit
margin unusable.
Finally, it's wise to check the current accounts for derivatives (or the lack of them,
when key risks exist) and off-balance sheet financing.
Long-Lived Assets
In the preceding section, we examined
and
of a company. In this section, we take a closer look at the long-
lived assets (a.k.a. non-current assets) carried on the
. Long-lived
assets are those that provide the company with a future economic benefit beyond
the current year or operating period. It may be helpful to remember that most (but
not all) long-lived assets start as some sort of purchase by the company.
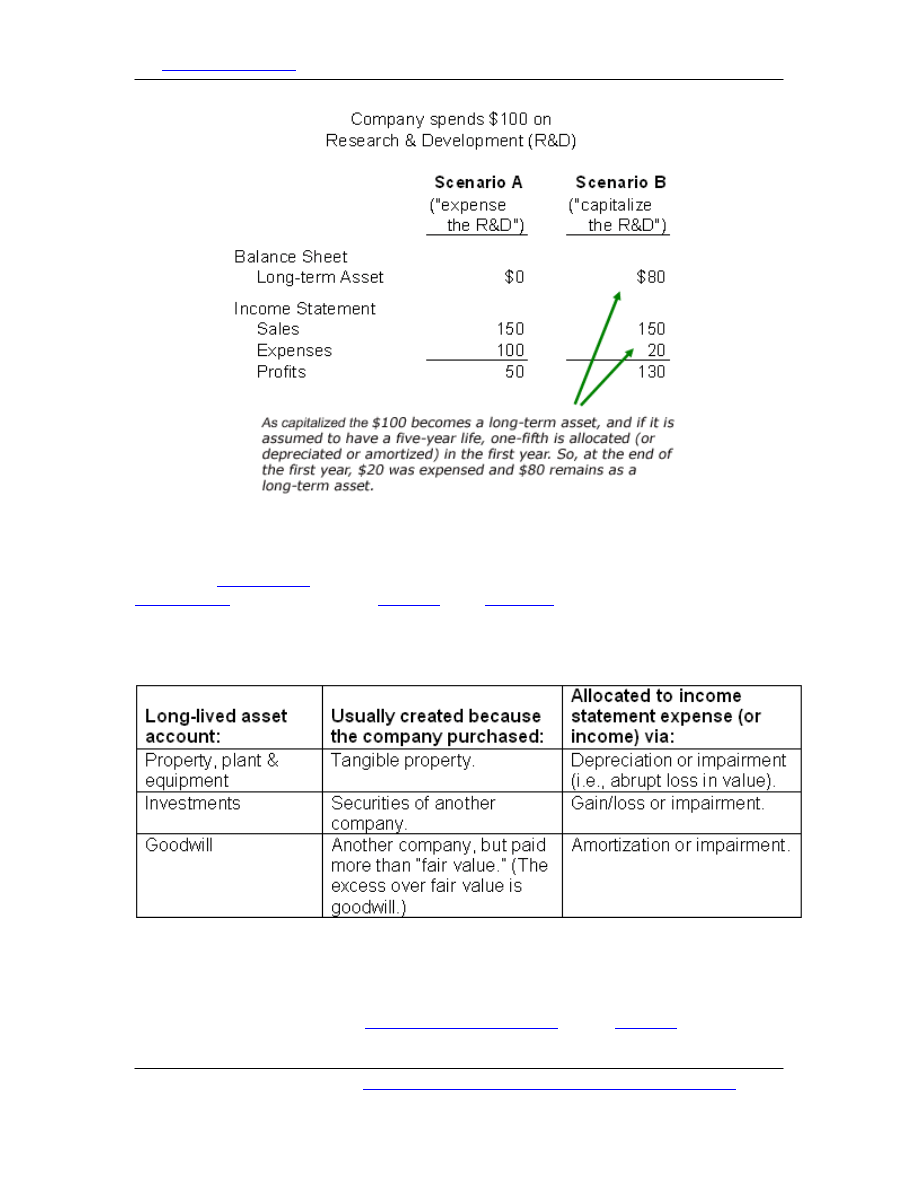
In fact, whenever a company purchases an asset, it will either
the purchase. Consider a simple example of a company that generates $150 in sales
and, in the same year, spends $100 on
(R&D). In
scenario A below, the entire $100 is expensed and, as a result, the profit is simply
$50 ($100 – $50). In scenario B, the company capitalizes the $100, which means a
long-lived asset is created on the balance sheet and the cost is allocated (charged)
as an expense over future periods. If we assume the asset has a five-year life, only
one-fifth of the investment is allocated in the first year. The other $80 remains on
the balance sheet, to be allocated as an expense over the subsequent four years.
Therefore, the
are higher under scenario B, although the
in the two
scenarios are exactly the same:
This tutorial can be found at:
http://www.investopedia.com/university/financialstatements/
(Page 35 of 66)
Copyright © 2004, Investopedia.com - All rights reserved.
Investopedia.com
– the resource for investing and personal finance education.
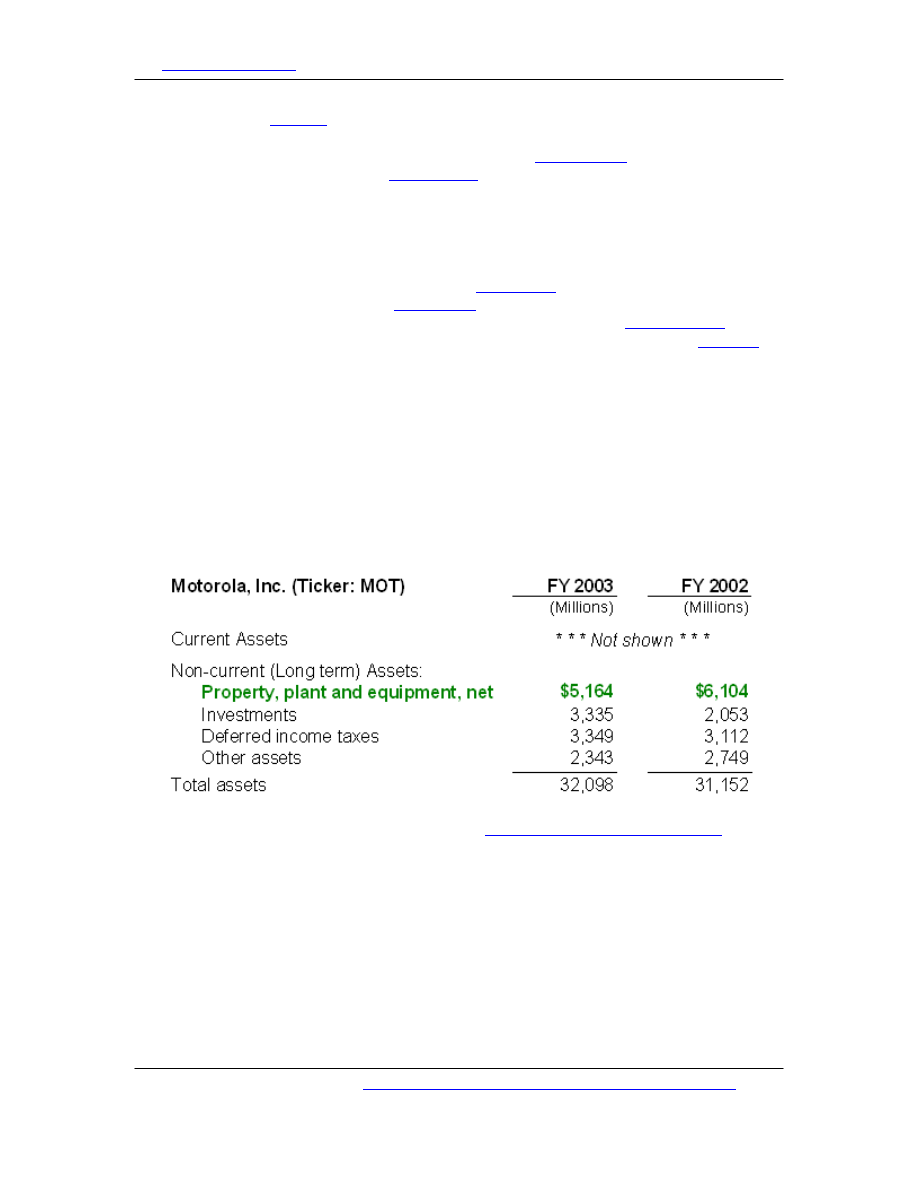
There are various technical terms for the allocation of capitalized assets, but each
refers to the pattern in which the assets' prices are allocated to future period
expenses:
is the allocation of plant, property, and equipment;
is the allocation of
is the allocation of natural
resource assets, such as oil wells.
The typical long-lived area of the balance sheet includes the following accounts:
Depreciation
Depreciation is tricky because it is the allocation of a prior capital expenditure to an
annual expense. Reported profits are directly impacted by the depreciation method.
And because depreciation is a
, some
This tutorial can be found at:
http://www.investopedia.com/university/financialstatements/
(Page 36 of 66)
Copyright © 2004, Investopedia.com - All rights reserved.
Investopedia.com
– the resource for investing and personal finance education.
flow measures or
, which is a measure of earnings before the subtraction of
depreciation. However, depreciation typically cannot be ignored because it serves a
valuable purpose: it sets aside an annual amount (a
, if you will) for the
maintenance and replacement of
Because depreciation is an accounting convention, you sometimes see an alternative
label: "economic depreciation." This is an adjusted depreciation that represents the
"true" amount that a company needs to allocate annually in order to maintain and
replace its fixed asset base. In theory, economic depreciation corrects for errors in
both directions. Consider the depreciation of
, which is usually an over-
charge, reducing the real estate's
--calculated by the original investment
minus accumulated depreciation--to something far below its fair
. On
the other hand, consider a key piece of equipment that is subject to rapid
Its eventual replacement will cost more than the original, in which case depreciation
actually under-charges the expense. If depreciation expense is large relative to other
expenses, it often helps to ask whether the charge approximates the replacement
value of the assets. Determining this can be difficult, but sometimes the footnotes in
a company's financial documents give explicit clues about future expenditures.
It is also helpful to look at the underlying trend in the fixed asset base. This will tell
you whether the company is increasing or decreasing its investment in its fixed asset
base. An interesting side effect of decreasing investments in the fixed asset is that it
can temporarily boost reported profits. Consider the non-current portion of
Motorola's balance sheet:
You can see that the book value of Motorola's
plant, property, and equipment
(PP&E)
fell roughly a billion dollars to $5.164 billion in 2003. We can understand this better
by examining two footnotes, which are collected below:
This tutorial can be found at:
http://www.investopedia.com/university/financialstatements/
(Page 37 of 66)
Copyright © 2004, Investopedia.com - All rights reserved.
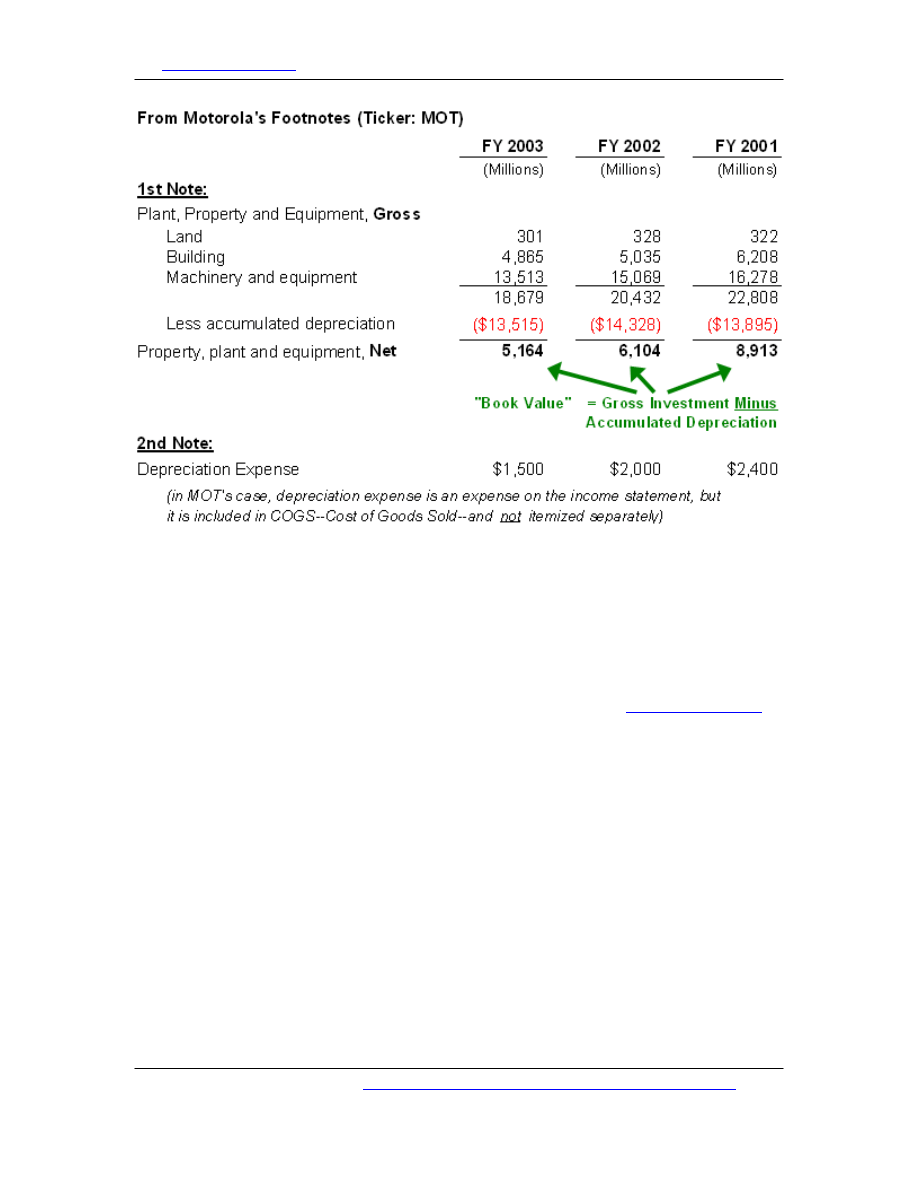
Investopedia.com
– the resource for investing and personal finance education.
The book value is the gross investment (that is, the original or historical purchase
price) minus the accumulated depreciation expense. Book value is also called net
value, meaning 'net of depreciation'. In Motorola's case, the gross asset value is
dropping (which indicates asset dispositions) and so is the book value. Motorola has
disposed of assets without a commensurate investment in new assets. Put another
way, Motorola's asset base is aging.
Notice the effect on depreciation expense: it drops significantly, from $2 billion to
$1.5 billion in 2003. In Motorola's case, depreciation is buried in
(COGS), but the temporary impact is a direct boost in pre-tax profits of half a billion
dollars. To summarize, an aging asset base--the result of the company disposing of
some old assets but not buying new ones--can temporarily boost profits. When
assets are aged to inflate reported profits, it is sometimes called "harvesting the
assets."
We can directly estimate the age of the fixed asset base with two measures: average
age in percentage terms and average age in years. Average age in percentage
equals accumulated depreciation divided by the gross investment. It represents the
proportion of the assets that have been depreciated: the closer to 100%, the older
the asset base. Average age in years equals accumulated depreciation divided by the
annual depreciation expense. It is a rough estimate of the age of the in-place asset
base. Below, we calculated each for Motorola. As you can see, these measures show
that the asset base is aging.
This tutorial can be found at:
http://www.investopedia.com/university/financialstatements/
(Page 38 of 66)
Copyright © 2004, Investopedia.com - All rights reserved.
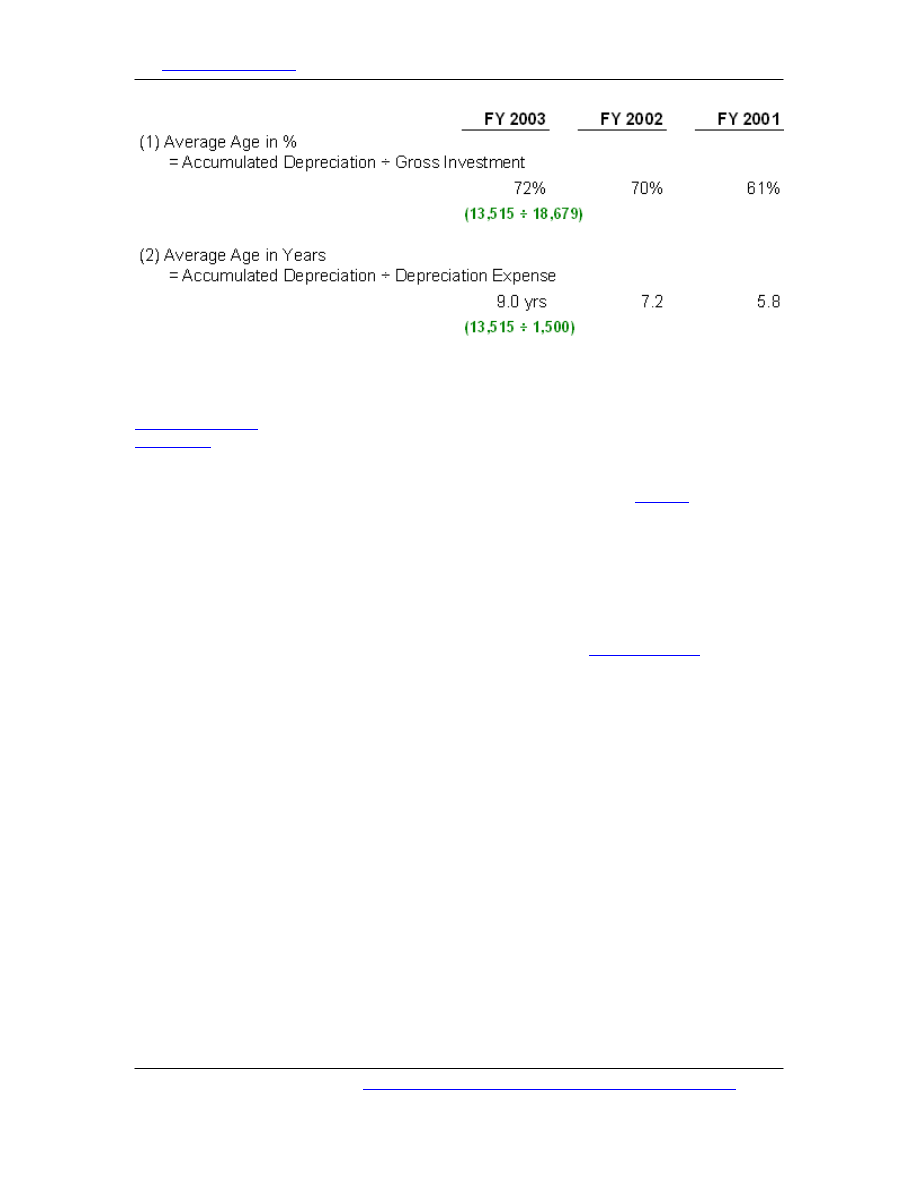
Investopedia.com
– the resource for investing and personal finance education.
Investments
There are various methods to account for corporate investments, and often
management has some discretion in selecting a method. When one company (a
) controls more than 50% of the shares of another company (a
), the subsidiary's accounts are consolidated into the parent's. When the
control is less than 50%, there are three basic methods for carrying the value of an
investment: these are the cost, market, and equity methods. We show each method
below. But first, keep in mind there are three sorts of investment
1.
The investment can appreciate (or depreciate) in market value: we call these
holding gains or losses.
2.
The investment can generate earnings that are not currently distributed to
the parent (they are instead retained): we call this investment income.
3.
The investment can distribute some of its income as
to the
parent.
The table below explains the three methods of accounting for corporate investments
that are less than 50% owned by the parent:
This tutorial can be found at:
http://www.investopedia.com/university/financialstatements/
(Page 39 of 66)
Copyright © 2004, Investopedia.com - All rights reserved.

Investopedia.com
– the resource for investing and personal finance education.
When an investment pays cash dividends, the rules are straightforward: they will be
recognized on the parent company's
. But the rules are not
straightforward for (i) undistributed earnings and (ii) gains/losses in the investment's
holding value. In both cases, the parent may or may not recognize the
earnings/gains/losses.
We have at least three goals when examining the investment accounts. First, we
want to see if the accounting treatment has hidden some underlying economic gain
or loss. For example, if a company uses the cost method on a superior investment
that doesn't pay dividends, the investment gains will eventually pay off in a future
period. Our second goal is to ask whether investment gains/losses are recurring.
Because they are usually not operating assets of the business, we may want to
consider them separately from a
of the business. The third goal is to gain
valuable clues about the company's business strategy by looking at its investments.
More often than not, such investments are not solely motivated by financial returns.
They are often strategic investments made in current/future business partners.
Interesting examples include investments essentially made to
and development or to tap into different markets.
Let's consider a specific example with the recent long-lived accounts for Texas
Instruments:
This tutorial can be found at:
http://www.investopedia.com/university/financialstatements/
(Page 40 of 66)
Copyright © 2004, Investopedia.com - All rights reserved.
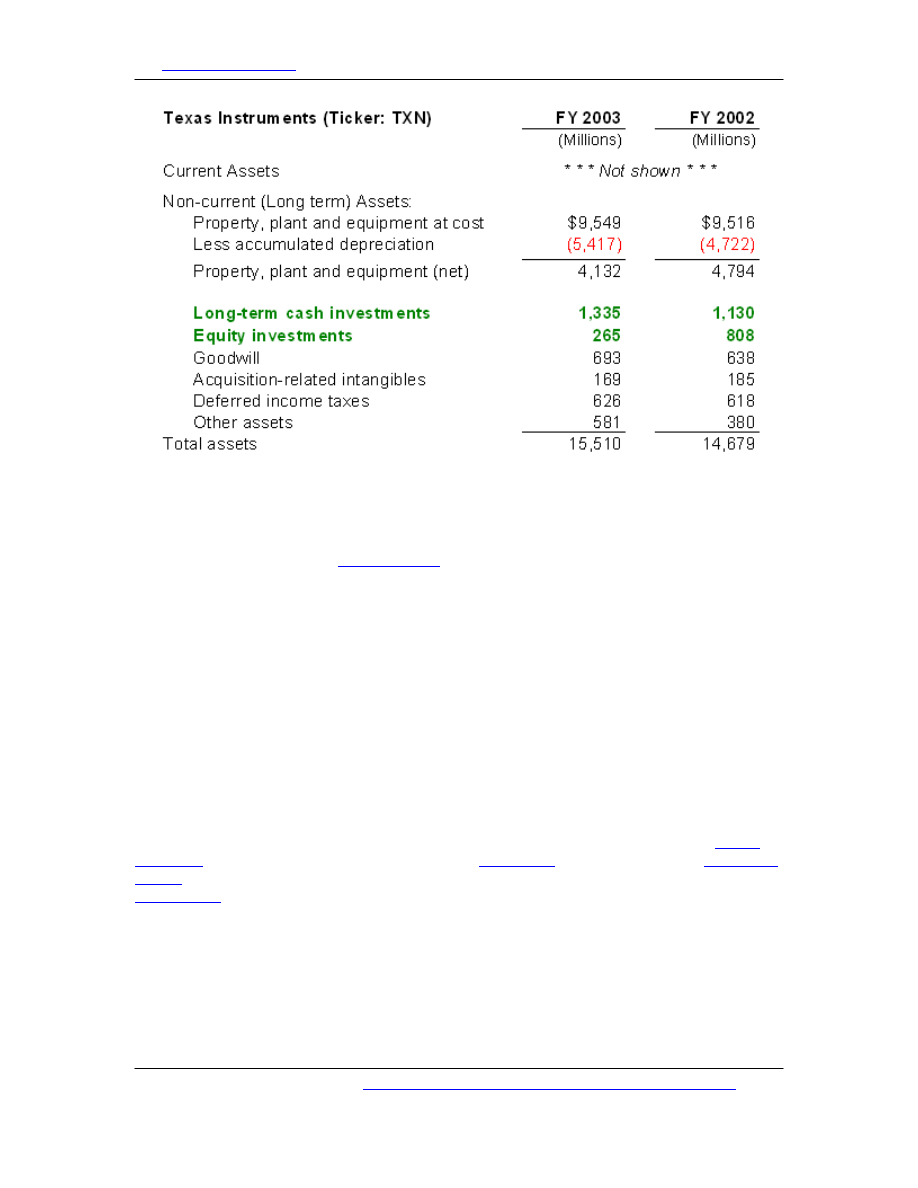
Investopedia.com
– the resource for investing and personal finance education.
What immediately stands out is that equity investments dropped from $800 million
to $265 million in 2003. This should encourage us to examine the footnotes to
understand why.
The footnotes in the same
include the following:
During the third and fourth quarters of 2003, TI sold its remaining 57 million shares
of Micron common stock, which were received in connection with TI's sale of its
memory business unit to Micron in 1998. TI recognized pretax gains of $203 million
from these sales, which were recorded in other income (expense) net….The
combined effect of the after-tax gains and the tax benefit was an increase of $355
million to TI's 2003 net income.
We learn two things from this footnote: 1) TI sold its significant stake in Micron, and
2) that sale created a one-time (nonrecurring) boost in current profits of $355
million.
Goodwill
Goodwill is created when one company (the "buyer") purchases another company
(the "target"). At the time of purchase, all of the assets and liabilities of the
are re-appraised to their estimated
that were not formerly carried on the target's balance sheet, such as
, licenses, in-process research & development, and maybe even key
relationships. Basically, accountants try to estimate the value of the entire target
company, including both tangible and intangible assets. If the buyer happens to pay
more than this amount, every extra dollar falls into goodwill. Goodwill is a catch-all
account, because there is nowhere else to put it. From the accountant's perspective,
it is the amount the buyer "overpays" for the target.
This tutorial can be found at:
http://www.investopedia.com/university/financialstatements/
(Page 41 of 66)
Copyright © 2004, Investopedia.com - All rights reserved.
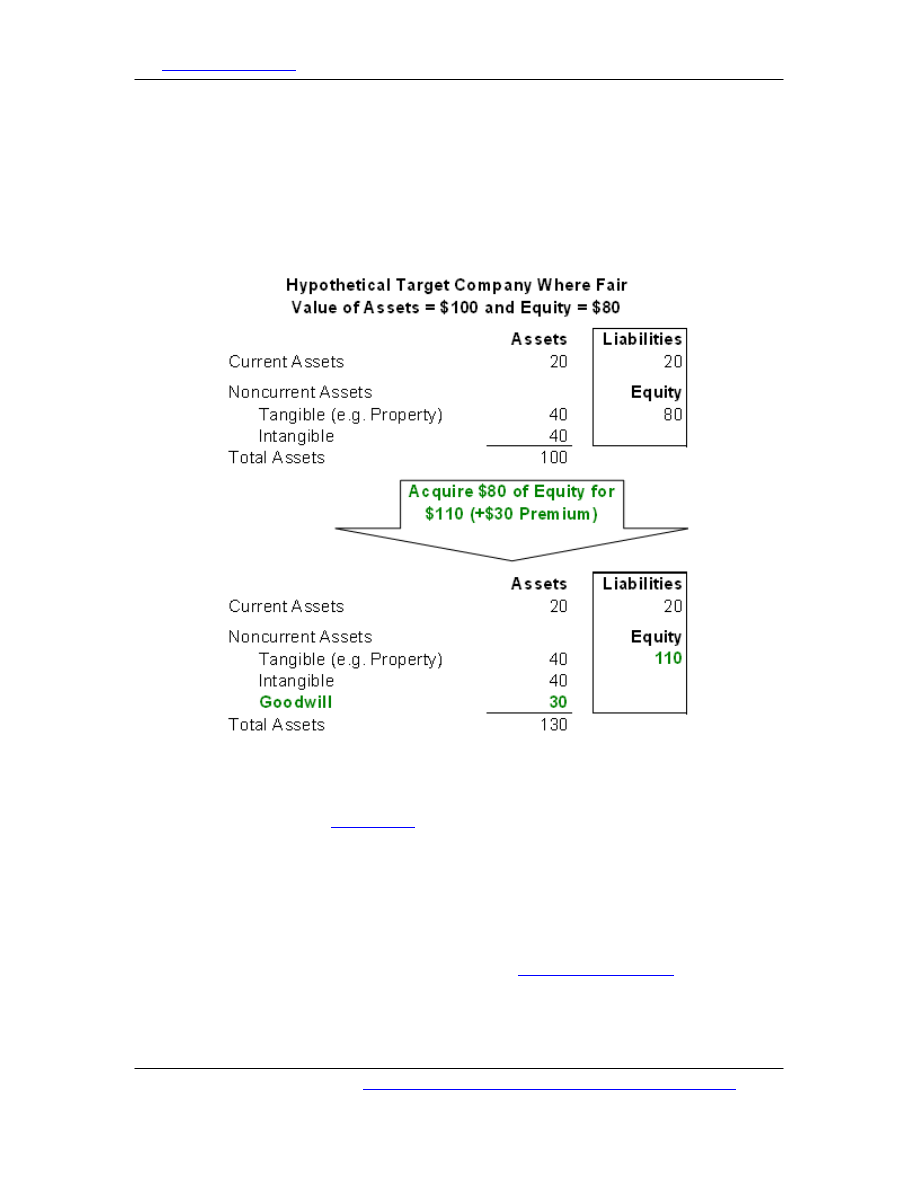
Investopedia.com
– the resource for investing and personal finance education.
To illustrate, we show a target company below that carries $100 of assets when it is
purchased. The assets are marked-to-market (that is, appraised to their fair market
value) and they include $40 in intangibles. Further, the target has $20 in liabilities,
so the equity is worth $80 ($100 – $20). But the buyer pays $110, which results in a
purchase premium of $30. Since we do not know where to assign this excess, a
goodwill account of $30 is created. The bottom exhibit shows the target company's
accounts, but they will be consolidated into the buyer's accounts so that the buyer
carries the goodwill.
At one time, goodwill was amortized like depreciation. But as of 2002, goodwill
amortization is no longer permitted. Now, companies must perform an annual test of
their goodwill. If the test reveals that the acquisition's value has decreased, then the
company must impair, or
, the value of the goodwill. This will create an
expense (which is often buried in a one-time restructuring cost) and an equivalent
decrease in the goodwill account.
The idea behind this change was the assumption that goodwill--being an unidentified
(unassigned) intangible--does not necessarily depreciate automatically like plants or
machinery. This is arguably an improvement in accounting methods, because we can
watch for goodwill impairments, which are sometimes significant red flags. Because
the value of the acquisition is typically based on a
company is basically telling you "we took another look at the projections for the
acquired business, and they are not as good as we thought last year."
This tutorial can be found at:
http://www.investopedia.com/university/financialstatements/
(Page 42 of 66)
Copyright © 2004, Investopedia.com - All rights reserved.
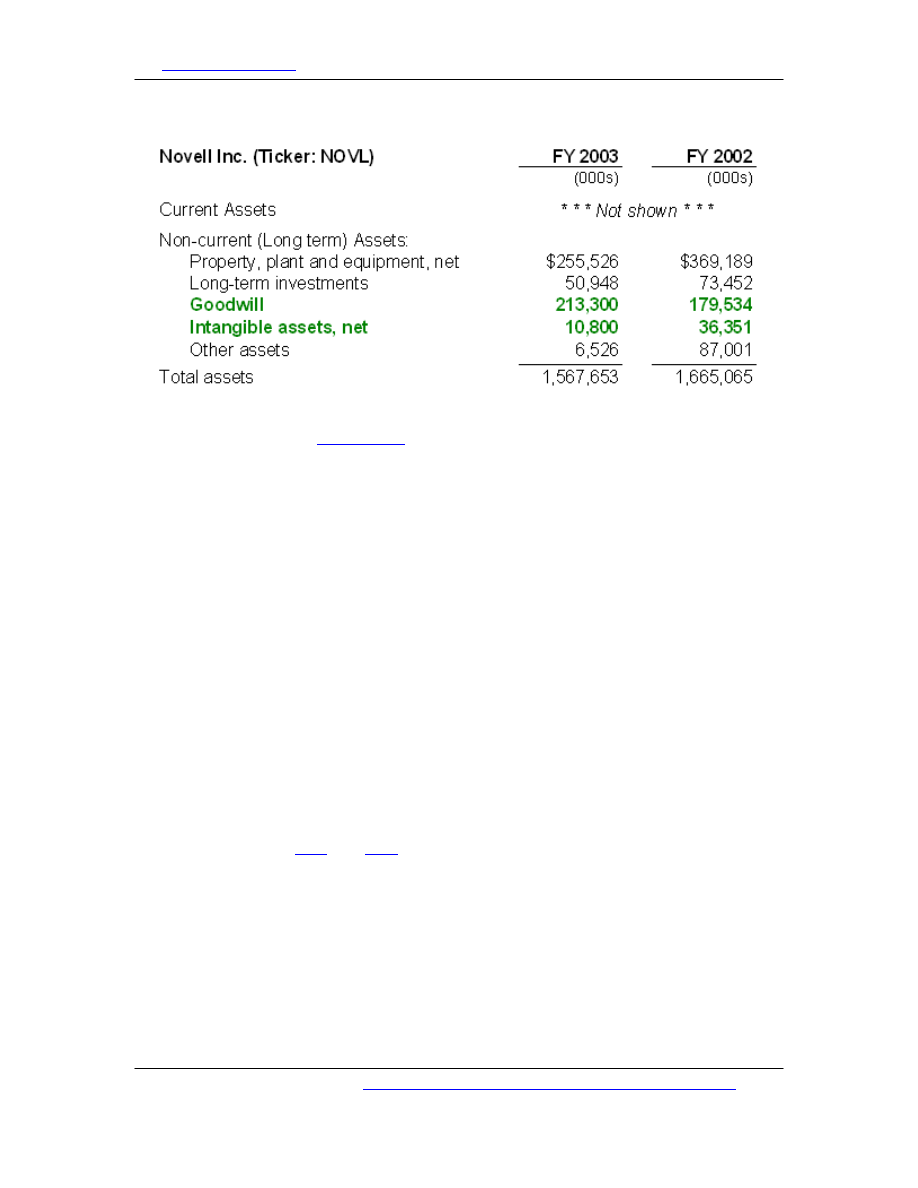
Investopedia.com
– the resource for investing and personal finance education.
Consider Novell's latest balance sheet:
We see that intangible assets decreased from $36.351 million to $10.8 million.
impact the accounts, it is not enough to check
increases or decreases. For example, Novell's goodwill increased, but that could be
due to a purchase. Similarly, it is possible that the decrease in intangible assets
could be the result of a disposition, but this is unlikely as it is difficult to sell an
intangible by itself.
A careful look at the footnote explains that most of this intangible asset decline was
due to impairment. That is, a previously acquired technology has not generated the
revenues that were originally expected:
During the third quarter of fiscal 2003, we determined that impairment indicators
existed related to the developed technology and trade names we acquired from
SilverStream as a result of unexpected revenue declines and the evident failure to
achieve revenue growth targets for the exteNd products. Based on an independent
valuation of these assets, we recorded a $23.6 million charge to cost of revenue to
write down these assets to estimated fair value, which was determined by the net
present value of future estimated revenue streams attributed to these assets.
Summary
You have to be careful when you examine the long-lived assets. It is hard to make
isolated judgments about the quality of investments solely by looking at measures
such as R&D as a percentage or capital expenditures as a percentage of sales. Even
useful ratios such as
are highly dependent on the particular accounting
methods employed. For example, both of these ratios count assets at book value, so
they depend on the depreciation method.
You can, however, look for trends and clues such as the following:
• The method of depreciation and the pattern of investment - Is the company
maintaining investment(s)? If investments are declining and assets are aging,
are profits distorted?
This tutorial can be found at:
http://www.investopedia.com/university/financialstatements/
(Page 43 of 66)
Copyright © 2004, Investopedia.com - All rights reserved.
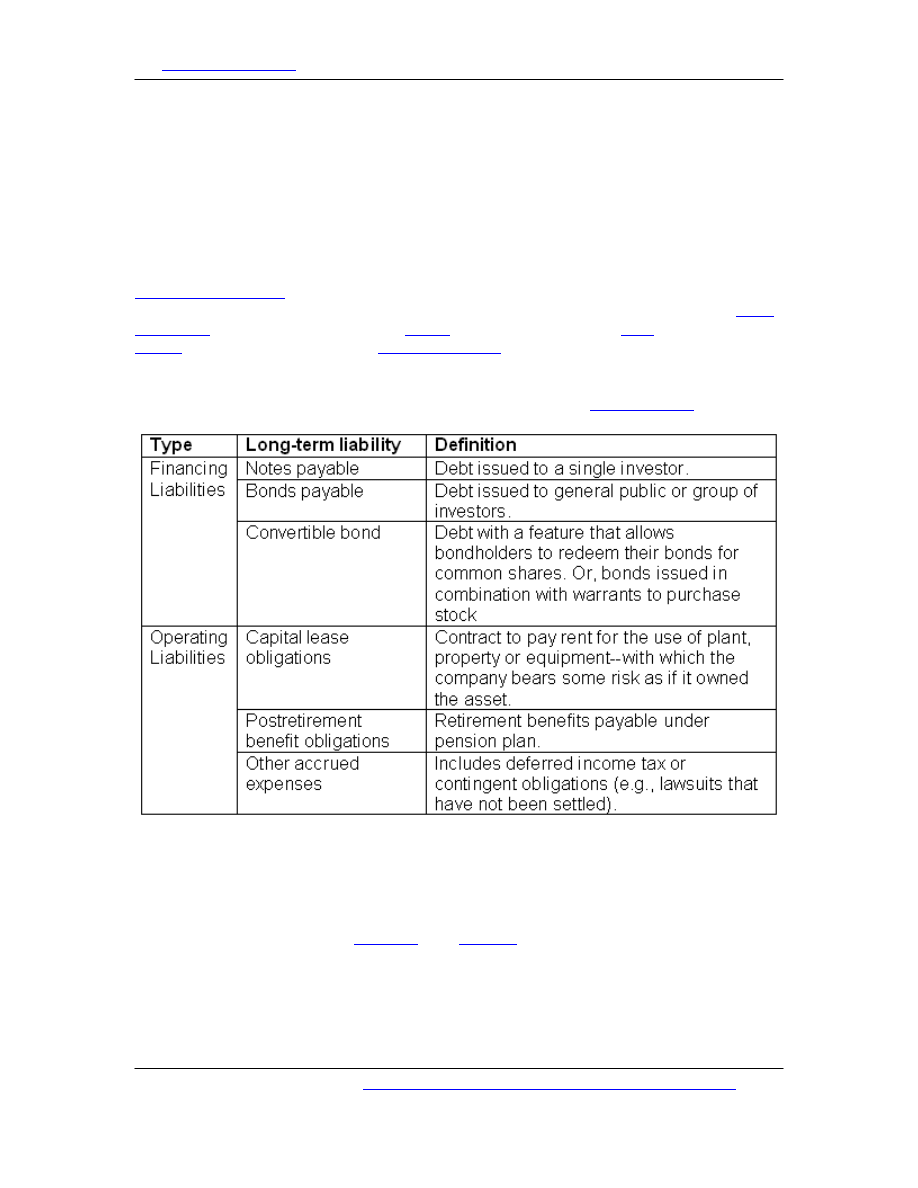
Investopedia.com
– the resource for investing and personal finance education.
• The specific nature and performance of investments - Have investment sales
created one-time gains?
• Goodwill impairments - Has goodwill been impaired, and what is the business
implication going forward?
Long-Term Liabilities
are company obligations that extend beyond the current year, or
alternately, beyond the current operating cycle. Most commonly, these include
such as company-issued
. Here we look at how
compares to
as a part of a company's
, and how to examine the way in
which a company uses debt.
The following long-term liabilities are typically found on the
You can see that we describe long-term liabilities as either operating or financing.
Operating liabilities are obligations created in the course of ordinary business
operations, but they are not created by the company raising cash from investors.
Financing liabilities are debt instruments that are the result of the company raising
cash. In other words, the company--often in a prior period--issued debt in exchange
for cash and must repay the
Operating and financing liabilities are similar in that they both will require future
cash outlays by the company. It is useful to keep them separate in your mind,
however, because financing liabilities are triggered by a company's deliberate
This tutorial can be found at:
http://www.investopedia.com/university/financialstatements/
(Page 44 of 66)
Copyright © 2004, Investopedia.com - All rights reserved.
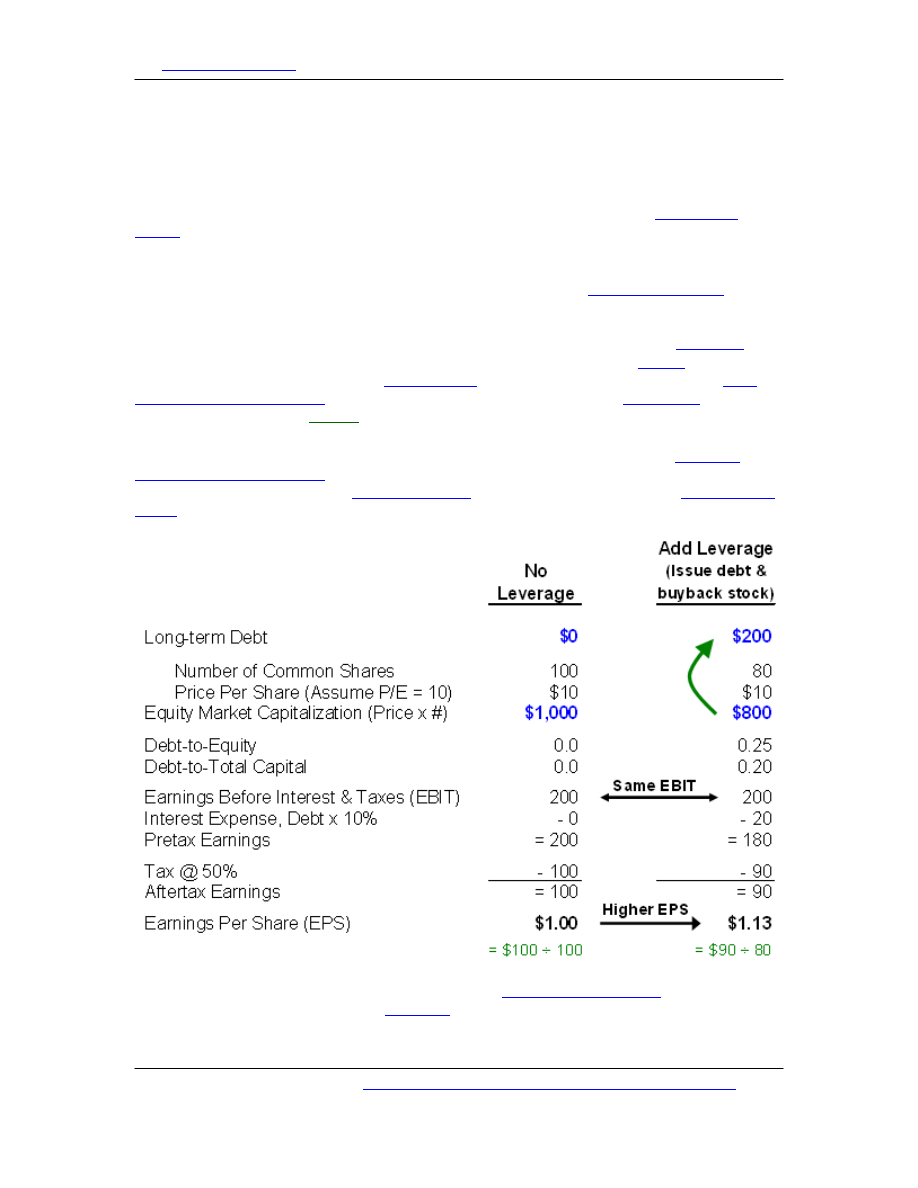
Investopedia.com
– the resource for investing and personal finance education.
funding decisions, and therefore will often offer clues about a company's future
prospects.
Debt is Cheaper than Equity--to a Point
Capital structure refers to the relative proportions of a company's different funding
sources, which include debt, equity, and hybrid instruments such as
(discussed below). A simple measure of capital structure is the ratio of long-
term debt to total capital.
Because the cost of equity is not explicitly displayed on the
whereas the cost of debt (interest expense) is itemized--it is easy to forget that debt
is a cheaper source of funding for the company than equity. Debt is cheaper for two
reasons. First, because debtors have a prior claim if the company goes
,
debt is safer than equity and therefore warrants investors a lower
; for the
company, this translates into an
that is lower than the expected
on equity. Second, interest paid is tax
to the
company; and a lower
effectively creates cash.
To illustrate this idea, let's consider a company that generates $200 of
(EBIT). If the company carries no debt, owes tax at a rate
of 50%, and has issued 100
, the company will produce
(EPS) of $1.00 (see left-hand column below).
Say on the right-hand side we perform a simple
. In other
words, say we introduce modest
into the capital structure, increasing the
debt-to-total capital ratio from 0 to 0.2. In order to do this, we must have the
This tutorial can be found at:
http://www.investopedia.com/university/financialstatements/
(Page 45 of 66)
Copyright © 2004, Investopedia.com - All rights reserved.
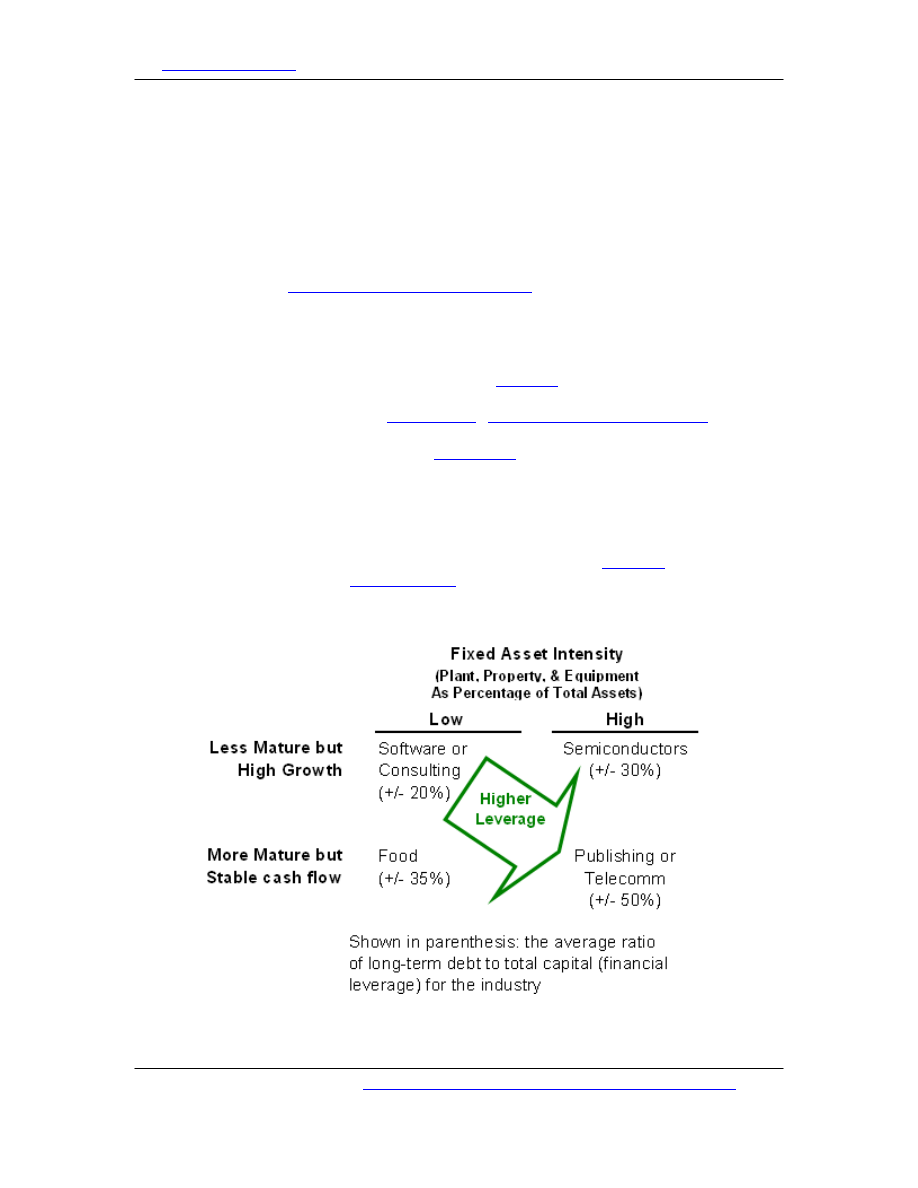
Investopedia.com
– the resource for investing and personal finance education.
company issue (borrow) $200 of debt and use the cash to repurchase 20 shares
($200/$10 per share = 20 shares). What changes for shareholders? The number of
shares drops to 80 and now the company must pay interest annually ($20 per year if
10% is charged on the borrowed $200). Here is the point of the illustration: after-tax
earnings decrease, but so does the number of shares. Our debt-for-equity swap
actually causes EPS to increase!
What Is the Optimal Capital Structure?
The example above shows why some debt is often better than no debt--in technical
terms, it lowers the
weighted average cost of capital
. Of course, at some point,
additional debt becomes too risky. The optimal capital structure--that is, the ideal
ratio of long-term debt to total capital--is hard to estimate. It depends on at least
two factors, but keep in mind that the following are general principles:
• First, optimal capital structure varies by
, mainly because some
industries are more asset-intensive than others. In very general terms, the
), the
greater the average use of debt. This is because banks prefer to make loans
against fixed assets rather than
. Industries that require a great
deal of plant investment, such as telecommunications, generally utilize more
long-term debt.
• Second, capital structure tends to track with the company's growth cycle.
Rapidly growing startups and early stage companies, for instance, often favor
equity over debt because their shareholders will forgo
payments--as
--in favor of future price returns. High-
growth companies do not need to give these shareholders "cash today",
whereas lenders would expect semi-annual or quarterly interest payments.
This tutorial can be found at:
http://www.investopedia.com/university/financialstatements/
(Page 46 of 66)
Copyright © 2004, Investopedia.com - All rights reserved.

Investopedia.com
– the resource for investing and personal finance education.
Examining Long-Term Liability
Below, we look at some important areas investors should focus on when analyzing a
company's long-term liability accounts.
Ask Why the Company Issued New Debt
When a company issues new long-term debt, it's important for investors to
understand the reason. Companies should give explanations of new debt's specific
purpose rather than vague boilerplate such as "it will be used to fund general
business needs." The most common purposes of new debt include the following:
1.
To fund growth: The cash raised by the debt issuance is used for specific
investment(s)--this is normally a good sign.
2.
To refinance "old" debt: Old debt is retired and new debt is issued,
presumably at a lower interest rate--this is also a good sign, but it often
changes the company's
exposure.
3.
To change the capital structure: Cash raised by the debt issuance is used to
repurchase stock, issue a dividend, or buyout a big equity investor--
depending on the specifics, this may be a positive indicator.
4.
To fund operating needs: Debt is issued to pay
is negative. Depending on certain factors, this motive
may be a red flag. Below, we look at how you can determine whether a
company is issuing new debt to fund operating needs.
Be Careful of Debt that Funds Operating Needs
Unless the company is in the early growth stage, new debt that funds investment is
preferable to debt that funds operating needs. To understand this thoroughly, recall
installment that changes in operating accounts (that is,
and
) either provide or consume cash. Increases in current
assets--except for cash--are "uses of cash" and increases in current liabilities are
"sources of cash." Consider an abridged version of RealNetworks'
the year ending December 31, 2003:
This tutorial can be found at:
http://www.investopedia.com/university/financialstatements/
(Page 47 of 66)
Copyright © 2004, Investopedia.com - All rights reserved.
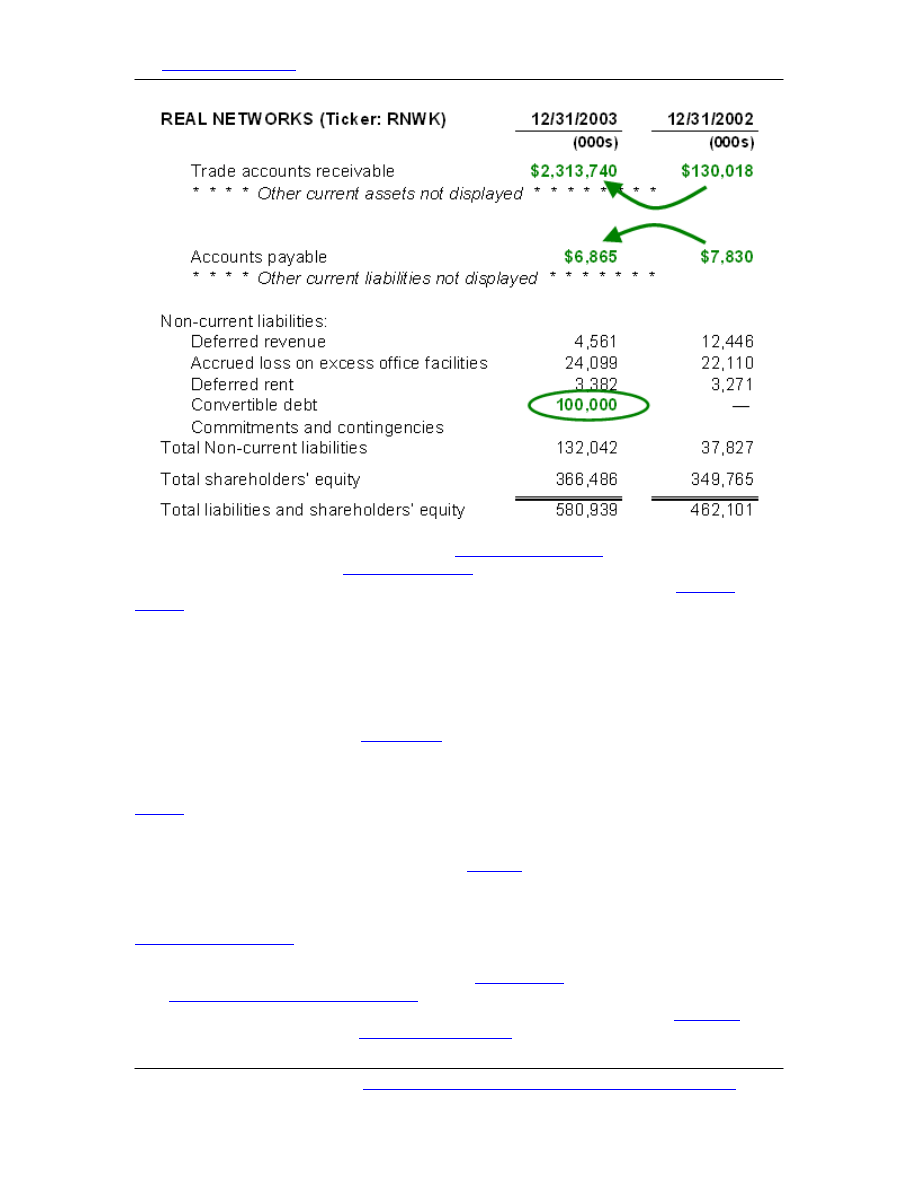
Investopedia.com
– the resource for investing and personal finance education.
From December 2002 to December 2003,
(a current asset)
(a current liability) decreased. Both
occurrences are uses of cash. In other words, RealNetworks consumed
in 2003. At the same time, the company issued a $100 million convertible
bond. The company's consumption of operating cash and its issue of new debt to
fund that need is not a good sign. Using debt to fund operating cash may be okay in
the short run but, since this is an action undertaken as a result of negative operating
cash flow, it cannot be sustained forever.
Examine Convertible Debt
You should take a look at the
features attached to convertible bonds
(a.k.a. "convertibles"), which the company will detail in a footnote to its financial
statements. Companies issue convertibles in order to pay a lower interest rate;
investors purchase convertibles because they receive an option to participate in
stock gains.
Usually, convertibles are perfectly sensible instruments, but the conversion feature
(or attached warrants) introduces potential
for shareholders. If convertibles
are a large part of the debt, be sure to estimate the number of common shares that
could be issued on conversion. Be alert for convertibles that have the potential to
trigger the issuance of a massive number of common shares (as a percentage of the
), and thereby could excessively dilute existing shareholders.
An extreme example of this is the so-called "
PIPE," a dangerous flavor of
the '
private investment, public equity
' (PIPE) instrument. Companies in distress issue
PIPES, which are usually convertible bonds with a generous number of
attached (for more info, see "
"). If company performance
This tutorial can be found at:
http://www.investopedia.com/university/financialstatements/
(Page 48 of 66)
Copyright © 2004, Investopedia.com - All rights reserved.

Investopedia.com
– the resource for investing and personal finance education.
deteriorates, the warrants are exercised and the PIPE holders end up with so many
new shares that they effectively own the company. And existing shareholders get hit
with a double-whammy of bad performance and dilution. A PIPE has preferred claims
over common shareholders, and it's advisable not to invest in the common stock of a
company with PIPE holders unless you have carefully examined the company and the
PIPE.
Look at the Covenants
are provisions banks attach to long-term debt that trigger technical
when violated by the borrowing company. Such a default will lower the
, increase the interest (cost of borrowing), and often send the stock lower.
Bond covenants include but are not limited to the following:
• Limits on further issuance of new debt.
• Limits, restrictions, or conditions on new capital investments or acquisitions.
• Limits on payment of dividends. For example, it is common for a bond
covenant to require that no dividends are paid.
• Maintenance of certain ratios. For example, the most common bond covenant
is probably a requirement that the company maintain a minimum 'fixed
charge coverage ratio'. This ratio is some measure of operating (or free) cash
flow divided by the recurring interest charges
Assess Interest Rate Exposure
Two things complicate the attempt to estimate a company's interest rate exposure.
One, companies are increasingly using
instruments, which are difficult to
analyze.
Second, many companies are operationally sensitive to
. In other
words, their operating profits may be indirectly sensitive to interest rate changes.
Obvious sectors here include housing and banks. But consider an oil/energy company
that carries a lot of variable-rate debt. Financially, this kind of company is exposed
to higher interest rates. But at the same time, the company may tend to outperform
in higher-rate environments by benefiting from the
that tends to accompany higher rates. In this case, the variable-rate exposure is
effectively hedged by the operational exposure. Unless interest rate exposure is
deliberately sought, such natural hedges are beneficial because they reduce
.
Despite these complications, it helps to know how to get a rough idea of a company's
interest rate exposure. Consider a footnote from the 2003
of Mandalay
Resort Group, a casino operator in Las Vegas, Nevada:
This tutorial can be found at:
http://www.investopedia.com/university/financialstatements/
(Page 49 of 66)
Copyright © 2004, Investopedia.com - All rights reserved.
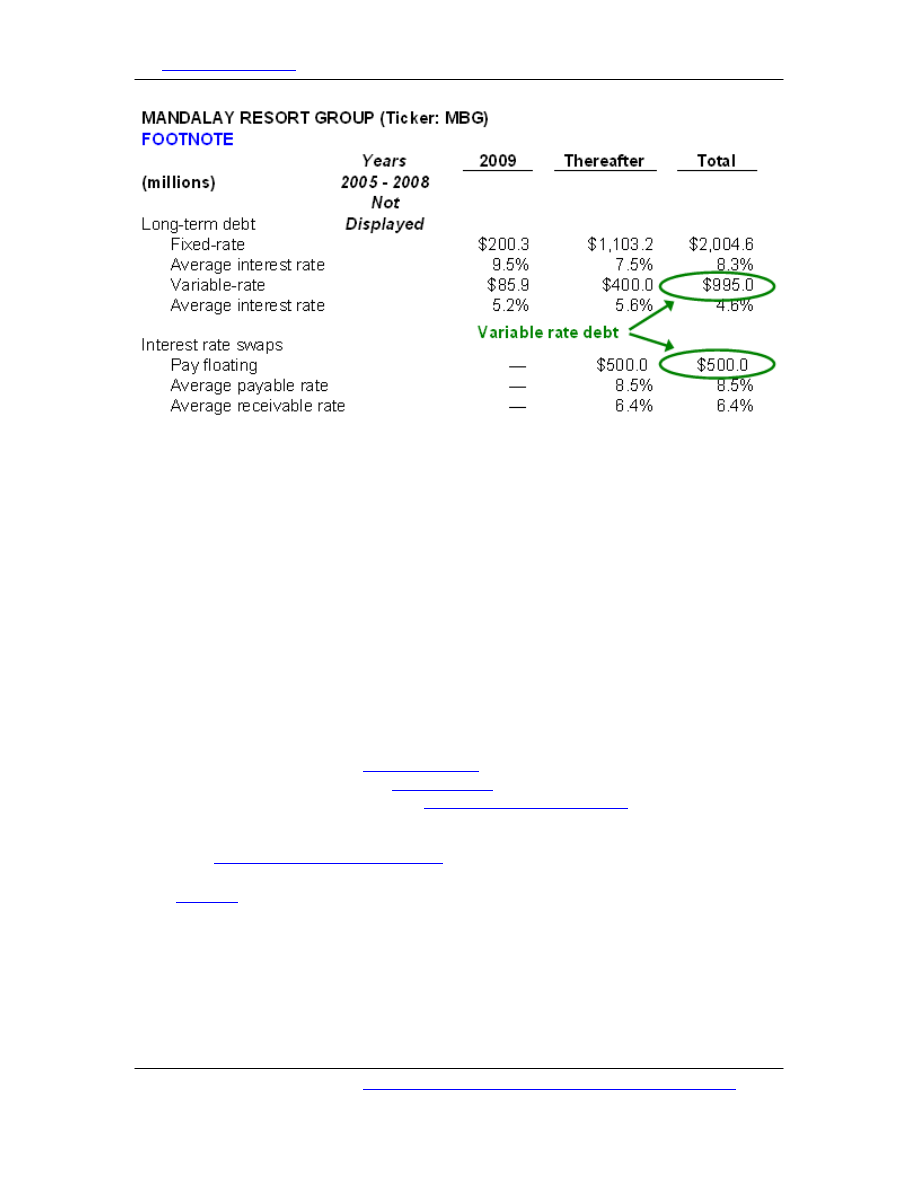
Investopedia.com
– the resource for investing and personal finance education.
Fixed-rate debt is typically presented separately from variable-rate debt. In the prior
year (2002), less than 20% of the company's long-term debt was held in variable-
rate bonds. In the current year, Mandalay carried almost $1.5 billion of variable-rate
debt ($995 million of variable-rate long-term debt and $500 million of a "pay
floating" interest rate swap) out of $3.5 billion in total (leaving $2 billion in fixed-rate
debt).
Don't be confused by the interest rate swap: it simply means that the company has a
fixed-rate bond and "swaps" it for a variable-rate bond with a third party by means
of an agreement. The term 'pay floating' means the company ends up paying a
variable rate; a 'pay fixed interest rate' swap is one in which the company trades a
variable-rate bond for a fixed-rate bond.
Therefore, in 2003, the proportion of Mandalay's debt that was exposed to interest
rate hikes increased from 18% to more than 40%.
Operating Versus Capital Lease
It is important to be aware of
agreements because economically they
are long-term liabilities. Whereas
create liabilities on the balance
sheet, operating leases are a type of "
." Many companies
tweak their lease terms precisely to make these terms meet the definition of an
operating lease so that leases can be kept off the balance sheet (improving certain
ratios like
long term debt-to-total capital
).
Most
consider operating leases as debt, and therefore manually add
operating leases back onto the balance sheet. Pier 1 Imports is an operator of retail
furniture stores. Here is the long-term liability section of its balance sheet:
This tutorial can be found at:
http://www.investopedia.com/university/financialstatements/
(Page 50 of 66)
Copyright © 2004, Investopedia.com - All rights reserved.
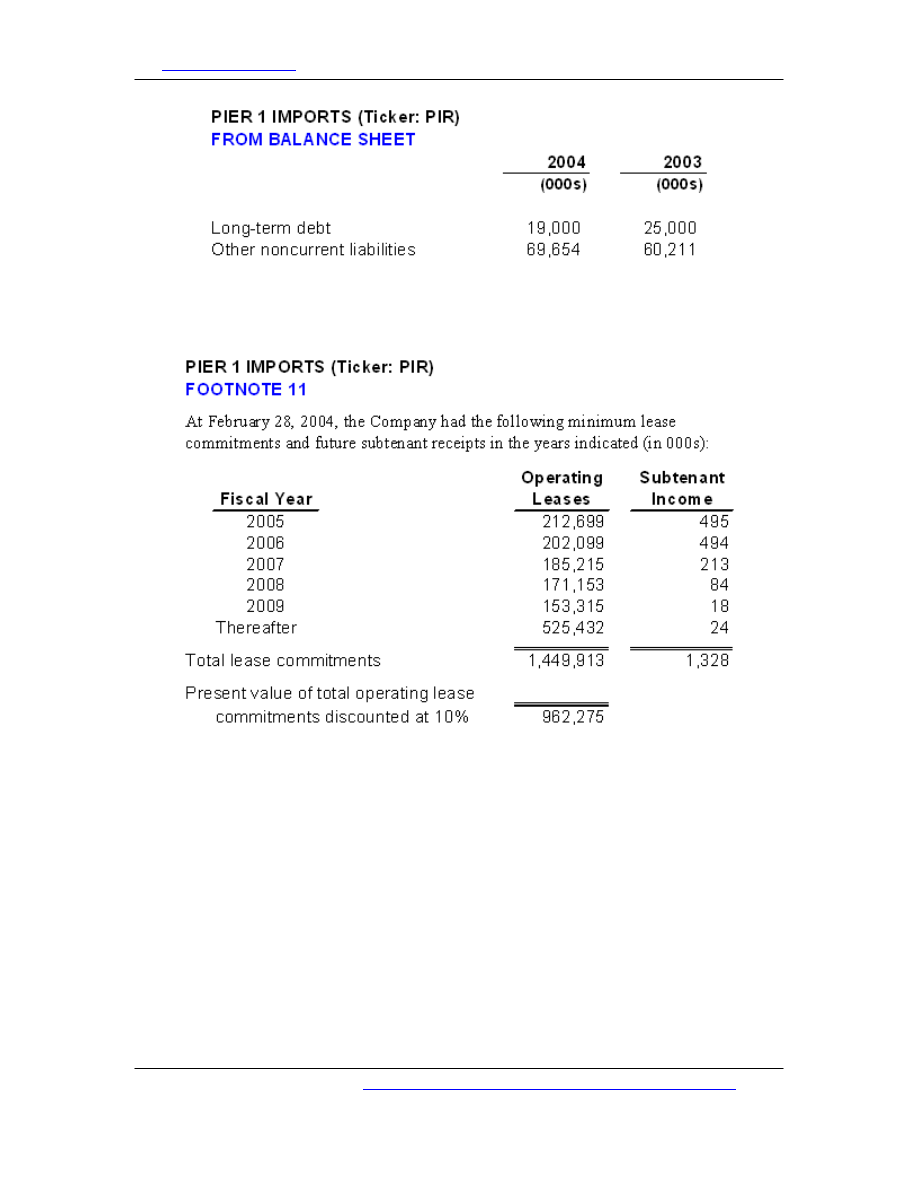
Investopedia.com
– the resource for investing and personal finance education.
Long-term debt is a very tiny 2% of total assets ($19 million out of $1 billion).
However, as described by a footnote, most of the company's stores utilize operating
leases rather than capital leases:
The present value of the combined lease commitments is almost $1 billion. If these
operating leases are recognized as obligations and therefore manually put back onto
the balance sheet, both an asset and a liability of $1 billion would be created, and
the effective long term debt-to-total capital ratio would go from 2% to about 50%
($1 billion in "capitalized" leases divided by $2 billion).
Summary
It has become more difficult to analyze long-term liabilities because innovative
financing instruments are blurring the line between debt and equity. Some
companies employ such complicated capital structures that investors must simply
add "lack of transparency" to the list of its risk factors. Here is a summary of what to
keep in mind:
• Debt is not bad. Some companies with no debt are actually running a sub-
optimal capital structure.
This tutorial can be found at:
http://www.investopedia.com/university/financialstatements/
(Page 51 of 66)
Copyright © 2004, Investopedia.com - All rights reserved.

Investopedia.com
– the resource for investing and personal finance education.
• If a company raises a significant issue of new debt, the company should
specifically explain the purpose. Be skeptical of boilerplate explanations--if
the bond issuance is going to cover operating cash shortfalls, you have a red
flag.
• If debt is a large portion of the capital structure, take the time to look at
conversion features and bond covenants.
• Try to get a rough gauge of the company's exposure to interest rate changes.
• Consider treating operating leases as balance sheet liabilities.
Pension Plans
Following from the
, this section
focuses on a special long-term liability, the
. For many companies, this
is a very large liability and, for the most part, it is not captured on the
We could say that pensions are a type of
. Pension fund
accounting is complicated and the footnotes are often torturous in length, but the
good news is that you need to understand only a few basics in order to know the
most important questions to ask about a company with a large pension fund.
There are various sorts of pension plans, but here we review only a certain type: the
. With a defined benefit plan, an employee knows the
terms of the benefit that he or she will receive upon retirement. The company is
responsible for investing in a fund in order to meet its obligations to the employee,
and so, the company bears the investment risk. On the other hand, in a
), the company probably makes contributions--or
--but does not promise the future benefit to the employee. As
such, the employee bears the investment risk.
Among defined benefit plans, the most popular type bears a promise to pay retirees
based on two factors: 1. the length of their service and 2. their salary history at the
time of retirement. This is called a "career average" or "final pay" pension plan. Such
a plan might pay retirees, say, 1.5% of their "final pay," their average pay during
the last five years of employment, for each year of service (up to a maximum
number of years). Under this plan, an employee with 20 years of service would
receive a retirement benefit equal to 30% (20 years x 1.5%) of their final average
pay. But formulas and provisions vary widely; for example, some will reduce or
"offset" the benefit by the amount of social security the retiree receives.
Funded Status = Plan Assets - Projected Benefit Obligation (PBO)
A pension plan has two primary elements:
• The future liabilities--or benefit obligations--created by employee service.
• The pension fund--or plan assets--that are used to pay for retiree benefits.
This tutorial can be found at:
http://www.investopedia.com/university/financialstatements/
(Page 52 of 66)
Copyright © 2004, Investopedia.com - All rights reserved.
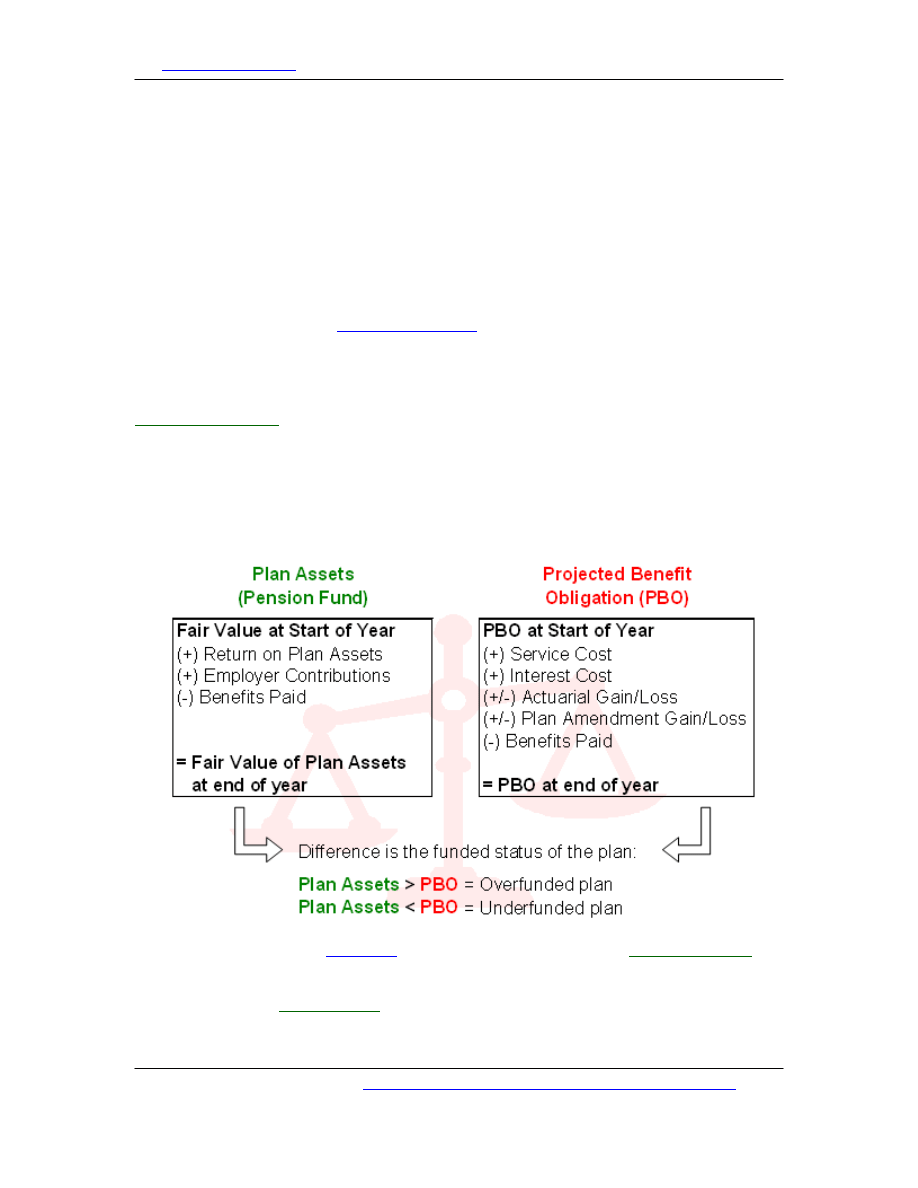
Investopedia.com
– the resource for investing and personal finance education.
At this primary level, a pension plan is simple: the company (called the "plan
sponsor" in this context) contributes to its pension fund; the pension fund is invested
into bonds, equities, and other asset classes in order to meet its long-term
obligations; and retirees are then eventually paid their benefits from the fund.
Three things make pension fund accounting complicated. First, the benefit obligation
is a series of payments that must be made to retirees far into the future. Actuaries
do their best to make estimates about the retiree population, salary increases, and
other factors in order to discount the future stream of estimated payments into a
single present value. This first complication is unavoidable.
Second, the application of
means that actual cash flows are not
counted each year. Rather, the computation of the annual pension expense is based
on rules that attempt to capture changing assumptions about the future.
Third, the rules require companies to "smooth" the year-to-year fluctuations in
and actuarial assumptions so that pension fund accounts are not
dramatically over- (or under-) stated when their investments produce a single year
of above- (or below-) average performance. Although well-intentioned, smoothing
makes it even harder for us to see the true economic position of a pension fund at
any given point in time.
Let's take a closer look at the two basic elements of a pension fund:
On the left, we show the
of the plan assets. This is the
.
During the year, wise investments will hopefully increase the size of the fund. This is
the "return on plan assets." Also, employer contributions, cash the company simply
, will increase the fund. Finally, benefits paid (or
disbursements) to current retirees will reduce the plan assets.
This tutorial can be found at:
http://www.investopedia.com/university/financialstatements/
(Page 53 of 66)
Copyright © 2004, Investopedia.com - All rights reserved.
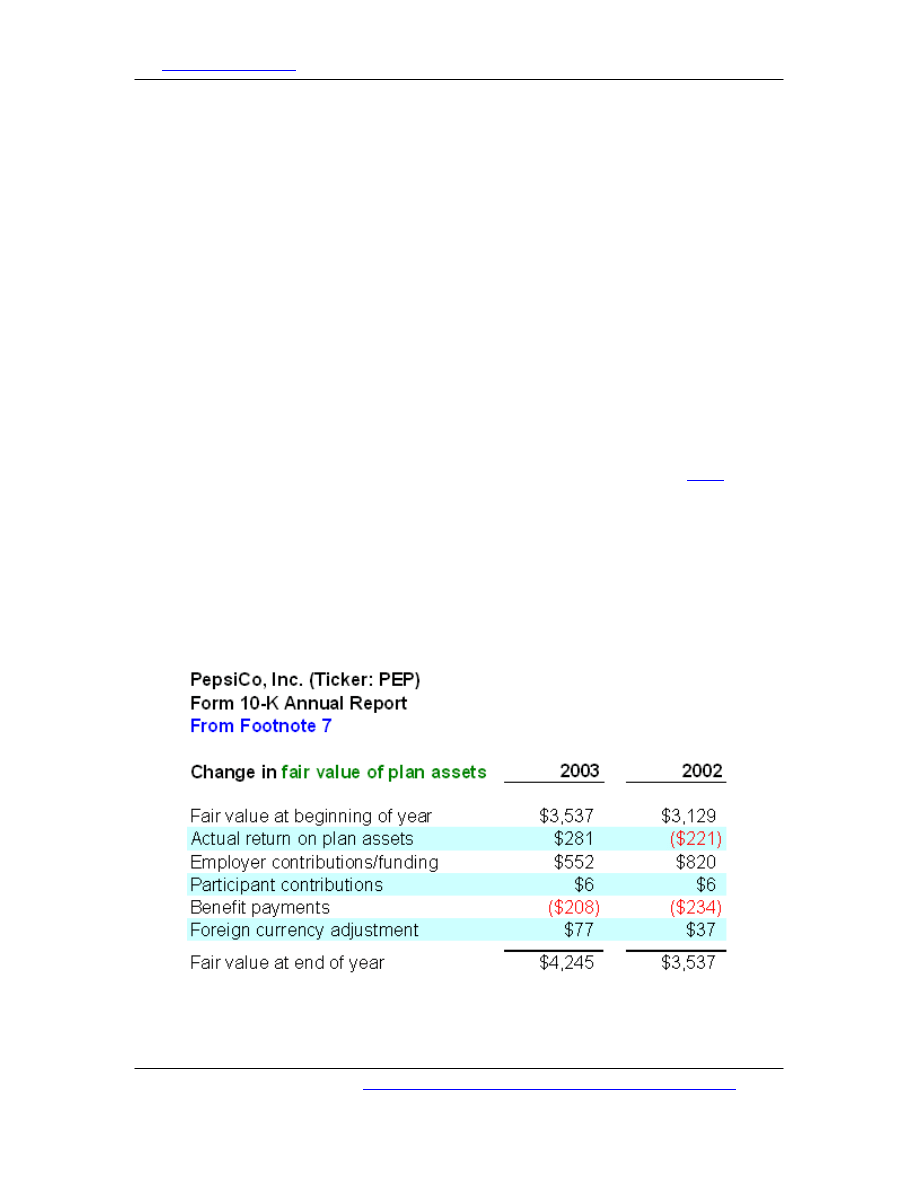
Investopedia.com
– the resource for investing and personal finance education.
On the right, we show the basic calculation of the projected benefit obligation (PBO),
which is an estimate of the future stream of benefit obligations discounted to the
present value into a single number. For clarity's sake, we omitted a few items.
In the annual report, you will see two other measures of estimated future
obligations: the vested benefit obligation (VBO) and the accumulated benefit
obligation (ABO). You do not need either of these for the purposes we discuss here,
but ABO is less than PBO because it assumes that salaries will not rise into the
future, while PBO assumes salary increases. VBO is less than ABO because it counts
only service already performed, but PBO counts the future service (minus turnover
assumptions). PBO is the number that matters because it's the best guess as to the
present value of the discounted liabilities assuming the employees keep working and
salaries keep rising.
By subtracting the PBO from the fair value of the plan assets, you get the funded
status of the plan. This is an important number that will be buried somewhere in the
footnotes, but it must be disclosed.
Breaking Down the Funded Status of the Plan
Let's look at an actual example. We will use data from the annual report
PepsiCo (ticker: PEP) for the year ended December 31, 2003. Although its pension
plan happened to be under-funded at that time, it can be considered relatively
healthy--especially compared to other companies. We picked PepsiCo because the
company's plan is well-disclosed and its 10-K contains helpful commentary.
Below is the part of the footnote that calculates the fair value of the plan assets. You
can see that the pension fund produced an actual return of 7.9% in the year 2003
($281 / $3,537). Other than the investment returns, the largest changes are due to
employer contributions and benefit payouts:
Now take a look at the calculation of the PBO (see below). Whereas the fair value of
This tutorial can be found at:
http://www.investopedia.com/university/financialstatements/
(Page 54 of 66)
Copyright © 2004, Investopedia.com - All rights reserved.
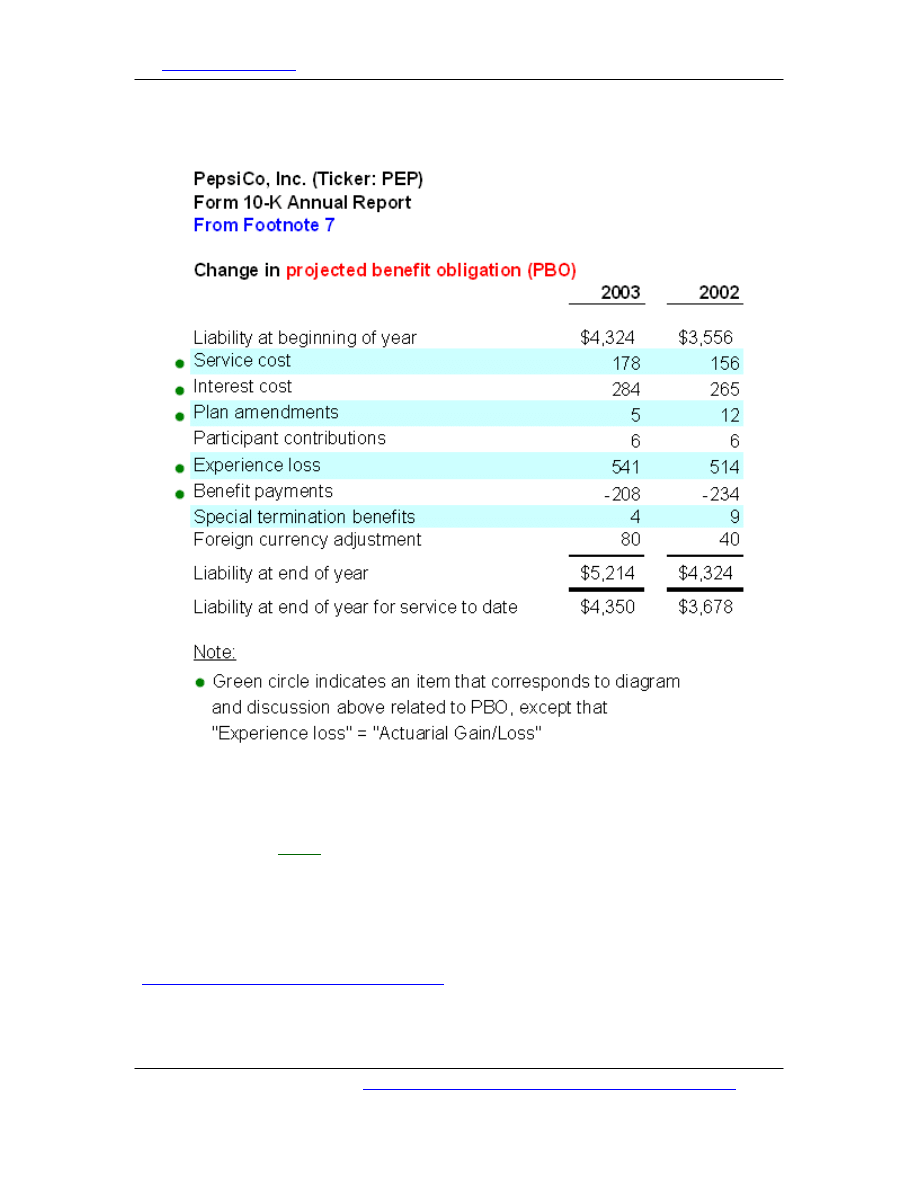
Investopedia.com
– the resource for investing and personal finance education.
plan assets (how much the fund was worth) is a somewhat objective measure, the
PBO requires several assumptions which make it more subjective:
You can see that PepsiCo started 2003 with an estimated liability of $4,324, but the
liability is increased by service and interest cost. Service cost is the additional
liability created because another year has elapsed, for which all current employees
for their service. Interest cost is the additional liability
created because these employees are one year nearer to their benefit payouts.
The reason for and effect of the additional interest cost is easier to understand with
an example. Let's assume that today is 2005 and the company owes $100 in five
years, in the year 2010. If the discount rate is 10%, then the present value of this
obligation is $62 ($100 ÷ 1.1^5 = $62). (For a review of this calculation, see
"
Understanding the Time Value of Money
.") Now let one year elapse. Because at the
start of 2006 the funds now have four years instead of five years to earn interest
before 2010, the present value of the obligation as of 2006 increases to $68.3 ($100
This tutorial can be found at:
http://www.investopedia.com/university/financialstatements/
(Page 55 of 66)
Copyright © 2004, Investopedia.com - All rights reserved.
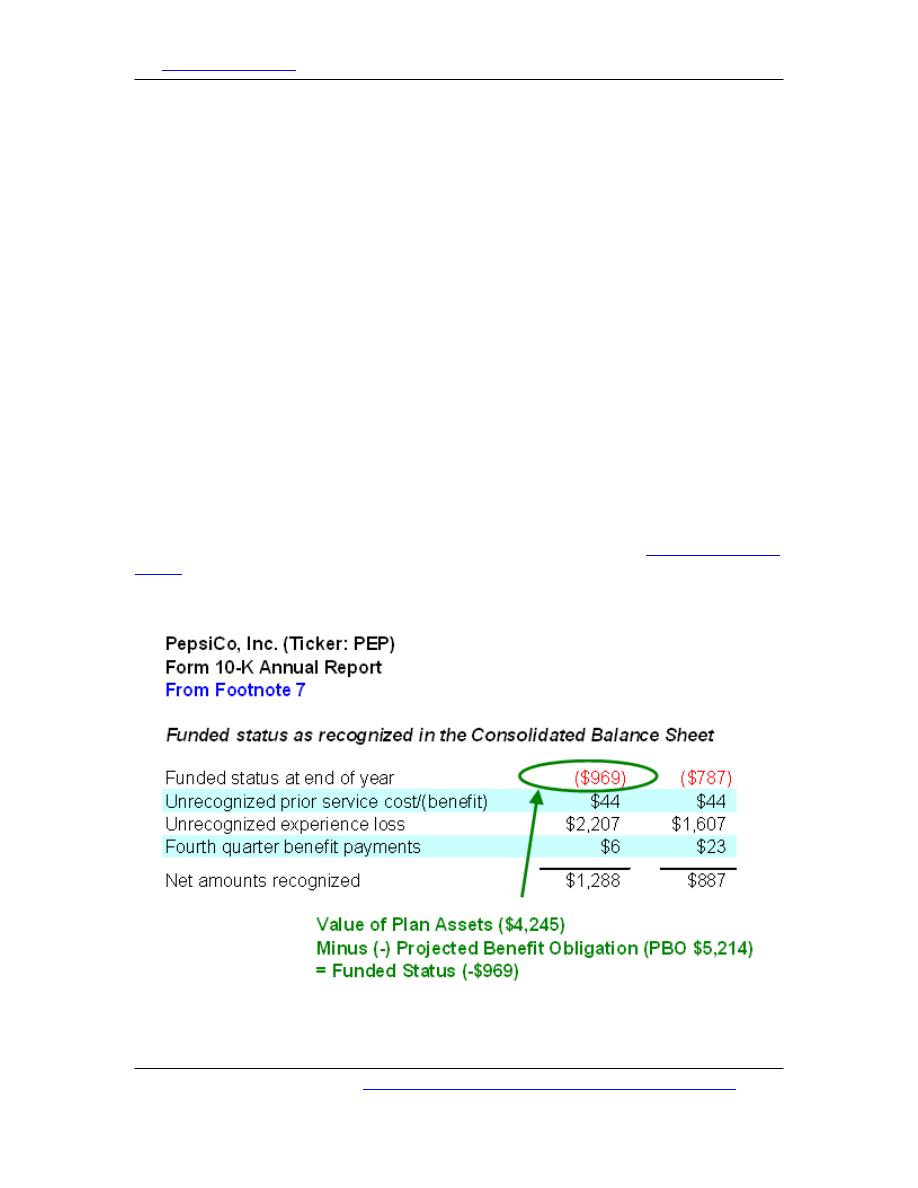
Investopedia.com
– the resource for investing and personal finance education.
÷ 1.1^4 = $68.3). You can see how interest cost depends on the discount rate
assumption.
Now, let's continue with PepsiCo's footnote above. Plan amendments refer to
changes to the pension plan, and they could have a positive or negative impact on
cost. "Experience loss" is more commonly labeled "actuarial loss/gain," and it too can
be positive or negative. It refers to additional costs created because of the actuarial
estimates changes made during the year. For example, we don't know exactly the
cause in PepsiCo's case, but perhaps it increased its estimate of the average rate of
future salary increases or the average age of retirement. Either of these changes
would increase the PBO and the additional cost would show up as an "actuarial loss."
We see that PepsiCo's liability at the end of the year 2003 was $5,214. That is the
PBO. We also see a lesser amount "for service to date." That is the VBO and we can
ignore it.
The fair value of the plan assets ($4,245) subtracted by the PBO ($5,214) results in
the funded status at the end of 2003 of -$969 million. The bottom line: PespiCo's
pension plan at that time was under-funded by almost one billion dollars.
Pension Plans and the Balance Sheet
Now remember we said that pension plans are off-balance-sheet financing, and in
PepsiCo's case, the $4.245 billion in assets and $5.214 billion in liabilities are not
recognized on the balance sheet. Therefore, typical debt ratios like
probably do not count the pension liability of $5+ billion. But it's even worse
than that. You might think the net "deficit" of -$969 million would be carried as a
liability, but it is not. Again, from the footnotes:
Due to the smoothing rules of pension plan accounting, PepsiCo carried $1,288 in
pension plan assets on the balance sheet, at the end of 2003. You can see how the
This tutorial can be found at:
http://www.investopedia.com/university/financialstatements/
(Page 56 of 66)
Copyright © 2004, Investopedia.com - All rights reserved.
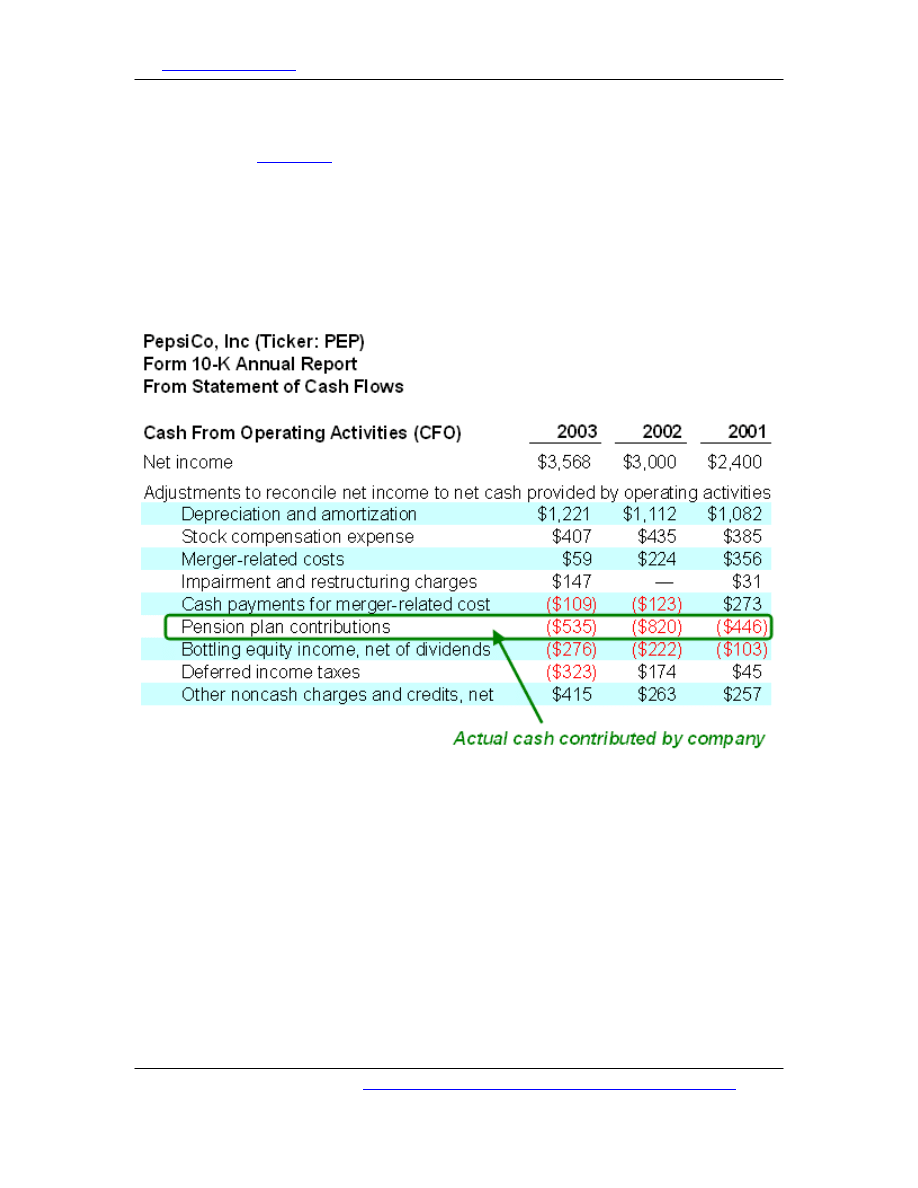
Investopedia.com
– the resource for investing and personal finance education.
two "unrecognized" lines on the footnote above boost the negative into a positive:
the losses for the current year--and prior years, for that matter--are not recognized
in full; they are
or deferred into the future. Although the current position
is negative almost one billion, smoothing captures only part of the loss in the current
year--it's not hard to see why smoothing is controversial.
Cash Contributed to the Pension Is Not Pension Cost
Now we have enough understanding to take a look at why cash contributed to the
pension plan bears little--if any--resemblance to the pension expense (also known as
"pension cost") that is reported on the income statement and reduces reported
earnings. We can find actual cash contributed in the statement of cash flows:
Now compare these cash contributions to the pension expense. In each of the three
years reported, cash spent was significantly higher than pension expense:
This tutorial can be found at:
http://www.investopedia.com/university/financialstatements/
(Page 57 of 66)
Copyright © 2004, Investopedia.com - All rights reserved.
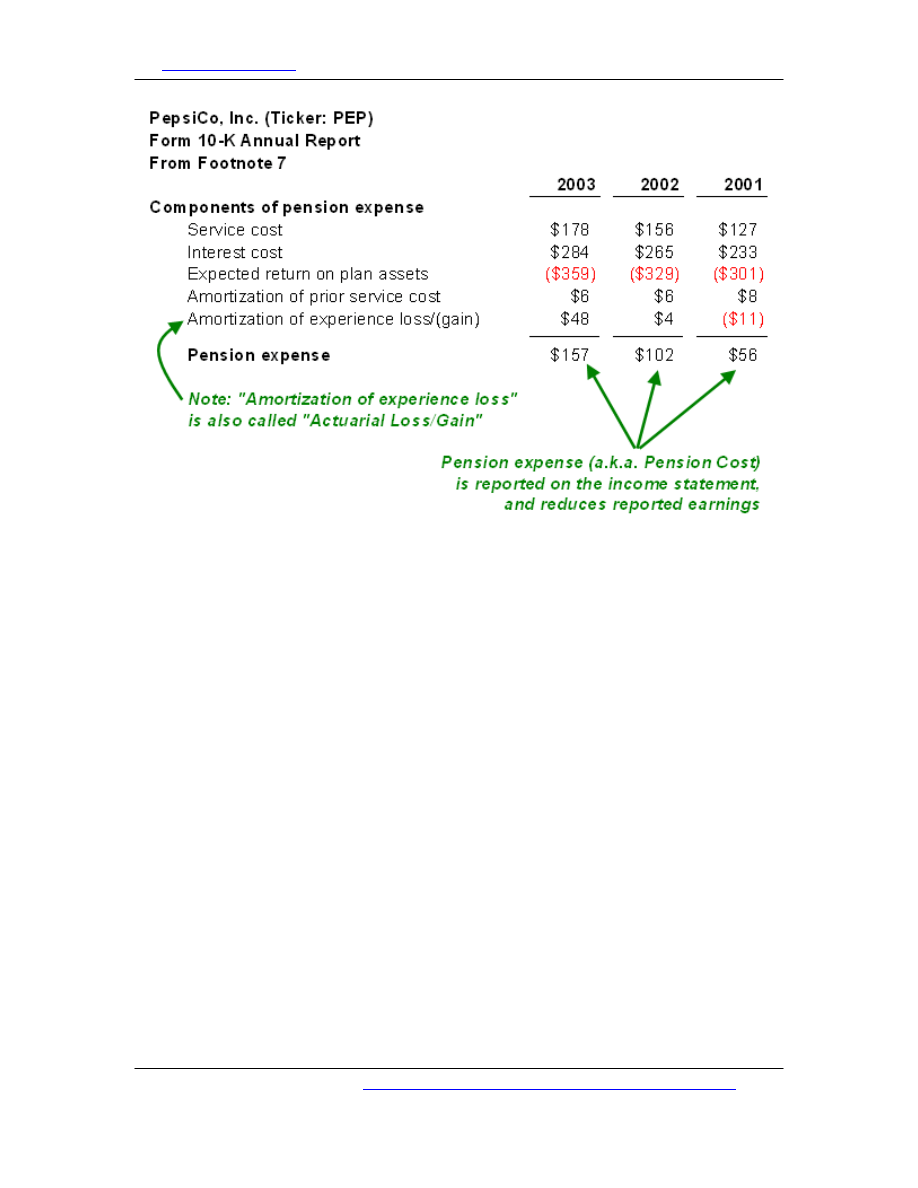
Investopedia.com
– the resource for investing and personal finance education.
The first two components of pension expense--service and interest cost--are identical
to those found in the calculation of PBO. The next component is "expected return on
plan assets." Recall that the "fair value of plan assets" includes actual return on plan
assets. Expected return on plan assets is similar, except the company gets to
substitute an estimate of the future return on plan assets. It is important to keep in
mind that this estimate is an assumption the company can tweak to change the
pension expense. Finally, the two "amortization" items are again due to the effects of
smoothing. Some people have gone so far as to say the pension expense is a bogus
number due to the assumptions and smoothing.
Critical Questions
We have just scratched the surface of pension plan accounting, but we have
reviewed enough to identify the four or five critical questions you need to ask when
evaluating a company's pension fund.
We have two primary concerns in regard to analysis of the pension fund:
• What is the economic status of the liability? A dramatically under-funded plan
will require increased cash contributions in the future and foreshadows future
increases in income statement expenses.
• How aggressive/conservative is the pension expense? An aggressive
accounting policy is a "red flag" because it will usually have to be unraveled
by the company in future periods. Conservative policies contribute to earnings
that are higher in quality.
This tutorial can be found at:
http://www.investopedia.com/university/financialstatements/
(Page 58 of 66)
Copyright © 2004, Investopedia.com - All rights reserved.
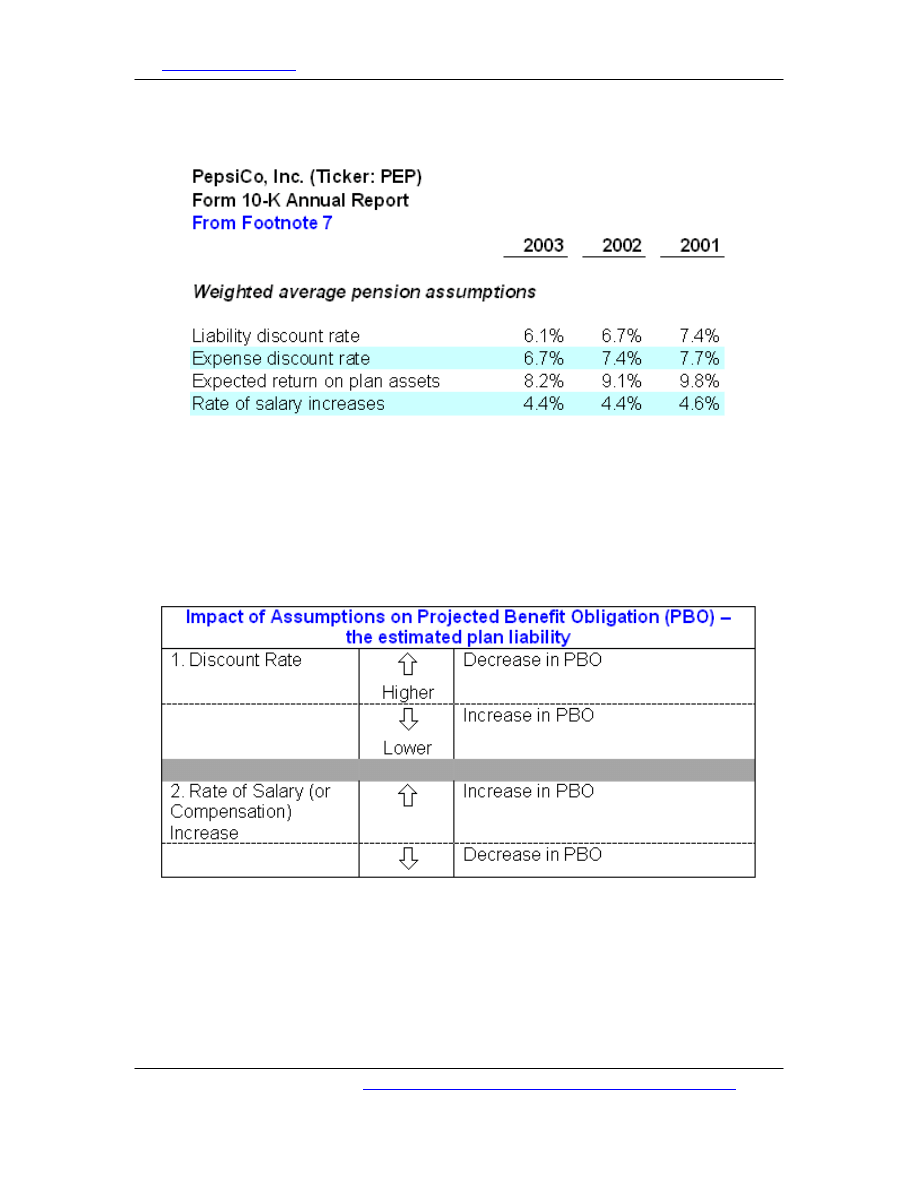
Investopedia.com
– the resource for investing and personal finance education.
Take a look at key assumptions disclosed by PepsiCo:
In regard to our first concern--the economic status of the liability--we want to look at
the funded status that equals the fair value of plan assets minus the PBO. The two
key assumptions that impact the PBO are the discount rate and projected rate of
salary increases. A company can decrease its PBO (and therefore, increase its funded
status) by either increasing the discount rate or lowering the projected rate of salary
increases. You can see that PepsiCo's rate of salary increase is fairly stable at 4.4%
but the discount rate dropped to 6.1%. This steady drop in the discount rate
contributes significantly to the increased PBO and the resultant under-funded status.
In regard to our second concern--the quality of the pension expense--there are three
key assumptions:
This tutorial can be found at:
http://www.investopedia.com/university/financialstatements/
(Page 59 of 66)
Copyright © 2004, Investopedia.com - All rights reserved.
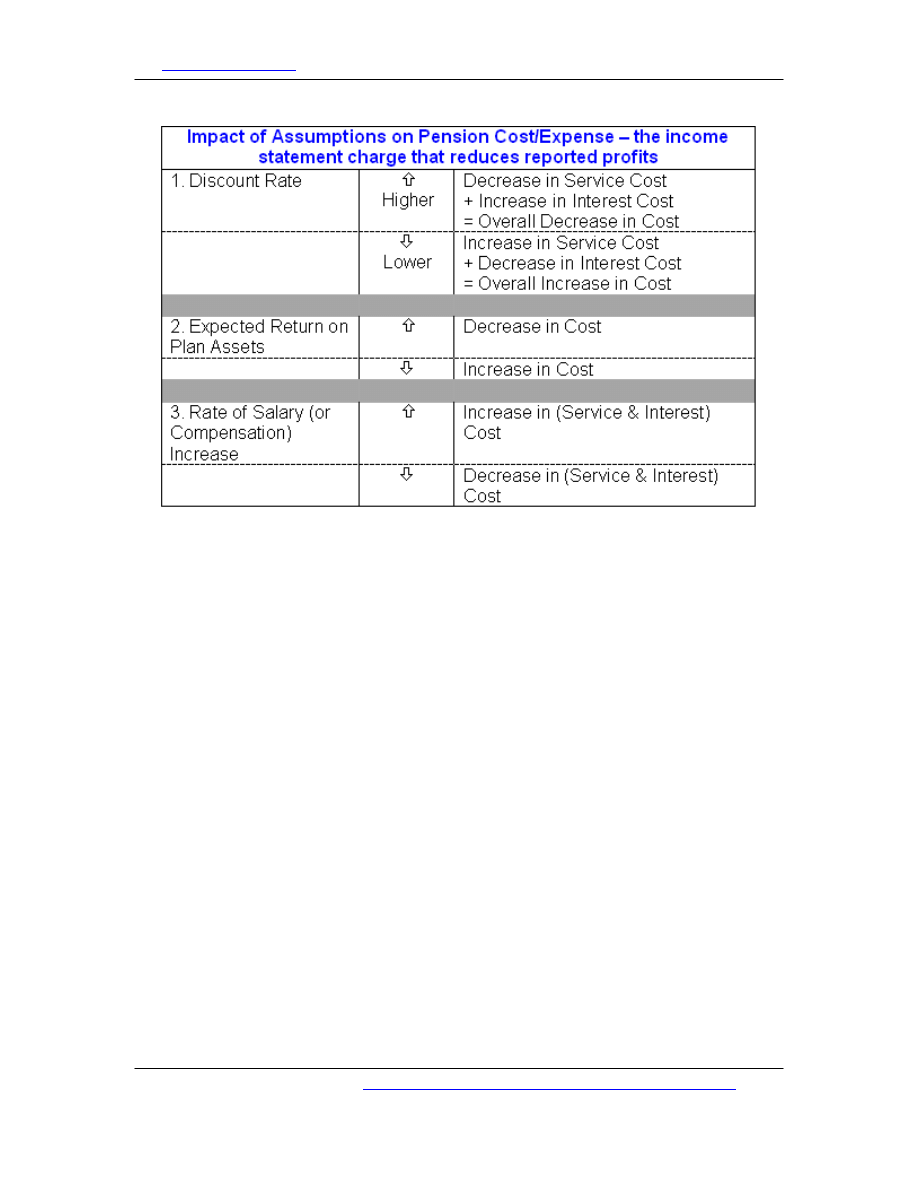
Investopedia.com
– the resource for investing and personal finance education.
The discount rate is a little bit mixed because it has opposite effects on the service
and interest cost, but in most cases, it behaves as before: a lower discount rate
implies a decrease in pension expense. Regarding expected return on plan assets,
notice that PepsiCo's assumption here has steadily decreased over the two years to
finish at 8.2%. Soft equity markets are a double-whammy for pension funds: they
not only lower the discount rate (which increases the PBO) but they lower the
expected return on the plan assets!
So we can now summarize the effect of accounting practices:
• Aggressive (dubious) accounting includes one or more of the following: a high
discount rate, an expected return on plan assets that is overly optimistic by
being quite higher than the discount rate, and a low rate of salary increase.
• Conservative (good) accounting includes all of the following: low discount
rate, an expected return on plan assets that is near the discount rate, and a
high rate of salary increase
Finally, companies are now required to disclose how the pension plan is invested. For
example, PepsiCo's footnote explains the target asset allocation of its pension (60%
stock and 40% bonds) and then breaks down its actual allocation. Furthermore, you
can check to see how much of the pension fund is invested in the company stock.
You should definitely look at these allocations if you have a view about the equity or
bond markets. There has been much academic discussion about companies'
allocation mismatching: the argument goes that they are funding liabilities with too
This tutorial can be found at:
http://www.investopedia.com/university/financialstatements/
(Page 60 of 66)
Copyright © 2004, Investopedia.com - All rights reserved.

Investopedia.com
– the resource for investing and personal finance education.
much equity when liabilities should be funded with bonds (of course, companies fund
with equities to boost their actual and expected returns).
Conclusion
For evaluating stocks that have a pension plan, you can do the following:
1. Locate the funded status (fair value of plan assets minus projected benefit
obligation).
2. Check the trend and level of the following key assumptions:
• Discount rate: make sure it is conservative (low) enough. If it's going up,
ask why.
• Expected return on plan assets: is it conservative (low) enough? If it's
significantly higher than the discount rate, be skeptical of the pension
expense.
•
Rate of salary increase: is it high enough?
3. Check the target and actual allocation of the pension plan. Is the company
making sufficient use of bonds to fund the pension liability (conversely, are
they overly exposed to equities)?
Conclusion and Resources
Let's summarize the ideas discussed throughout this tutorial according to a few
major themes:
Let the Business Model Shape Your Focus Areas
The average
annual report is stuffed with dozens of dense footnotes and
adjusted numbers offered as alternatives to the "recognized" numbers contained in
the body of the
. For example, companies often
disclose six or eight versions of
, such as the "as reported,"
"adjusted," and "pro forma" versions for both basic and
. But the average
individual investor probably does not have the time to fully assimilate these
documents.
Therefore, it may be wise to first look at industry dynamics and the corresponding
company
and let these guide your investigation. While all investors
care about generic figures, such as revenue and EPS, each industry tends to
emphasize certain metrics. And these metrics often "lead" or foreshadow the generic
performance results.
The table below illustrates this idea by showing some of the focus areas of a few
specific industries. For each industry, please keep in mind that the list of focus areas
is only a "starter set"--it is hardly exhaustive. Also, in a few cases, the table gives
key factors not found in the financial statements in order to highlight their
shortcomings:
This tutorial can be found at:
http://www.investopedia.com/university/financialstatements/
(Page 61 of 66)
Copyright © 2004, Investopedia.com - All rights reserved.

Investopedia.com
– the resource for investing and personal finance education.
Selected Industries:
Nature of Business Model: Selected Focus Areas:
Business Services (for
example, temporary help,
advertising, and consulting.)
• People are key
assets.
• Much of the
company value is
likely to be
intangible (not on
the balance sheet).
• Revenue
recognition.
• Recurring
sources
of revenue (for
example, long-term
contracts).
• Gross margin (1 –
cost of goods as %
of revenue) since it
tells you about
"pricing power" with
customers.
Computer Hardware
• Rapid
price
deflation (decrease
in price-to-
performance).
• Rapid
inventory
turnover.
• Rapid
innovation
and product
obsolescence.
• Revenue
breakdown into no.
of units x avg. price
per unit (how many
units are selling?).
• Cash
conversion
cycle (days
inventory + days
receivable – days
payable).
• Quality of research
and development
(R&D) spending
and joint ventures.
Consumer Goods
• Brand value is
critical.
• Companies
require
efficient inventory
because it is often
perishable.
• Industry
sees
relatively low
margins.
• Cash
conversion
cycle and inventory
turnover.
• Gross margin.
• Operating
margin
(for example, EBIT
or EBITDA margin).
• Key factors not in
statements: new
product
development and
investment in the
brand.
Industrial Goods (materials,
heavy equipment)
• Cyclical.
• If commodities, then
market sets price.
• Heavy investment in
long-term assets.
• High fixed costs.
• Long-term
assets
and depreciation
methods.
• Asset
turnover
(sales/assets) and
asset utilization (for
example, return on
This tutorial can be found at:
http://www.investopedia.com/university/financialstatements/
(Page 62 of 66)
Copyright © 2004, Investopedia.com - All rights reserved.

Investopedia.com
– the resource for investing and personal finance education.
capital).
• Key factors not in
financial
statements: market
pricing trends and
point in business
cycle.
Media
• Economies of scale
are typically
important.
• Requires
significant
investment.
• Convergence
is
"blurring the line"
between industries.
• Revenue
recognition,
especially for
subscriptions and
advertising.
• Free
cash
flow,
especially for cable
and publishing.
• Pension plans as
many companies
are "old economy."
• Key factors not in
financial
statements:
regulatory
environment and
joint/ventures
alliances.
Retail (for example, apparel
or footwear)
• Intense
competition
against fickle
fashion trends.
• Inventory
management, which
is critical.
• Low
margins.
• Revenue
breakdown in
product lines and
trends--one product
can "make or
break."
• Cash
conversion
cycle.
• Gross margin.
• Operating
margin--
low employee
turnover will keep
this down.
Software
• High "up front"
investment but high
margins and high
cash flow.
• Complicated
selling
schemes (channels,
product bundling,
license
arrangements).
• Revenue
recognition, which is
absolutely essential
in software industry.
• Gross
margin
trends.
• Stock
option
cost/dilution
because, of all
industries, software
This tutorial can be found at:
http://www.investopedia.com/university/financialstatements/
(Page 63 of 66)
Copyright © 2004, Investopedia.com - All rights reserved.

Investopedia.com
– the resource for investing and personal finance education.
grants the most
options.
Telecommunications
• High
fixed
investment (capital
intensive).
• Changing
regulatory
environment.
• Long-term
assets
and depreciation.
• Long-term debt (for
instance, many
companies are
highly leveraged).
Cash Flows Help to Determine the Quality of Earnings
While some academic theories say that
set stock prices, and some
investors appear to be shifting their attention toward cash flows, can anyone deny
that
(and EPS) move stocks? Some have cleverly resolved the cash flow-
versus-earnings debate with the following argument: in the short run, earnings move
stocks because they modify expectations about the long-term cash flows.
Nevertheless, as long as other investors buy and sell stocks based on earnings, you
should care about earnings. To put it another way, even if they are not a
fundamental factor that determines the intrinsic value of a stock, earnings matter as
a behavioral or phenomenal factor in impacting supply and demand.
Thoughout this tutorial, we explore several examples of how current cash flows can
say something about future earnings. These examples include the following:
Cash Flows That May Impact Future Earnings Why the Cash Flows May Be
Predictive
Changes in operating accounts, which are found
in the statement of cash flows, sometimes hint at
future operational deterioration:
• Increase in inventory as percentage of
COGS/sales (or decrease in inventory
turnover).
• Unless company is stocking
up ahead of anticipated
demand, the increase in
inventory could indicate a
slackening demand.
• Increase in receivables as percentage of
sales (or decrease in receivables
turnover).
• Customers may be taking
longer to pay; there may be
an increase in collection
problems.
• Decrease in payables as percentage of
COGS/sales (or decrease in payables
turnover).
• Company may be losing
leverage with vendors.
If "cash collected from customers" grows less
than revenues, there may be future revenue
Reported revenue may be getting a
temporary (current) boost by end-of-
This tutorial can be found at:
http://www.investopedia.com/university/financialstatements/
(Page 64 of 66)
Copyright © 2004, Investopedia.com - All rights reserved.

Investopedia.com
– the resource for investing and personal finance education.
problems.
year incentives.
to equity (FCFE) (which equals
cash flow from operations minus cash flow from
investments) is growing more than earnings, it
may be a good sign. (Conversely, a FCFE that
grows less than earnings may be a bad sign.)
In the long-run, it is unlikely that
divergence between the two can be
sustained--eventually, earnings will
probably converge with the cash flow
trend.
The funded status of a pension plan, which
equals the fair value of plan assets minus the
projected benefit obligation (PBO), tends to
impact future earnings.
Unless trends reverse, under-funded
(over-funded) pension plans will
require greater (fewer) contributions
in the future.
Red Flags Theme
The red flags emphasized in this tutorial stem from this single principle: the aim in
analyzing financial statements is to isolate the fundamental operating performance of
the business. In order to do this, you must remove two types of gains that may not
be sustainable:
1.
Non-recurring gains - These include gains due to the sale of a business, one-
time gains due to
, gains due to liquidation of older inventory
(that is, liquidation of the
layer), and temporary gains due to harvesting
old fixed assets (where lack of new investment saves depreciation expense).
2.
Gains due to financing - These are important because, while they are real
gains, they are often random variables that depend on market conditions and
they may be reversed in future years.
The sources of financing gains include special one-time
or returns on
investments, early retirement of
or derivative investments, abnormally
high pension plan returns (including an upward revision to expected return on plan
assets, which automatically reduces pension cost), and increases to earnings or EPS
simply due to a change in the
(for example, an increase in EPS due
).
Green Flags Theme
In regard to green flags, the key principle--as far as financial statements are
concerned--is that it is important to see conservative reporting practices. In regard
to the two most popular financial statements, conservatism is implied by the
following:
1.
In the income statement: Conservative revenue recognition is shown by
things like no barter arrangements, no front-loaded recognition for long-term
contracts, a sufficient
allowance for doubtful accounts
(that is, it is growing
with sales), the choice of LIFO rather than
inventory costing method,
and the expensing of rather than capitalizing of
2.
In the balance sheet: Conservative reporting practices include sufficient cash
balances; modest use of derivative instruments that are deployed only to
hedge specific risks such as
or foreign currency exchange; a
capital structure that is clean and understandable so those analyzing the
This tutorial can be found at:
http://www.investopedia.com/university/financialstatements/
(Page 65 of 66)
Copyright © 2004, Investopedia.com - All rights reserved.

Investopedia.com
– the resource for investing and personal finance education.
statements don't have to sort through multiple layers of common stock,
, and several complex debt instruments; and a debt burden
that is manageable in size, not overly exposed to interest rate changes, and
not overly burdened with
shareholders.
Final Note
This series is designed to help you spot red and green flags in your potential stock
investments. Keep in mind the limitations of financial statements: they are
backward-looking by definition, and you almost never want to dwell on a single
statistic or metric.
Finally, U.S. accounting rules are always in flux. At any given time, the
(FASB) is working on several accounting projects. You
can see the status of the projects at their
. But even as rules change and
tighten in their application, companies will continue to have plenty of choices in their
accounting. So, if there is a single point to this tutorial, it is that you should not
accept a single number, such as basic or diluted
(EPS), without
looking "under the hood" at its constituent elements.
Related Tutorials:
- Learn the different accounting and valuation
treatments of ESOs, and discover the best ways to incorporate these techniques into
your analysis of stock.
Introduction to Fundamental Analysis
- Here's an easy-to-understand
tutorial on the techniques of analyzing a company's financial statements, including
the annual and quarterly reports, the auditor's report, and much more.
Guide to Stock Picking Strategies
- Every stock investor needs a strategy that
fits his or her outlook and style. Here you will learn abut the most popular stock
picking strategies, including their philosophies, methods, and tools.
- This detailed tutorial explains some of the more
complex concepts and calculations you need to know for trading bonds, including
bond pricing, yield, term structure of interest rates, duration, and much more.
This tutorial can be found at:
http://www.investopedia.com/university/financialstatements/
(Page 66 of 66)
Copyright © 2004, Investopedia.com - All rights reserved.
Economic Value Added - EVA
Categories:
|
|
Tutorials
Articles
Ask Us
Exam Prep
Investing Game
Tools
Newsletters
Corporate
Economic Value Added - EVA
A measure of a company's financial
performance based on the residual wealth
calculated by deducting cost of capital from its
operating profit (adjusted for taxes on a cash
basis).
The formula for calculating EVA is as follows:
= Net Operating Profit After Taxes (NOPAT) -
(Capital * Cost of Capital)
This measure was devised by Stern Stewart &
Co. Economic value added attempts to capture
the true economic profit of a company.
- Looking for a formula to determine
whether a company is creating wealth? Time to learn all about
EVA.
Dictionary Sponsored by
Related Terms
Net Operating
Profit After Tax-
NOPAT
Newsletters
Learn how to Invest by
Email - for FREE!
New to investing?
Join our 'Beginners
Newsletter' - for
FREE!
Marketplace
Barkley Financial
Get your FREE
Options Investing Kit
today!
ChartAdvisor.com
Click Here for
Explosive Gains while
Controlling Your
Losses!
Term Directory:
|
|
|
Trade Futures? Name Your Commission!
Site Stuff:
Newsletter:
"The #1 Way to Learn about Investing"
Copyright © 1999-2004 - All rights reserved. Owned and Operated by Investopedia Inc.
http://www.investopedia.com/terms/e/eva.asp02/02/2005 23:30:15
Search the Site
Search
QuotesGo
Your Email
Join
Balance Sheet
Categories:
|
|
Tutorials
Articles
Ask Us
Exam Prep
Investing Game
Tools
Newsletters
Corporate
Balance Sheet
A company's financial statement. It reports the
company's assets, liabilities and net worth at a
specific time.
You will notice that assets = liabilities +
shareholder equity. This equation is true for all
balance sheets. If the balance sheet is
"consolidated" it just means that the company
is a corporate group rather than a single
company.
of the balance sheet and how they relate to each other.
Introduction to Fundamental Analysis
to-understand tutorial on the techniques of analyzing a
company's financial statements, including the annual and
quarterly reports, the auditor's report, and much more.
Advanced Financial Statement Analysis
- Learn what it
means to do your homework before investing in a company.
Get a deeper understanding of the structure of financial
statements and what they tell you about a company's
performance and reporting practices.
Dictionary Sponsored by
Related Terms
Newsletters
Learn how to Invest by
Email - for FREE!
New to investing?
Join our 'Beginners
Newsletter' - for
FREE!
Marketplace
Barkley Financial
Get your FREE
Options Investing Kit
today!
ChartAdvisor.com
Click Here for
Explosive Gains while
Controlling Your
Losses!
Term Directory:
|
|
|
http://www.investopedia.com/terms/b/balancesheet.asp (1 of 2)02/02/2005 23:31:40
Search the Site
Search
QuotesGo

Balance Sheet
Trade Futures? Name Your Commission!
Site Stuff:
Newsletter:
"The #1 Way to Learn about Investing"
Copyright © 1999-2004 - All rights reserved. Owned and Operated by Investopedia Inc.
http://www.investopedia.com/terms/b/balancesheet.asp (2 of 2)02/02/2005 23:31:40
Your Email
Join
Document Outline
- Advanced Financial Statements Analysis
- investopedia.com
Wyszukiwarka
Podobne podstrony:
financial statements pko bank polski 2009
Consolidated Financial Statements of the Group & Bank Mellat
Financial Statements
Notes to the Financial Statements
Personal Financial Statement
financial statements (Corporate Finance)
Personal Financial Statement
Advanced Calculus And Analysis I Craw (2002) WW
2007 2012 IBSA Financial Statement
zestaw 1295 financial statements business english sprawozdania finansowe angielskie slownictwo bizne
New York Times Pocket MBA Series Analyzing Financial Statements
Handbook of Modern Finance Bond Analysis
financial statements
F1 Format of financial statements
Class 9 Accounting and financial statement vocabulary
więcej podobnych podstron