
___________________________________________________________________________________________
*Corresponding author: Email: lschua@ibd.utm.my;
British Journal of Medicine & Medical Research
1(4): 397-409, 2011
SCIENCEDOMAIN international
www.sciencedomain.org
Cytotoxicity of Aqueous and Ethanolic Extracts
of Ficus deltoidea on Human Ovarian
Carcinoma Cell Line
Nor Azurah Mat Akhir
1*
, Lee Suan Chua
1*
, Fadzilah Adibah Abdul Majid
2
and Mohamad Roji Sarmidi
1
1
Institute of Bioproduct Development, Universiti Teknologi Malaysia, 81310 UTM Skudai,
Johor, Malaysia.
2
Department of Bioprocess Engineering, Faculty of Chemical Engineering,
Universiti Teknologi Malaysia, 81310 UTM Skudai, Johor, Malaysia.
Received 25
th
July 2011
Accepted 16
th
August 2011
Online Ready 2
nd
September 2011
ABSTRACT
Aims: This study was to investigate the cytotoxicity of both plant extracts from Ficus
deltoidea (locally known as Mas Cotek), aqueous and ethanolic extracts on human
ovarian carcinoma cells using standard colometric MTT assay.
Study design: Cell based assay
Place and Duration of Study: Institute of Bioproduct Development and Department
of Bioprocess Engineering, Universiti Teknologi Malaysia, Johor Bahru, Malayisa
between January 2007 and December 2009.
Methodology: The biochemical responses of cells after plant sample treatment were
observed and have been reported through several assays such as trypan blue
exclusion assay for cell viability, analysis of glucose uptake and lactate release, cell
survival evaluation and genomic assay through DNA fragmentation.
Results: Both aqueous and ethanolic extracts of the plant sample gave IC
50
value of
224.39 + 6.24 µg/ml and 143.03 ± 20.21 µg/ml, respectively. The detachment
capability of the plant aqueous extract was observed in the cell viability assays. DNA
fragmentation was not observed in the aqueous extract, but in ethanolic extract (1000
µ
g/ml). The DNA was fragmented around 200 Kbp. Morphological observation was
carried out and apoptosis body was observed at 1000 µg/ml of both extract.
Conclusion: A2780 cancer cells behaved differently on cell growth profile upon
Research Article

British Journal of Medicine & Medical Research, 1(4): 397-409, 2011
398
treating with different concentrations of the aquoues and ethanolic extracts of F.
deltoidea. Even though both extracts could cause apoptosis at 1000 µg/ml, the
aqueous extract prompted to promote cell detachment, and the ethanolic tried to
inhibit cell proliferation through DNA fragmentation.
Keywords: Ficus deltoidea; human ovarian carcinoma cells; cytotoxicity; DNA fragmentation;
1. INTRODUCTION
Nowadays, herbal plants have been widely used for diseases treatment and immunological
enhancement. The increasing trend of herbal application in traditional herbal industry is
mainly due to numerous beneficial effects of natural sources compared to single synthetic
drug. Natural herbal medicines usually offer less undesirable side effect, more efficiency and
less toxic to consumers.
However, a very limited scientific data can be accessed regarding the beneficial effect of
herbal medicine, especially herbal plants from South East Asian countries. Therefore, the
effect of F. deltoidea extract on human ovarian carcinoma cells was studied as a preliminary
exploration. F. deltoidea or Mas Cotek as local name from the family of Moraceae was
chosen because this fig tree is widely used in cancer therapy traditionally in the Malay
women community.
Cancer is the major health problem worldwide. It claims more than six million people lives a
year. Ovarian cancer is the first leading cause of death from gynaecologic cancer besides
breast cancer. Usually, ovarian cancer patients have high response rate to initial
chemotherapy after cytoreductive surgery. Most of them will then develop resistant to
anticancer drug at the latter stage of treatment (Mi and Hong, 2003). The survival rate of
ovarian cancer patients is reported to be 30% only. Therefore, this study is crucial as a
stepping stone to better understanding to the behaviour of F. deltoidea extract in the
inhibition of human ovarian carcinoma cells before proceed to animal toxicology study.
In the present study, cell based assay is used to determine cell growth by measuring cell
viability and cell cytotoxicity after treated with plant extract. The glucose uptake and lactate
release were also monitored to measure the glycolysis rate and by-product formation from
cell growth. The result of the assay was then confirmed with the survival observation through
microscope. The cytotoxicity effect of plant extract was evaluated at gene level based on
genomic assay such as DNA fragmentation from gel electrophoresis.
2. MATERIALS AND METHODS
2.1 Plant Material and Chemicals
The plant material, F. deltoidea was bought from Malaysian Agriculture and Research
Development Institute (MARDI), Pahang. The specimen of the plant, MFD4 has been
deposited in MARDI (Musa and Lip, 2007).

British Journal of Medicine & Medical Research, 1(4): 397-409, 2011
399
3-(4,5-dimethylthaizol-2-yl)-2,5-diphenyl tetrazolium bromide (MTT) and dimethyl sulfoxide
(DMSO) were purchased from Sigma-Aldrich, USA. Phosphate buffer saline (PBS) was
prepared from the analytical grade of sodium chloride (Sigma, USA). The other chemicals
include potassium chloride (Sigma, USA), disodium hydrogen phosphate (Fluka,
Switzerland) and potassium dihydrogen phosphate (Sigma, USA), DNA purification kit
(Promega), Ethidium Bromide (Sigma, USA) and agarose powder (Promega).
2.2 Sample Preparation
The leaves of F. deltoidea were cut and dried in oven at 60
o
C before ground into powder.
The sample powder (100 g) was double-boiled in distilled water (1 L) at 60
o
C for 3 days. This
aqueous extract was then filtered and freeze-dried. The yield of the aqueous extract was
4.75 g.
Another 100 g of powdered sample was macerated in 95% denatured ethanol (1 L) for 24
hours at ambient temperature. The solution was filtered and the sample was macerated
again 95% denatured ethanol (1 L). The procedures were repeated for 3 times. A total
volume of 2.85 L solution was collected and dried using rotary evaporator (Buchi Rotavapor
R114, Switzerland) under reduced pressure. The yield of the ethanolic extract was 1.98 g.
2.3 Cell Line Culture
Human ovarian carcinoma cell line, A2780 was obtained from the European Collection of
Cell Culture (ECACC). Cells were cultured in RPMI 1640 media supplemented with 10%
foetal bovine serum, glutamine (2mM) and 1 % penicillin-streptomycin in static 75 cm
2
T-
Flask (GIBCO, USA). The cells were incubated in a humidified atmosphere with 5 % CO
2
at
37
o
C.
2.4 Cell Cytotoxicity Assay
Cells were plated in a 96-well-plate with 1 X 10
5
cells/well of concentration. The cells were
left to adhere for 48 hours before exposed to the plant extracts (0-1000 µg/ml) administered
in media containing 1% of FBS and returned to the incubator for 48 hrs. Subsequently, MTT
reagent (0.5 mg/mL in sterile PBS) was added directly to the wells. Cells were returned to
the incubator for 4 hrs. The formation of insoluble purple formazan from yellowish MTT by
enzymatic reduction was dissolved in DMSO after removal of supernatant. The optical
density of solution was measured at 590 nm using a microplate reader (ELx808, BioTek,
USA).
2.5 Cell Viability Assay
After treatment with the plant extracts, the cells were pooled together and the remaining
attached cells were detached from the culture plates by exposure to trypsin-EDTA. The
resultant cells were then stained with trypan blue at the concentration of 0.2%. Then, the
trypan blue-excluded viable cells were counted using a hemacytometer (FORTUNA®
GERMANY) under microscope.

British Journal of Medicine & Medical Research, 1(4): 397-409, 2011
400
2.6 Apoptosis Observation
The morphology of cells was monitored during cell growth after treatment with the plant
extract under an inverted microscope (Axiovert100, Zeitz, Germany). The cell morphology
was also evaluated by adding a mixture of acridine orange and ethidium bromide (2 µl)
before checking under the fluorescence microscope (BX51, Olympus, USA). Pictures were
taken at 400x magnification with excitation filter 480/30 nm, dichromatic mirror cut-on 505
nm LP and barrier filter 535/40 nm.
2.7 Analysis of Glucose Uptake
Glucose uptake analysis was carried out on supernatant collected after treatment, based on
enzymatic reaction of hexokinase to produce NADPH, which was then detected
photometrically in C111 Cobas analyzer (Roche, Switzerland).
2.8 Analysis of Lactate Release
The concentration of lactate in supernatant was analysed by Biochemistry Analyzer (YSI
27000, SELECT, USA). This analyser uses immobilised oxidase coated on the probe to
catalyse substrate and produce hydrogen peroxide, which was the electrochemically
detected as signal.
2.9 DNA Electrophoresis
The post-treatment cells were pooled together. The cells were palleted and washed twice
with cold PBS. Cell pallets were incubated in lysis buffer (1 ml) for 30 minutes at 60
o
C. The
clear lysates were separated by centrifugation and re-incubated with RNase (3µl) for 30 min
at 37
o
C. A mixture of solvents consisted of phenol, chloroform and isoamyl alcohol was
added and vigorously vortex for a few seconds before centrifugation. This procedure was
repeated twice. The layer of clear lysates was transferred into 100% ethanol (1 ml) and kept
at 4
o
C. The mixture was re-centrifuged to discard the supernatant. The remaining pallet was
washed with 70% ethanol and dried before dissolved in Tris-EDTA (TE) for DNA
electrophoresis.
2.10 Statistical Analysis
Statistical software, Design Expert 6.0.8 has been used to analyze the difference between
the control and the plant extracts with different concentrations to the cell line.
3. RESULTS AND DISCUSSION
3.1 Cell Growth Profile in MTT Assay
MTT assay is a rapid and high accuracy colorimetric approach that widely used to determine
cell growth and cell cytotoxicity, particularly in the development of new drug. It measures cell
membrane integrity by determining mitochondrial activity through enzymatic reaction on the
reduction of MTT to formazan.
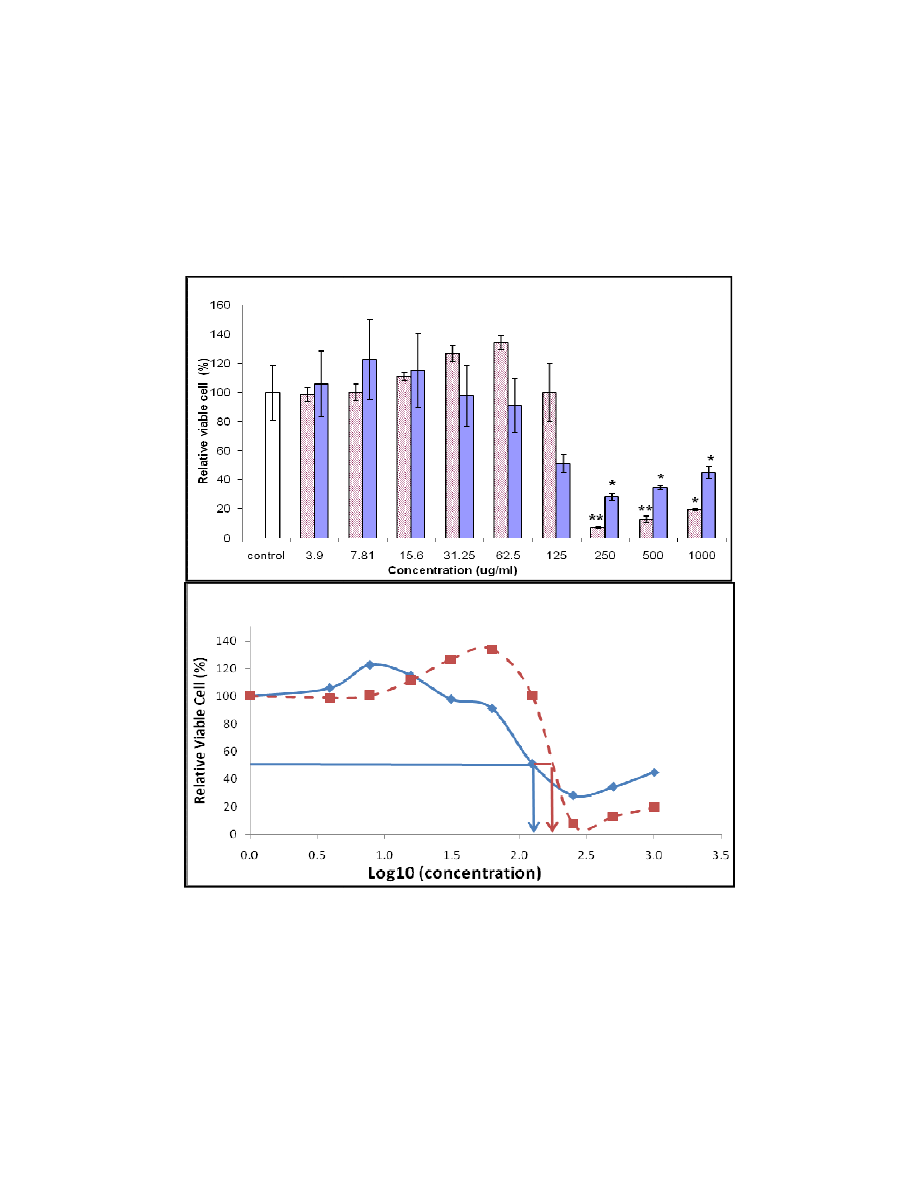
The profile of cell growth after treated with the plant extracts is presented in Fig. 1(a). From
this figure, it was found that both extracts only showed a significant reduction in the number
of viable cells at the concentration higher than 250
treatment with the ethanolic extract was more than the aqueous extract. Therefore, the IC
value was 224.39 and 143.03
(Fig.1 (b)).
Fig. 1. (a) Effect of various concentration of aqueous (solid bar) and ethanolic (line
bar) extracts of
All values are recorded based on the six replications of tests and
represent the confident level at 95% (P<0.05) and 99% (P<0.01), respectively.
(b) Cell cytotoxicity of aqueous (dash line) and ethanolic (solid line) extracts of
The IC
50
values are determined from th
(b)
(a)
British Journal of Medicine & Medical Research, 1(4):
The profile of cell growth after treated with the plant extracts is presented in Fig. 1(a). From
this figure, it was found that both extracts only showed a significant reduction in the number
cells at the concentration higher than 250 µg/ml. The reduction because of the
treatment with the ethanolic extract was more than the aqueous extract. Therefore, the IC
value was 224.39 and 143.03
µ
g/ml for the aqueous and ethanolic extract, respectivel
arious concentration of aqueous (solid bar) and ethanolic (line
bar) extracts of F. deltoidea on the cell viability in MTT assay.
All values are recorded based on the six replications of tests and analysed statistically, where * and **
represent the confident level at 95% (P<0.05) and 99% (P<0.01), respectively.
(b) Cell cytotoxicity of aqueous (dash line) and ethanolic (solid line) extracts of
F. deltoidea.
values are determined from the cytotoxicity curve at 50% of viable cells after 48 hours of plant
extract treatment.
397-409, 2011
401
The profile of cell growth after treated with the plant extracts is presented in Fig. 1(a). From
this figure, it was found that both extracts only showed a significant reduction in the number
g/ml. The reduction because of the
treatment with the ethanolic extract was more than the aqueous extract. Therefore, the IC
50
g/ml for the aqueous and ethanolic extract, respectively
arious concentration of aqueous (solid bar) and ethanolic (line
analysed statistically, where * and **
represent the confident level at 95% (P<0.05) and 99% (P<0.01), respectively.
(b) Cell cytotoxicity of aqueous (dash line) and ethanolic (solid line) extracts of
e cytotoxicity curve at 50% of viable cells after 48 hours of plant
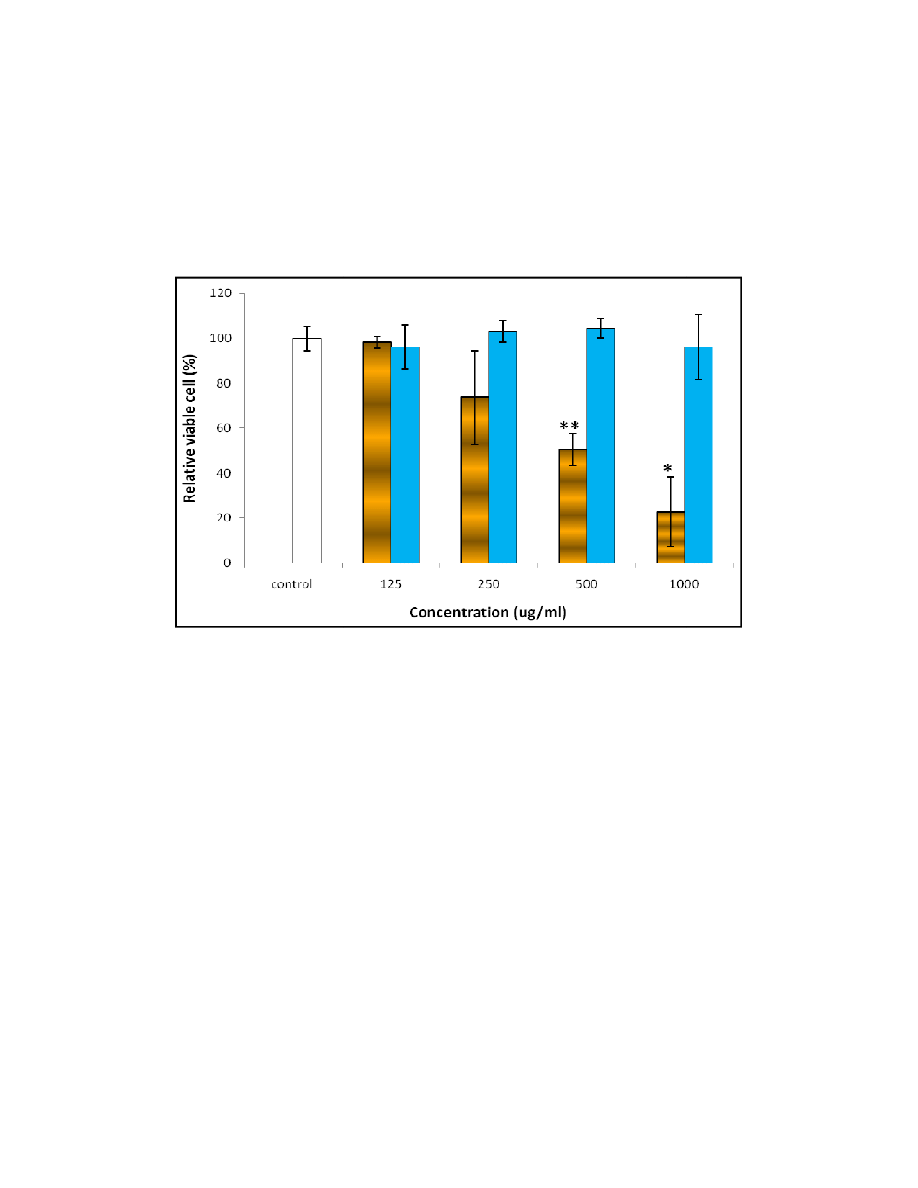
3.2 Cell Growth Determination Using Trypan Blue Exclusion Assay
Trypan blue exclusion assay was then carried out to further confirm the viable cell count at
the concentrations of extract ranging from 125 to 1000
from MTT assay. However, the results of trypan blue assay were contradictory to the results
of MTT assay as presented in Fig. 2.
Fig. 2. Effect of aqueous and ethano
from 125 to 1000 µg/ml on the cell viability in trypan blue exclusion assay.
All values are recorded based on the six replications of tests and analysed statistically, where * and **
represent the confident level at 95% (P<0.05) and 99% (P<0.01), respectively.
The contradiction could be explained by the detachment capability of aqueous extract of
deltoidea in cell culture media. The aqueous extracts might promote cell detachment by
interacting with intercellular junctions or extracellular matrix. The modification of cell surface
might be due to the neoplastic transformation
and Loh, 1992), change of glycoprotein in cell surface
molecules (Yang, 2004) which might be correlated to the invasion of metastasis in vivo.
Hynes (Hynes, 1978) reported that fibronectinor large extracellular transformation
(LETS) protein was lost from the surface of transformed fibr
intergrins. This loss might contribute to a decrease in cell
(Yamada, 1991) and lead to the reduction in cell attachment as well as cell spreading for
proliferation. Therefore, the aqueous e
independent-cell inducer.
The detachment caused the number of viable cell counted in MTT assay less than the actual
value. Only the attached cells w
detached cells were still alive because they could proliferate into normal cancerous cell, if
British Journal of Medicine & Medical Research, 1(4):
3.2 Cell Growth Determination Using Trypan Blue Exclusion Assay
Trypan blue exclusion assay was then carried out to further confirm the viable cell count at
rations of extract ranging from 125 to 1000 µg/ml based on the previous result
from MTT assay. However, the results of trypan blue assay were contradictory to the results
of MTT assay as presented in Fig. 2.
queous and ethanolic extracts of F. deltoidea at the concentration
from 125 to 1000 µg/ml on the cell viability in trypan blue exclusion assay.
All values are recorded based on the six replications of tests and analysed statistically, where * and **
represent the confident level at 95% (P<0.05) and 99% (P<0.01), respectively.
The contradiction could be explained by the detachment capability of aqueous extract of
in cell culture media. The aqueous extracts might promote cell detachment by
ith intercellular junctions or extracellular matrix. The modification of cell surface
might be due to the neoplastic transformation (Hynes, 1978), binding of plant lectins
, change of glycoprotein in cell surface (Bruyneel, 1990) and cell adhesion
which might be correlated to the invasion of metastasis in vivo.
reported that fibronectinor large extracellular transformation
(LETS) protein was lost from the surface of transformed fibroblast due to the alterations in
intergrins. This loss might contribute to a decrease in cell-cell and cell-substrate adhesion
and lead to the reduction in cell attachment as well as cell spreading for
proliferation. Therefore, the aqueous extract of F. deltoidea might be an anchorage
The detachment caused the number of viable cell counted in MTT assay less than the actual
value. Only the attached cells were considered as live cells in MTT assay. In fact, the
detached cells were still alive because they could proliferate into normal cancerous cell, if
397-409, 2011
402
Trypan blue exclusion assay was then carried out to further confirm the viable cell count at
g/ml based on the previous result
from MTT assay. However, the results of trypan blue assay were contradictory to the results
at the concentration
from 125 to 1000 µg/ml on the cell viability in trypan blue exclusion assay.
All values are recorded based on the six replications of tests and analysed statistically, where * and **
represent the confident level at 95% (P<0.05) and 99% (P<0.01), respectively.
The contradiction could be explained by the detachment capability of aqueous extract of F.
in cell culture media. The aqueous extracts might promote cell detachment by
ith intercellular junctions or extracellular matrix. The modification of cell surface
, binding of plant lectins (Laferte
cell adhesion
which might be correlated to the invasion of metastasis in vivo.
reported that fibronectinor large extracellular transformation-sensitive
oblast due to the alterations in
substrate adhesion
and lead to the reduction in cell attachment as well as cell spreading for
might be an anchorage-
The detachment caused the number of viable cell counted in MTT assay less than the actual
ere considered as live cells in MTT assay. In fact, the
detached cells were still alive because they could proliferate into normal cancerous cell, if

British Journal of Medicine & Medical Research, 1(4): 397-409, 2011
403
they were re-supplied with fresh medium. However, the viable cells in trypan blue exclusion
assay were counted based on the number of stained cells in the medium. Hence, the
number of viable cells either from the attached or the detached cells was taken into
consideration in cell counting.
The ethanolic extract treatment on the cells in trypan blue exclusion assay produced almost
similar results as in the MTT assay. The significant reduction in the number of viable cells
was increased from 250 µg/ml in the MTT assay (Fig. 1(a)) to 500 µg/ml in the trypan blue
exclusion assay (Fig. 2). The increase could be explained by the staining technique used in
cell counting for trypan blue exclusion assay. Anyhow, the ethanolic extract of F. deltoidea
has significant effect on cell growth inhibition compared to the aqueous extract.
3.3 Determination of Glucose Uptake and Lactate Release
The glucose consumption of the cells was monitored after plant extract treatment. The
ethanolic extract at 1000 µg/ml caused a significant reduction in glucose uptake as
presented in Fig. 3(a). This observation was in line with the cell viability assay, where the
number of viable cells was higher for the cells treated with aqueous extract compared to the
ethanolic extract. The uptake of glucose was determined because glucose consumption
plays a key role in cancer cell proliferation. According to Ortega (2009), glycolysis is the
‘selfish’ pathway used for cellular proliferation, providing both the metabolic precursors and
the energy required for biosynthesis, in the context of a plethora of substrates. The glucose
avidity of carcinomas is thus presented as the result of both the instalment of glycolysis for
cellular proliferation and of the impairment of mitochondrial activity in the cancer cell. At the
end, the repression of mitochondrial activity affords the cancer cell with a cell-death resistant
phenotype making them prone to malignant growth. The rate of glucose consumption by the
cells is dependent on the demand of carbon skeletons that used for the accretion of new
biological matter and/or on the energy provided in the form of ATP by mitochondrial oxidative
phosphorylation (Ortega, 2009). Somehow, the excessive consumption of glucose was
neither used for synthesis nor oxidation, but rather secreted as lactate (Elstrom, 2004).
Besides glucose uptake, the release of lactate was also monitored after 48 hours of
treatment in this study. This is because the content of lactate in the medium will affect the
cell growth profile. Schneider (1996) reported that the toxic action of lactate was probably
due to the acidic pH and osmolarity activity on the cells, particularly at high concentration
(>20 mM). In the presence of c-myc, the genes of glycolytic enzymes, namely lactate
dehydrogenase–A (LDHA) and GLUT1 would be transactivated to enhance both glucose
uptake and lactate production (Shim, 1997). LDHA was also reported could be upregulated
in several tumors and it is essential for c-myc-mediated transformation (Shim, 1997).
Actually, lactate was released as the by-product during cell growth. However, if the
concentration of lactate in the medium was too high, it would affect the cell growth.
Therefore, the content of lactate is crucial to monitor in order to avoid the side effect of
lactate to the growth process of cells. The lactate release profile showed that in fact, the
amount of lactate present in the medium did not significantly affect the cell growth (Fig. 3(b)).
Hence, the growth profile of the cells was mainly influenced by the plant extracts, but not
because of the content of lactate released into the medium.
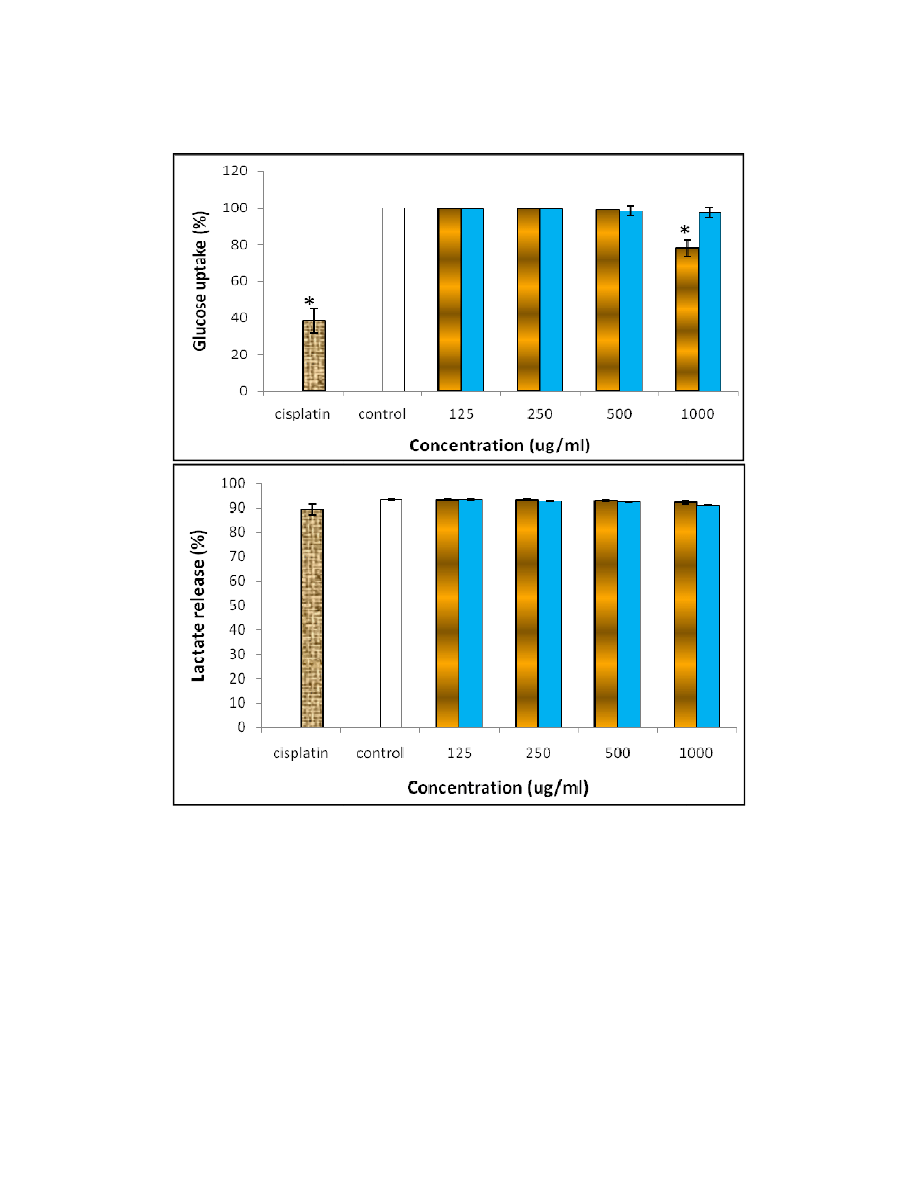
Fig. 3. (a) Glucose uptakes of cells after treated with the aqueous (solid bar) and
ethanolic (line bar) extracts of
from cisplatin (texture bar) and control cells (unfilled bar),
Where * represent the confiden
(b)
Lactate content of the cells after treated with the aqueous (solid bar) and
ethanolic (line bar) extracts of
from cisplatin (texture bar) and control cells (unfilled bar).
3.4 DNA Fragmentation o
The conventional agarose gel electrophoresis was performed on the cells treated with 1000
µ
g/ml of plant extract for 48 hours. The result showed that internucleosomal DNA cleavage
(b)
(a)
British Journal of Medicine & Medical Research, 1(4):
(a) Glucose uptakes of cells after treated with the aqueous (solid bar) and
ethanolic (line bar) extracts of F. deltoidea compared to the positive control result
from cisplatin (texture bar) and control cells (unfilled bar),
* represent the confident level at 95% (P<0.05).
Lactate content of the cells after treated with the aqueous (solid bar) and
ethanolic (line bar) extracts of F. deltoidea compared to the positive control result
from cisplatin (texture bar) and control cells (unfilled bar).
Fragmentation on the Treated Cells
The conventional agarose gel electrophoresis was performed on the cells treated with 1000
g/ml of plant extract for 48 hours. The result showed that internucleosomal DNA cleavage
397-409, 2011
404
(a) Glucose uptakes of cells after treated with the aqueous (solid bar) and
compared to the positive control result
Lactate content of the cells after treated with the aqueous (solid bar) and
compared to the positive control result
The conventional agarose gel electrophoresis was performed on the cells treated with 1000
g/ml of plant extract for 48 hours. The result showed that internucleosomal DNA cleavage

British Journal of Medicine & Medical Research, 1(4): 397-409, 2011
405
produced no ladder pattern for the aqueous extract treated cells (Fig. 4). The DNA might be
intact and no DNA fragmentation was detected.
According to Walker (1998), cells and untreated cells could produce a discrete band from
700 to 1000 kbp, which was unrelated to apoptotic DNA cleavage, but attributed to the
migration of any DNA fragment larger than 700 kbp (Walker, 1998). This indicates that the
DNA might be cleaved after treatment but in a large number of base pair. The explanation
also describes the presence of apoptotic bodies in the cell morphological study. This
observation was also happened to the positive control cells treated with cisplatin. An
extensive DNA fragmentation might be occurred which could not be detected in this study.
It was found that the ethanolic extract could cause DNA degradation at 1000 µg/ml. The
fragmented DNA was observed around 5 to 8 kbp, which was smaller than the typical
fragmentation of DNA at 20 to 300 kbp when entering early stage of apoptosis (Cohen,
1992). However, there was no fragmented DNA observed at the concentration less than
1000 µg/ml.
According to Wyllie (1980), the biochemical hallmark of apoptosis is cleavage of the nuclear
DNA into ~200 base pair multiples. This specific DNA cleavage is due to the activation of
endogenous endonuclease that cleaves at the exposed linker regions between
nucleosomes. It is worthy to highlight that necrosis was not happened in this study because
it associates with the random form of DNA cleavage (Darling, 2000).
3.5 Cell Morphology Observation
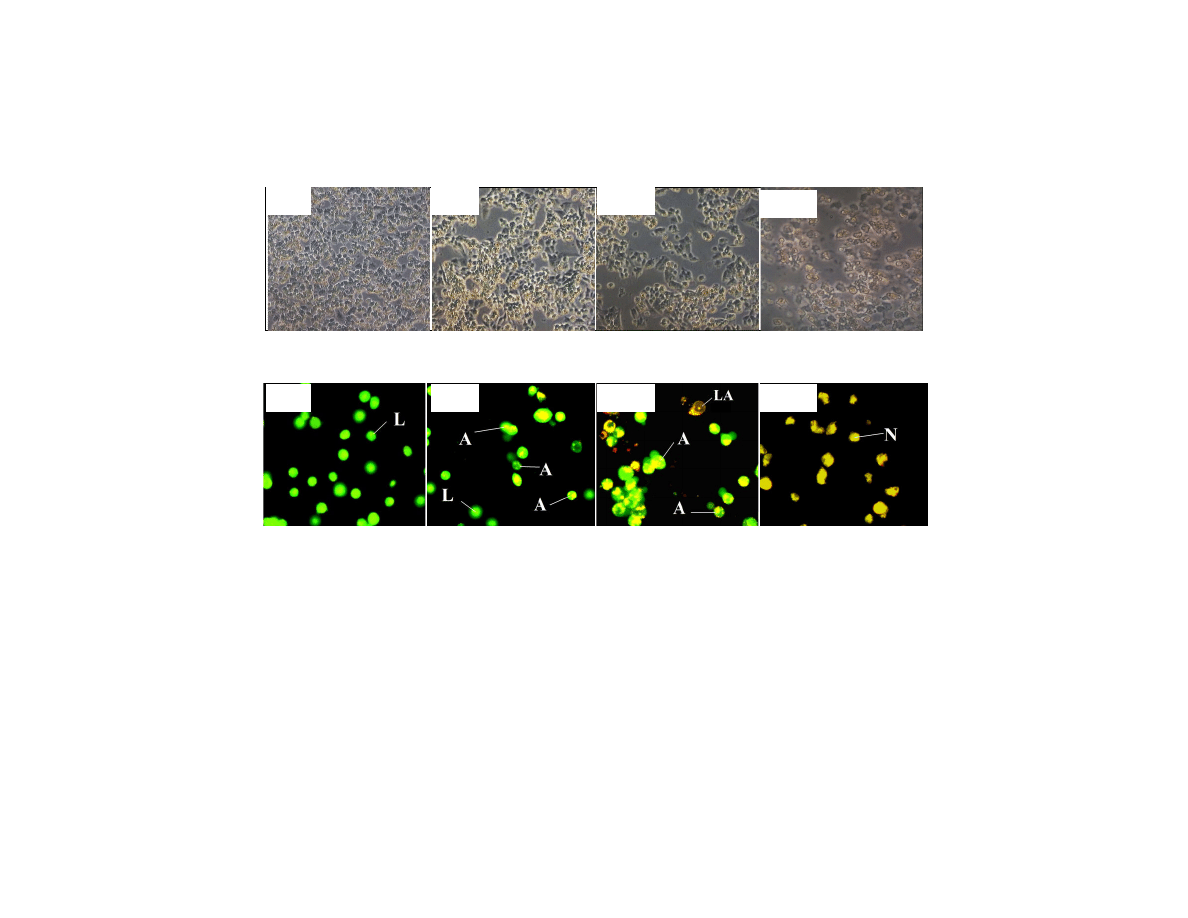
The morphology of the treated cells has been observed under an inverted microscope as
presented in Fig. 5(a). Cell detachment was observed for the aqueous extract treated cells.
They were clumped together on the surface of the medium. This phenomenon was also
observed for the ethanolic extract treated cells, but not significant as the aqueous extract
treated cells. There was a lot of empty space among the clumped cells. However, the cell
detachment was not occurred to the cells treated with cisplatin. Oppositely, the cells shrunk
at the bottom of the medium.
The cell morphology was also carried out using ethidium bromide and acridine orange
(EB/AO) as staining agent. The apoptotic cells are stained in orange, the live cells are
stained in green and the necrotic cells are stained in red as presented in Fig. 5(b). It was
found that only early stage of apoptosis was observed for the cells treated with aqueous
extract. Owing to that, there was no 180 bp of DNA laddering being observed in Fig. 4.
Although DNA fragmentation into oligonucleosomal ladders is the characteristic of apoptosis,
recent evidence indicates that not all cells undergo such extensive DNA fragmentation
(Cohen, 1992). In fact, the fragmentation of DNA into kilo base-size fragments appears to be
an early stage of apoptosis before preceding the complete digestion of DNA into multiples of
nucleosomal size fragments (Sun and Cohen, 1994). Besides, the early stage of apoptosis
on the cells treated with 1000 µg/ml of aqueous extract also did not reduce the number of
viable cell significantly in the trypan blue exclusion assay. This assay was applied as it is
easier than apoptosis staining method in cell counting.
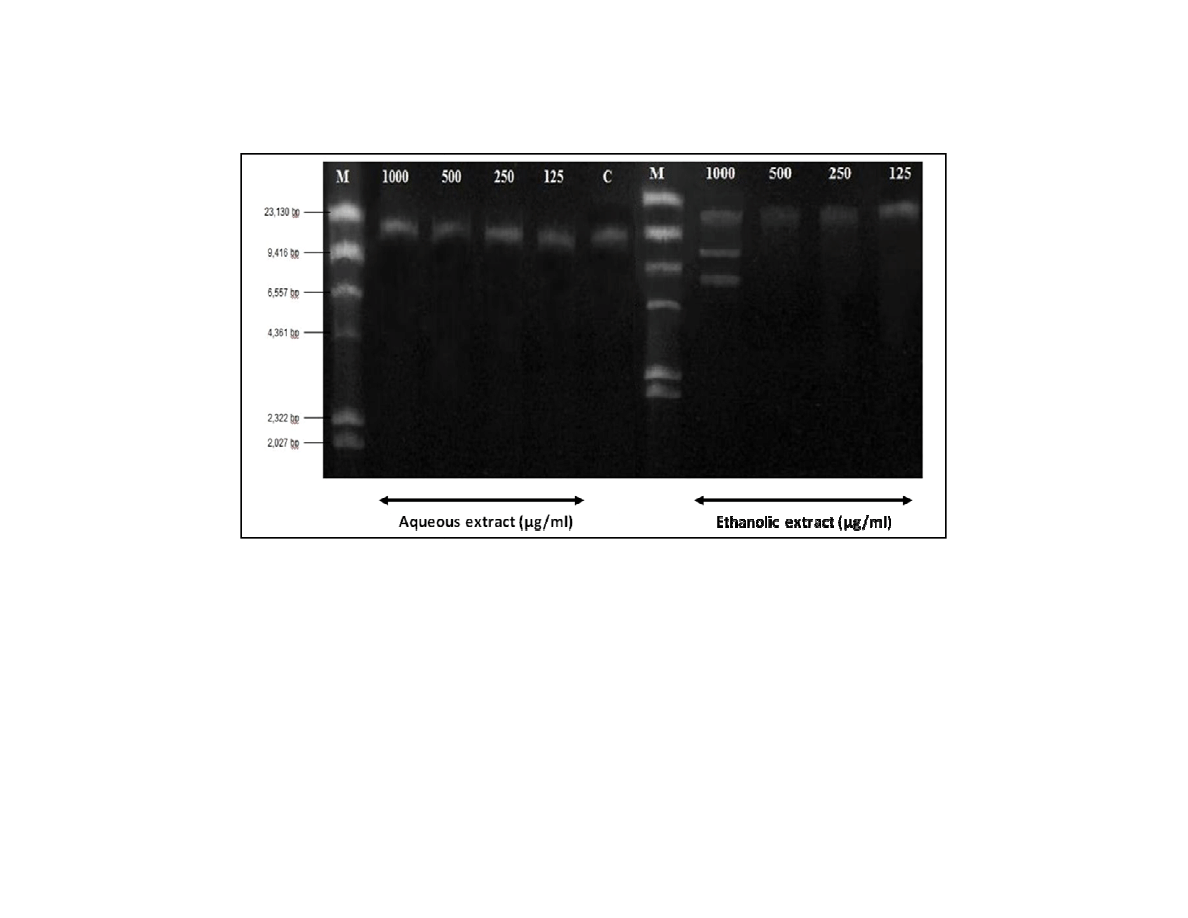
Fig. 4. DNA fragmentation after treatment with
British Journal of Medicine & Medical Research
DNA fragmentation after treatment with F. deltoidea extracts compared to the control (C) and marker (M) values
Research, 1(4): 397-409, 2011
406
extracts compared to the control (C) and marker (M) values
British Journal of Medicine & Medical Research, 1(4): 397-409, 2011
407
(a)
(b)
Fig. 5. (a) Comparison of cell morphology under inverted microscope for the control cells (i), cells treated with 1000 µ
µ
µ
µ
g/ml
of aqueous extract (ii), cells treated with 1000 µ
µ
µ
µ
g/ml of ethanolic extract (iii) and cells treated with 25 µ
µ
µ
µ
g/ml of cisplatin as
positive control (iv).
(b) Morphology of live cells (L), apoptotic cells (A) and necrotic cells (N) after stained with ethidium bromide and acridine
orange and observed under fluorescence microscope for the control cells (i), cells treated with 1000 µ
µ
µ
µ
g/ml of aqueous
extract (ii), cells treated with 1000 µ
µ
µ
µ
g/ml of ethanolic extract (iii) and cells treated with 25 µ
µ
µ
µ
g/ml of cisplatin as positive
control (iv).
(i)
(ii)
(iii)
(iv)
(i)
(ii)
(iii)
(iv)

British Journal of Medicine & Medical Research, 1(4): 397-409, 2011
408
The cells; the floating and adhered cells which was treated with the ethanolic extract were
blabbing. The cell membrane became out of the shape and the condensation of chromatin
was observed. In addition to the chromatin aggregation, the cells treated with ethanolic
extracts were also formed kidney shaped nuclei. It was also observed that the control cells
did not have apoptotic and necrotic cells. However, the positive control experiment showed
necrotic condition to the cells. They were shrinking and visible orange-stained cells with
kidney shaped nuclei were observed under fluorescent microscope. However, the
morphology of the cells did not resemble to the cells treated with cisplatin. They were
derived from empty cell membrane and then being phagocyte by other viable cells.
4. CONCLUSION
F. deltoidea is well known for its medicinal therapeutic value, especially in cancer treatment
among Malay practitioners. Therefore, the effect of F. deltoidea extracts on human ovarian
carcinoma cell line was studied by using cell based assay and supported by morphological
data. The findings of this study could be concluded as below.
-
Both aqueous and ethanolic extracts of the plant have different effects on cell
growth, DNA fragmentation and cell morphology due to the difference in their
phytochemical profiles.
-
The aqueous extract of the plant prompted to promote cell detachment, whereas the
ethanolic extract tried to stop cells from proliferation.
-
Both extracts could cause apoptosis at the concentration of 1000 µg/ml, but in
aqueous extract, the apoptosis effect was slower than the cells treated with
ethanolic extract.
-
DNA fragmentation was found in the cells treated with the ethanolic extract at
around 200 Kbp.
The crude extract of the plant should be further fractionized into at least semi-purified
sample in order to determine the type of phytochemicals inhibiting the growth of
cancerous cells. The cell detachment property of the aqueous extract should also be
studied as this phenomenon might be the cause of metastasis clinically.
REFERENCES
Bruyneel, E.A., Debray, H., de Mets, M., Mareel, M.M., Montreuil, J. (1990). Altered
glycosylation in Mardin-Darby canine kidney (MDCK) cells after transformation by
murine sarcoma virus. Clin. Exp. Metastasis, 8, 241-253.
Cohen, G.M., Sun, X.M., Snowden, R.T., Dinsdale, D., Skilleter, D.N. (1992). Key
morphological features of apoptosis may occur in the absence of internucleosomal
DNA fragmentation. Biochemical J., 286, 331-334.
Darling, J.L. (2000). Neuronal and glial tumours in vitro: An overview, in: Doyle, A., Griffiths,
J.B. (Eds.), Cell and tissue culture for medical research. John Wiley and Sons Ltd,
London, pp. 306 – 320.
Elstrom, R.L., Bauer, D.E., Buzzai, M., Karnauskas, R., Harris, M.H., Plas, D.R.,
Zhuang, H., Cinalli, R.M., Alavi, A., Rudin, C.M.
(2004).
Akt
stimulates
aerobic
glycolysis in cancer cells. Cancer Res., 64, 3892–3899.

British Journal of Medicine & Medical Research, 1(4): 397-409, 2011
409
Hynes, R.O. (1978). Role of cell-surface alterations in cell transformation: The importance of
proteases and cell surface proteins. Cell, 1, 147-156.
Laferte, S., Loh, L.C. (1992). Characterization of a family of structurally related glycoproteins
expressing beta 1-6-branched-aspragine-linked oligosaccharides in human colon
carcinoma cells. Biochem. J., 283, 192-201.
Mi, R., Hong, N. (2003). MDM2 sensitizes a human ovarian cancer cell line. Gynecol. Oncol.,
90, 238-244.
Musa, Y., Lip, J.M. (2007) Mas cotek, (Ficus deltoidea): A new potential medicinal plant in
Malaysia. Planta Med., 73(9), 616-619.
Ortega, A.D., Sanchez-Arago, M., Giner-Sanchez, D., Sanchez-Cenizo, L., Willers, I.,
Cuezva, J.M. (2009). Glucose avidity in carcinoma. Cancer Letters, 276, 125-135.
Schneider, M., Marison, I.W., Stockar, U. (1996). The importance of ammonia in mammalian
cell culture. J. Biotechnol., 46, 161-185.
Shim, H., Dolde, C., Lewis, B.C. (1997). C-Myc trasactivation of LDH-A: Implications for
tumor metabolism and growth. Proc Natl Acad Sci USA, 94(13), 6658-6663.
Sun, X., Cohen, G.M. (1994). Mg(2+)-dependent cleavage of DNA into kilobase pair
fragments is responsible for the initial degradation of DNA apoptosis. J. Biol. Chem.,
269, 14857-14860.
Walker, B.K., Lei, H., Kragg, S.S. (1998). A functional link between N-linked glycosilation
and apoptosis in Chines Hamster Ovary cells. Biochem. Biophys. Res. Comm., 250,
264-270.
Wyllie, A.H. (1980). Glucocorticoid induced thymocyte apoptosis is associated with
endogenous endonuclease activation. Nature, 284, 555-556.
Yamada, T., Placzek, M., Tanaka, H., Dodd, J., Jesel, T.M. (1991). Control of cell pattern in
the developing nervous system: Polarizing activity of the floor plate and notochord.
Cell, 64, 635-647.
Yang, J., Mani, S.A., Donaher, J.L., Ramaswamy, S., Itzkson, R.A., Come, C., Savagner, P.,
Gitelman, I., Richardson, A., Weinberg, R.A. (2004). Twist, a master regulator of
morphogenesis, plays an essential role in tumor metastasis. Cell, 117, 927-939.
_________________________________________________________________________
© 2011 Akhir et al.; This is an Open Access article distributed under the terms of the Creative Commons Attribution
License (
http://creativecommons.org/licenses/by/3.0
), which permits unrestricted use, distribution, and reproduction
in any medium, provided the original work is properly cited.
Wyszukiwarka
Podobne podstrony:
Effect of aqueous extract
In Vitro Anticancer Activity of Ethanolic Extract
Cytotoxic Properties of Some Medicinal Plant Extracts
Cytotoxicity of methanol extracts
Divergent effects of chaperone overexpression and ethanol supplementation on IBs formation
Fr hlich Stability of Pulegone and Thujone in Ethanolic Solution
Effect of Cistus laurifolius L leaf extracts and flavonoids on acetaminophen induced hepatotoxicity
Historia gry Heroes of Might and Magic
Overview of Exploration and Production
Blanchard European Unemployment The Evolution of Facts and Ideas
Magnetic Treatment of Water and its application to agriculture
ABC Of Arterial and Venous Disease
68 979 990 Increasing of Lifetime of Aluminium and Magnesium Pressure Die Casting Moulds by Arc Ion
ABC Of Occupational and Environmental Medicine
więcej podobnych podstron