
Policy Brief
Organisation for Economic Co-operation and Development
© OECD 2000
Jan
ua
ry
2000
Summary
Ten years after having embarked on an ambitious programme of
economic transformation, Poland has established itself as one the
most successful transition economies. Efforts to stabilise the econ-
omy, put the public finances in good order, conduct a sound mon-
etary policy, unleash market forces and implement structural
reforms on a broad front have been well rewarded. Having weath-
ered the economic slowdown in the wake of the Russian crisis, the
main challenge of the authorities is now to ensure that the incip-
ient recovery is transformed into lasting high growth. This will
require prudent monetary policies to reduce inflation, further
efforts to consolidate public finances and increase domestic sav-
ings, exchange rate flexibility to facilitate adjustment to external
shocks, and rapid progress to privatise state-owned enterprises so
as to maximise the economy-wide benefits of increased efficiency.
These, together with further structural reforms to stimulate com-
petition in product markets, reduce rigidities in labour markets
and improve the functioning of capital markets, are the best ways
to guarantee that Poland can stay on the fast track to join the
European Union while also strengthening market confidence in
Poland’s underlying fundamentals.
■
Economic Survey
of Poland, 1999-2000
This Policy Brief presents the assessment and recommendations of
the 1999-2000 OECD Economic Survey of Poland. The Economic
and Development Review Committee, which is made up of the
29 Member countries and the European Commission, is responsi-
ble for these Surveys.The starting point for the Survey is a draft
prepared by the Economics Department, which is then modified
following the Committee’s discussions and issued under the
responsibility of the Committee.
2 Policy Brief
Economic Survey of Poland, 1999-2000
What sets Poland apart?
Ten years after launching an ambi-
tious programme of economic trans-
formation, Poland is seen in many
respects as one of the most success-
ful economies in central and eastern
Europe. Unlike other countries,
P o lan d h a s n o t e nc o u n t e red a
mid-course depression, its currency
has not been subject to speculative
attacks, and the economy has slowed
down only moderately in the after-
math of the Russian crisis. The success
of Poland’s economic transformation
comes from a well-orchestrated com-
bination of sound financial policies
and perseverance with structural
reforms. The Survey of Poland just
published by the OECD reviews the
factors behind this achievement and
recommends a number of policy
actions to make it last. It provides an
overview of recent macro-economic
developments and a summary of the
short-term outlook, reviews mone-
tary and fiscal policies and discusses
budgetary problems that need to be
tackled urgently. The progress made
since the last Survey to address struc-
tural problems in the areas of unem-
p l o y m e n t , p en s i o n l i a b i l i t i e s ,
banking system restructuring, priva-
tisation, and enterprise restructuring
is summarised. Reform of the health-
care system is assessed. Finally, it
reviews tax policies, including the
courageous tax reform that was
recently partially adopted.
During the last four years, output
has expanded at robust rates of 6 to
7 per cent, inflation has declined
gradually and living standards have
improved. This achievement largely
reflects the dynamism of the private
sector, as opposed to the mediocre
results of the bloated state-owned
e n t e r p r is e s . D e regu la t i o n a n d
small-scale privatisation have led to
the emergence of a vibrant sector of
small and medium-sized enterprises.
More than two million entrepre-
neurs now operate in such sectors as
retail trade, construction, and light
manufacturing industry. They make
an important contribution to output
growth and job creation and form a
new class of consumers. Inward
foreign direct investment, the largest
in central and eastern Europe in
absolute dollar terms, is also an
important factor behind the success-
ful transformation. Foreign investors
initially focused on the domestic mar-
ket, which is the largest in the region,
and labour-intensive sectors, but they
are likely to step up exports to west-
ern markets and to be involved
increasingly in activities with a higher
technological content.
The economy decelerated sharply in
the wake of the Russian crisis in
August 1998, but started to rebound
in mid-1999 with a strong impulse
from domestic demand. After reach-
i n g a t r o u g h o f 1 . 5 p e r c e n t
year-on-year growth in the first
quarter of 1999, output growth
rebounded to 3 per cent in the sec-
ond and 4.9 per cent in the third,
suggesting that the economy is
poised for a return to robust growth.
Barring unexpected developments,
and despite some tightening of
macroeconomic policies, output
growth should gather momentum
and reach some 5 to 6 per cent in the
next two years. The expansion is
expected to be broadly-based. Pri-
vate consumption is projected to
grow unabated as Polish consumers
1989 = 100
1989 = 100
150
140
130
120
110
100
90
80
70
60
50
150
140
130
120
110
100
90
80
70
60
50
1970 1972 1974 1976 1978 1980 1982 1984 1986 1988 1990 1992 1994 1996 1998 2000
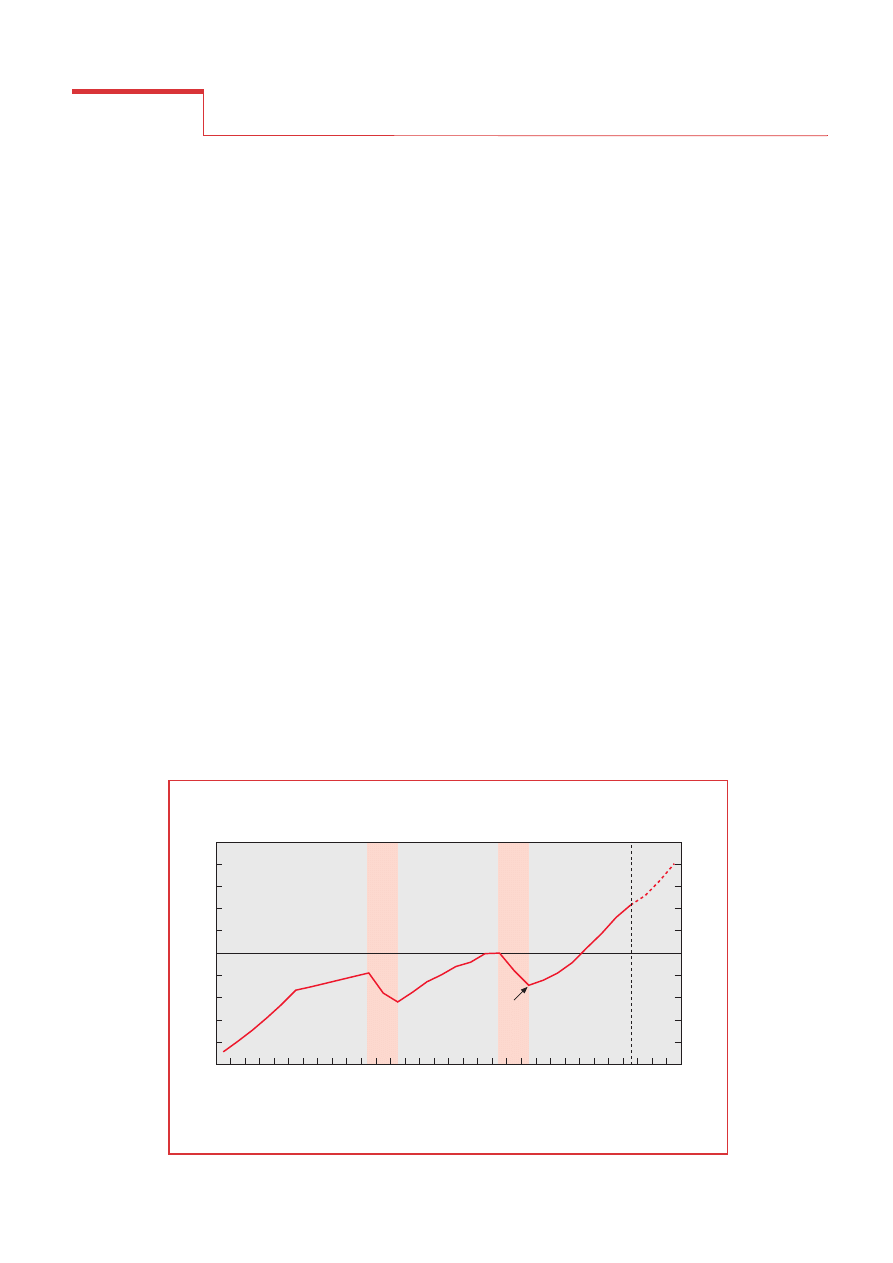
GDP at constant prices, 1970-2001
1
1.
For 1970, 1975 and 1980, World Bank estimates in
Working Paper No. 776 (1985); for 1981 to 1998, CSO Statistical
Yearbooks; for 1999 to 2001,
Economic Outlook.
Source:
Central Statistical Office, World Bank and OECD.
Initial trough linked
to launch of transition
programme
Large scale
Solidarity-driven
strikes
OECD
projections
1989 = 100
1989 = 100
150
140
130
120
110
100
90
80
70
60
50
150
140
130
120
110
100
90
80
70
60
50
1970 1972 1974 1976 1978 1980 1982 1984 1986 1988 1990 1992 1994 1996 1998 2000
GDP at constant prices, 1970-2001
1
1.
For 1970, 1975 and 1980, World Bank estimates in
Working Paper No. 776 (1985); for 1981 to 1998, CSO Statistical
Yearbooks; for 1999 to 2001,
Economic Outlook.
Source:
Central Statistical Office, World Bank and OECD.
Initial trough linked
to launch of transition
programme
Large scale
Solidarity-driven
strikes
OECD
projections

3 Policy Brief
Economic Survey of Poland, 1999-2000
enjoy strong increases in real dispos-
able incomes and continue to adjust
to an environment where consumer
goods are plentiful and new services
emerging. Business fixed investment
is also projected to grow at healthy
rates, as Polish enterprises continue
to modernise and foreign direct
investors bring in more capital. With
the expected revival of activity in
Europe, which now accounts for
two-thirds of Poland’s foreign trade,
e x p orts s h ou ld ret u rn t o d ou -
ble-digit growth rates. The projected
economic recovery should foster job
creation, but the number of unem-
ployed will decline only gradually in
the next two years as large groups of
new school leavers will join the
work force and increase the number
of job-seekers.
■
Source: Ministry of Finance, National Bank of Poland and OECD.
What challenges does
Poland face?
Sustaining this generally favourable
performance, however, requires
P o l a n d t o a d d re s s t w o m ac ro-
economic challenges, the first of
which is to keep inflation under con-
trol. In the recent past, the monetary
authorities have well established
their ability to dodge the risks of
inflation. They dealt with the over-
heating of the economy in 1997 and
the first half of 1998 with pre-emp-
tive interest rate hikes that led to a
soft-landing of the economy. They
dealt successfully with the contagion
effect of the Russian financial crisis,
with an aggressive easing of mone-
tary policy from September 1998
until January 1999. These timely
actions helped establish the credibil-
ity of the Monetary Policy Council
(MPC) of the National Bank of
Poland (NBP), the independent
body in charge of formulating mone-
tary policy. However, this has been
Summary of outcomes and projections for 1999-2001
Year-average real percentage change, unless noted
1996
1997
1998
1999
a
2000
a
2001
a
GDP
6.0
6.8
4.8
4.0
5.2
5.8
Level, in $ billion at market exchange rate
143
143
158
Household consumption
8.3
6.9
4.9
3.9
4.0
4.2
Government consumption
3.4
3.2
1.5
2.0
2.0
2.0
Gross fixed investment
19.7
21.7
14.5
10.0
11.0
11.5
Total domestic demand
9.7
9.3
6.5
5.1
5.6
5.8
Exports of goods and services
12.0
12.2
10.3
-2.0
6.5
10.0
Imports of goods and services
28.0
21.4
13.7
4.0
7.0
8.5
Unemployment (LFS, year-average,
in per cent of the labour force)
12.3
11.2
10.6
11.4
10.8
10.3
Employment (LFS, per cent increase)
1.2
1.4
1.2
0.0
1.5
1.3
Consumer price inflation (year-on-year, in per
cent)
19.9
14.9
11.8
7.0
7.1
5.4
General government (cash basis, in per cent of
GDP)
b
Revenue
c
42.6
42.1
41.0
41.1
41.2
...
Expenditure
45.7
44.9
43.5
44.6
43.9
...
Balance
3
-3.1
-2.9
-2.5
-3.5
-2.7
...
Broad money (nominal increase, end-year)
d
29.2
29.1
25.2
19.6
...
...
Nominal interest rate on 3 month Treasury bills
(annual average)
20.3
21.6
19.1
13.1
12.5
11.3
Current account balance
e
In $ billion
-3.3
-5.7
-6.9
-10.8
10.7
-10.8
In per cent of GDP
-2.3
-4.0
-4.4
-7.1
-6.7
-6.3
a.
OECD estimates and forecasts, except for budget estimates of 1999 and 2000 which are based on the authorities’ budget.
b.
Overdue taxes and arrears on government expenditures are excluded.
c.
Privatisation receipts are excluded from revenue and treated as deficit finance.
d.
Including foreign exchange deposits.
e.
Accruals-based balance of payments.
4 Policy Brief
Economic Survey of Poland, 1999-2000
threatened by the sudden accelera-
tion of the CPI above the inflation
o b j e c t i v e e s t a b l i s h e d f o r
December 1999. While this accelera-
tion has been due in part to excep-
tional factors-such as increases in
fuel and food prices, it is worrying in
that it takes place at the early stage of
the economic recovery and against
the background of rapid increases in
monetary aggregates driven by con-
sumer credit and loans to the general
government. The MPC was therefore
right to react by raising its interven-
tion rate by 100 basis points in
September 1999 and 250 basis points
in November 1999.
Over the medium term, Poland’s fur-
ther integration with the European
Union means that consumer price
inflation will need to fall to within
%
%
10
8
6
4
2
0
10
8
6
4
2
0
%
30
25
20
15
10
0
5
30
25
20
15
10
0
5
%
18
16
14
12
10
4
8
6
18
16
14
12
10
4
8
6
%
%
%
4
2
0
-2
-4
-8
-6
%
4
2
0
-2
-4
-8
-6
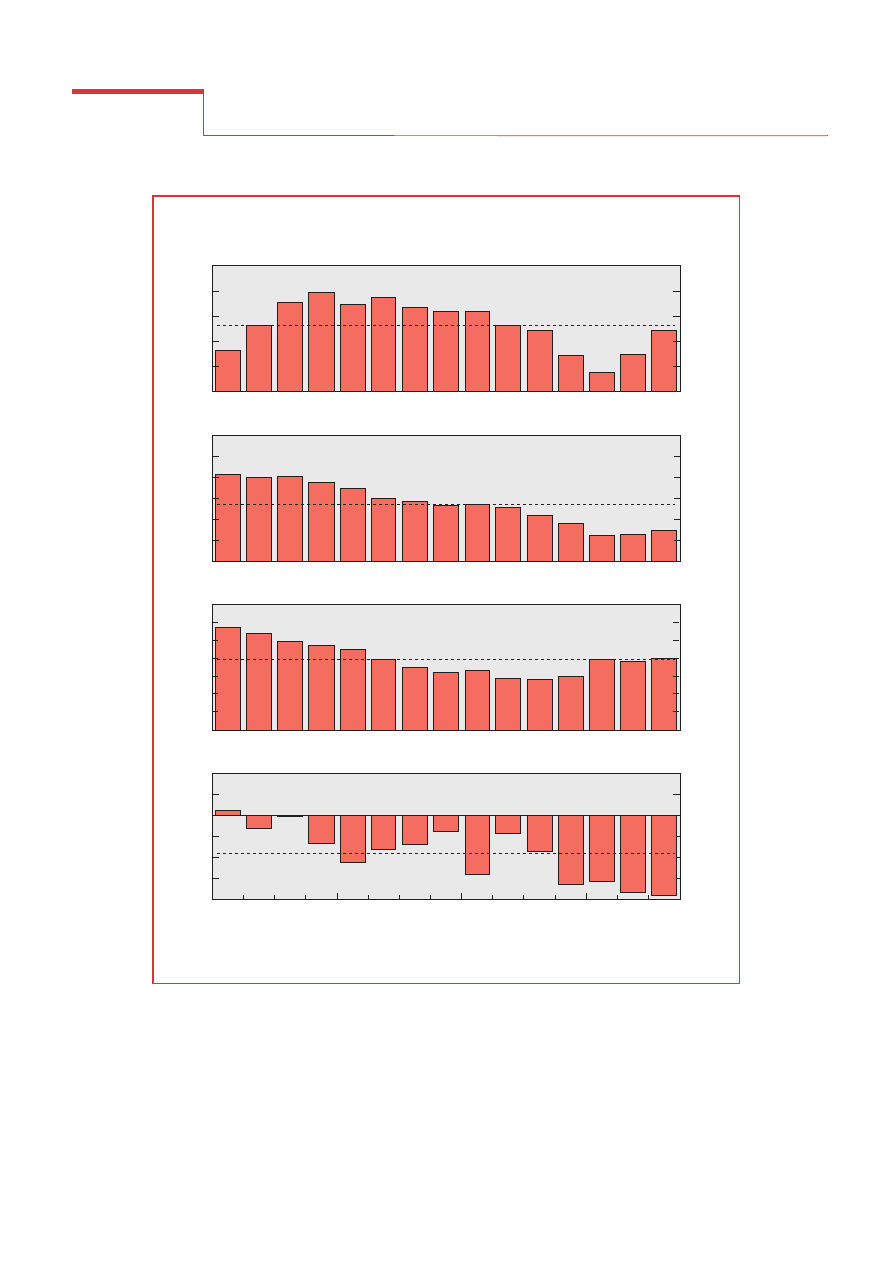
Key indicators
Source:
Central Statistical Office, National Bank of Poland and OECD.
A. Real GDP growth
(year-on-year)
C. Unemployment rate
(registered, in per cent of labour force)
D. Current account balance,
in per cent of GDP (cash basis)
1996
Q1
Q2
Q3
Q4
1997
Q1
Q2
Q3
Q4
1998
Q1
Q2
Q3
Q4
1999
Q1
Q2
Q3
B. Inflation
(CPI annual change year-on-year)
Period average = 5.3%
1996
Q1
Q2
Q3
Q4
1997
Q1
Q2
Q3
Q4
1998
Q1
Q2
Q3
Q4
Period average = 13.6%
1996
Q1
Q2
Q3
Q4
1997
Q1
Q2
Q3
Q4
1998
Q1
Q2
Q3
Q4
Period average = 11.9%
1996
Q1
Q2
Q3
Q4
1997
Q1
Q2
Q3
Q4
1998
Q1
Q2
Q3
Q4
1999
Q1
Q2
Q3
Period average = 3.6%
1999
Q1
Q2
Q3
1999
Q1
Q2
Q3
%
%
10
8
6
4
2
0
10
8
6
4
2
0
%
30
25
20
15
10
0
5
30
25
20
15
10
0
5
%
18
16
14
12
10
4
8
6
18
16
14
12
10
4
8
6
%
%
%
4
2
0
-2
-4
-8
-6
%
4
2
0
-2
-4
-8
-6
Key indicators
Source:
Central Statistical Office, National Bank of Poland and OECD.
A. Real GDP growth
(year-on-year)
C. Unemployment rate
(registered, in per cent of labour force)
D. Current account balance,
in per cent of GDP (cash basis)
1996
Q1
Q2
Q3
Q4
1997
Q1
Q2
Q3
Q4
1998
Q1
Q2
Q3
Q4
1999
Q1
Q2
Q3
B. Inflation
(CPI annual change year-on-year)
Period average = 5.3%
1996
Q1
Q2
Q3
Q4
1997
Q1
Q2
Q3
Q4
1998
Q1
Q2
Q3
Q4
Period average = 13.6%
1996
Q1
Q2
Q3
Q4
1997
Q1
Q2
Q3
Q4
1998
Q1
Q2
Q3
Q4
Period average = 11.9%
1996
Q1
Q2
Q3
Q4
1997
Q1
Q2
Q3
Q4
1998
Q1
Q2
Q3
Q4
1999
Q1
Q2
Q3
Period average = 3.6%
1999
Q1
Q2
Q3
1999
Q1
Q2
Q3

5 Policy Brief
Economic Survey of Poland, 1999-2000
the 0 to 2 per cent band considered
by the European Central Bank as
synonymous with price stability. To
achieve inflation convergence, the
MPC has introduced a new policy
framework based on direct inflation
targeting. Under this framework,
central banks typically announce
inflation targets to the public, and
then adjust their monetary policy
stance whenever inflation is pro-
jected to deviate from the objective.
Direct inflation targeting, once it
becomes credible, can have a power-
ful influence on inflationary expec-
t at i o n s . I n P o l a n d , w h e re t h e
tradition of backward-looking wage
indexation is deeply-rooted, this
may help set wages on the basis of
future rather than past inflation. The
National Bank has announced a cau-
tious medium-term inflation target
of below 4 per cent in 2003, fearing
that under-achieving the inflation
target would result in a loss of credi-
bility. The central bank was right in
being prudent in this regard, given
possible shocks. But there is a risk
that markets may misinterpret the
MPC position as being ready to trade
off inflation gains against other
objectives. Indeed, in explaining
some of its recent decisions it has
referred to concerns other than infla-
tion, notably the current account
deficit. The NBP should therefore
more expressly focus on achieving
its inflation targets and adopt prac-
tices which are common among cen-
tral banks that follow an inflation
targeting approach, such as giving
prominence to measures of core
in flatio n, publ ishi ng in flatio n
reports regularly and releasing to the
public both its inflation forecasts
and the MPC meeting minutes.
The second challenge that needs to
be addressed in order to achieve sus-
tained high growth is to ensure that
the large current account deficit con-
tinues to be financed. The deficit has
w i d en ed i n t h e l a st f e w y e ar s
because of higher imports, a reflec-
tion of the strong domestic demand.
Exports have also been growing, but
not fast enough to prevent a rising
trend in the trade deficit. The bal-
ance of services has also deterio-
rated. OECD projections are for the
current account deficit to reach 6 to
7 per cent of GDP in 1999 and
remain roughly at that level in the
near future. However, a large current
account deficit may be less a cause of
concern if it results from capital for-
mation. In that respect, it is reassur-
ing that the bulk of the trade deficit
is in the category of investment
goods, reflecting the ongoing trans-
formation of the industrial sector
which is assisted by strong inflows of
foreign direct investment. While
there is no specific level of the cur-
rent account deficit which is consid-
ered as unsustainable, a larger deficit
does mean a greater degree of expo-
sure to unexpected events. Thus, it is
important that financial markets
remain reassured that the authorities
are committed to appropriate macro-
economic and structural policies. In
this regard, it is particularly impor-
tant to maintain a business friendly
environment that is conductive to
profitable investments, a task, which
will require continued efforts to pur-
sue structural reforms. Increased
government savings can also con-
tribute importantly to the sustaina-
bility of the current account deficit,
reinforcing the need to improve pub-
lic finances over the medium term.
■
Is fiscal consolidation
on track?
After several years of deficit cutting
policies, fiscal consolidation has
been interrupted. In 1998, the total
deficit of the general government
came down only marginally from
2.9 per cent of GDP to 2.5 per cent
on a cash basis. In addition, sizeable
payment arrears were incurred,
including the non-payment of medi-
cal equipment and supplies by hos-
pitals. The 1999 budget envisaged a
tighter fiscal stance that would have
reduced the overall deficit to 2.3 per
cent of GDP. In the event, however,
deficits have emerged in the social
security funds, state enterprises have
incurred arrears on their social con-
tributions, and local governments
have increased their borrowing. As a
result, the general government deficit
reached 3.5 per cent of GDP in 1999.
This was one of the largest general
government deficits in the OECD
area. Fiscal consolidation should
therefore be resumed with greater
energy. The budget for 2000 sets a
general government budget deficit of
2.75 per cent of GDP. There are there-
fore good prospects that the budget
deficit will be reduced in 2000. None-
theless, several questions need to be
addressed to resolve the current budg-
etary difficulties. First, actions need to
be taken to stop the accumulation of
arrears by state enterprises on social
security contributions and taxes. If
loss-making state enterprises cannot
pay their social security contributions
and taxes, they should be restructured
more actively. The current tax and
social contribution arrears constitute a
disguised form of subsidy, which
reduces the transparency of budgetary
operations and provides adverse
incentives. Second, the tax reform
recently adopted needs to be imple-
mented effectively to assure a revenue
base that is consistent with the budget
assumptions. Finally, the authorities
should take steps to make the budget-
ary system more transparent, and
bring greater discipline over the extra-
budgetary funds. Recent decisions
have obscured the exact magnitude of
the general government deficit, in par-
ticular by hiding the deficit outside the
scope of the central government
b u d g e t . Tr a n s p a re n c y c a n b e
improved by providing regular reports
on the financial situation of the gen-

6 Policy Brief
Economic Survey of Poland, 1999-2000
eral government in an internationally
accepted accounting framework.
■
What about structural
measures?
Efforts to pursue fiscal consolidation
need to be underpinned by struc-
tural measures to improve the qual-
ity of public spending and reduce the
excessively high tax burden. In the
years prior to 1999, the budgetary
sphere was generally less touched by
the reform effort than the enterprise
sector. Few reforms were put in
place until recently to modernise the
central administration, decentralise
responsibilities to local government
and improve health care and educa-
tion services. Moreover, little was
done to adapt the social safety net to
the needs of a market economy, and
a wide-spread abuse of the system
made Poland one the most profligate
welfare states in the region. This has
resulted in an excessively high tax
burden, some crowding-out of the
enterprise sector on the capital mar-
ket, and the diversion of public
resources from areas where they
could boost potential growth, such
as public infrastructure. The author-
ities have begun to address these
problems, and a range of specific
structural reform efforts have been
i n i t i a t e d . A m e d i u m -s t r a t e g y
adopted recently by the Council of
Ministers provides a good frame-
work for furthering reforms.
An important structural reform
introduced in the recent past is the
devolution of responsibilities to
local governments. Decentralisation
brings decision-making closer to
those affected by public decisions
and in principle improves the quality
of public spending. Local govern-
ments have been divided into three
layers – communes (gminas), coun-
ties (poviats), and regions (voivod-
ships) – and each level has been
provided with well-defined areas of
responsibilities. Local governments,
however, have been given little
autonomy in tax policy decisions and
must rely on subsidies and transfers
from the central government to
finance their budgets. In due course,
increased autonomy should be given
to localities in tax decisions, so that
they are able to build their own tax
base over time. At the same time,
adequate safeguards, such as a
“golden rule” requiring that borrow-
ing be authorised only to finance
investment or some form of “inter-
nal stability part”, will be needed to
prevent local governments from run-
ning excessive deficits. The formulae
for allocating tax revenues to local
and regional governments are largely
based on their shares in generating
total taxes without significant redis-
tribution. In order to reduce income
gaps between regions, a system of
equalisation funds has been intro-
duced, which nonetheless appears to
leave significant gaps in income dis-
tribution across regions. More may
therefore need to be done to level the
playing field.
A carefully designed and compre-
hensive reform of the old-age pen-
sion system was introduced in early
1999. The new pension system will
take many years to come into full
effect but will eventually put the sys-
tem on an actuarially sound footing
and ensure that pension liabilities
are fully financed. The new system is
based on defined contributions
which accumulate in individualised
accounts and consists of three pillars
t w o o f w h i c h a re c o m pu l s o r y.
Returns on first pillar contributions
are indexed to 75 per cent of real
wage growth, while returns on the
second pillar depend on the per-
formance of investment funds. There
have been some "teething" problems
in the transition to the new pension
system, but these are likely to be
resolved over time without long-last-
ing damage. On the other hand, deci-
sions need to be taken to reduce the
abuse of disability and sickness pen-
sions, which are the most generous in
the region, and to reduce early-retire-
ment privileges in the old system
which still applies to those born
before 1 January 1949. Without such
decisions, the overall pension system
will continue to rely on state subsi-
dies and payroll taxes will remain
excessively high, thereby discourag-
ing work in the formal economy.
■
And tax reform?
Tax reform should also play an
important role in consolidating pub-
lic finances and boosting potential
growth. The Polish tax system has
some commendable features, in par-
ticular a capacity to generate strong
revenue on a continuous basis. This
has allowed the government to
finance public expenditure in full,
including in the social area, reduce
t h e b u d g e t d e f i c i t , a n d a v o i d
recourse to excessive borrowing.
Nonetheless, the system also had
less desirable features and, as it
stood, could have hampered growth
i n th e f ut u re a n d c o m e un d er
increased criticism both domesti-
cally and internationally. These fea-
tures included excessively high
personal income tax rates, which
represent disincentives to work, a
vast array of tax exemptions and
allowances, which reduce tax reve-
nue and disproportionately benefit
high-income taxpayers, and corpo-
rate income tax rates well above
those of other transition countries. A
reform of the system was therefore
unavoidable, not only in preparation
for European Union membership, but
also to improve the entrepreneurial
climate. After a year-long public
7 Policy Brief
Economic Survey of Poland, 1999-2000
debate, an overhaul of the tax system
was adopted in November 1999.
The reform cuts the tax rates on cor-
porate incomes, broadens the tax
base, and raises indirect taxes to EU
levels. The corporate income tax rate
will be cut in steps from 34 per cent
in 1999 to 22 per cent in 2004. Com-
panies will lose capital allowances
and investment-linked tax conces-
sions, but depreciation schedules will
be made more favourable. Finally,
VAT and excise taxation will be har-
monised with the EU Sixth Directive
on indirect taxes, implying higher
VAT rates on unprocessed foodstuffs,
municipal services, and construction
materials as well as higher excise tax
rates on tobacco and alcohol. The
reform is expected to have a positive
impact on budgetary revenue.
A reform of the personal income tax
which would have lowered the tax
rates and eliminated exemptions was
vetoed by the President of Poland. A
reform along these lines is still
needed. The government could seize
8
6
4
2
0
1991
1992
1993
1994
1995
1996
1997
50
45
40
35
30
25
20
15
10
5
0
1993
1994
1995
1996
1997
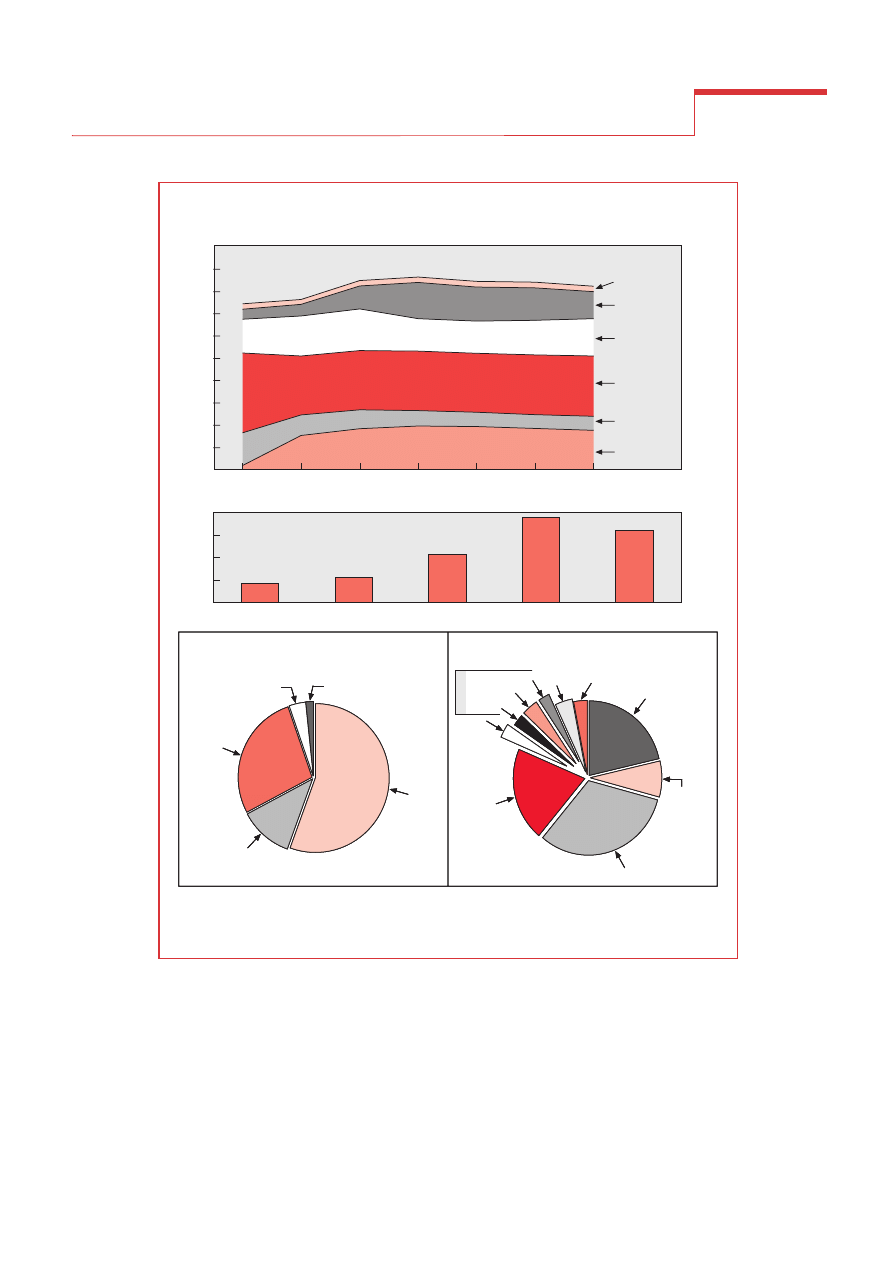
Key features of the tax system
1.
Per cent of GDP. Including privatisation receipts.
2.
Excluding transfers.
3.
Mainly ZUS, FUS and Labour fund.
Source:
Ministry of Finance; OECD, Revenue Statistics of OECD Members.
General government revenue by category
Other taxes
% of GDP
Other taxes on
consumption
goods (excise)
Taxes
on general
consumption
(VAT)
Social security
contributions
Taxes on
corporate
income
Taxes on
personal
income
Total deductions from personal income
Zl billion
Tax revenue by level of government
1
1999 (projection)
State extra-
budgetary
funds (0.7%)
Local extra-budgetary
funds (1.5%)
Extra-
budgetary
funds
(11.2%)
3
State
budget
(22.8%)
2
Local budget
(4.8%)
General government revenue by type of tax
1997
Property
Corporate
tax
VAT
Social security contributions
Personal
income tax
Spirits
Fuels
Tobacco
Custom
duties
Other
Excises
8
6
4
2
0
1991
1992
1993
1994
1995
1996
1997
50
45
40
35
30
25
20
15
10
5
0
1993
1994
1995
1996
1997
Key features of the tax system
1.
Per cent of GDP. Including privatisation receipts.
2.
Excluding transfers.
3.
Mainly ZUS, FUS and Labour fund.
Source:
Ministry of Finance; OECD, Revenue Statistics of OECD Members.
General government revenue by category
Other taxes
% of GDP
Other taxes on
consumption
goods (excise)
Taxes
on general
consumption
(VAT)
Social security
contributions
Taxes on
corporate
income
Taxes on
personal
income
Total deductions from personal income
Zl billion
Tax revenue by level of government
1
1999 (projection)
State extra-
budgetary
funds (0.7%)
Local extra-budgetary
funds (1.5%)
Extra-
budgetary
funds
(11.2%)
3
State
budget
(22.8%)
2
Local budget
(4.8%)
General government revenue by type of tax
1997
Property
Corporate
tax
VAT
Social security contributions
Personal
income tax
Spirits
Fuels
Tobacco
Custom
duties
Other
Excises

8 Policy Brief
Economic Survey of Poland, 1999-2000
the opportunity to submit to Parlia-
ment a proposal that would encom-
pass a number of new issues related
to the tax/benefit system. One such
issue relates to the labour tax wedge,
which is particularly high in Poland
and leads, together with the rigid
labour market, to a low employment
rate and an oversized underground
economy. Cutting payroll taxes will
be possible once social expenditure
will have been rationalised, including
by reducing abuse of disability pen-
sions, sickness leave and early-retire-
ment pensions. In addition, the state
should stop allowing the non-pay-
ment of social security contributions
b y l o s s -m a k i n g e n t e r p r i s e s .
Self-employed individuals should
also pay their contributions based on
their actual income, rather than on an
excessively low presumed income. If
payroll taxes cannot be lowered, there
are other options that can be consid-
ered to make work in the official
economy more rewarding, such as a
small income tax credit for low
income families with one working
adult, or a more generous flat income
deduction than currently.
In addition, a number of tax-related
issues not covered by the government
proposal would still need to be
addressed. First, as already noted, an
autonomous tax base needs to be
built for local governments, mainly
by putting property taxes on an
ad-valorem basis. Local property
taxes are currently based on the size
of premises and therefore need to be
kept very low to avoid imposing an
excessive burden on poor families.
In contrast, taxes based on the value
of properties, as registered in a new
system of cadaster, would constitute
a genuine local government tax base.
At the same time, the stiff tax of 5 per
cent on housing market transaction
needs to be cut in order to foster
mobility inside the country. Second,
in view of the future costs of bringing
environment regulations in line with
EU standards, Poland should intro-
duce charges on products that are
damaging for the environment, such
as coal, fertilisers, and leaded gaso-
line. Third, Poland should not at this
stage try to bring the entire agricul-
tural sector into the VAT tax net
because this would entail high compli-
ance costs for a large number of sub-
sistence farms, would distract tax
administration from more important
priorities, and would raise virtually no
new tax revenue. Instead, a threshold
based on the size of farm land plots
should be established, below which
farms would not be required to keep
books, register under the VAT system,
and pay taxes. Over time, the thresh-
old could be lowered towards the EU
level. A similar approach could be
adopted for the application of income
tax to the farming sector. Finally, the
various tax rates on capital incomes
should be unified in order to reduce
possible distortions in the allocation of
savings and in the way investments are
being financed.
■
Is healthcare reform
progressing?
Important steps have been taken in
the area of health care. The health-
care system is one of the few areas
where reform efforts have been lag-
ging behind others, probably reflect-
ing its complexity and the absence of
an obvious model to imitate. The
Polish system offers universal cover-
age at a reasonable level of spending.
But, like the command-and-control
system in the United Kingdom
before the major reform about a dec-
ade ago, the Polish system has suf-
fered from creeping inefficiencies
and absence of cost consciousness,
and public dissatisfaction has grown.
The latest reform introduced a
national insurance scheme operated
through regional health funds, split
the purchaser and provider func-
tions so as to promote competition
among health service providers and
assigned family doctors a role of
gate-keeper for access to higher lev-
els of care. While the basic ideas are
sound, the success of the reform
depends on certain key details being
handled properly. The lack of clarity
a b ou t t he s e d e tai ls is p e rha p s
responsible for the rather negative
public reception of the reform. One
of these is payment arrangements,
which, as international experience
shows, bear importantly on quality,
quantity and cost of services pro-
vided but are left for each regional
funds to determine. It is hoped that
in determining the payment arrange-
ments lessons from other countries’
experience will be drawn on with
due attention paid to the effects of
any given payment method on
incentives of both consumers and
provi der s of m edi cal ser vices.
Another key detail missing in the
reform is a clear operational defini-
tion of what constitutes a minimum
guaranteed package of benefits,
without which it is difficult to design
a contract between the funds and
service providers and to ensure
equity across regional funds. A com-
prehensive law on health care cur-
rently under consideration needs to
provide clarity on these issues.
A major concern from the point of
view of spending control is how to
impose a hard budget constraint on
regional health funds. Even though
they are required to balance revenue
and spending, there is currently no
mechanism to ensure that they meet
that requirement given that some of
th e payment arrangements are
bound to be fee-for-service based. A
stylised approach to enforce finan-
cial discipline is to introduce compe-
tition. The original reform proposal
envisaged allowing new funds to be
set up and all funds to compete for
members from 2001. But it is widely
accepted that where insurance

9 Policy Brief
Economic Survey of Poland, 1999-2000
premia do not reflect the risk of ill-
ness for each individual – which is
the case for social insurance – compe-
tition among insurers can only result
in a waste of resources in attracting
those with low risk. Hence, imple-
menting this proposal is not recom-
mended. Ways should be found to
make the management team of the
fund accountable for financial
results and consumer satisfaction,
for example through incentive-based
remuneration and sanctions in the
event of poor performance. Beyond
this, an overall spending cap could
be considered at the level of each
fund, which means writing into a
contract a provision for retroactive
repayment by service providers in
the event of spending overruns.
■
What is the status of
public enterprises?
In central and eastern Europe, the
fate of public finances is closely
linked to the reform of public enter-
prises, because loss-making state
companies are frequently a costly
burden on the budget. Great efforts
have been made to restructure state
enterprises in the last ten years. The
renowned problems of the shipyards
have now been resolved, and most
banks are by now restructured,
re-capitalised and privatised. Thanks
to these efforts, an important part of
the related budgetar y cost has
already been paid, and enterprise
restructuring is further ahead than in
many other transition countries.
Nonetheless, there are several sensi-
tive sectors where the state as an
owner has imposed insufficient
budget discipline, tolerated excessive
wage increases, and allowed compa-
nies to default on their taxes and
social security obligations. The
authorities have now drawn up plans
to complete enterprise restructuring
in the coal mines, the steel mills, the
railroads and the defence industry,
even though many such plans were
made in the past and their implemen-
tation has been slow at best. It is the
propitious time to implement ade-
quate restructuring plans as they can
be facilitated by the large privatisa-
tion proceeds expected in the near
future, notably from the sale of state
firms in the telecommunication and
transportation sectors. Further delays
would only increase the total cost for
the budget for these restructuring and
would continue to impose an undue
burden on profitable firms.
After liberalising prices and foreign
trade, Poland has stepped up its pri-
vatisation programme since 1998.
Entire sectors of the economy have
been restructured and transferred to
private hands. The private sector
now accounts for about 60-70 per
cent of value-added. Nearly 95 per
cent of the food-processing sector
was in private hands at the end of
April, a considerable increase from
just 5 per cent ten years ago. Recent
studies show that, following privati-
sation, Polish firms have typically
increased efficiency and output. The
recent acceleration in the privatisa-
tion programme therefore bodes well
for the future. In 1998, the largest
privatisation revenue came from the
sale of a stake in Poland’s national tel-
ecommunication operator TP SA. In
1999, privatisation efforts turned to
the banking system, with deals con-
cluded for Pekao Bank and Bank
Zachodni, which leaves only two big
state banks to be privatised. The
government is speeding up work to
complete privatisation in the insur-
ance sector (with the sale of the large
insurance company PZU), the energy
sector (with the sale of power genera-
tion and electricity distribution
firms), and transportation (with the
sale of Polish airline LOT). Despite
these significant privatisation efforts,
t h e s t a t e s t i l l o w n s s o m e
3 0 0 0 e n t e r p r i s e s , i n c l u d i n g
120-130 large companies (above
500 employees). State enterprises
dominate many sectors of the econ-
omy, from vodka distilleries to coal
mines. The authorities have formu-
lated a privatisation strategy until
2001, which calls for selling 70 per
cent of the state assets through vari-
ous channels. Stakes in state enter-
prises have also been set aside to
finance the partial restitution of prop-
e rt i e s t o o w n e r s e x p ro p r i a t e d
between 1944 and 1962. A draft bill
s u b m i t t e d t o p a r l i a m e n t i n
September 1999 proposes a legal
framework for this process. The rapid
settlement of previous owners’ claims
will clarify which assets can be priva-
tised and which must be restituted.
■
And labour market
conditions?
The labour market remains a dark
spot in the generally bright picture.
While the registered jobless rate
declined to 10 per cent at the end of
1998, this improvement has been
reversed by the recent economic
slowdown and Poland currently has
the highest unemployment rate
among the central European OECD
countries. Private sector estimates
put the NAIRU (the rate of unem-
ployment at which inflation stabi-
lises) at the relatively high level of
10 per cent, in view of the well-estab-
lished tradition of wage indexation
and the role played by the minimum
wage. The arrival of the second wave
of baby-boomers on the labour mar-
ket, the labour retrenchment in sec-
tors undergoing restructuring, and
the problem of hidden unemploy-
ment in the rural areas will prevent a
sharp decline of unemployment in
the near future. This calls for poli-
cies that would foster job creation.
The previous Survey provided a list
of recommendations within the
framework of the OECD Jobs Strat-
10 Policy Brief
Economic Survey of Poland, 1999-2000
egy to improve labour market condi-
tions. It was noted that the high tax
wedge has a pervasive impact on the
labour market, because it reduces
workers’ earnings and increases
labour costs. Steps were also recom-
mended to make the labour market
more flexible, to revisit employment
protection policies, and to restruc-
ture active labour market policies.
Only mixed progress has been made
to implement these recommenda-
tions. The pension fund reform intro-
duced this year goes in the direction
of making work pay more. It should
therefore encourage greater labour
market participation, eventually lead-
i n g t o w a g e m o d e r a t i o n a n d
improved labour market conditions.
Nonetheless, more needs to be done
to reduce payroll taxes. Measures
have also been taken to foster busi-
ness dynamism, and the reform of the
education system could lead in the
1994
%
18
17
16
15
14
13
12
11
10
9
1995
1996
1997
1998
1999
%
18
17
16
15
14
13
12
11
10
9
18
16
14
12
10
8
6
4
2
0
20
2.10
2.05
2.00
1.95
1.90
1.85
7.6
7.5
7.4
7.3
7.1
7.7
7.2
1996
1997
1998
1999
1996
1997
1998
1999
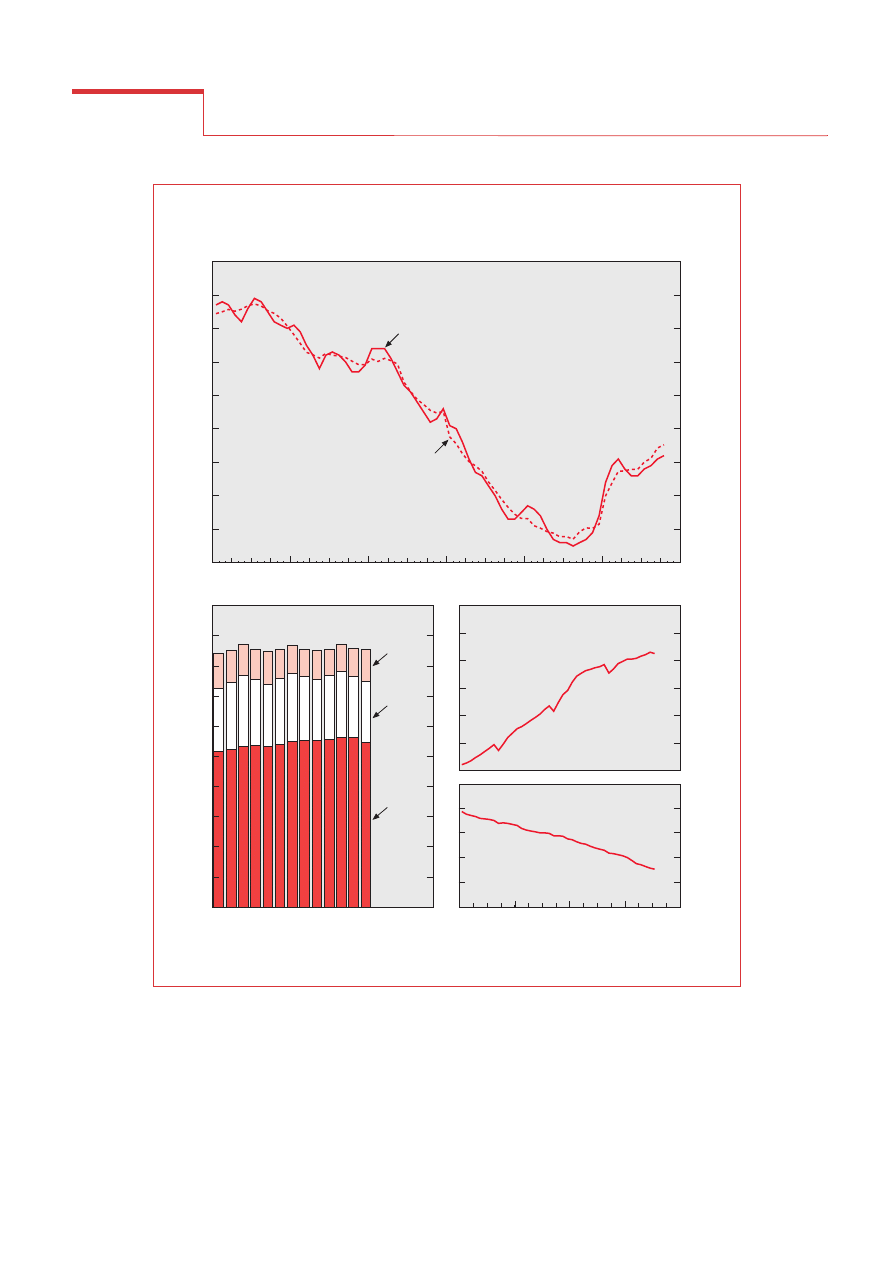
Labour force indicators
Source:
Central Statistical Office and OECD.
Registered unemployment
As per cent of the labour force
NSA
SA
Total labour force
Unemployed
Self-
Employed
Employed
Millions
Pensioners: retired workers
Pensioners: retired farmers
Millions
1994
%
18
17
16
15
14
13
12
11
10
9
1995
1996
1997
1998
1999
%
18
17
16
15
14
13
12
11
10
9
18
16
14
12
10
8
6
4
2
0
20
2.10
2.05
2.00
1.95
1.90
1.85
7.6
7.5
7.4
7.3
7.1
7.7
7.2
1996
1997
1998
1999
1996
1997
1998
1999
Labour force indicators
Source:
Central Statistical Office and OECD.
Registered unemployment
As per cent of the labour force
NSA
SA
Total labour force
Unemployed
Self-
Employed
Employed
Millions
Pensioners: retired workers
Pensioners: retired farmers
Millions

11 Policy Brief
Economic Survey of Poland, 1999-2000
long run to a better match of skills.
The authorities are considering a new
law on minimum wages, which would
differentiate it across regions to better
reflect differences in local labour mar-
kets, as recommended earlier by the
OECD. On the other hand, wages are
higher on average in the state sector,
including loss-making firms, than in
the private sector and greater wage dis-
cipline should be introduced in the
budgetary sphere and in state-owned
enterprises. Finally, active labour mar-
ket policies have been high on the
government’s policy agenda, and the
related spending has been increased.
However, much remains to be done to
increase evaluation and monitoring of
programmes so as to make them more
cost effective. In recognition of the
seriousness of labour market prob-
lems, the government has formulated
a “National strategy for employment
and human capital development” for
2000-2006, so as to implement the
OECD Jobs Strategy recommendation
more fully.
Education reform has just started to
be implemented. It aims at closing
the gap in secondary and university
education with the EU. The reform
aims at offering a better system of
education and vocational training to
the young people from underprivi-
leged social groups in order to
reduce poverty and high unemploy-
ment. It releases resources from pro-
grammes and institutions where
demographic changes reduce educa-
tion needs and redirects them to
achieve a shift from quantity to qual-
ity. Private education is also liberal-
ised under the reform. It is too early
to judge at this stage how effective
such reforms will be but, if success-
ful, they will also make an important
contribution to raising the quality of
public expenditure.
■
What about
preparations for EU
accession?
Poland has already reached a consider-
able degree of integration with the EU,
a s ref l e c t e d in t h e large s ha re
(two-thirds) of its trade with the
Union and the massive direct invest-
ment flows originating from European
countries. Indeed, Poland now records
a larger share of its trade with the EU
than either Greece or Italy. Active dis-
cussions are taking place on the condi-
tions of Poland’s accession. On the
authorities’ side, a target accession
date of 31 December 2002 has been
established. The government is work-
ing toward this target and has set up a
national programme for adoption of
the "acquis communautaire". With the
exception of unregulated sales of agri-
cultural land to non-residents, the
authorities have decided not to seek
long transition periods for the imple-
mentation of EU rules. This should
facilitate the negotiations. On the EU
side, no target date for accession has
been established, but significant
progress has been made in the screen-
ing process for compliance with EU
rules. The European Commission
already regards Poland as a function-
ing market economy, which should be
able to cope with competitive pressure
and market forces within the Union in
the medium term. The Commission
has notably praised Poland for the
efforts made in the areas of privatisa-
tion, banking system reform, and
macroeconomic stabilisation. In con-
trast, further progress is requested in
other areas including industrial
restructuring, control of state aide,
measures to prevent corruption and
preparation for the internal market
(certification, standardisation, public
procurement, and liberalisation of
capital movements). Progress is also
requested in environmental standards,
which will require costly investments
in air and water clean-up equipment.
Accession to the EU is a goal that
mobilises the entire country and cre-
ates a unique window of opportunity
for the determined implementation of
structural reforms accompanied by
strengthened macroeconomic policy
discipline. Signs of "accession fatigue"
are, however, emerging and Poland is
therefore right to aim at a swift integra-
tion.
An important medium-term target is
to fulfil the conditions required to
participate in the Economic and
Monetary Union (EMU). This will
require efforts in the fields of public
finance, inflation, and exchange rate
stability. The authorities envisage to
adopt the euro in 2006. For this pur-
pose, Poland would have to join the
new exchange rate mechanism
(ERM2) in 2004, one year after the
planned accession to the European
Union and peg the zloty against the
euro within the prevailing fluctuation
margins (currently ± 15 per cent). A
period of two years in the ERM2
without devaluing against another
currency, as well as fulfilling the other
convergence criteria, would be
required. Such a strategy of rapid
entry into EMU is not without risk. It
would entail a loss of autonomy in
monetary and exchange rate policy at
a time when more independence
might be necessary to mitigate asym-
metric shocks. Fiscal policy would
also be severely constrained at a time
when Poland would have to finance
the cost of fulfilling single-market
requirements. But, if successful, this
strategy would bring great benefits in
terms of credibility, financial disci-
p li n e a n d , a f t e r j o in in g E M U ,
long-lasting monetary stability.
■
For further information
Further information on the Survey can
be obtained from Patrick Lenain (e-
mail:
, tele-
phone: (33- 1) 45.24.88.07).
■

FRANCE
OECD Headquarters
2, rue André-Pascal
75775 PARIS Cedex 16
Tel: 33 (0) 1 45 24 81 81
Fax: 33 (0) 1 45 24 19 50
E-mail: sales@oecd.org
Internet: www.oecd.org
GERMANY
OECD Berlin Centre
Albrechtstrasse 9/10, 3. OG
10117 Berlin-Mitte
Tel: 49 30 288 8353
Fax: 49 30 288 83545
E-mail:
berlin.contact@oecd.org
Internet: www.oecd.org/
deutschland
JAPAN
OECD TOKYO Centre
Landic Akasaka Bldg
2-3-4 Akasaka, Minato-Ku
TOKYO 107
Tel: (81-3) 3586 2016
Fax: (81-3) 3584 7929
E-mail: center@oecdtokyo.org
Internet: www.oecdtokyo.org
MEXICO
OECD MEXICO Centre
Edificio Infotec,
Av. San Fernando No. 37
Col. Toriello Guerra
Tlalpan C.P.
14050 MEXICO D.F.
Tel: (525) 528 10 38
Fax: (525) 606 13 07
E-mail: ocde@rtn.net.mx
Internet: rtn.net.mx/ocde/
UNITED STATES
OECD WASHINGTON Center
2001 L Street N.W.,
Suite 650
WASHINGTON D.C. 20036-4922
Tel: (1-202) 785 6323
Fax: (1-202) 785 0350
E-mail:
washington.contact@oecd.org
Internet: www.oecdwash.org
Toll free: (1-800) 456 6323
80668
12 Policy Brief
Economic Survey of Poland, 1999-2000
www.oecd.org/publications/Pol_brief/
The OECD Policy Briefs are available on the OECD’s Web site
For further reading
■
OECD Economic Surveys:
Economic Surveys review the economies of Member countries and, from time to time,
selected non-Members. Approximately 18 Surveys are published each year. They are available individually or
by subscription. For more information, consult the Periodicals section of the OECD online Bookshop at
.
■
Additional Information
: More information about the work of the OECD Economics Department, including
information about other publications, data products and Working Papers available for downloading, can be
found on the Department’s Web site at
.
■
Economic Outlook No. 66
, December 1999
ISBN 92-64-16167-8, US$42, pp. 280.
A preliminary edition is published on the OECD Web site approximately one month prior to the publication of
the book:
.
Where to contact us?
OECD Publications can be securely purchased
from the OECD Online Bookshop
www.oecd.org/bookshop
The OECD Policy Briefs are prepared by the Public Affairs Division,
Public Affairs and Communications Directorate
.
They are published under the responsibility of the Secretary-General
Wyszukiwarka
Podobne podstrony:
Dz U 2000 Nr 28 poz 346 id 14 Nieznany
Dyrektywa Rady 2000 76 WE id 14 Nieznany
I2C bus specificaion 2000 id 20 Nieznany
BLUETOOTH chip 08 2000 140 id 6 Nieznany (2)
jonh hopkins pol 2000 id 228521 Nieznany
Abolicja podatkowa id 50334 Nieznany (2)
4 LIDER MENEDZER id 37733 Nieznany (2)
katechezy MB id 233498 Nieznany
metro sciaga id 296943 Nieznany
perf id 354744 Nieznany
interbase id 92028 Nieznany
Mbaku id 289860 Nieznany
Probiotyki antybiotyki id 66316 Nieznany
miedziowanie cz 2 id 113259 Nieznany
LTC1729 id 273494 Nieznany
D11B7AOver0400 id 130434 Nieznany
analiza ryzyka bio id 61320 Nieznany
więcej podobnych podstron