OECD FACTBOOK 2010 – © OECD 2010
162
SCIENCE AND TECHNOLOGY •
INFORMATION AND COMMUNICATIONS
SCIENCE AND TECHNOLOGY
Information and communications
COMPUTER, INTERNET AND TELECOMMUNICATION
Communication access and computers are increasingly
present in homes in OECD countries, both in countries that
already have high penetration rates and in those where
adoption has lagged.
Definition
For access to home computers, the table shows the number of
households that reported having at least one personal
computer in working order in their home. The second part of
the table shows the percentage of households who reported
that they had access to the Internet. In almost all cases this
access is via a personal computer either using a dial-up, ADSL
or cable broadband access.
The table also shows total communication access paths. For
OECD countries and China, these refer to the total number of
fixed lines (standard analogue access lines and ISDN lines),
DSL, Cable modem subscribers and mobile telephone
subscribers. For Brazil, India, the Russian Federation and South
Africa, total communication access paths are the sum of main
telephone lines in operation, ISDN lines, DSL and cable
modem subscribers and cellular mobile telephone subscribers.
Comparability
The OECD has addressed issues of international comparability
by developing a model survey on ICT use in households/by
individuals. The model survey uses modules addressing
different topics so that additional components can be added as
technologies reflecting usage practices and policy interests
change. The ICT access and use by households and individuals
model survey is available on the OECD website.
Statistics on ICT use by households may run into problems of
international comparability because of structural differences
in the composition of households. On the other hand,
statistics on ICT use by individuals may refer to people of
different ages, and age is an important determinant of ICT use.
Household- and person-based measures yield different figures
in terms of levels and growth rates of ICT use. Such differences
complicate international comparisons and make
benchmarking exercises based on a single indicator of Internet
access or use misleading, since country rankings change
according to the indicator used.
For telecommunications access, data for OECD countries are
collected according to agreed definitions and are highly
comparable. The data shown for the nine non-OECD countries
were partly collected according to the OECD definitions and
partly provided by the International Telecommunication
Union (ITU). The definition used by ITU is slightly narrower
than the one used by the OECD, although data reported for the
two sets of countries can be regarded as broadly comparable.
Source
s
• OECD (2009), OECD Science, Technology and Industry Scoreboard
2009, OECD, Paris.
Fur
ther information
An
alytical publications
• OECD (2008), OECD Information Technology Outlook 2008, OECD,
Paris.
• OECD (2009), OECD Communications Outlook 2009, OECD, Paris.
S
tatistical publications
• Eurostat (2005), Eurostat community survey on ICT usage in
households and by individuals, May 2005, Eurostat,
Luxemboug.
Web
sites
• OECD Science, Technology and Industry, www.oecd.org/sti.
• OECD Telecommunications and Internet Policy,
www.oecd.org/sti/telecom.
Overview
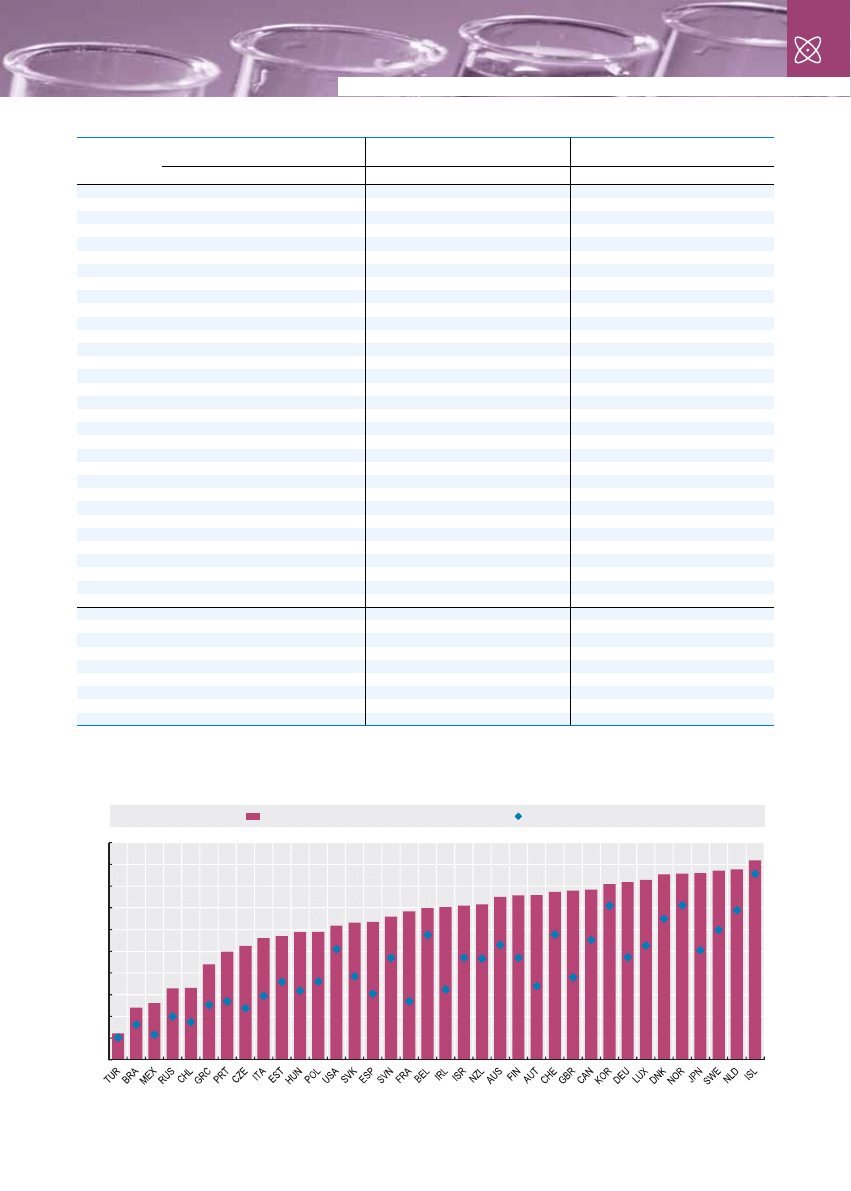
ICT penetration rates are highest in Iceland, the
Netherlands, Japan, Denmark, Sweden, Norway and
Korea, where 80% or more of households had access to a
home computer by 2007. On the other hand, shares in
Turkey, Mexico, Greece, the Czech Republic and Portugal
were below 50%. Between 2001 and 2007, the percentages
of households with access to a home computer increased
sharply in France, Japan, the United Kingdom and
Germany.
The picture with regard to Internet access is similar. In
Korea, Iceland, the Netherlands, Sweden, Denmark and
Norway, more than 75% of all households had Internet
access in 2007. In Mexico and Brazil, on the other hand,
less than one quarter of all households had Internet access
in the same year.
Access to telecommunications networks continues to
expand in all OECD countries. Access increased by 164% in
the OECD area as a whole in last decade, going from 59.5 to
156.7 telecommunications paths per 100 inhabitants.
Growth rates in telecommunication paths were ever
higher in China (which experienced growth in access
penetration of a 986% in the last decade), Mexico (654%),
the Russian Federation (521 %) and Estonia (341%).
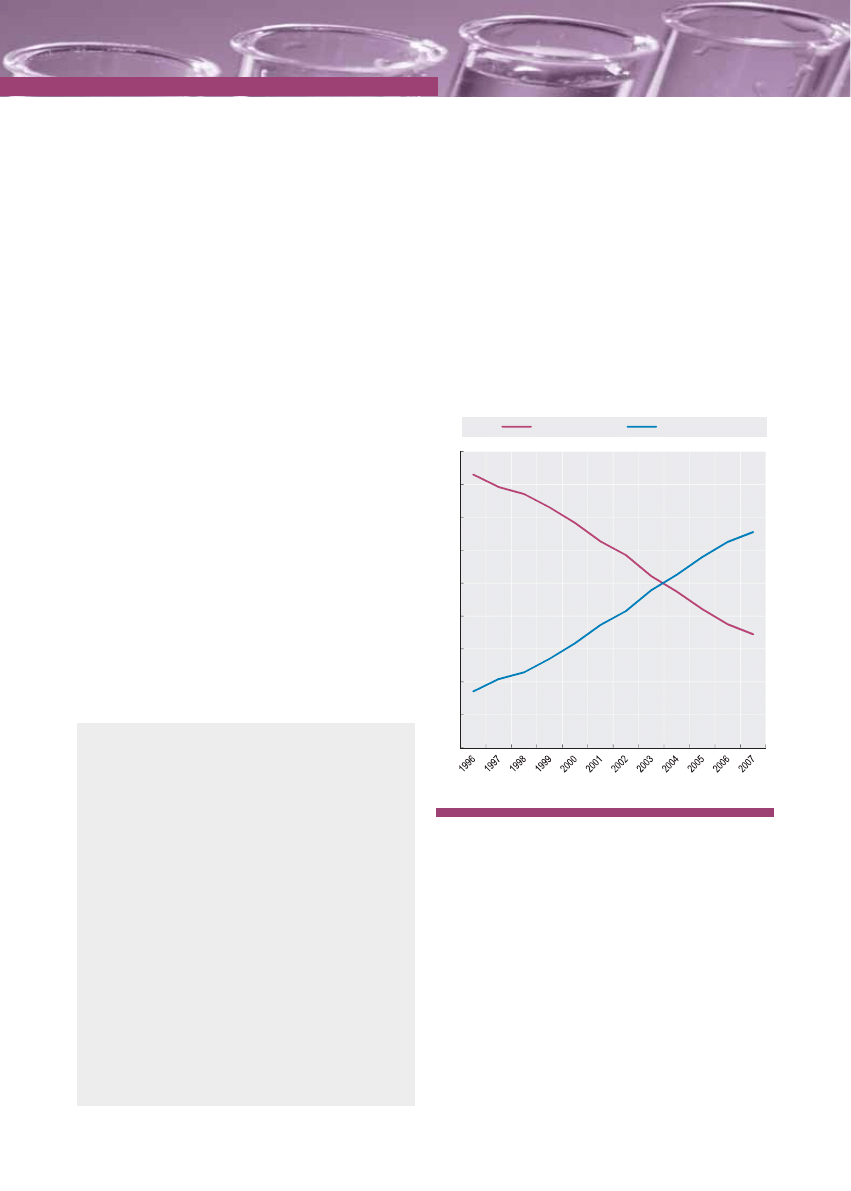
Mobile cellular subscribers
OECD and non-OECD share in the world total
1 2
http://dx.doi.org/10.1787/821246427106
0
10
20
30
40
50
60
70
80
90
OECD share
Non-OECD share
SCIENCE AND TECHNOLOGY •
INFORMATION AND COMMUNICATIONS
OECD FACTBOOK 2010 – © OECD 2010
163
COMPUTER, INTERNET AND TELECOMMUNICATION
Households with access to home computers, Internet and telephone
Percentage of households with access to a home computer
Percentage of households with access to the Internet
Number of telecommunication access paths
per 100 inhabitants
2000
2005
2007
2008
2000
2005
2007
2008
1995
2000
2005
2007
Australia
53.0
70.0
75.0
..
32.0
60.0
67.0
..
62.3
96.1
147.8
167.3
Austria
34.0
63.1
70.7
75.9
19.0
46.7
59.6
68.9
51.6
120.2
152.2
170.4
Belgium
..
..
67.2
70.0
..
50.2
60.2
63.6
48.3
100.0
150.5
159.5
Canada
55.2
72.0
78.4
..
42.6
64.3
72.7
..
68.8
96.7
138.3
153.1
Czech Republic
..
30.0
43.4
52.4
..
19.1
35.1
45.9
23.7
80.3
147.5
161.1
Denmark
65.0
83.8
83.0
85.5
46.0
74.9
78.1
81.9
77.2
124.4
174.6
190.8
Finland
47.0
64.0
74.0
75.8
30.0
54.1
68.8
72.4
75.5
131.7
168.3
179.2
France
27.0
..
61.6
68.4
11.9
..
49.2
62.3
57.8
97.9
136.1
152.0
Germany
47.3
69.9
78.6
81.8
16.4
61.6
70.7
74.9
53.7
107.2
156.4
187.0
Greece
..
32.6
40.2
44.0
..
21.7
25.4
31.0
51.1
107.1
163.3
202.9
Hungary
..
42.3
53.5
58.8
..
22.1
38.4
48.4
24.1
65.3
128.3
154.8
Iceland
..
89.3
89.1
91.9
..
84.4
83.7
87.7
67.2
134.4
179.5
183.3
Ireland
32.4
54.9
65.5
70.3
20.4
47.2
57.3
63.0
40.1
96.3
148.7
172.7
Italy
29.4
45.7
53.4
56.0
18.8
38.6
43.4
46.9
50.7
117.5
174.6
203.5
Japan
50.5
80.5
85.0
85.9
..
57.0
62.1
63.9
58.5
102.0
134.8
137.1
Korea
71.0
78.9
80.5
80.9
49.8
92.7
94.1
94.3
45.6
113.1
143.4
155.0
Luxembourg
..
74.5
80.0
82.8
..
64.6
74.6
80.1
62.7
125.7
222.6
222.1
Mexico
..
18.3
22.0
26.1
..
8.8
11.9
13.7
10.4
26.9
66.0
88.2
Netherlands
..
77.9
86.3
87.7
41.0
78.3
82.9
86.1
55.5
122.1
161.5
174.1
New Zealand
..
..
..
..
..
..
..
..
56.7
102.2
138.0
162.7
Norway
..
74.2
82.4
85.8
..
64.0
77.6
84.0
78.6
125.8
164.7
170.6
Poland
..
40.1
53.7
58.9
..
30.4
41.0
47.6
15.2
46.2
107.3
141.9
Portugal
27.0
42.5
48.3
49.8
8.0
31.5
39.6
46.0
39.2
102.3
152.7
170.7
Slovak Republic
..
46.7
55.4
63.2
..
23.0
46.1
58.3
21.1
55.4
108.8
140.0
Spain
30.4
54.6
60.4
63.6
..
35.5
44.6
51.0
40.7
103.7
154.8
171.1
Sweden
59.9
79.7
82.9
87.1
48.2
72.5
78.5
84.4
91.0
139.0
176.8
190.2
Switzerland
57.7
76.5
..
..
..
..
73.9
..
70.2
122.9
165.7
181.1
Turkey
..
12.2
..
..
6.9
7.7
..
..
23.7
49.6
89.0
115.9
United Kingdom
38.0
70.0
75.4
78.0
19.0
60.2
66.7
71.1
58.4
114.2
175.4
195.3
United States
51.0
..
..
..
41.5
..
61.7
..
71.4
115.3
154.3
167.5
EU27 total
..
..
64.0
67.9
..
48.4
54.1
60.4
..
..
..
..
OECD average
..
..
..
..
..
..
..
..
51.7
96.1
139.1
156.7
Brazil
..
16.9
24.0
..
..
12.9
17.0
..
9.2
31.6
73.0
..
Chile
17.5
..
..
..
8.6
..
..
..
..
44.1
94.2
112.1
China
..
..
..
..
..
..
..
..
..
11.4
58.5
73.0
Estonia
..
43.0
57.0
..
..
39.0
53.0
..
..
79.3
145.9
191.0
India
..
..
..
..
..
..
..
..
1.3
3.6
12.9
..
Israel
47.1
62.4
68.9
71.0
19.8
48.9
59.3
61.8
..
116.8
165.8
181.3
Russian Federation
..
26.0
..
..
..
25.0
..
..
16.9
24.2
112.7
..
Slovenia
..
61.0
66.0
..
..
48.0
58.0
..
..
..
194.0
188.6
South Africa
..
..
..
..
..
..
..
..
11.1
29.6
82.2
..
1 2
http://dx.doi.org/10.1787/825881036804
Households with access to home computers
As a percentage of all households
1 2
http://dx.doi.org/10.1787/821215531881
0
10
20
30
40
50
60
70
80
90
100
2008 or latest available year
2000 or first available year
Wyszukiwarka
Podobne podstrony:
Incorporating E Commerce, Internet and Telecommunications Security
drugs for youth via internet and the example of mephedrone tox lett 2011 j toxlet 2010 12 014
NIST Cloud Computing Synopsis and Recommendations sp800 146
Como começar a ganhar dinheiro com o seu computador e a Internet, Nauka języków, język hiszpański,
Algebraic Specification of Computer Viruses and Their Environments
C for Computer Science and Engineering 4e Solutions Manual; Vic Broquard (Broquard, 2006)
A1 3 CARVALHO, João M S (2013) The Crucial Role of Internal Communication Audit to Improve Internal
52 The media Internet and e mail
Computer Viruses and Their Control
the internet and social life
COMPUTER VIRUSES AND CIVIL LIABILITY A CONCEPTUAL FRAMEWORK
Computer viruses and electronic mail
Computing Machinery and Intelligence
Computer intrusions and attacks
Numerical estimation of the internal and external aerodynamic coefficients of a tunnel greenhouse st
Aaronson Quantum Computing Postselection and Probabilistic Polynomial Time
więcej podobnych podstron