www.kapabiosystems.com
Application Note
Gene Expression II
Relative Quantification
Version 1.09
Quick notes
Control variables that may introduce errors such as quan-
➤
➤
tity and quality of starting material.
Validate the stability of a panel of different housekeeping
➤
➤
(HK) genes for the cells under investigation, or in response
to experimental treatment.
Confirm consistent, high qPCR efficiencies (should be
➤
➤
95 - 105%) for all housekeeping genes and gene of interest
(GOI) by the C
T
slope method.
Use geNorm [5] to determine the most suitable stably
➤
➤
expressed housekeeping genes for use in the study.
Use KAPA SYBR® FAST qPCR Kits to ensure high amplifica-
➤
➤
tion efficiencies across all genes.
KAPA™ SYBR® FAST
qPCR Kits
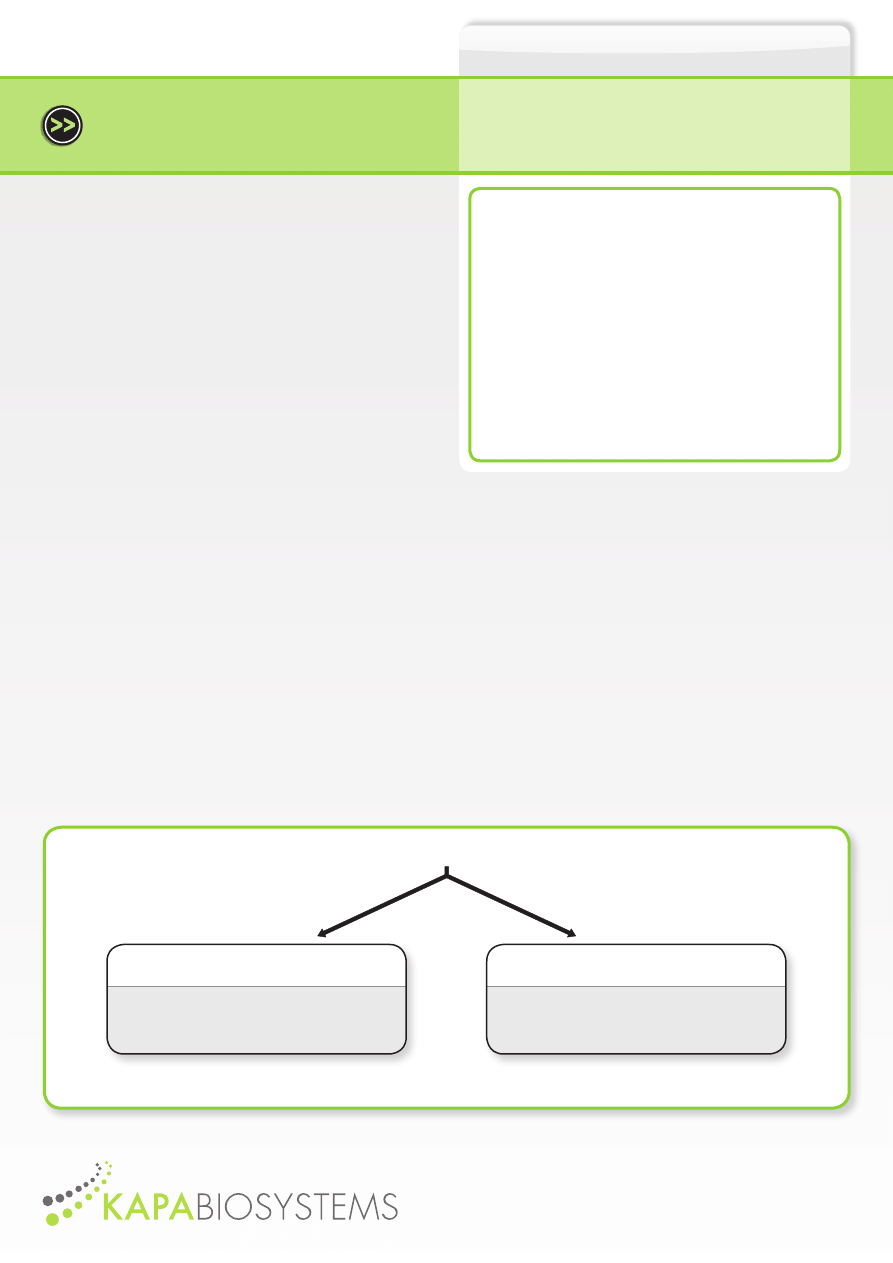
Relative Quantification Strategies
Recommended
Gold standard method for achieving accurate,
relative quantification results. A panel of housekeeping
genes is required to validate the most stable
internal control genes using geNorm.
Multiple housekeeping gene normalization
Not recommended
Can result in highly inconsistent results
unless the single gene was selected after
validation against a panel of housekeeping genes
for expression stability.
Single housekeeping gene normalization
1. Overview
Microarrays and quantitative real-time PCR (qPCR) are common
methods for investigating differential patterns of gene expression.
Relative quantification using qPCR measures the changes in steady-
state mRNA levels of a gene across multiple samples normalized to
a reference gene(s). In theory, the expression levels of the reference
gene (often referred to as the housekeeping gene) should remain
stable in the tissues or cells under investigation or in response to the
experimental treatment. In practice, there is considerable evidence
that housekeeping gene expression varies significantly [1 – 6]. Despite
this fact, many gene expression studies still make use of internal control
gene(s) without validation of the presumed stability of expression. The
geNorm algorithm developed by Vandosompele et al. (2002) [5] enables
rapid and accurate determination of the most stable reference genes
from a set of tested genes in a given cDNA sample and is considered
the gold standard for determining the most suitable set and number of
housekeeping genes to use for accurate relative quantification.
One challenge when using multiple housekeeping genes for relative quantification is the requirement for high amplification efficiencies
(95 - 105%) across all genes, regardless of amplicon length, complexity or GC content. KAPA SYBR® FAST qPCR Kits contain the first DNA
polymerase engineered specifically for SYBR® Green I-based qPCR through a process of molecular evolution. The KAPA SYBR® DNA Polymerase
exhibits improved speed, processivity and robustness, resulting in consistently high amplification efficiencies required for accurate relative
quantification using a panel of diverse housekeeping genes (see Application Note Gene Expression I: Housekeeping Genes).
The aim of this Application Note is to highlight the potential drawbacks of using single housekeeping genes in relative quantification analysis
using the ΔΔC
T
method. The multiple housekeeping gene approach using geNorm is presented as the preferred method against which relative
quantification results from different methods are compared. The benefits of using the novel KAPA SYBR® FAST qPCR Kit in the context of gene
expression analysis using multiple housekeeping genes are also highlighted.
2. Experimental Model and Typical Results
In this study, the expression levels of T-box factor 2 (Tbx2) in the human breast cancer cell line, MCF-7, were monitored at three different time points
(t = 0 h, t = 8 h, and 24 h) after treatment with a specific drug. To demonstrate the dramatic effect on relative quantification results using different
housekeeping genes either as single or multiple normalization control genes, ten commonly used housekeeping genes were selected. In an
effort to reduce the chances that genes might be co-regulated, special attention was given to selecting genes that belong to different functional
classes. Amplicon, primer and qPCR efficiency details for all primers used in this study can be found in the KAPA SYBR® FAST Application Note
Gene Expression I: Housekeeping Genes.
KAPA™ SYBR® FAST qPCR Kits
Application Note
Gene Expression II
Average replicate C
T
values for each gene at 100 ng/reaction
Tbx2 (GOI)
HMBS (HK1)
SDHA (HK2)
t = 0 h
19.81
19.54
17.47
t = 8 h
20.14
19.45
17.55
t = 24 h
20.08
19.41
16.59
Step 2:
◆➤
Use 100 ng cDNA/reaction C
T
replicate values for ΔC
T
calculation
◆➤
Select C
T
of each cDNA sample at 100 ng/reaction in triplicate for HK gene and GOI
Relative fold change in Tbx2 expression when two different HK genes are used
HMBS (most stable)
SDHA (least stable)
t = 0 h
1.00
1.00
t = 8 h
0.75
0.84
t = 24 h
0.76
0.45
Step 3:
◆➤
Use the ΔΔC
T
method for calculating relative quantification
◆➤
Relative fold change in gene expression = 2
-ΔΔC
T
◆➤
Where: ΔΔC
T
= ΔC
T time x
- ΔC
T time 0
, and ΔC
T
= (C
T GOI
- C
T HK
)
Step 1:
◆➤
Confirm qPCR efficiencies (should be 95 - 105%) for housekeeping (HK) gene and gene of interest (GOI)
◆➤
Perform five log
10
-fold dilutions of cDNA for each HK gene and GOI to determine PCR efficiency (100 ng - 10 pg/reaction)
35
40
5
30
25
20
15
10
1.6
1.5
0.0
0.2
0.1
0.4
0.3
0.6
0.5
0.8
0.7
1.0
0.9
1.2
1.1
1.4
1.3
N
or
m
. F
lo
ur
o.
Cycle
Threshold
Untreated
35
40
5
30
25
20
15
10
1.5
0.0
0.2
0.1
0.4
0.3
0.6
0.5
0.8
0.7
1.0
0.9
1.2
1.1
1.4
1.3
N
or
m
. F
lo
ur
o.
Cycle
Threshold
8 h treatment
Amplification curves for SDHA gene for each cDNA sample
35
40
5
30
25
20
15
10
1.6
1.5
0.0
0.2
0.1
0.4
0.3
0.6
0.5
0.8
0.7
1.0
0.9
1.2
1.1
1.4
1.3
N
or
m
. F
lo
ur
o.
Cycle
Threshold
24 h treatment
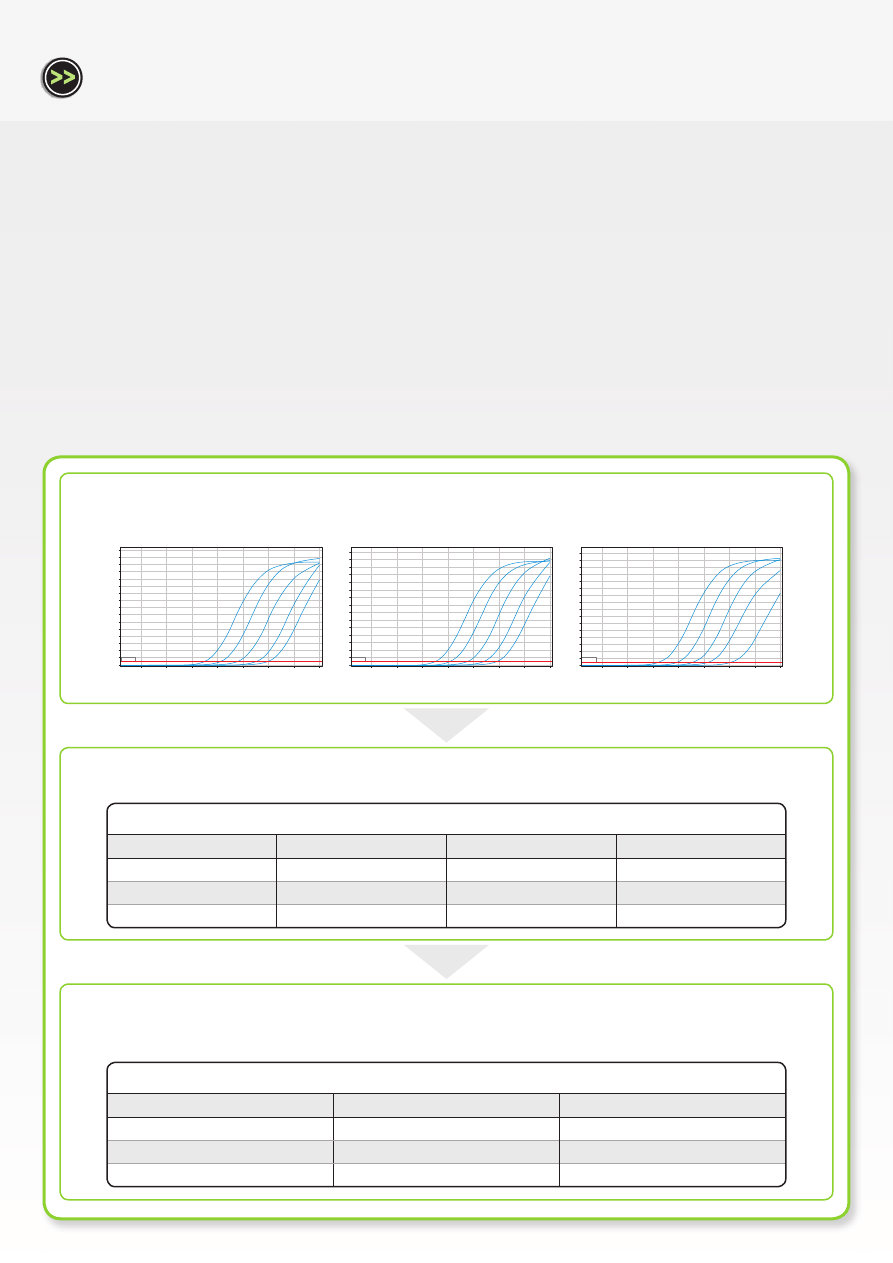
Two workflows were followed to illustrate the potential problems associated with performing relative gene expression analysis using single and
multiple housekeeping gene normalization methods, respectively.
In Workflow A, relative quantification results were compared using two different housekeeping genes. When the stable (as determined by
geNorm analysis) housekeeping gene, HMBS, was used for normalization, the relative expression levels of Tbx2 decreased from 1.00 to 0.75
to 0.76 at time points 0 h, 8 h and 24 h post-treatment, respectively. When the relatively unstable housekeeping gene, SDHA, was used for
normalization, the relative expression levels of Tbx2 decreased from 1.00 to 0.84 to 0.45 at time points 0 h, 8 h and 24 h post-treatment, respectively.
If these housekeeping genes had not been validated for expression stability, it would have been impossible to determine which of these two
results was accurate.
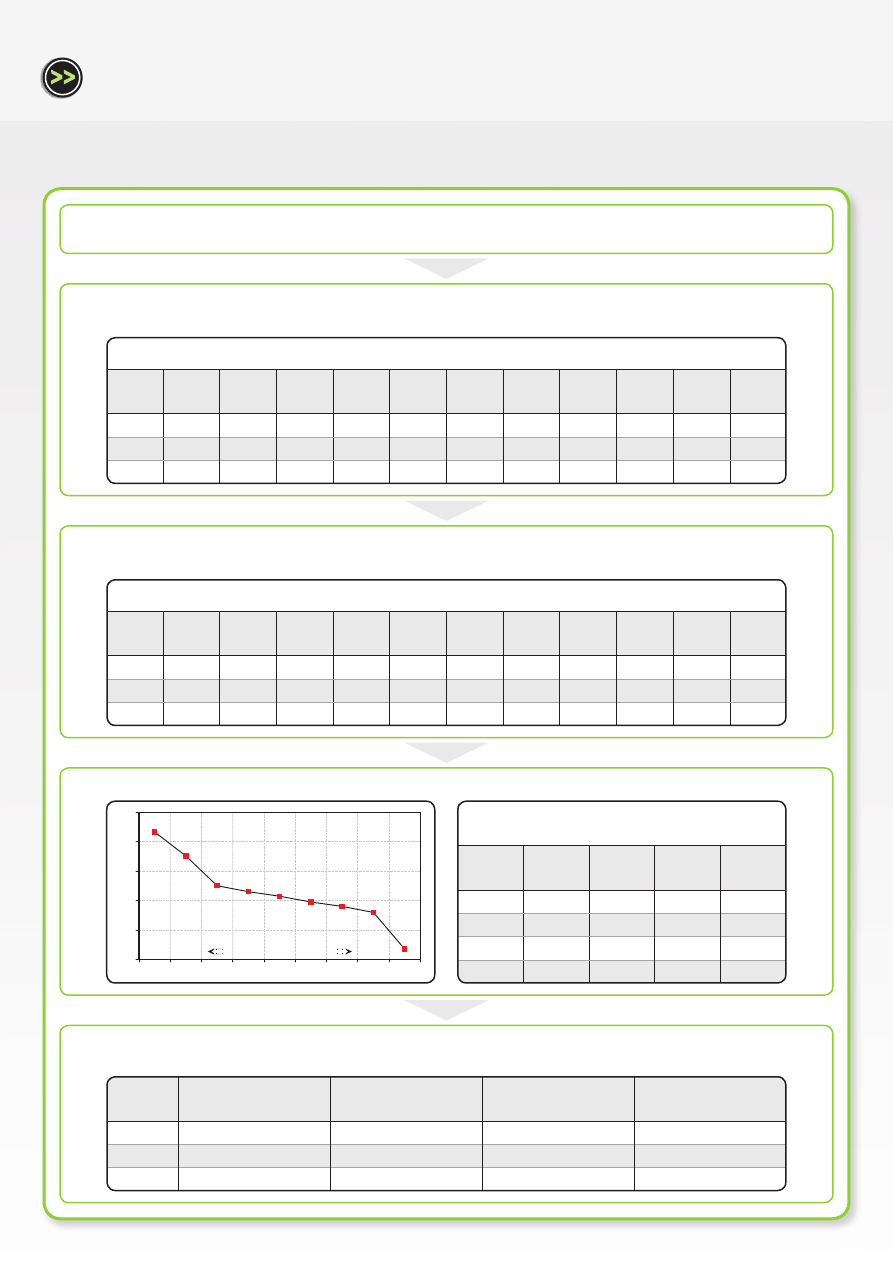
In Workflow B, the current gold standard method for relative quantification, using a combination of the most stable housekeeping genes
for the cell under investigation and in response to the experimental conditions, is presented. All ten housekeeping genes are systematically
compared with each other resulting in an average expression stability plot. This output ranks each housekeeping gene in order of expression
stability. A combination of the most stable housekeeping genes is then used in relative quantification analysis. Using this multiple, validated
housekeeping gene approach the relative expression levels of Tbx2 decreased from 1.00 to 0.75 to 0.71 at time points 0 h, 8 h and 24 h post-
treatment, respectively. As expected, these results are very similar to those obtained when the single most stable gene, HMBS, was used for
relative quantification analysis.
Workflow A: Application of a single housekeeping gene to calculate relative gene expression levels (2
-ΔΔC
T
method)
KAPA™ SYBR® FAST qPCR Kits
Application Note
Gene Expression II
Step 1:
◆➤
Confirm qPCR efficiencies (should be 95 - 105%) for HK and GOI
◆➤
Perform five log
10
-fold dilutions of cDNA for each HK gene and GOI to determine PCR efficiency (100 ng - 10 pg/reaction)
Average replicate C
T
values for each gene at 100 ng/reaction
Tbx2
(GOI)
RPL13a
(HK1)
HMBS
(HK2)
UBC
(HK3)
SDHA
(HK4)
HPRT1
(HK5)
ActB
(HK6)
YWHAZ
(HK7)
TBP
(HK8)
B2M
(HK9)
GAPDH
(HK10)
t = 0 h
19.81
12.94
19.54
14.79
17.47
18.89
12.14
14.90
20.21
16.03
15.40
t = 8 h
20.14
12.85
19.45
14.67
17.55
19.02
12.00
14.79
20.26
16.22
15.24
t = 24 h
20.08
12.77
19.41
14.43
16.59
18.67
11.65
14.84
19.97
15.34
14.98
Step 2:
◆➤
Use 100 ng cDNA/reaction C
T
replicate values for ΔC
T
calculation
◆➤
Select C
T
of each cDNA sample at 100 ng/reaction in triplicate for HK gene and GOI
Step 4:
◆➤
Use geNorm to calculate the geometric mean of the most stable reference genes to obtain the normalization factor
Calculation of normalization factors for most stable
reference genes
RPL13a
UBC
HMBS
Norm.
factor
t = 0 h
0.89
0.78
0.92
0.86
t = 8 h
0.95
0.84
0.97
0.92
t = 24 h
1.00
1.00
1.00
1.00
M <1.5
0.06
0.11
0.069
UBC
RPL13a
HMBS
SDHA
GAPDH
TBP
Act B
HPRT1
YWHAZ
B2M
0.05
0
0.1
0.15
0.2
0.25
Av
er
ag
e e
xp
re
ss
io
n s
ta
bi
lit
y M
Least stable genes
Most stable genes
0.217033986
0.17616644
0.125137994
0.115469166
0.097832686
0.107720069
0.090312078
0.080193258
0.017960022
Step 3:
◆➤
Convert C
T
values to relative quantities for geNorm input
◆➤
Relative quantities for each gene = E
(Minimum C
t
- Sample C
t
)
, E = 2 for 100% efficiency
Relative quantities of each gene at each time point
Tbx2
(GOI)
RPL13a
(HK1)
HMBS
(HK2)
UBC
(HK3)
SDHA
(HK4)
HPRT1
(HK5)
ActB
(HK6)
YWHAZ
(HK7)
TBP
(HK8)
B2M
(HK9)
GAPDH
(HK10)
t = 0 h
1.00
0.89
0.91
0.78
0.54
0.86
0.71
0.93
0.85
0.62
0.75
t = 8 h
0.80
0.95
0.97
0.85
0.51
0.78
0.78
1.00
0.82
0.54
0.84
t = 24 h
0.83
1.00
1.00
1.00
1.00
1.00
1.00
0.97
1.00
1.00
1.00
Step 5:
◆➤
Calculate relative GOI expression levels by dividing the GOI quantity by the normalization factor at each time point
◆➤
Normalize the results
Tbx2 (GOI)
Normalization factors
Relative expression
levels
Relative fold change in
Tbx2 expression
t = 0 h
1.00
0.86
1.16
1.00
t = 8 h
0.80
0.92
0.86
0.75
t = 24 h
0.83
1.00
0.83
0.71
Workflow B: Application of multiple housekeeping genes to calculate gene expression levels
KAPA™ SYBR® FAST qPCR Kits
Application Note
Gene Expression II
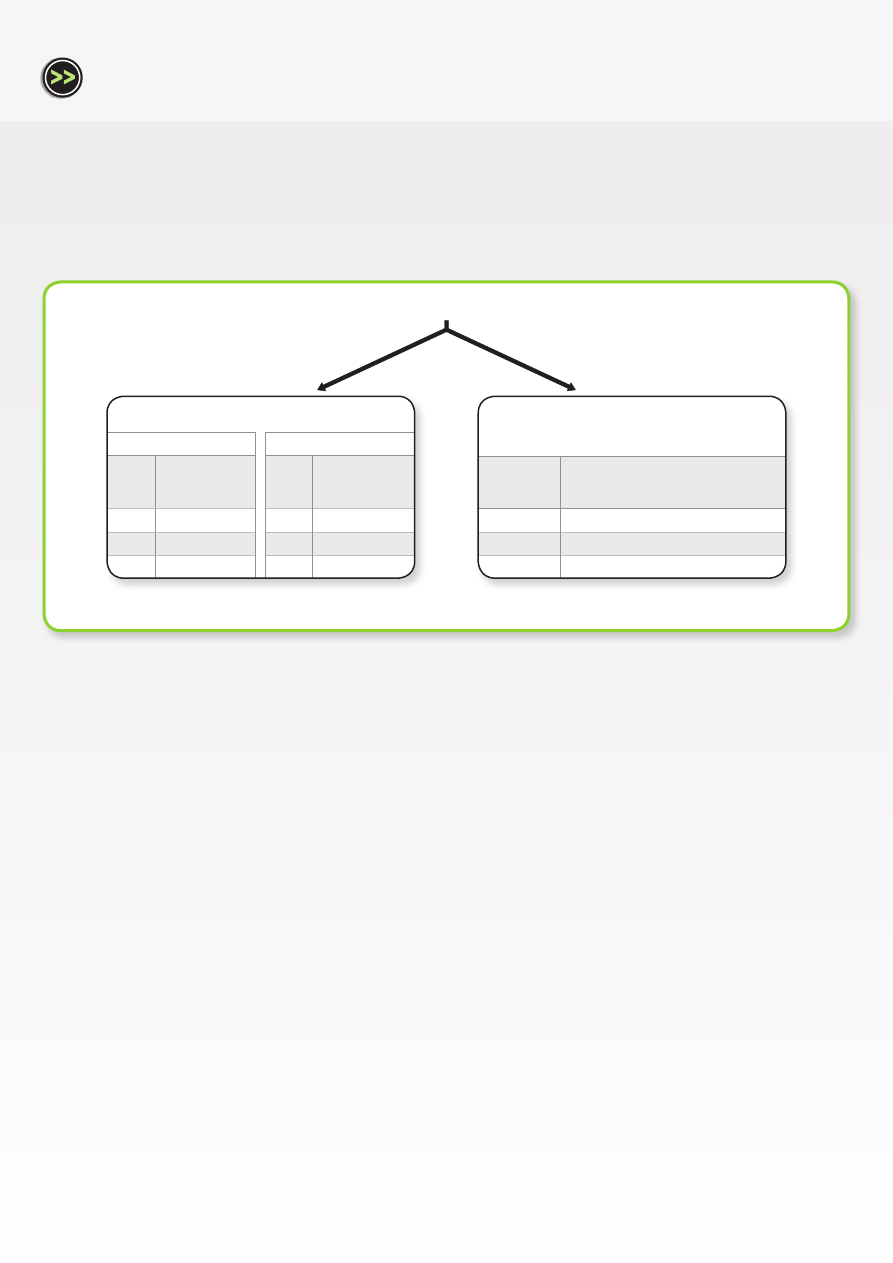
Relative Quantification Strategies
Stable HK gene (HMBS)
Normalized
expression levels
of GOI
t = 0 h
1.00
t = 8 h
0.75
t = 24 h
0.76
Unstable HK gene (SHDA)
Normalized
expression levels
of GOI
t = 0 h
1.00
t = 8 h
0.84
t = 24 h
0.45
Single housekeeping gene normalization
Not recommended
Normalized expression
levels of GOI
t = 0 h
1.00
t = 8 h
0.75
t = 24 h
0.71
Multiple housekeeping gene
normalization
Recommended
3. Conclusions
Accurate normalization of gene expression levels is an absolute prerequisite for reliable results, especially when the biological significance of
subtle gene expression differences is studied. Vandersompele et al. [5] showed that by using conventional normalization strategies based on a
single housekeeping gene, erroneous normalization of up to 3.0- and 6.4-fold in 25% and 10% of cases, respectively, were observed. Certain cases
showed error values in excess of 20-fold.
The data presented in this Application Note demonstrates a similar trend, although the differences observed were less dramatic due to the
fact that all housekeeping genes displayed relatively high stabilities under the specific experimental conditions. When relative quantification
was performed using a combination of the most stable housekeeping genes (as determined by geNorm), the relative expression levels of Tbx2
decreased from 1.00 to 0.75 to 0.71 at time points t = 0, 8 and 24 hours respectively. As expected, when the least stable gene (SDHA) was used for
single housekeeping gene normalization, the greatest variation in expression ratio was obtained, namely 0.84 (t = 8 h) and 0.45 (t = 24 h), relative
to 1.00 at t = 0. Conversely, when the most stable gene (HMBS) was used for single housekeeping gene normalization, the greatest concordance
with multiple gene normalization was obtained (0.75 and 0.76 at t = 8 h and t = 24, respectively, relative to 1.00 at t = 0). This data confirms the
findings of other large-scale studies [6], namely that ideal and universal control genes do not exist. Normalization against multiple housekeeping
genes is therefore a prerequisite for reliable relative gene expression analysis
4. Methods
Total RNA was isolated from the human breast cancer cell line, MCF-7, using the NucleoSpin® RNA II kit (Macherey-Nagel). RNA was digested
with DNase I to remove contaminating genomic DNA. The ImProm-II™ Reverse Transcription System (Promega) was used to generate cDNA
from 1 µg RNA with oligo(dT) primers. The cDNA was used as template to determine the amplification efficiency for each housekeeping
gene and the gene of interest, Tbx2, using the KAPA SYBR® FAST Universal qPCR Kit according to standard protocols. The reaction efficiency
achieved for each gene was calculated using the C
T
slope method, with five data points corresponding to log
10
-fold MCF-7 cDNA serial dilutions
(100 ng - 10 pg/reaction).
Consistent, high amplification efficiencies (95 - 104%) were achieved in all cases. For relative quantification calculations, C
T
scores for the 100 ng
MCF-7 cDNA/reaction at each of the three time points (average of triplicate determinations) were used.
5. References and acknowledgements
[1] Warrington, J.A., et al. (2002). Physiol. Genomics 2: 143–147.
[2] Thellin, O., et al. (1999). J. Biotechnol. 75: 291–295.
[3] Suzuki, T., et al. (2000). BioTechniques 29: 332–337.
[4] Bustin, S.A. (2000). J. Mol. Endocrinol. 25: 169–193.
[5] Vandesompele, J., et al. (2000). Genome Biol. 3(7): research0034.1 – 34.11.
[6] Ross, D.T., et al. (2000). Nat. Genet. 24: 227 – 235.
Kapa Biosystems thanks Dr. Sharon Prince and Sabina Wansleben (Department of Human Biology, Faculty of Health Sciences, University of Cape Town) for their collaboration
in this study.
For technical support with these or other applications, please contact:
support@kapabiosystems.com
Wyszukiwarka
Podobne podstrony:
KAPA SYBR FAST ABI Prism TDS id Nieznany
Peripheral clock gene expression in CS mice with
Data Mining of Gene Expression Data by Fuzzy and Hybrid Fuzzy Methods piq
Differences in mucosal gene expression in the colon of two inbred mouse strains after colonization w
instrukcja przeciwpozarowa gene Nieznany
14 10 2011 expression ecritid 1 Nieznany (2)
25 11 2011 expression ecrite id Nieznany
Analiza DNA w archeologii Gene Nieznany (2)
7 10 2011 expression ecrit id 4 Nieznany (2)
18 11 2011 expression ecriteid Nieznany
instrukcja przeciwpozarowa gene Nieznany
Gor±czka o nieznanej etiologii
02 VIC 10 Days Cumulative A D O Nieznany (2)
Abolicja podatkowa id 50334 Nieznany (2)
45 sekundowa prezentacja w 4 ro Nieznany (2)
4 LIDER MENEDZER id 37733 Nieznany (2)
więcej podobnych podstron