Mariner’s Guide For Hurricane Awareness In
The North Atlantic Basin
Eric J. Holweg
Meteorologist
Tropical Analysis and Forecast Branch
Tropical Prediction Center
National Weather Service
National Oceanic and Atmospheric Administration
August 2000

Internet Sites with Weather and Communications Information
Of Interest To The Mariner
NOAA home page:
NWS home page:
NWS marine dissemination page:
http://www.nws.noaa.gov/om/marine/home.htm
NWS marine text products:
http://www.nws.noaa.gov/om/marine/forecast.htm
NWS radio facsmile/marine charts:
http://weather.noaa.gov/fax/marine.shtml
NWS publications:
http://www.nws.noaa.gov/om/nwspub.htm
NOAA Data Buoy Center:
NOAA Weather Radio:
National Ocean Service (NOS):
NOS Tide data:
http://tidesonline.nos.noaa.gov/
USCG Navigation Center:
Tropical Prediction Center:
High Seas Forecasts and Charts:
http://www.nhc.noaa.gov/forecast.html
Marine Prediction Center:
SST & Gulfstream:
http://www4.nlmoc.navy.mil/data/oceans/gulfstream.html
Hurricane Preparedness & Tracks:
http://www.fema.gov/fema/trop.htm
Time Zone Conversions:

i
Table of Contents
•
Tropical Wave
•
Tropical Disturbance
•
Tropical Depression
•
Tropical Storm
•
Hurricane
•
Hurricane Categories
•
Subtropical Cyclone
•
Conditions For Development & Intensification
•
Tropical Cyclone Life Cycle
•
Hurricane Size
•
Wind Field
•
State of the Sea
•
Hurricane Structure
The Eye
The Eyewall
Rainbands
•
Wind
•
Wave
•
Clouds
•
Surface Pressure
•
Environmental Steering
•
Internal Effects and Secondary Influences

ii
•
Tropical Weather Discussion
•
Tropical Weather Outlook
•
Tropical Cyclone Forecast/Advisory
•
Tropical Cyclone Discussion
•
Tropical Cyclone Strike Probabilities
•
Coastal, Offshore, and High Seas Forecasts
•
Tropical Surface Analysis
•
Wind/Wave Forecast Chart
•
Tropical Cyclone Graphic Products
•
Internet
•
•
HF Fax
•
WWV HF Voice
•
United States Coast Guard HF SITOR
•
United States Coast Guard HF Voice
•
United States Coast Guard MF Voice
•
United States Coast Guard VHF Voice
•
NOAA Weather Radio
•
NAVTEX
•
INMARSAT-C
•
National Weather Service Telephone Support
•
History of Hurricane Tracks & Intensification Factors ........................................42
Impact of Currents, Eddies, and Warm Water
•
Predictability of Tropical Cyclone Motion & Intensity .........................................44
34 KT Rule
1-2-3 Rule
•
Ship Versus Tropical Cyclone Track Analysis ...................................................51
Never Crossing the ‘T’
Forecast Track Tendencies
Calculating Closest Point of Approach
•

iii
•
Tropical Cyclone Approach to Port
•
Go - No Go Decisions To Leave Port
•
Berthing and Shelter Requirements
Appendix 1 – Mariners Tropical Cyclone Risk Analysis Checklist
Appendix 2 – Atlantic Basin Hurricane Tracking Chart
Analysis & forecasts of all tropical cyclone activity rely heavily
on ship observations in order to obtain the best estimate of the
synoptic patterns guiding tropical cyclone motion and inten-
sity. Three hourly ship observations in the vicinity of any
active tropical system are an extremely valuable data point for
input into tropical cyclone forecasts and guidance. All ship
observations recorded near tropical cyclones are greatly appre-
ciated and provide a most valuable data source used in determin-
ing current and forecast wave heights & wind fields associated
with these systems.

1
Introduction & Purpose
In the Atlantic Basin, they are called Hurricanes; a name derived from the Caribbean God of Evil...
Hurican. With a sudden fury and unpredictable behavior, these “evil spirits” of violent, spiraling
masses of thunderstorms, high seas, and devastating winds have been a nemesis to sailors since men
first began to take to the oceans centuries ago. Today, as more merchant, fishing, and recreational
sailors take to the sea by the thousands, the potential impacts and effects that hurricanes could have
on mariners is as important as ever.
History is littered with the tales of lives lost and damage done to vessels caught at sea or in port,
unaware of the threat associated with tropical cyclones. From the loss of colonial settlers traveling
to the New World, through the loss and damage of 12 U.S. Navy ships during one Pacific tropical
cyclone during World War II, to the recent loss of a commercial vessel during Hurricane Mitch in
the Caribbean, history teaches us that accurate forecasting and a fundamental awareness of tropical
cyclones are critical to the safety of Mariners.
Understanding of the development, structure, life cycle, and motion of tropical cyclones is para-
mount to avoiding vessel damage and loss of life and property at sea during these violent weather
events. And although we know that we cannot control the path or violent fury of these systems,
knowledge of them and the ability to remain clear of them are the two crucial factors to saving lives
and property at sea.
This guide will hopefully aid the Mariner in understanding the complex structure and behavior of
tropical cyclones in the North Atlantic Ocean. Once armed with this knowledge, and the information
on where to acquire forecasts and guidance for current tropical cyclones, the mariner can be pre-
pared to “weather the storm” or better yet, avoid these catastrophic events altogether.
Finally, this guide will discuss some ship routing and hurricane avoidance options with the intention
of highlighting critical thought processes, risk analyses and required actions that should be consid-
ered in order to remain safe and secure during the threat of a tropical cyclone at sea or in port.
Disclaimer
This manual was developed to enhance the mariner’s awareness of tropical cyclones in the Atlantic
Basin. The advice and guidance provided herein are a courtesy of the Tropical Prediction Center &
the National Weather Service (TPC/NWS). The Tropical Prediction Center/National Weather Ser-
vice does not warrant that following the advice or the methodologies outlined will eliminate the
risks of harm from tropical cyclones. Anyone undertaking the methodologies does so solely at his/
her own risk.
Chapter 1 - Tropical Cyclone Basics
Tropical cyclones are warm core, non-frontal low pressure systems of synoptic scale that develop
over tropical or subtropical waters and have a definite organized surface circulation. Tropical de-
pressions, tropical storms, and hurricanes are all forms of tropical cyclones, differentiated only by
the intensity of the winds associated with them.
2
Definitions and Terminology
Tropical Wave (African or Easterly Wave)
A tropical wave is a trough or cyclonic curvature maximum in the trade wind easterlies. These
waves tend to reach maximum amplitude in the lower to middle troposphere and may or may not be
accompanied by thunderstorm clusters. Although there is still some debate on the issue, these
easterly waves are thought to originate or become amplified as a result of meteorological conditions
over the continent of Africa. Each hurricane season approximately 60 of these waves cross the
tropical North Atlantic. Although the majority of these waves pass through the basin without any
significant tropical cyclone development, passage of these waves is often accompanied by squally
weather with brief periods of higher sustained winds. Examples of the clouds and weather types
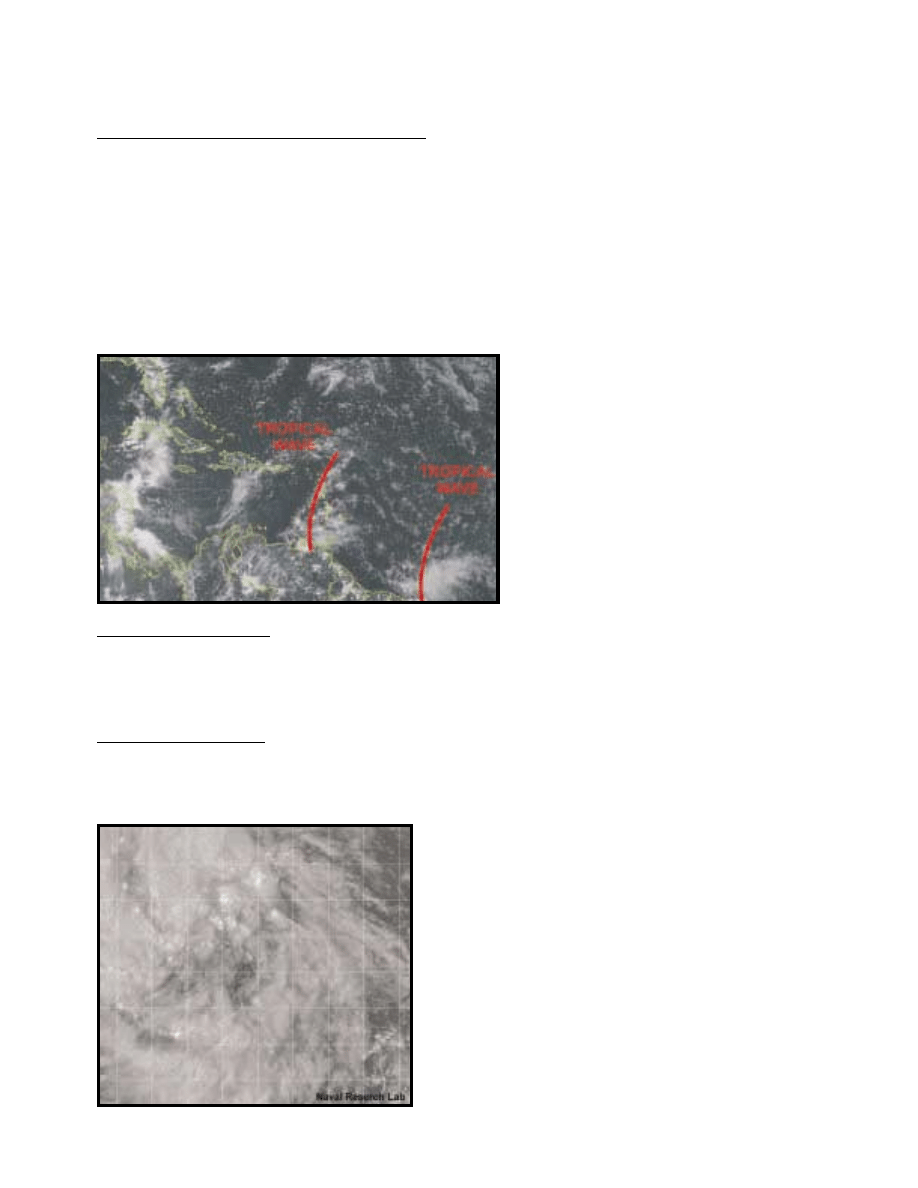
associated with tropical waves are shown in FIGURE 1.
Tropical Disturbances
A tropical disturbance is a discrete tropical weather system with apparently organized convection
(generally 100 to 300 miles in diameter) originating in the tropics or subtropics, having a non-
frontal migratory character, and maintaining its identity for 24 hours or more.
Tropical Depressions
Tropical cyclones in which the maximum sustained surface wind speed (1-minute mean) is 33 KT
or less. Tropical depressions must have a closed surface circulation in order to be classified in this
category. An image of a tropical depression is shown in FIGURE 2.
FIGURE 1: GOES-8 image taken at 1415 UTC
on 11 June 2000. The axes of two North
Atlantic tropical waves are shown in the image.
Notice that most of the active weather in the
form of showers & thunderstorms, lies east of
the wave axis. Wind reports of 20 to 25 KT were
recorded in the vicinity of the wave entering the
Caribbean Sea near the time of this image.
FIGURE 2: Visible image of Tropical Depression Number 9 taken
at 1445 UTC 11 Sept 1999. 18 hours later, the depression
intensified into Tropical Storm Gert over the Eastern Atlantic.
During the next 12 days Gert moved NW across the Central
Atlantic passing east of Bermuda. The cyclone’s minimum central
pressure of 930 MB with estimated winds of 130 KT and gusts to
150 KT was reached only 5 days after it was identified as a
depression. Canadian news reported waves of 27 feet along the
distant coast of Newfoundland as Gert weakened to tropical
storm force during the system’s recurve and extra-tropical
transition.
3
Tropical Storms
Tropical cyclones in which the maximum sustained surface wind speed (1-minute mean) ranges
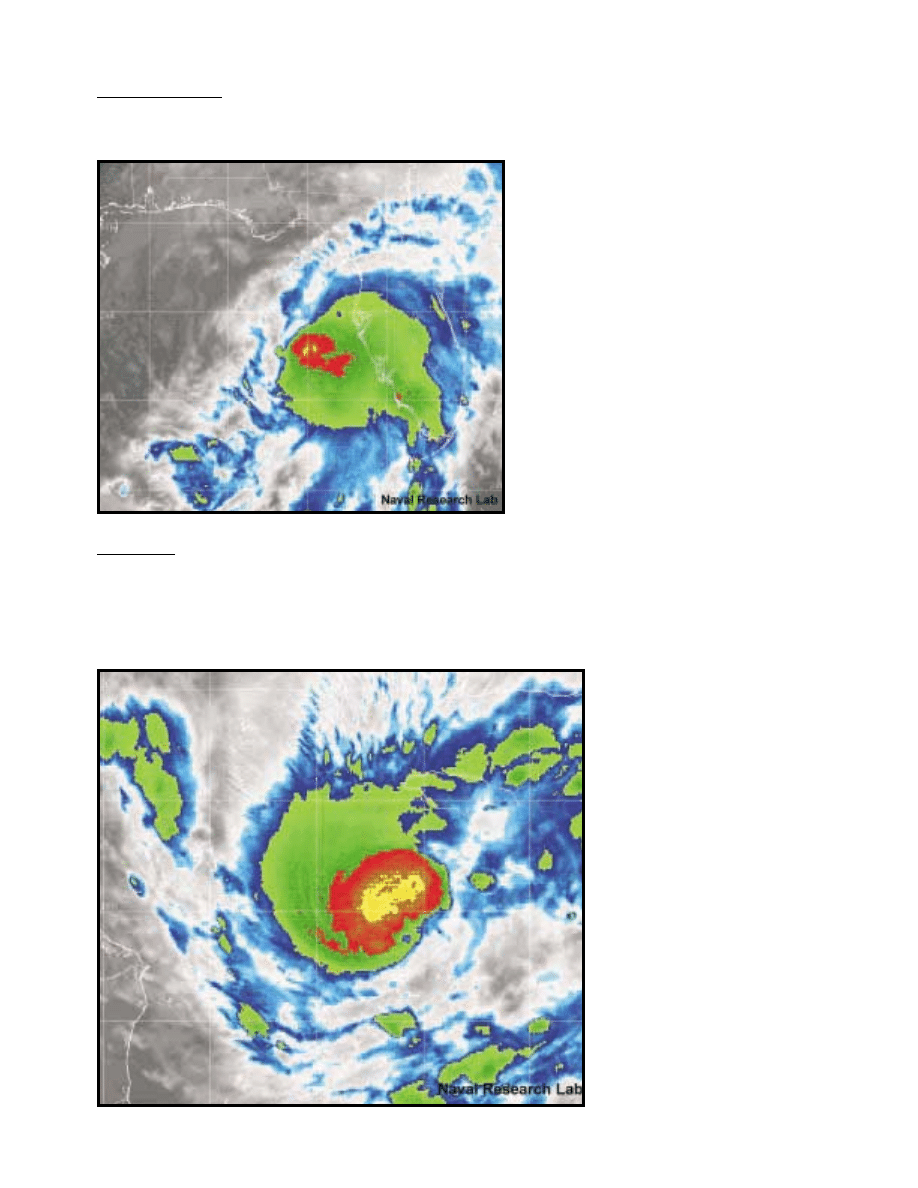
from 34 KT to 63 KT. A satellite image of a tropical storm is shown in FIGURE 3.
FIGURE 3: GOES-8 Infrared image of Tropical
Storm Harvey taken at 2045 UTC on 20 Sept 99.
Maximum intensity at this time was 50 KT with
gusts to 60 KT. Within 18 hours of this system
becoming a tropical depression, 12-foot seas had
developed in the vicinity of the system center.
Within 36 hours after becoming a depression, ship
observations within 150 NM SE of Harvey
indicated tropical storm force winds and seas to
12 feet.
Hurricane
Tropical cyclones in which the maximum sustained surface wind speed (1-minute mean) is greater
than or equal to 64 knots. These systems are also known as Typhoons in the Western Pacific and
Tropical Cyclones in the Indian Ocean and Southwestern Pacific. Satellite imagery of a 70 knot
hurricane is shown in FIGURE 4.
FIGURE 4: GOES-8 infrared
image of Hurricane Lenny taken
0015 UTC on 15 Nov 1999. Lenny
had intensified to 70 KT with gusts
to 85 KT at the time of this image.
It was the first tropical cyclone
with an extended west to east track
across the Caribbean Sea in 113
years of tropical cyclone records.
The approach of this system from
the West produced unprecedented
storm surge and wave heights on
the normally protected westward
facing ports and harbors of islands
in the eastern Caribbean Sea.
Estimates of wave heights to 16 ft
were noted in some port locations
within this region.

4
Hurricane Categories (Saffir-Simpson Hurricane Scale)
Hurricanes are further categorized according to the strength of their winds using the Saffir-Simpson
Hurricane Scale (SSHS). A Category 1 storm has the lowest wind speeds, while a Category 5 has
the highest. These are relative terms because lower category storms can sometimes inflict greater
damage than higher category storms, depending on angle of approach, location, and many other
aspects particular to each system. Even tropical storms can produce significant damage & loss of
life, mainly due to floods.
Subtropical Cyclone
A low pressure system that develops over subtropical waters initially having a non-tropical circula-
tion (i.e. cold core) but in which some elements of tropical cyclone cloud structure are present.
Under certain conditions, subtropical cyclones can evolve into tropical cyclones.
Formation and Life Cycle of Tropical Cyclones
The ingredients for development of a tropical cyclone in the North Atlantic Basin include a pre-
existing weather disturbance, warm ocean water, atmospheric moisture, relatively light winds aloft,
and formation north of approximately 5° North latitude
*
. If the right conditions persist long enough,
they can combine to produce the violent winds, incredible waves, torrential rains, and massive
floods that we associate with hurricanes.
Tropical cyclones form over warm waters from pre-existing weather systems. Over 75 % of the
tropical cyclones that form in the Atlantic basin originate from tropical easterly waves that typically
emerge every three to four days from the coast of Africa. The other 25 % of tropical cyclones typi-
*
This is required in order for the earth-atmosphere system to produce a minimum Coriolis Force on the developing
tropical cyclone. Without Coriolis Force, low pressure and particularly the cyclonic circulation initially generated in a
tropical disturbance could not be maintained for very long.
CATEGORY
DEFINITION
EFFECTS
EXAMPLE
1
W inds: 64-82 KT
No real damage to building structures. Damage
primarily to unanchored mobile homes, shrubbery,
and trees. Also, some coastal flooding and minor
pier damage.
Hurricane Earl
(1998)
2
W inds: 83-95 KT
Some roofing material, door, and window
damage. Considerable damage to vegetation,
mobile homes, etc. Flooding damages piers and
small craft in unprotected moorings may break
their moorings.
Hurricane Georges
(1998)
3
W inds: 96-113 KT
Some structural damage to small residences and
utility buildings, with a minor amount of curtainwall
failures. Mobile homes are destroyed. Flooding
near the coast destroys smaller structures with
larger structures damaged by floating debris.
Terrain may be flooded well inland.
Hurricane Fran
(1996)
4
W inds: 114-135 KT
More extensive curtainwall failures with some
complete roof structure failure on small
residences. Major erosion of beach areas. Terrain
may be flooded well inland.
Hurricane Andrew
(1992)
5
W inds: >135 KT
Complete roof failure on many residences and
industrial buildings. Some complete building
failures with small utility buildings blown over or
away. Flooding causes major damage to lower
floors of all structures near the shoreline. Massive
evacuation of residential areas may be required.
Hurricane Camille
(1969)

5
cally form along the trailing ends of cold fronts or can occasionally even develop from upper-level
lows in the atmosphere.
Each year, an average of ten tropical storms develop over the Atlantic Ocean, Caribbean Sea, and
Gulf of Mexico. Of these ten storms, six typically develop into hurricanes. In an average 3-year
period, roughly five hurricanes strike the United States coastline, killing approximately 50 to 100
people anywhere from Texas to Maine. Of these five hurricanes that strike the U.S., two are typi-
cally “major” hurricanes with winds greater than 96 KT. Regardless of where these systems form or
to which level of intensity they develop, all tropical cyclones pose a very serious hazard to mariners
throughout the Atlantic basin.
Conditions for Development & Intensification
The process by which a tropical cyclone develops and subsequently intensifies into a hurricane
depends on at least six conditions explained below:
1.
A pre-existing surface disturbance with thunderstorms. As warm core systems, tropical cy-
clones rely on a build up of heat energy within the atmospheric column above them in order to
grow and develop. A thunderstorm complex acts as a vertical transport mechanism for heat,
moisture, and the cyclonic turning of winds into the upper levels of the atmosphere. This
vertical transport into higher levels of the atmosphere aids the incipient tropical cyclone to
grow and develop.
2.
Relatively moist atmospheric layers in the middle troposphere, approximately 10,000-20,000 ft
above the earth’s surface. Dry air at this level of the atmosphere is not favorable for continued
development of the required thunderstorm activity in a disturbance.
3.
Warm (at least 79ºF or 26ºC) ocean temperatures with a mixed layer depth of about 200 feet.
This mixed ocean layer allows warm water to remain available to a developing system even
after the wind has begun to increase in speed and the sea surface begins to get churned up by
the developing cyclone.
4.
Light winds aloft that do not change much in direction and speed throughout the depth of the
atmosphere (low vertical wind shear). Tropical cyclones rely on a vertically stacked structure in
order to grow or maintain in intensity. In other words, the ideal tropical cyclone will have its
cyclonic circulation in the middle & upper levels of the atmosphere located directly above the
cyclonic circulation of the surface & low levels of the atmosphere. Increases in wind speed
with height will tilt the vertical structure of a tropical cyclone not allowing the system to re-
main stacked throughout the troposphere. If this vertical tilting of the system persists, growth
will become inhibited and the tropical system will decay.
5.
Must be poleward of about 5 degrees north latitude in order to meet minimum threshold values
for the Coriolis Force. See footnote on previous page.
6.
Upper-level outflow over a system serves to remove mass from the top of the vertical column
in a tropical cyclone. As a system develops, low-level cyclonic flow pulls more mass towards
the center of the system; the flow then turns upward in intense vertical motions associated with
thunderstorms in the area. Without a method to dispose of this mass from above the tropical

6
cyclone, low-level converging flow toward the center of the system will be halted and the
system will “suffocate”.
In a complex relationship, these six factors are interdependent. The absence or change in one of the
ingredients often results in a change or loss in one or more of the other factors. If nature allows
these conditions to remain favorable over a period of time, it can produce a spectacular atmospheric
event of catastrophic proportions.
During an idealized case of tropical cyclogenesis, the following events would occur on the order of
days with different factors occurring simultaneously or near-simultaneously throughout the develop-
ing phase of a tropical cyclone.
Initially, heat and therefore energy for the storm are gathered by the disturbance through contact
with warm ocean waters. Thunderstorm activity begins to develop and define the vertical structure
above the tropical disturbance. Soon the Coriolis Force begins to act on the system, aiding in the
development of a cyclonic circulation with winds near the ocean surface now spiraling into the
disturbance’s developing low pressure area. The warm ocean waters and their sufficient mixed layer
depth will continue to add moisture and heat to the air that rises in the updrafts of convection near
the disturbance. As the moisture condenses into drops, more heat is released into the atmosphere,
adding energy to power the storm. Thunderstorms begin to take on a curved banding structure as
they organize around the low-level center of the system. As these thunderstorms grow higher into
the troposphere, relatively light winds at those high levels will allow the vertically stacked warm
core of the storm to remain intact and continue to strengthen.
Tropical Cyclone Life Cycle
Hurricanes can last for two weeks or more over the open ocean, generating incredible sea heights in
excess of 50 ft with rather substantial swell trains that can extend outward from these systems for
thousands of miles. All the while, these cyclones can continue to move across the entire tropical
North Atlantic, Caribbean Sea, & Gulf of Mexico placing vessels both at sea and in-port into harm’s
way.
In the early stages of development, the system appears in satellite imagery as relatively unorganized
thunderstorm clusters generated in the low-level cyclonically curved wind flow of a tropical wave or
other incipient disturbance (see FIGURE 5). If weather and ocean conditions remain favorable, the
system can strengthen to become a tropical depression with winds less than 33 KT. At this point the
storm begins to take on the familiar spiral appearance with increasing cyclonic wind flow around
the low-level circulation center. If the storm continues to strengthen to tropical storm status (winds
34-63 KT), the developing bands of thunderstorms contribute additional heat & moisture to the
storm further aiding in intensification. The storm becomes a hurricane when surface winds reach a
minimum of 64 KT. About this time, the cloud-free eye typically forms in the inner region of the
tropical cyclone.
The tropical cyclone will continue to grow and sustain itself until one or more of the necessary
ingredients is either lost or undergoes a significant change. Wind shear can tear a system apart
separating the vertically stacked warm core aloft from its low-level circulation. Movement of these
systems into regions of drier mid-level air can inhibit convection and cause a weakening of the
tropical cyclone. Additionally, movement into cooler water or landfall events typically shut down a
7
tropical cyclone’s warm energy source, and therefore it’s fuel to survive. Landfall also increases
low-level friction within a system thereby reducing the intensity of the circulation while increasing
rainfall amounts.
Generally speaking, a weakening tropical cyclone can re-intensify if it moves into a more favorable
region with respect to the six ingredients. Similarly, a tropical cyclone interacting with a mid-
latitude cold front can intensify into an extra-tropical gale or storm force low as the result of many
factors involved in the tropical to extra-tropical transition of these systems. This transition from
tropical to extra-tropical can cause sudden structure changes in the cyclone, which result in dramatic
variations of storm speed, direction, & position. Similarly, rather rapid fluctuations of the wind field
intensity and an outward expansion of gale & storm force winds often occur, as these systems
become extra-tropical. This tropical to extra-tropical transition normally occurs at higher latitudes
over the cooler ocean water located in the vicinity of major transatlantic shipping lanes. Combining
all of these factors, the decay of a tropical cyclone & the tropical to extra-tropical transition are
extremely dangerous & often times unpredictable periods in the tropical cyclone life cycle.
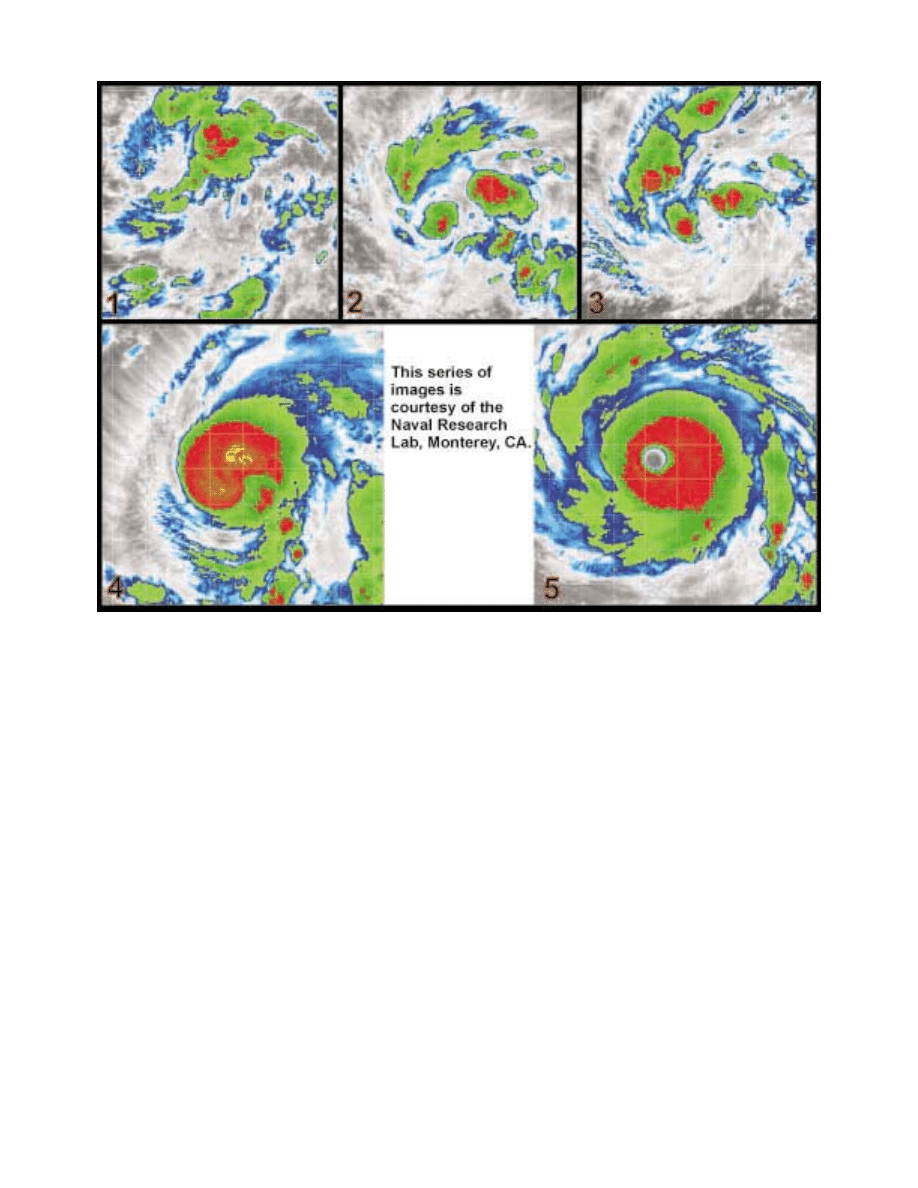
FIGURE 5: GOES-8 infrared images of Floyd (1999) taken over a period of 6 days during the developing stages of the
hurricane. Panel 1 is a very strong tropical disturbance that became a Tropical Depression, 12 hours later. Panel 2 is
Tropical Depression #8, which continued to intensify into Floyd. By panel 3, Floyd has intensified into a Tropical Storm
with a spiral pattern noted in the convective bands. This is indicative of the increasing low-level cyclonic flow into the
system. Panels 4 & 5 are of Floyd as a category 1 hurricane and finally a category 4 system, respectively.
8
General Tropical Cyclone Characteristics
Hurricane Size
Contrary to their appearance on weather maps, hurricanes are much larger than the point source
often depicted on those maps. Similarly, their path is more than a line and should be looked at as a
swath across which the system and it’s associated impacts are felt. This tropical cyclone swath
requires the mariner to take precautions far from where the center is currently located & forecast to
move.
Although they can vary considerably, typical hurricanes possess tropical storm force wind fields of
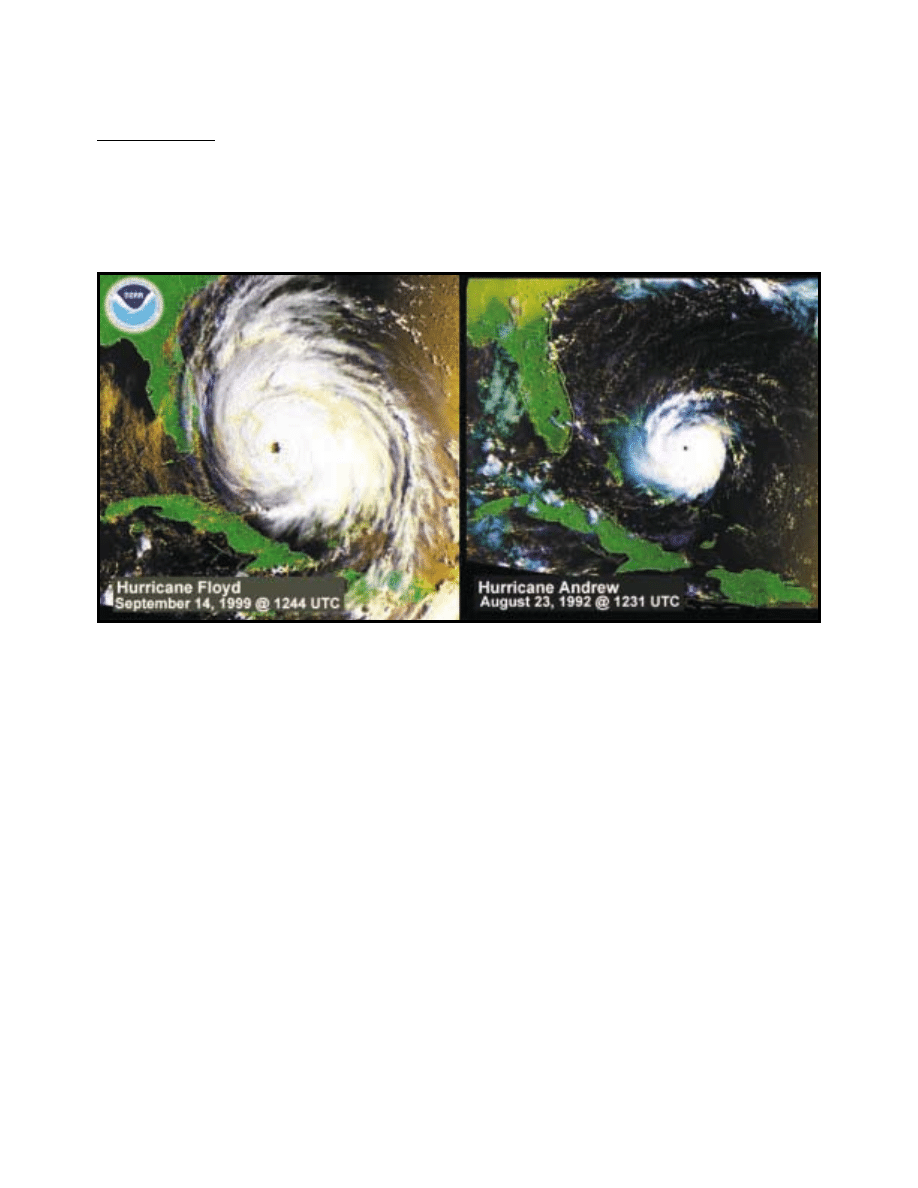
about 300 nautical miles in diameter. As shown in FIGURE 6, both Floyd (1999) and Andrew
(1992) were category 4 systems on the SSHS with lowest recorded central pressure of 921 MB and
922 MB, respectively. Both systems reached peak intensity with maximum sustained winds esti-
mated at 135 KT. However, the radius of tropical storm force winds with Floyd was much greater
than the radius of similar winds in Andrew. Supporting the fact that size is not necessarily an indica-
tion of hurricane intensity, Andrew was the most devastating landfalling hurricane of the 20
th
cen-
tury in terms of property damage done, yet was a relatively small hurricane.
Therefore, do not focus on the location and track of the center, because the hurricane’s destructive
winds and seas cover a broad path. Hurricane force winds can extend outward about 25 nautical
miles from the storm center of a small hurricane to more than 150 nautical miles for a large one. The
range over which tropical storm force winds occur is even greater, possibly extending as far as 300
nautical miles from the eye of a large hurricane.
FIGURE 6: Images of Hurricanes Floyd (left) and Andrew (right). Both systems reached maximum intensity with
sustained winds of 135 KT. During the peak intensity of Floyd, radius of tropical storm force winds extended outward to
250 NM in the NE quadrant while seas of 12 feet or greater were observed out to 300 NM in the same quadrant of the
system. In contrast, Andrew’s radius of tropical storm force winds only extended out to 90 NM with seas of 12 feet or
higher also noted within 90 NM of the tropical cyclone center during it’s period of peak intensity.
9
Wind Field
Although each tropical cyclone takes on characteristics determined by the environment in which it
develops, there are some generalizations about the wind fields of these systems that can be ad-
dressed for most tropical cyclones in the North Atlantic basin.
The core of strongest winds associated with a tropical cyclone is concentrated around and near the
center of the surface circulation. Aside from this fact and as a general rule of thumb, the hurricane’s
right side (relative to the direction it is traveling) is the more dangerous side of the storm. This is
due to the additive effect of the hurricane’s wind speed, and the speed at which the entire system is
moving within the larger atmospheric steering flow. These increased winds on the right side of a
tropical cyclone are accompanied by higher sea heights within that same area. Additionally, in
landfall situations, storm surge is normally higher over the right semicircle of the system along with
an increased likelihood of tornadoes as well. There have been some notable exceptions to these
generalizations and specific structure and composition of the wind field can differ greatly from
system to system.
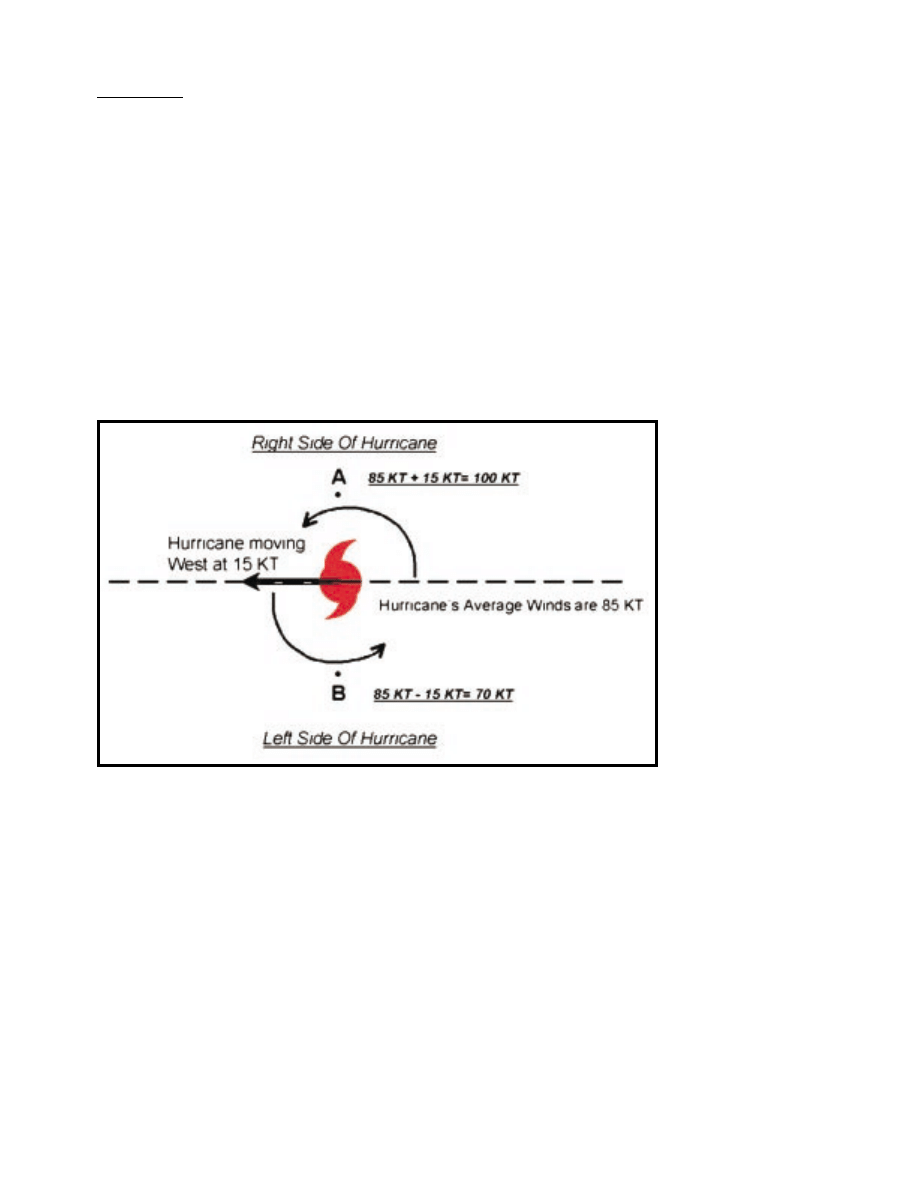
The example in FIGURE 7 shows the additive effects of tropical cyclone motion and tropical cy-
clone wind speed. The tropical cyclone in FIGURE 7 is moving west at 15 KT. The winds associ-
ated with the hurricane are flowing cyclonically, or counter-clockwise around the surface center. The
average intensity of these hurricane-related winds is 85 KT. In this example, winds at point A, in the
northern semicircle (or right side with respect to the direction of movement) are stronger due to the
additive effects of the hurricane wind speed and the speed of movement for the tropical cyclone.
The result is winds to 100 KT in this area. Conversely, winds at point B, on the southern side (or left
side with respect to the direction of movement) are somewhat lessened because the forward speed of
the system actually opposes the direction of the winds in this region thereby decreasing the overall
surface winds in this area. The result is winds of 70 KT in the left side (southern semicircle) of the
example hurricane.
Unfortunately, the exact structure of the wind field in any particular tropical cyclone cannot be
solely defined by the concept discussed above. Location of the strongest thunderstorm activity and
location of the tropical cyclone with respect to other synoptic scale features both play a large part in
FIGURE 7: Illustration
of the additive effects of
storm motion and
tropical cyclone winds
over the left and right
semicircles of a
westward moving
tropical cyclone in the
North Atlantic.
10
the true wind field structure of any tropical cyclone. Similarly, the proximity to land and high terrain
can also greatly alter the structure of a tropical cyclone’s wind field. Forecasts of intensity issued by
the National Hurricane Center attempt to take all of these factors into account in their official wind
estimates.
State of the Sea
Winds in a tropical cyclone produce wind waves that move outward from the center of the system.
Wave height and propagation speed are dependent on the intensity of the storm, size of the system,
movement of the tropical cyclone, and length of the over-water trajectory for the winds (fetch). As
these wind waves move further from the center, height decreases and wavelength increases, creating
swell. The more intense the system, the larger the swell, the longer the period, and the further that
swell will propagate. Near the center and in the right-rear quadrant (with respect to the direction of
motion) of a tropical cyclone, seas are confused in a crippling combination of wind waves and
swells that are extremely difficult to navigate.
The swells from a tropical cyclone can travel on the order of 1000 NM per day and may extend in
excess of 2000 NM from the storm center. In the days before weather satellites and radio communi-
cation, these swells were often the first warning to the mariner of an impending tropical cyclone.
Hurricane Structure
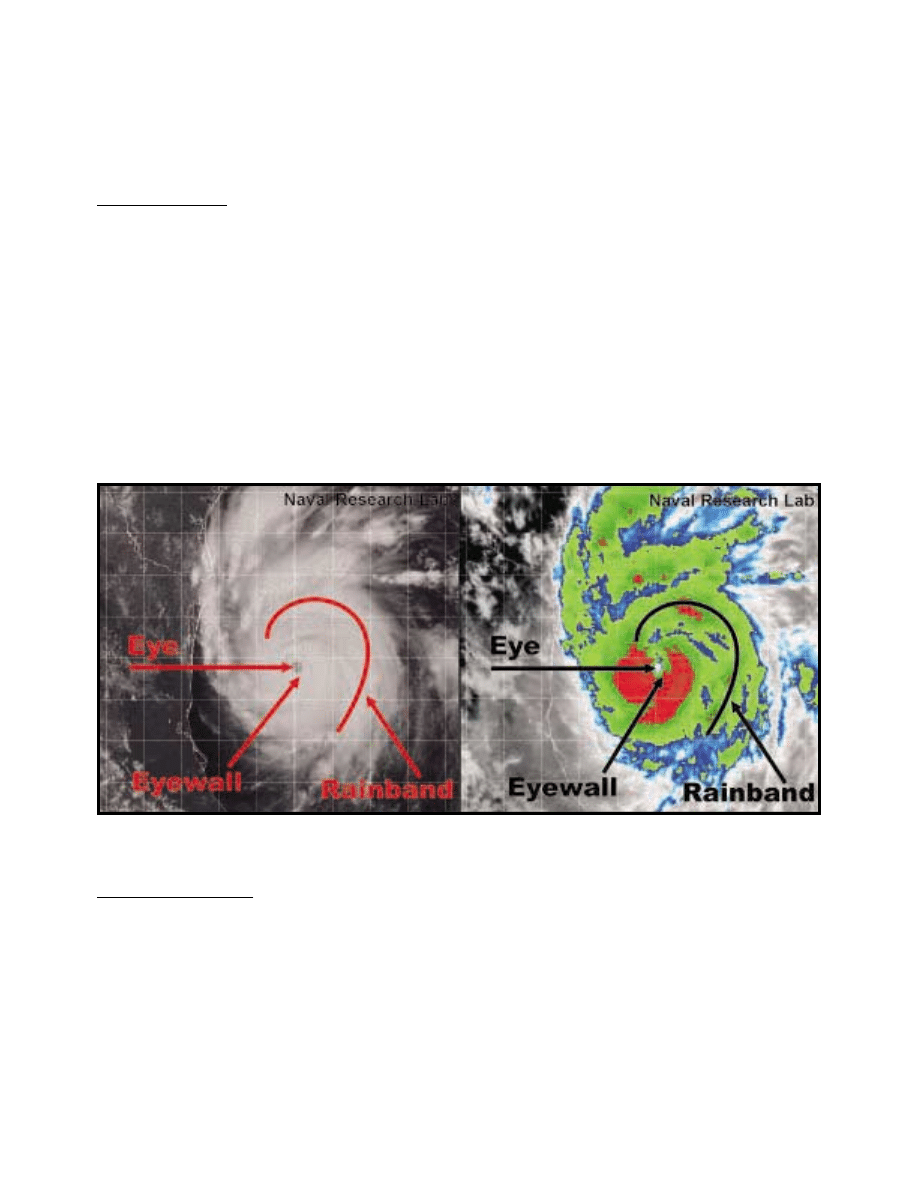
The main parts of a hurricane shown in FIGURE 8 are the rainbands, the eye, and the eyewall. Air at
the surface spirals in toward the center in a cyclonic (counter-clockwise) pattern, then turns upward
near the center to flow out the top in an anticyclonic manner (clockwise). At the very center of the
storm, air sinks, forming the warm core and relatively cloud-free eye.
The Eye
The hurricane’s center is a relatively calm, clear area usually 10-40 nautical miles wide containing
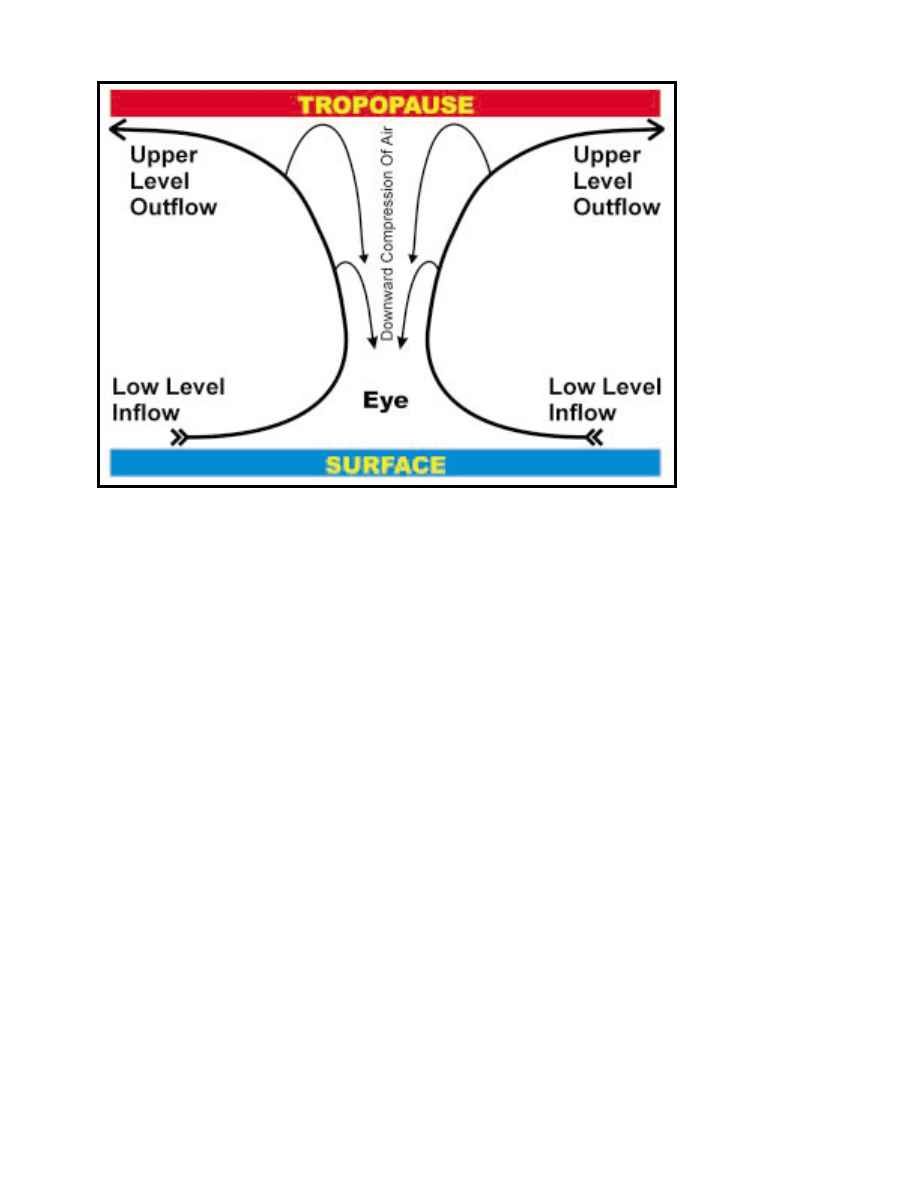
the lowest surface pressure in the tropical cyclone. The eye forms as the result of intense convection
within the eyewall (see FIGURE 9) that forces air to rise rapidly upward. Reaching the top of the
FIGURE 8: Visible (left) and Infrared (right) images of Hurricane Bret in the Gulf of Mexico taken at 1715 UTC 21
August 1999. Both images show the basic structures of eye, eyewall, and rainbands in a mature tropical cyclone.
11
troposphere, this air spreads out horizontally in an anticyclonic manner away from the center of the
system. However, some of the upward accelerating air is turned inward toward the center of the
circulation where it is then forced downward into the eye. This downward motion results in a
warming and drying of the air as it is compressed on it’s descent, helping to develop and maintain
the eye of a hurricane.
The Eyewall
The innermost convective ring of thunderstorms that surrounds the eye of a hurricane is known as
the eyewall. This region is home to the most intense winds and fiercest rains within a tropical
cyclone and has a typical width of approximately 10-15 NM. Additionally, it is the most significant
contributor in the vertical transport of warm moist air from the lower levels of the storm into the
middle and upper levels of the troposphere over a tropical cyclone. This is a fact that agrees with
observations throughout the North Atlantic basin where eyes and eyewalls are generally observed
only in systems with winds of strong tropical storm force or greater.
Changes in the structure of the eye and eyewall can cause changes in surface pressure and wind
speed in a tropical cyclone. The eye can grow or shrink in size, and double (concentric) eyewalls can
form, dissipate, and redevelop. All of these factors play a significant role in short-term influences of
hurricane intensity.
Rainbands
The storm’s outer rainbands (often with hurricane or tropical storm-force winds) can extend a few
hundred miles from the center. However, the extent of these features differs from storm to storm.
For example, Hurricane Andrew’s (1992) rainbands reached only 100 NM out from the eye, while
those in Hurricane Gilbert (1988) stretched out over 500 NM. These dense bands of thunderstorms,
which spiral slowly counterclockwise, range in width from a few miles to tens of miles and can be
up to 300 NM long. Increased gustiness of the winds associated with the convective cells in these
rainbands can sometimes exceed the current intensity of the tropical cyclone by more than 40%.
FIGURE 9: Side view
of a simplified model
hurricane. Air in the
lowest levels of the
system flows
cyclonically inward
toward the eyewall
where it rapidly turns
upward toward the
tropopause. Greater
atmospheric stability
above the tropopause
forces the air to flow
outward. However
some of this air is
pushed in toward the
cyclone center and
downward helping to
form and maintain
the eye.
12
These rainbands also serve as another major source of upward vertical motion and therefore play a
significant part in the transport process that removes warm moist ocean air and deposits it in the
middle and upper troposphere. In relation to their surroundings, this increased upward motion near
these rainbands can result in slightly lower surface pressures in the area when compared to other
regions in the vicinity of the rainbands.
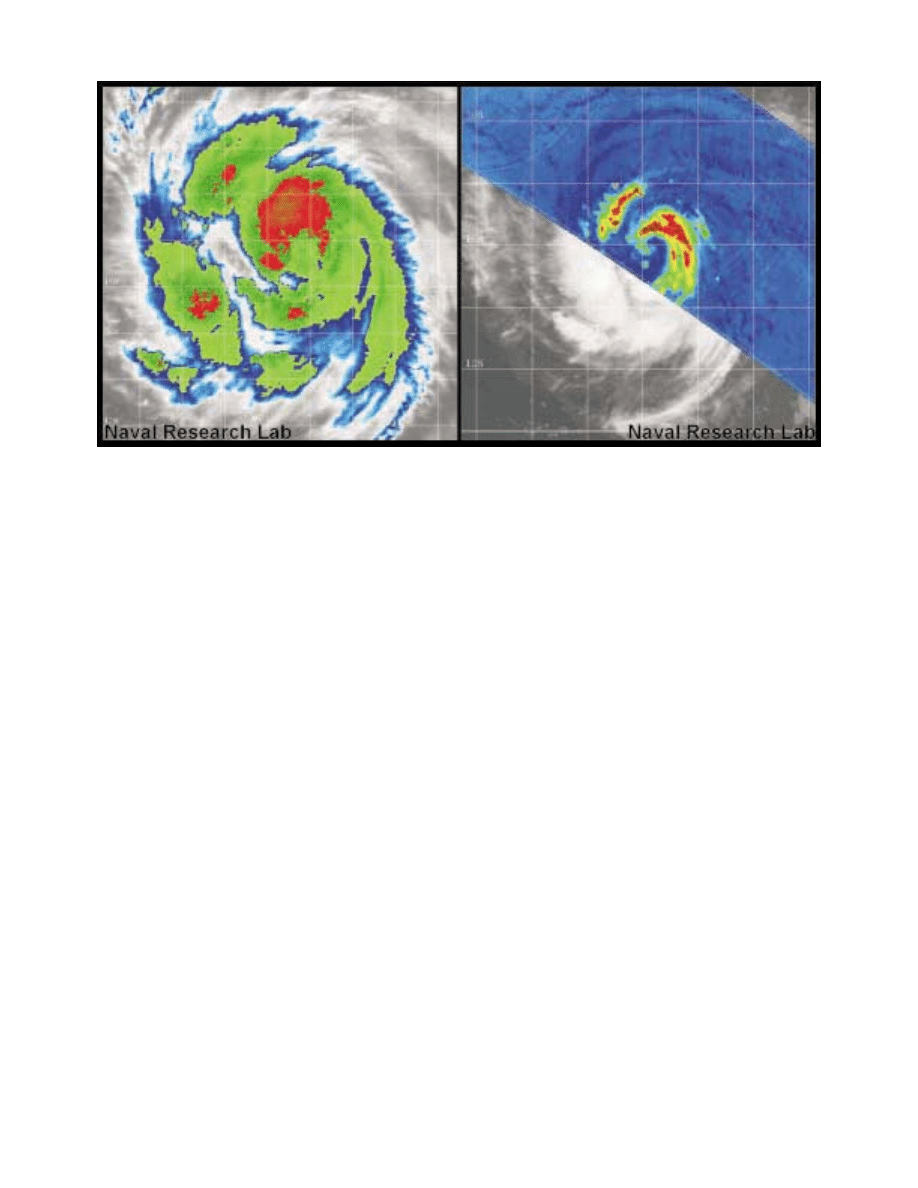
With all of the intense thunderstorm activity in a tropical cyclone, large amounts of high-level cirrus
clouds are generated in the upper regions of a tropical system. Sometimes these high-level clouds
actually obscure the surface center on satellite imagery making it difficult for forecasters to monitor
a storm’s position and development. However, recent advances in satellite technology and remote
sensing shown in FIGURE 10 are having positive impacts in the ability to see through these clouds
to find the low-level center of a tropical cyclone.
Observations At Sea
As mentioned earlier, tropical cyclones generally produce long period swells that propagate very far
from the system center. Additionally, small changes in surface pressure are observed near the
rainbands of a tropical cyclone, indicative of the great upward vertical motions in these areas. Also,
the overall presence of deep persistent thunderstorm activity in tropical cyclones causes large
amounts of high-level cirrus clouds to flow anticyclonically away from the system. Using this
information, we can briefly discuss four observations that may alert the mariner to an approaching
tropical cyclone.
FIGURE 10: Left is an infrared GOES-8 image of Gert taken 0815 UTC Sept 13 1999 which shows the surface center
obscured by high-level clouds thereby making a satellite position estimate difficult. Right is a TRMM (Tropical Rainfall
Measuring Mission) microwave image taken of Gert at 0802 UTC Sept 13 1999. This TRMM image clearly indicates
the circulation center along with rainbands E and NW of the center. This type of data has helped forecasters more
accurately determine the location of tropical cyclones.

13
Wind
In the absence of any other information, surface winds are normally the best guide to quickly deter-
mining the direction to the center of a tropical cyclone. The wind around a North Atlantic tropical
cyclone flows cyclonically or counter-clockwise around the actual low center. If an observer faces
into the direction of the true wind at the surface, the center of lowest pressure, and therefore the
center of the cyclone will be to the right hand side, bearing approximately 090 to 120 degrees. This
method is a good initial indication of the direction to the cyclone. However, be wary of using this
method in the vicinity of thunderstorms and squalls, as these features can temporarily change the
wind flow around a tropical system.
Wave
The direction of the swell encountered over open oceans is indicative of the direction to a tropical
cyclone’s center when that swell was originally generated. For example, assuming an active tropical
cyclone in the region, northeast swell observed by a vessel indicates the strong wind that generated
the swell and therefore the tropical system was located NE of the ship when the swell initially
developed. However, in shoaling water, this is a less reliable indication of tropical cyclone position
as the direction of swell in these areas is often altered by refraction.
Typical periods of swell in the Atlantic are generally 6-8 seconds. Swell periods of 9-12 seconds
occurring over the tropical and subtropical Atlantic Ocean during the hurricane season can be a
reasonable indicator of a tropical cyclone’s existence. Similarly, longer period swells of 12-15
seconds are even better indicators of a tropical cyclone’s presence in the basin. When this uncharac-
teristic long period swell occurs over open waters not normally accustomed to this type of swell,
such as the Gulf of Mexico and Caribbean Sea, the swell becomes a very good indicator that a
tropical system is in the vicinity.
Clouds
With a system 500-1000 NM away from a vessel, skies may appear relatively clear and any low
cumulus clouds will have a very shallow vertical extent. As the system and the vessel close to about
300-600 NM in distance, high level cirrus cloudiness will appear as a thin, wispy veil spreading
away from the direction of the tropical system. If the separation between the tropical cyclone and the
vessel continues to decrease, the cirrus will thicken and lower somewhat taking on the layered
appearance of a cirrostratus deck of clouds. Even closer to the storm, layered altostratus clouds will
begin to appear at the middle levels of the atmosphere. Finally, rainshowers and thick, heavy walls
of cumulonimbus clouds begin to indicate the proximity of outer rainbands in the tropical cyclone.
At this point the center of the system may still be as much as 200-400 NM from the location of the
ship.
Surface Pressure
Central pressures associated with tropical cyclones in the Atlantic can reach extreme values. For
example, a minimum central pressure of 888 MB was measured in Hurricane Gilbert in September
1988. However, average central pressures for weak tropical storms in the Atlantic Basin are around
1000-1005 MB. These values are well below the average surface pressures measured throughout the
subtropical and tropical Atlantic during the summer and fall (~1012 MB to 1020 MB). Therefore,
shipboard surface pressure readings below 1010 MB during hurricane season should be viewed with
at least some degree of caution.

14
Additionally, small rises and falls in the surface pressure can sometimes be noticed in shipboard
barometers as a “pumping action” in the pressure reading. This restlessness of the barometer is
related to the intense upward motions and extremely strong wind gusts associated with a tropical
cyclone along with the measurably lower surface pressures near the spiral rainbands surrounding
them. These small, yet measurable pressure rises and falls will often be superimposed on the overall
pressure fall as the tropical system approaches and can serve as a valuable indication that a tropical
system may be nearby.
Hurricane Motion
A hurricane’s speed and path are dependent upon two factors. First is the environmental steering
that it encounters while the second is the tropical cyclones own internal influences and secondary
steering influences. Typically, a hurricane’s forward speed averages around 13-17 KT. However,
some hurricanes stall, while others, normally during or after recurvature, can accelerate to more than
50 KT. Hurricane Hazel (1954) hit North Carolina on the morning of 15 October. Fourteen hours
later, Hazel reached Toronto, Canada where it resulted in 80 deaths. Some hurricanes follow a fairly
straight course, while others loop and wobble along their path. The key to understanding where a
tropical cyclone will move lies in completely understanding the steering environment in which that
tropical cyclone is found.
Environmental steering
Environmental steering is the most important influence on tropical cyclone motion. To begin, one
can consider as a first approximation the atmosphere in which the hurricane is embedded as a
constantly moving and changing “river” of air. The tropical cyclone is like a “leaf in the river” as it
flows along a path guided by the environment around it. Different features in this flow, such as high
and low pressure systems, fronts, and middle or upper-level circulations and jet streams can greatly
alter the speed and direction a hurricane may take.
Generally speaking, a tropical cyclone is guided along its path by the average direction and speed of
the environmental steering winds throughout the depth of the atmosphere in the vicinity of the
system. However, the more intense a tropical cyclone, the higher into the atmosphere one must look
to determine which environmental steering influences will have the greatest impact on storm mo-
tion. Weaker and poorly organized tropical systems will generally be guided by the environmental
steering in the lower to middle levels of the atmosphere (from the surface to 700 MB or approxi-
mately 10,000 ft). Alternatively, the strongest tropical cyclones will more often be guided by the
winds of the middle and upper troposphere near the system.
When discussing the concept of average steering winds throughout the depth of the atmosphere, it is
Chapter 2 - Hurricane Motion, Climatological Tracks & Genesis Regions
Having already discussed some of the important factors responsible for tropical cyclone develop-
ment and intensification, attention can now be turned to the mechanisms that influence movement
of these systems across the North Atlantic basin. Understanding tropical cyclone motion and the
track tendencies of these systems in the Atlantic is a precursor to planning and evaluating hurricane
avoidance options.
15
important to note that synoptic features at different levels of the atmosphere have different strengths
and positions that are constantly evolving and changing over time. This causes different levels of the
atmosphere to become more or less important to tropical cyclone steering at certain times along the
path of a system. For instance, strong high pressure at the surface with relatively light winds aloft
generally means that the low-level steering influences will dominate the track of a system. However,
if the surface flow weakens and the winds in the middle- or upper-levels of the atmosphere increase
then the middle- and upper-levels of the atmosphere will begin to dominate the tropical cyclone’s
steering. There are many different variations to this concept of steering winds and although environ-
mental steering is a fairly simple idea, nature is often much more complex in the manner which she
moves tropical cyclones.
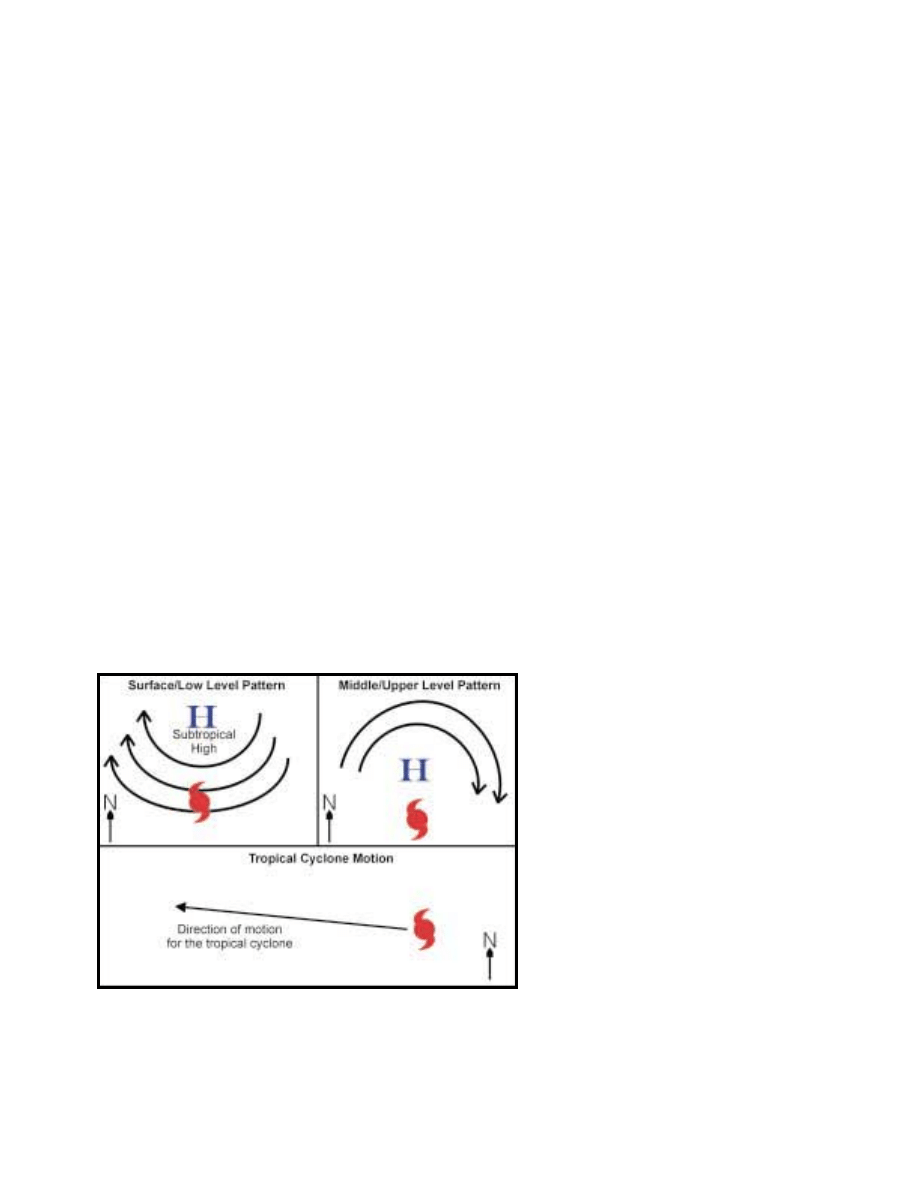
Included in this section are a few examples of steering winds and their impact on tropical cyclone
motion. First, when a typical system develops south of the subtropical ridge in the North Atlantic,
winds of the middle and upper troposphere are usually weak. Therefore, the dominant environmen-
tal steering factor is the low- to middle-level easterly winds south of the subtropical ridge. The
result is a general westward movement of the tropical cyclone across the Atlantic, as shown in
FIGURE 11.
In another scenario depicted in FIGURE 12, a system being steered westward by the subtropical
ridge can begin to be influenced by a surface front or trough in the middle or upper troposphere. In
these cases, the upper level southwesterly winds associated with the trough at those levels of the
atmosphere will begin to impart a northward component of movement to the tropical cyclone.
Additionally, the approach of a surface cold front will also erode the low-level steering for a system.
In this situation, if the system moves poleward enough to become captured in the prevailing west-
erly winds aloft, the tropical cyclone may continue moving north then northeast accelerating as it
recurves into the North Atlantic.
FIGURE 11 displays the general track of a tropical cyclone located
south of the subtropical ridge in the Atlantic. Steering for these
systems is predominantly the result of the low-level Easterly flow
south of the subtropical ridge. Lines and arrows in the top two
pictures denote wind flow at respective levels of the atmosphere. This
is the same convention used in figures 12-15.
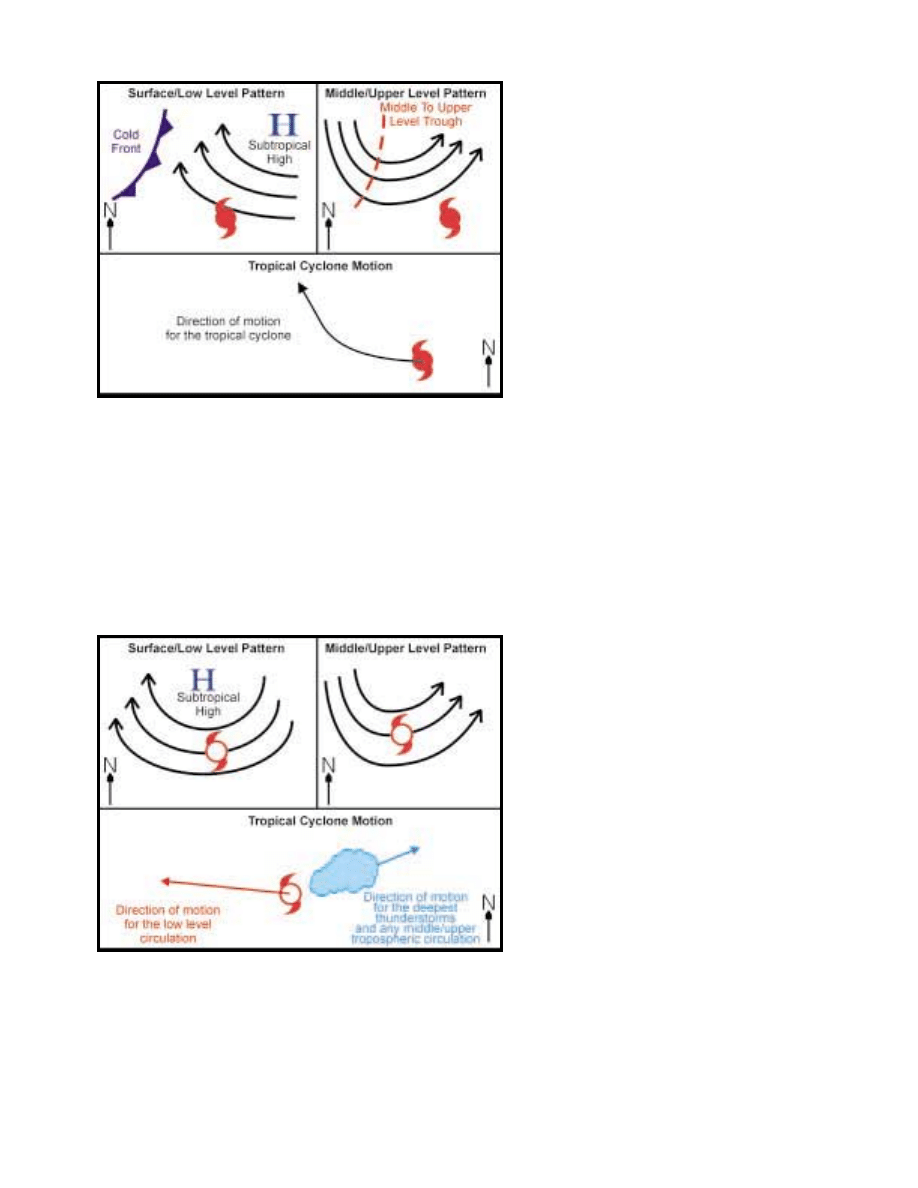
FIGURE 14 depicts yet another
example of the complex interactions
between steering levels and a tropical
cyclone. In this example, wind flow
in the middle and upper troposphere
over a tropical cyclone is strong
westerly. At the same time, the low-
level steering winds are strong east-
erly. This situation creates a highly
sheared wind environment that will
likely cause the cyclone to weaken.
However, as the system decays in
intensity, a situation may develop
where the deepest columns of thun-
derstorms become removed from and
located east of the low-level circula-
tion. Simultaneously, the surface
circulation of the tropical cyclone
continues to track westward in the
low-level steering flow.
16
In FIGURE 15 on the following page,
the steering flow at all levels of the
atmosphere is fairly weak. Without any
dominant steering winds to guide the
storm along, a tropical cyclone may
meander aimlessly, loop, or even become
stationary for periods of time. In these
instances, the tropical cyclone’s internal
steering effects will begin to impact
storm motion.
Lastly, larger and more developed tropi-
cal cyclones will also begin to effect the
environmental steering flow in which
they are embedded causing changes to
the synoptic scale features that surround
and influence their track. Well-developed
systems can modify nearby synoptic
features and change the expected steer-
ing pattern from those features. Some-
times, even subtle changes to the inten-
sity or structure of a tropical cyclone can
cause significant changes to its’ motion.
Internal Effects and Secondary
Influences
A second, much less noticeable factor
regarding tropical cyclone motion is the
storms internal effects and secondary
steering influences. The eyes of systems
often wobble by approximately 10-20
NM from the overall average direction
of motion. Additionally, other internal
influences can cause deviations to
motions that would not likely occur due
to environmental steering effects alone.
To further complicate the steering
concept, one secondary factor regarding
tropical cyclone motion tends to steer
tropical cyclones slightly right of the
primary steering influences. These
internal effects and secondary influences
are most often negligible when com-
pared to environmental steering but can
sometimes become noticeably more
important as a system grows in size and
intensity.
FIGURE 14: An extreme case of vertical wind shear. The opposed
steering winds at the surface & middle/upper levels of a storm can
result in deep convection & any middle to upper level circulation
becoming strongly tilted or detached from & located east of the
surface center as a result of strong westerly winds aloft. At the
same time, the low-level circulation of the tropical cyclone
continues to track westward in the easterly winds of the low-level
steering flow.
FIGURE 12 shows a likely track for tropical cyclones approaching
the western periphery of the subtropical ridge with the influences
of a middle to upper level trough and a surface front in the region.
Steering for systems in this setting are usually a complex
combination of both low-level and middle to upper level winds in
the area.
17
Hopefully, the examples in this section illustrate that environmental steering, internal effects and
secondary influences are quite complex, requiring the forecaster to look at more than just one single
level of the atmosphere to determine the direction of motion that a system may take. In some situa-
tions the low-level steering will dominate. In other instances, a combination of the low and middle-
levels will combine to steer a tropical system. Yet in other cases, strong environmental steering
winds throughout the entire atmosphere or the lack of any steering winds altogether, will determine
the track of a tropical cyclone.
In any event, track forecasting of tropical cyclones remains difficult at best and requires substantial
amounts of information and data on the storm and the environment in which it is found. Track
forecasts of tropical cyclones, issued by the National Hurricane Center, account for all of the influ-
ences discussed above to the greatest extent possible. Through the use of complex computer simula-
tions or “hurricane models”, weather satellites, environmental sampling of the storms by NOAA and
Air Force weather reconnaissance aircraft, and all available surface or ship observations, National
Hurricane Center forecasts attempt to accurately predict the environmental steering and forecast
movement of these severe weather events.
FIGURE 15 shows the effects of little to no
environmental steering on a tropical cyclone. In
this example the easterly winds south of the low-
level high center are fairly weak. At the same time,
middle- & upper-level winds over the hurricane
are almost non-existent. This combination causes
weak environmental steering and allows the
hurricane’s internal steering effects to begin
impacting motion. Systems in this regime can often
behave in a poorly predicted cycle of slow loops,
wobbles, and other erratic motions.
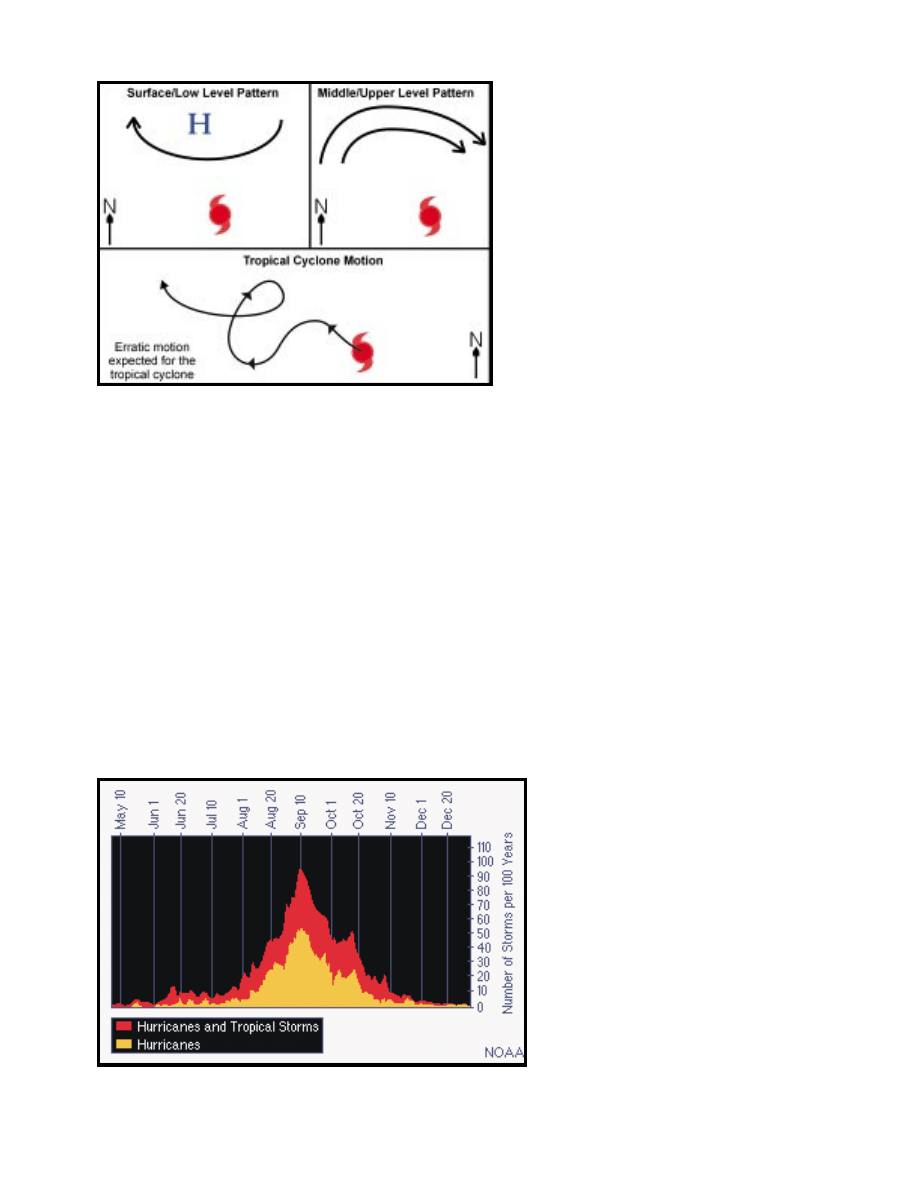
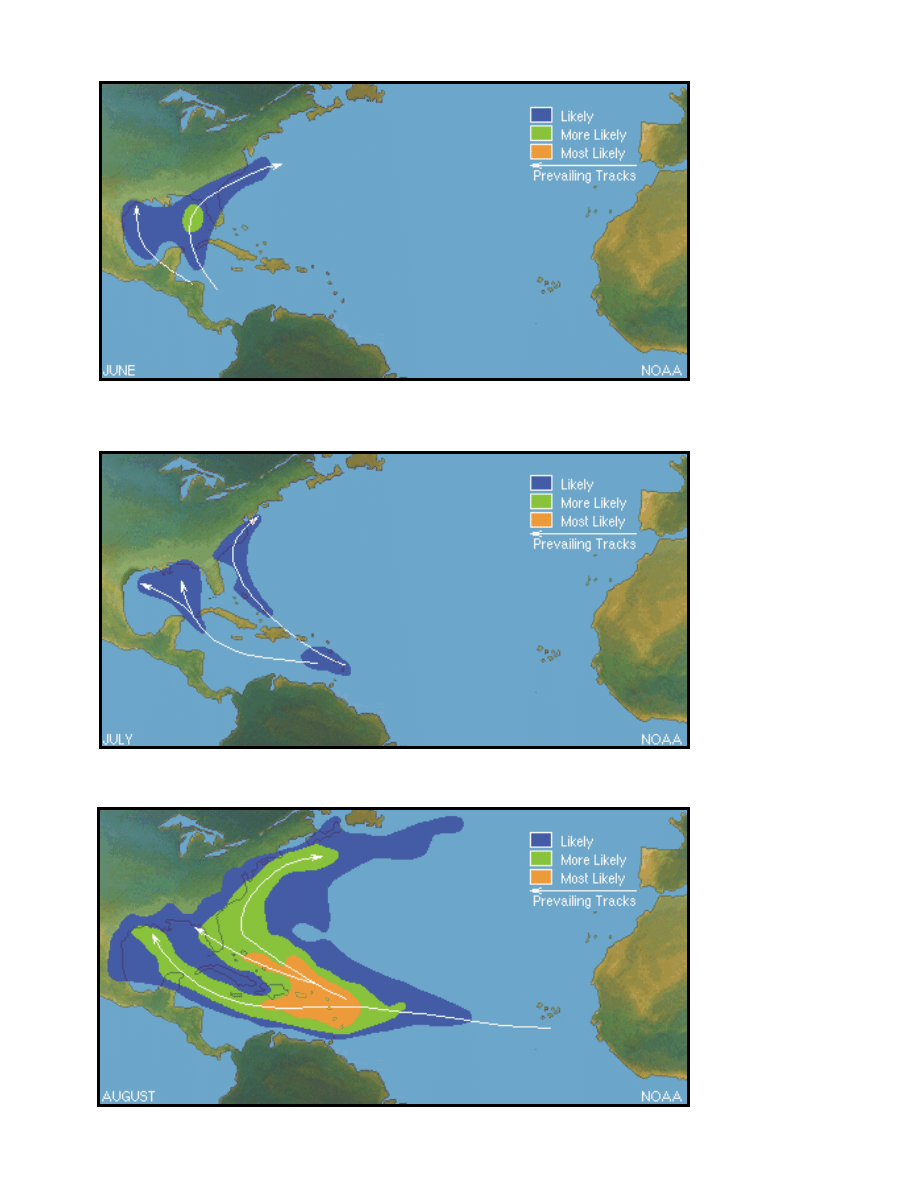
FIGURE 16: Frequency of tropical cyclone activity in the Atlantic
Basin.
Climatological Tracks & Gen-
esis Regions
As shown in FIGURE 16, middle
August through late October is
usually the most active period for
tropical cyclones in the North
Atlantic basin with September 10
th
being the peak of the season. FIG-
URES 17a-f show the general
pattern of preferred locations for
tropical cyclone development and
the climatological average tracks
these systems often take through the
North Atlantic.

18
These figures are included as an aid to the mariner in visualizing some general characteristics of
Atlantic basin tropical cyclone tracks and genesis regions. From these graphics, it can be seen that
early season storms tend to develop in the Western Caribbean Sea and the Gulf of Mexico. By the
middle of the season, the focus for development shifts eastward to include most of the tropical
Atlantic and Caribbean Sea. This is the portion of the season that normally results in the strongest
tropical cyclones. Tropical cyclones developing during this portion of the season often take an
extended westward track across warm Atlantic waters, south of the Atlantic subtropical ridge in an
environment of little wind shear thereby placing them in a favored region for significant develop-
ment. By the latter part of the season, tropical cyclone development once again shifts westward in
the Caribbean Sea, Gulf of Mexico and the western Atlantic.
These figures must be looked upon as long-term averages and comparisons to current tropical
cyclone tracks in order to aid the mariner in voyage planning and long-range hurricane avoidance
considerations. The graphics only depict average conditions, tracks, and locations of tropical cy-
clones. Tropical cyclones can originate in many different locations, traveling much different paths
than these climatological averages might indicate. Nonetheless, these figures should give the mari-
ner a better sense of potentially active areas during the Atlantic hurricane season.
19
FIGURE 17a:
Tropical cyclone
climatological
tracks and
development
regions for June.
FIGURE 17b:
Tropical cyclone
climatological
tracks and
development
regions for July.
FIGURE 17c:
Tropical cyclone
climatological
tracks and
development
regions for August.
20
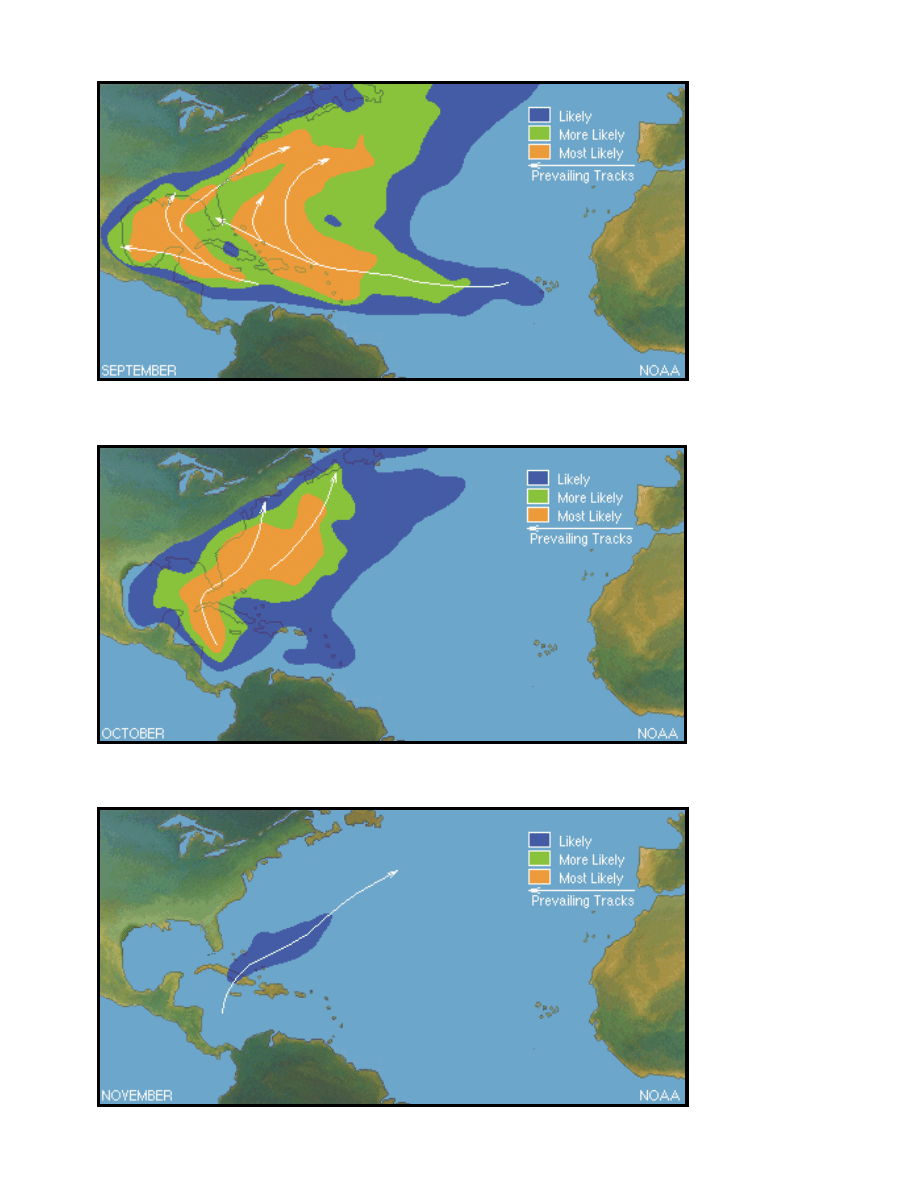
FIGURE 17d:
Tropical cyclone
climatological
tracks &
development
regions for
September.
FIGURE 17e:
Tropical cyclone
climatological
tracks and
development
regions for
October.
FIGURE 17f:
Tropical cyclone
climatological
tracks &
development
regions for
November.

21
Chapter 3 - Monitoring North Atlantic Tropical Cyclones
Knowing the basic structure, development, and movement of tropical cyclones is important to the
mariner in order to make knowledgeable navigation decisions to remain clear of these tempests.
However, a constant, vigilant watch on current and forecasted tropical weather conditions is para-
mount to avoiding loss of life and property at sea or getting caught unaware of a tropical cyclone
threat.
In order to accomplish this, numerous tropical weather products are created and distributed by the
Tropical Prediction Center/National Hurricane Center (TPC/NHC) that can help to keep the mariner
alert to existing or impending tropical cyclone activity. Various forecasts and warnings, along with
other significant information regarding tropical and subtropical cyclones in the Atlantic Basin (north
of the Equator including the Caribbean Sea and Gulf of Mexico) are the responsibility of TPC/NHC
in Miami, FL. The U.S. Coast Guard, as part of it’s maritime safety responsibilities, is tasked with
providing the majority of communications circuits and coastal broadcast facilities used to transmit
these weather products to the seafarer. Finally, the National Weather Service issues all of these
products in a variety of formats via a wide range of communications methods in order to support as
broad a scope of maritime users as possible.
In this chapter, we will discuss the many tropical cyclone and marine products available from NHC
and elsewhere within the National Weather Service. Additionally, we will discuss the methods
currently available to obtain each product. In doing this, we will closely review the Tropical Cy-
clone Forecast/ Advisory, discussing the format and content of this most critical message produced
for the Mariner. Finally, TABLE 10 was compiled at the end of this chapter listing various tropical
cyclone products and where they may be obtained in near-real-time.
Tropical Cyclone Text Products for the Mariner
Tropical Weather Discussion (TWD)
The TWD provides a detailed discussion of convective activity and the current location of synoptic
features including tropical waves found throughout the Atlantic basin south of 32N latitude to the
Equator from the coast of Africa to Central & South America. This product describes important
tropical weather features noted in satellite imagery, radar, rawinsonde data and surface observations.
The TWD is issued four times daily throughout the year highlighting any areas of persistent convec-
tive activity, some of which may be a precursor to tropical cyclone development. The TWD serves
as a guide to mariners on potentially active tropical weather areas in the tropical North Atlantic. The
transmission times of this product are 0005, 0605, 1205, and 1805 Universal Time Coordinated
(UTC).
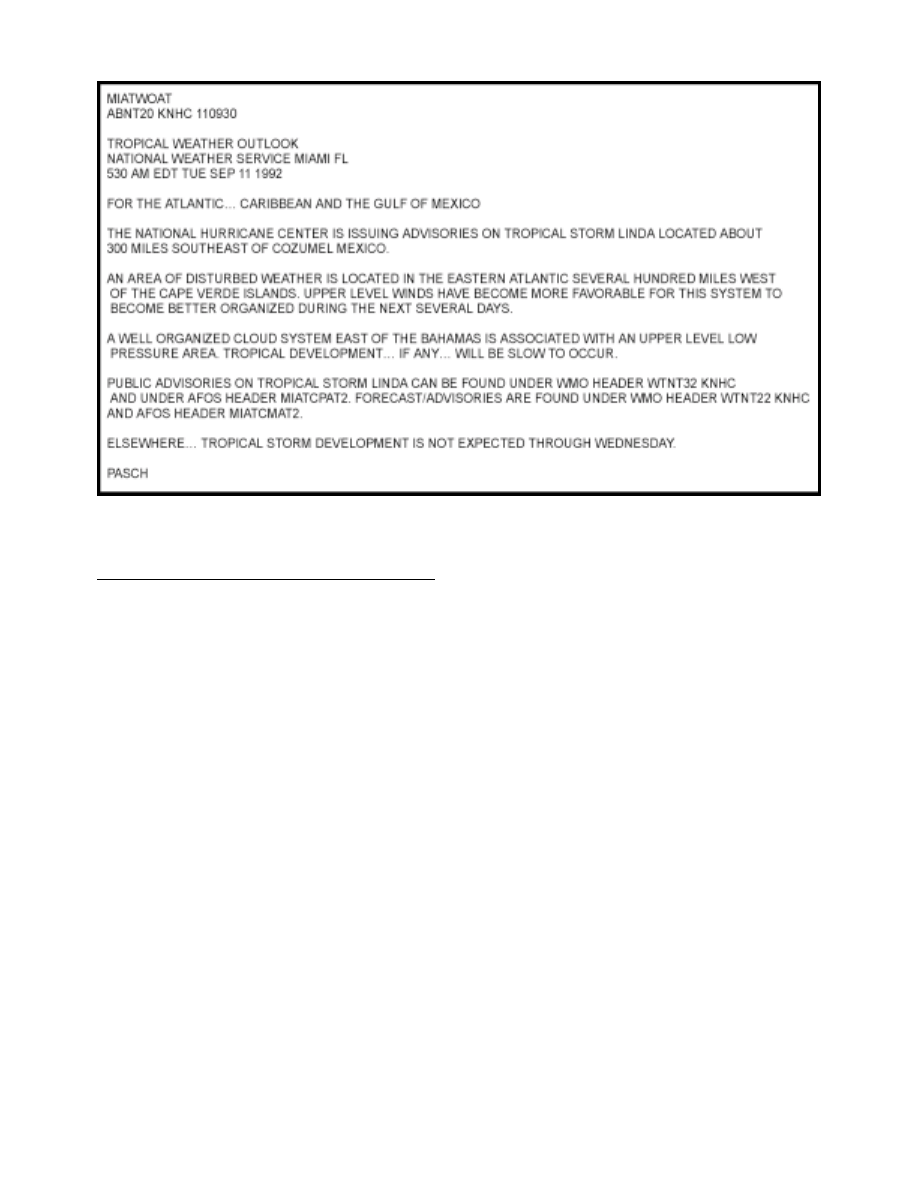
Tropical Weather Outlook (TWO)
The TWO briefly describes significant areas of disturbed weather & tropical disturbances in the
Atlantic Basin. Additionally, this product discusses the potential for further development of these
features out to 48 hours in the future. The TWO also lists any currently active tropical cyclones in
the basin. It is issued four times per day during the Atlantic hurricane season and serves as a valu-
able aid to the mariner in maintaining tropical weather awareness and potential tropical cyclone
activity in the North Atlantic. The transmission times for this product are 0530, 1130, 1730, & 2230
Eastern Local Time. FIGURE 18 is a typical TWO written near the peak of the Hurricane Season.
22
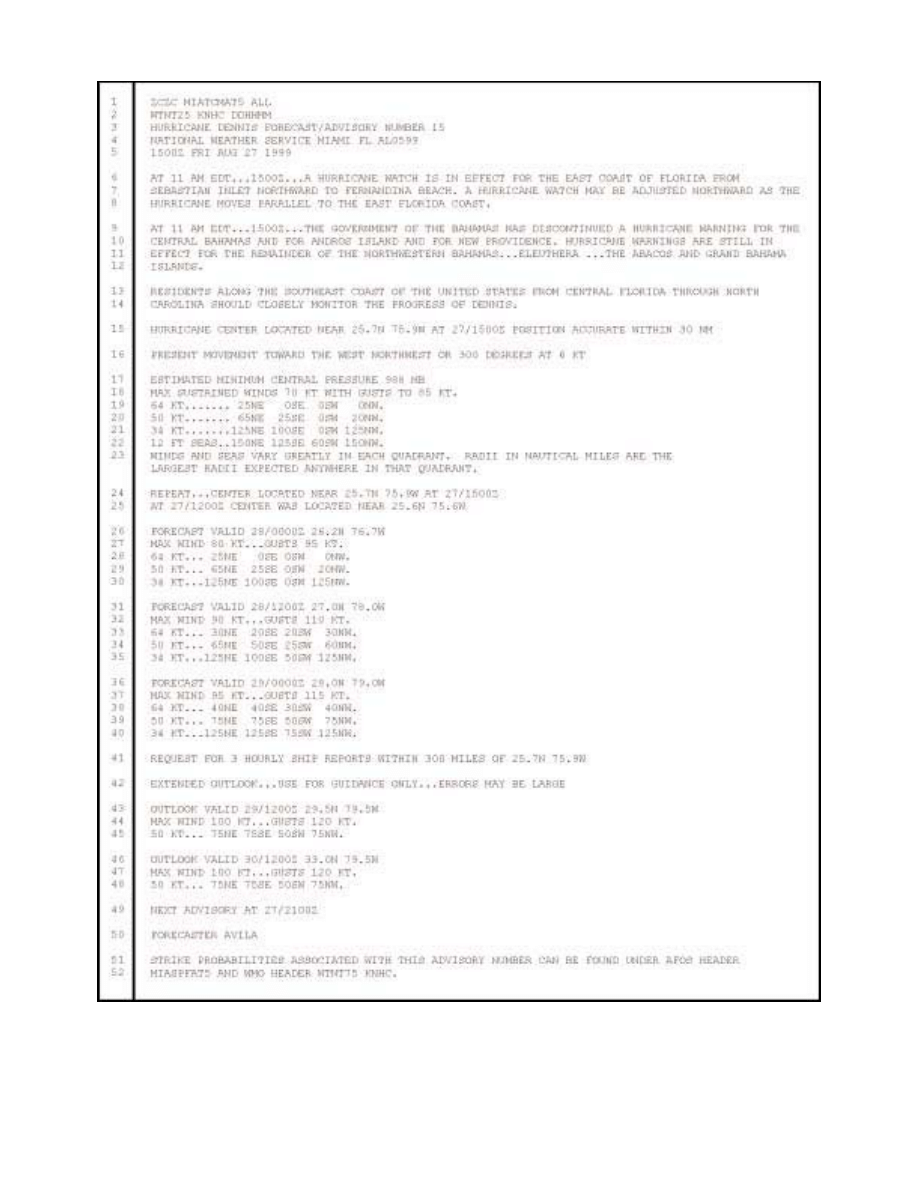
Tropical Cyclone Forecast/Advisory (TCM)
This is the cornerstone of all NHC tropical cyclone products for the mariner. A TCM is issued when
meteorological data indicates that a tropical (or subtropical) cyclone has formed. Subsequent advi-
sories are issued at 0300, 0900, 1500, 2100 UTC for the life of the tropical cyclone. Special adviso-
ries or forecasts are issued whenever unanticipated significant changes occur. Additionally, a special
forecast/advisory may also be sent in instances which require coastal hurricane or tropical storm
watches or warnings be issued immediately.
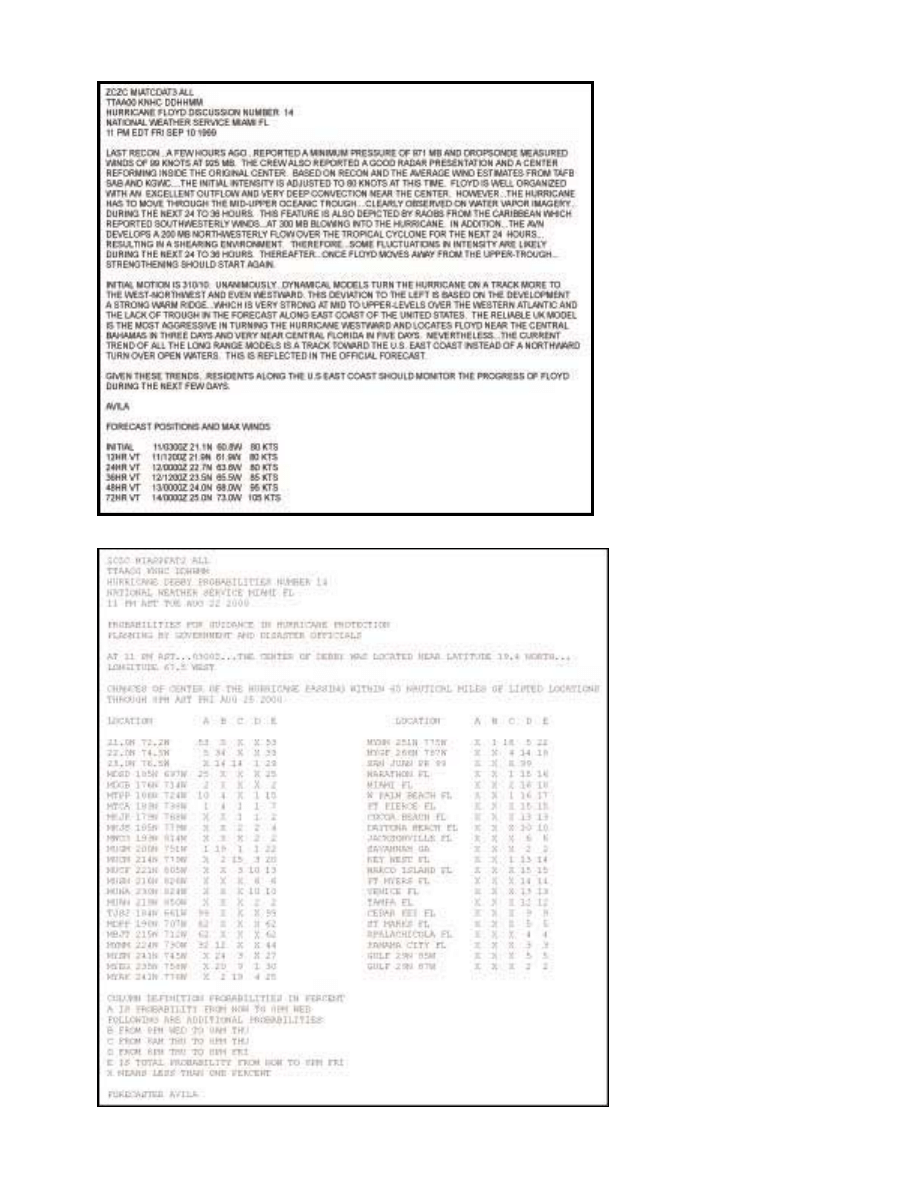
FIGURE 19 shows a typical TCM containing forecasted position & intensity of a tropical cyclone at
12, 24, 36, 48, and 72 hours into the future. Additionally, this product possesses valuable informa-
tion on the wind field of the tropical cyclone. Once a system develops to the tropical depression
stage, this product is issued every 6 hours until the cyclone either becomes extra-tropical or weakens
to below tropical depression status.
Line 1: Contains the National Weather Service header for the particular system (MIATCMAT5).
There are actually five different headers for this product. They are MIATCMAT1 through
MIATCMAT5 with each numbered system retaining it’s own particular header for the duration of
it’s life.
Line 2: Contains the World Meteorological Organization header (WTNT 25) followed by the four-
letter identifier for the National Hurricane Center (KNHC). Similar to line 1, there are actually five
WMO headers (WTNT 21 through WTNT 25). The last character string in this line is the Day Hour
Minute (DDHHMM) the product was actually sent from NHC.
FIGURE 18: Typical Tropical Weather Outlook during the peak of the Hurricane Season.
23
FIGURE 19: Typical Atlantic Tropical Cyclone Forecast/Advisory.

24
Line 3: Numbering system for the Tropical Cyclone Forecast/Advisory
(HURRICANE DENNIS FORECAST/ADVISORY NUMBER 15).
All tropical cyclone forecast/advisories are numbered sequentially each year; e.g.,
Tropical Depression ONE Forecast/Advisory Number 1
-The first tropical depression of the calendar year
Tropical Depression ONE Forecast/Advisory Number 2
-The second advisory on TD #1
Tropical Storm Anita Forecast/Advisory Number 3
-System intensifies to tropical storm force
Hurricane Anita Forecast/Advisory Number 4
-System intensifies to hurricane force
Tropical Depression Anita Forecast/Advisory Number 5
-System weakens to a tropical depression
Line 4: Location of center issuing the forecast/advisory (NATIONAL WEATHER SERVICE MI-
AMI FL) along with an internal agency tracking code specific to each numbered tropical/subtropical
system in the basin during a calendar year. In the example of FIGURE 19, AL0599 indicates that
Dennis is the 5
th
tropical cyclone in the Atlantic Basin during calendar year 1999.
Line 5: The nominal product time (1500Z FRI AUG 27 1999). Please note that NHC attempts to
issue products shortly before this time. Hence, this time will usually not be identical to the time
indicated in line 2 of the message.
Lines 6-14: This section of the message is used to disseminate current watch/warning status and
changes to status for the particular system. Information in this section of the message may be omit-
ted in instances where there are no active or expected watches/warnings or other administrative
notes to issue.
Line 15: This line gives the tropical cyclone center position including the accuracy of that position
at the time the product was issued. (0300/0900/1500/2100 UTC)
Line 16: Gives the present motion of the tropical cyclone.
Line 17: Reports the estimated minimum central pressure of the system at the time the message was
issued.
Line 18: Reports the maximum sustained winds and expected gusts associated with the tropical
cyclone at the time the message was issued.
Lines 19-23: Defines the 64 KT, 50 KT, and 34 KT wind radii of the system at the time the message
is issued from NHC. Additionally, Line 22 defines the radii of the 12-foot significant wave heights
associated with the tropical cyclone.
Line 24: Repeats the position of the center at the time the message was issued from NHC.
25
Line 25: Reports the position of the tropical cyclone center at the latest synoptic time. Synoptic
times are 0000, 0600, 1200, and 1800 UTC and always precede the issue time of a standard TCM by
3 hours.
Lines 26-30: Forecasts the position, intensity, and wind radii for the tropical cyclone 12 hours after
the latest synoptic time given in line 25.
For example, the advisory in FIGURE 19 was issued on the 27
th
at 1500 UTC.
The latest synoptic time was the 27
th
at 1200 UTC as shown in line 25 of the
TCM. Therefore, the 12 hour forecast position is valid 12 hours after the latest
synoptic time, or the 28
th
at 0000 UTC.
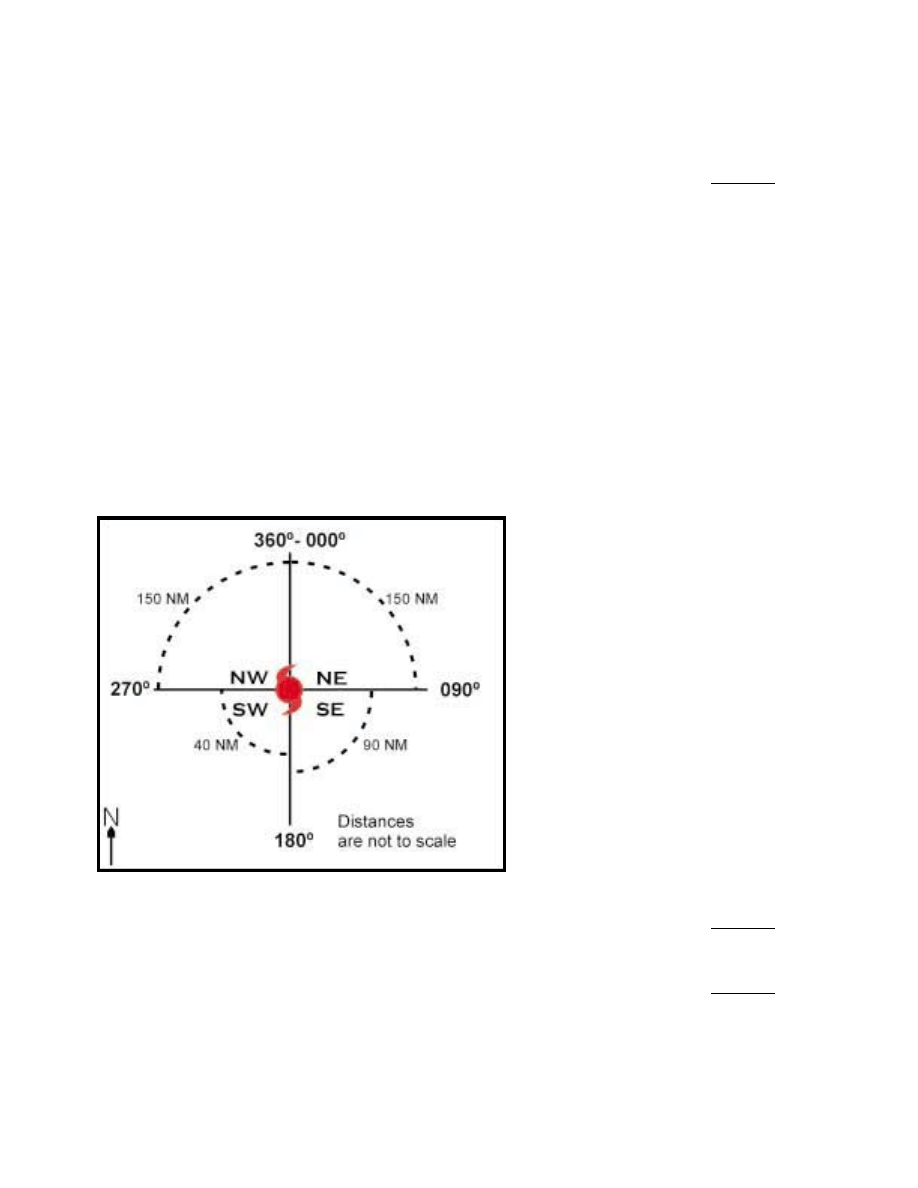
DEFINITION OF WIND RADII BY QUADRANT: Uses the largest radius of
that wind speed found in the quadrant. For example, NHC quadrants are
defined as NE (0°-90°), SE (90°-180°), SW (180°-270°), and NW (270°-360°).
Given a maximum 34 KT radius of 150 NM at 0°, 90 NM at 120°, and 40 NM
at 260°, the following would be carried in the forecast/advisory: 150NE 90SE
40SW 150NW. FIGURE 20 is a graphical representation of the wind radii by
quadrant.
FIGURE 20: Graphical depiction of the wind
radii quadrant system used in NHC Tropical
Cyclone Forecasts/Advisories. This system
allows for reasonably certain depiction of
current and forecasted wind field structure in a
tropical cyclone. In the example, the wind field
would be given as 150 NE, 90 SE, 40 SW, and
150 NW around the center of the tropical
cyclone. Note that cardinal directions are
relative to true north.
Lines 31-35: Forecasts the position, intensity, and wind radii for the tropical cyclone 24 hours after
the latest synoptic time given in line 25.
Lines 36-40: Forecasts the position, intensity, and wind radii for the tropical cyclone 36 hours after
the latest synoptic time given in line 25.
NOTE: TCM format is not completely fixed. When applicable, storm surge forecasts can be in-
serted before line 41.

26
Line 41: REQUESTS 3 HOURLY OBSERVATIONS FROM SHIPS WITHIN A CERTAIN DIS-
TANCE FROM THE TROPICAL CYCLONE.
All analysis and forecasts of tropical cyclone activity
rely heavily on local ship observations in order to obtain
the best estimate of the synoptic patterns guiding storm
motion and intensity. Any observations recorded near a tropi-
cal cyclone are used to determine current wave heights &
wind fields associated with the tropical cyclone.
Line 42: Introduces the extended outlook section that provides forecast position, intensity, and 50
KT wind radii at the 48 and 72 hour periods.
Lines 43-45: Forecast of position, intensity, and 50 KT wind radii for the tropical cyclone 48 hours
after the latest synoptic given in line 25.
Lines 46-48: Forecast of position, intensity, and 50 KT wind radii for the tropical cyclone 72 hours
after the latest synoptic given in line 25.
Line 49: States the next issue time for the TCM.
Line 50: Name of NHC Forecaster who wrote the forecast/advisory.
Lines 51-52: Lists NWS and WMO headers for strike probability information on the tropical cy-
clone when applicable.
Tropical Cyclone Discussion (TCD)
This product is issued by NHC to explain the Hurricane Forecaster’s reasoning behind the latest
analysis and forecast of a tropical cyclone. Similarly, the message may also provide indications of
track or intensity tendencies that may be occurring in the tropical cyclone while possibly providing
some discussion/insight on the current computer model guidance for the tropical cyclone. The
product also contains 12 hour through 72 hour forecast positions and maximum wind speed fore-
casts for each time period, while providing other significant meteorological and/or emergency
management information. The issue times of the discussion are 0300, 0900, 1500, 2100 UTC to
coincide with the release of the TCM. This product can often times help the mariner to gauge the
confidence level that NHC meteorologists have regarding a tropical cyclone’s current or future track
and intensity. FIGURE 21 on the next page is an example of a TCD.
Tropical Cyclone Strike Probabilities
This product gives the percentage chance of a tropical or subtropical cyclone passing within 75 NM
to the right or within 50 NM to the left of a specified point, looking in the direction of cyclone
motion. The probabilities are given for the time periods 0-24, 24-36, 36-48, 48-72, and 0-72 hours.
They are issued every 6 hours with the TCM for tropical storms, hurricanes, and tropical depres-
sions forecast to become tropical storms. Information in this product may be useful to the mariner
needing to make decisions on ports of possible weather haven. FIGURE 22 on the following page is
an example of the information provided in this product.
27
FIGURE 22: Typical Tropical
Cyclone Strike Probability
Message.
FIGURE 21: Typical Tropical
Cyclone Discussion.

28
Coastal, Offshore, and High Seas Forecast Text Products
These products are issued four times daily throughout the year. The emphasis in these forecasts is
predicting marine conditions for the next 36 to 48 hours within their respective areas of responsibil-
ity that together cover the North Atlantic Ocean from 7N to 65N Latitude, west of 35W Longitude
including the Caribbean Sea & Gulf of Mexico. TABLE 1 below contains more information on issue
times and specific regions for these products. During periods of tropical cyclone activity in or near
particular forecast zones, these products will include the latest information on winds, seas, and other
weather hazards related to the tropical cyclone. Additionally the High Seas product will contain
tropical cyclone positions/intensities at the initial and forecast times for 36, 48, and 72 hours. 12 or
24 hour forecast positions/intensities would only be given in cases where the system is forecast to be
upgraded/downgraded between different classes of tropical cyclones (Tropical Depression to Tropi-
cal Storm, Hurricane to Tropical Storm, etc.) during that time frame.
TABLE 1: Issue times and areas of responsibility for coastal, offshore and high seas forecasts.
FORECAST
PRODUCT
NAME
ISSUE TIME
(See notes in
each section)
MARINE AREAS OF RESPONSIBILITY
COASTAL
WATERS
430AM, 1030AM,
430PM, 1030PM
Given in local
standard time.
Issuance times
are 1 hour later
for those states
using Daylight
Savings Time
From Maine to Georgia - within approximately 20-25 NM of the
coast including rivers, inlets, and bays.
From Florida through Texas – within approximately 60 NM of the
coast including rivers, inlets, and bays.
Puerto Rico – from the coast to the 100 fathom curve.
New England
Continental Shelf & slope waters
from 25 NM offshore to the Hague
Line… except to one thousand
fathoms S of New England
W Central North Atlantic
Continental Shelf & slope waters
beyond 20 NM offshore… S and E
of one thousand fathoms to 65W
SW North Atlantic &
Caribbean Sea
Caribbean Sea and SW N Atlantic
OFFSHORE
WATERS
Times are similar
to Coastal Marine
Forecasts
Gulf Of Mexico
Gulf of Mexico
HIGH SEAS
0430, 1030,
1630, 2230
(Listed in UTC)
7N-67N west of 35W in the North Atlantic Ocean
Tropical Cyclone Graphic Products for the Mariner
Tropical Surface Analysis
This product is generated by the Tropical Analysis & Forecast Branch of TPC and is issued four
times per day based on the synoptic times of 0000, 0600, 1200, and 1800 UTC. This graphic depicts
latest position and intensity of all synoptic scale surface features including highs, lows, fronts,
29
troughs, and tropical waves. This
product also denotes the 24 hour
forecast position and intensity of all
high and low centers over open wa-
ters. Additionally, the large-scale
surface flow pattern is depicted
through isobaric (lines of constant
pressure) analysis at 4 MB intervals
throughout the entire region with
intermediate 2 MB spacing in the
Tropics. When a tropical cyclone is in
the analysis, the latest position, inten-
sity, and current motion can be found
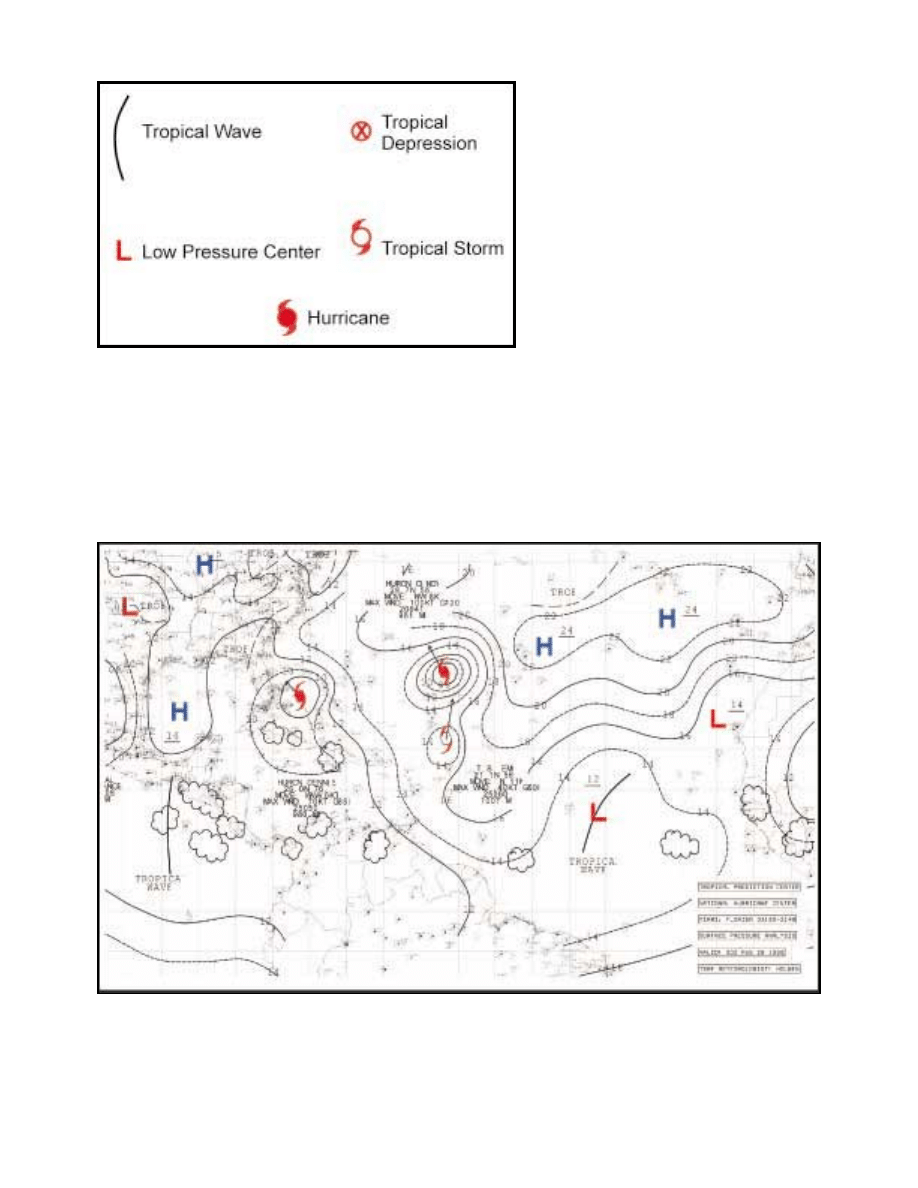
on this chart. FIGURE 23 shows
typical tropical symbology used to
depict surface features on these charts.
FIGURE 24 is an example of the
tropical surface analysis. For further
information on receiving this chart at
sea, see TABLE 10 at the end of the
chapter for details.
FIGURE 23: Examples of symbology used in the tropical surface
analysis
FIGURE 24: Example of a Tropical Surface Analysis. Current tropical cyclone locations, intensities, movements, &
pressures are listed in the analysis near the symbol for each system. Additionally, location of latest 24 hour forecast
position of the tropical cyclone is also included in this chart. The tip of the arrow originating from the center of each
tropical cyclone symbol indicates the 24 hour forecast position. If the arrow is absent, then system 24 hour forecast
position is nearly stationary.
30
Wind/Wave Forecast
Chart
There are two forms of
this product. The first is
a NOWCAST and 12
hour forecast graphic of
wind & sea conditions in
the Atlantic from 9N to
32N west of 50W includ-
ing the Caribbean Sea &
Gulf of Mexico. This is
issued 4 times per day
within 1 hour of the
synoptic times (0000/
0600/1200/1800 UTC).
The second version of
this product is a 24 hour
and 36 hour forecast
graphic covering the
same area of the Atlantic.
It is issued 2 times per
day at the synoptic times
of 0000 and 1200 UTC.
During periods of tropi-
cal cyclone activity, these
products depict the latest
forecast position &
intensity of the tropical
cyclone as based on the
most recent TCM.
FIGURE 25 shows an
example of this graphical
forecast product. Meth-
ods of receiving this
information at sea are
listed in TABLE 10.
Tropical Cyclone Graphic Products
There are five graphical products created by NHC whenever a tropical cyclone is active in the
Atlantic basin. They are; coastal watches & warnings, strike probabilities, cumulative wind distribu-
tion, wind speed forecast & probability, and wind speed probability table. These graphics are avail-
able in the graphics section of each active tropical cyclone on the NHC web site (address given in
TABLE 2). All are easy to interpret and, if available, may help the mariner in the hurricane avoid-
ance decision making process. Of particular interest are the strike probabilities graphic which show
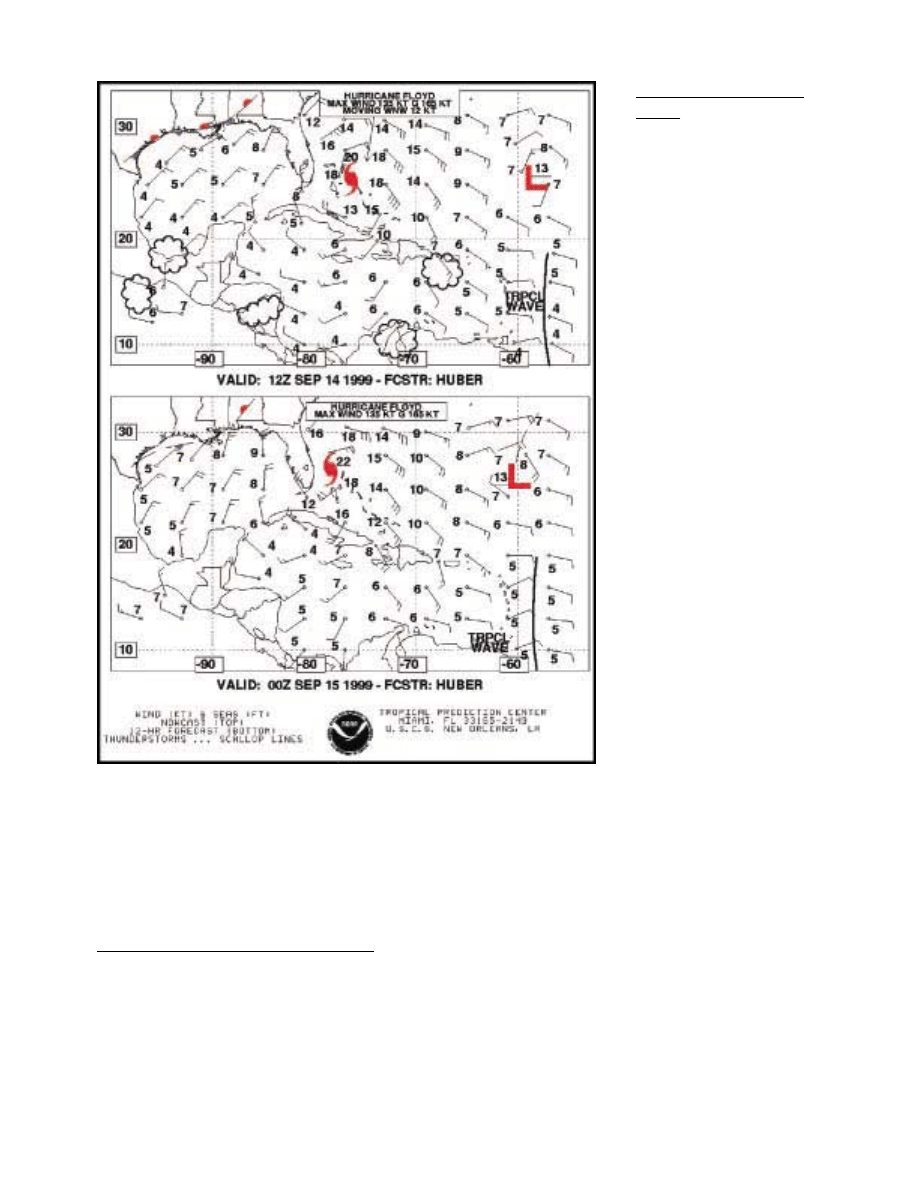
FIGURE 25: Example of NOWCAST and 12 Hour Forecast Chart. Latest forecast
position of the tropical cyclone is depicted in this chart by the center of each
tropical cyclone symbol. Seas are depicted in combined wind wave & swell, given
in feet, next to each wind barb (speed & direction). Any current or forecasted
convection of moderate or stronger intensity & scattered or greater coverage will
be show in scalloped lines on these charts, as noted in the upper panel of this
figure in the Mona Passage between Puerto Rico and Hispaniola.

31
the distribution of risk based on the latest 72-hour TCM forecast track. Also note the cumulative
wind distribution that graphically illustrates how the size of the storm has changed, and the areas
affected so far by tropical storm & hurricane force winds. A brief explanation of the information
shown in each of the other graphics is included with the products on the NHC web site.
NWS Marine Prediction Center (MPC) Products
All of the text offshore & high seas forecast products, in addition to the graphical products de-
scribed throughout this manual, have a companion product available from MPC. Products issued by
both MPC & TPC are standardized in format. This allows for a near seamless transition for sailors
in need of information regarding tropical cyclones & maritime weather throughout the Atlantic west
of 35°W from 7°N to 67°N with the MPC area of responsibility found north of 31°N in this region.
Some of the graphical products available from MPC are listed in TABLE 10 at the end of this
chapter. More detailed information on MPC products and availability can be found in the BOSTON
HF Fax schedule or by visiting the Marine Prediction Center web site (address listed in TABLE 10).
Methods to acquire products from either of these NWS production centers are the same and will be
discussed in much greater detail in the following section.
Receiving Tropical Cyclone Products At Sea
Regardless of how accurate NHC forecasts of tropical cyclone activity are, they are useless unless
reliable and timely methods are available to get this information to the mariner. In this subsection,
we will discuss the many ways that tropical cyclone information is made available to the mariner.
The current methods used to distribute tropical cyclone forecasts, advisories, and outlooks are many.
However, knowing which products are available via which source is often the difficult part in
obtaining tropical cyclone information. After reviewing the methods used to get tropical weather
information to the mariner at sea, TABLE 10 at the end of this chapter attempts to summarize each
product into a ready reference of what, when, and how to obtain crucial tropical cyclone information
at sea. Further information on all NWS marine products can be found at the internet address:
http://www.nws.noaa.gov/om/marine.htm
Internet
Although internet access at sea can often be an expensive and technically challenging alternative to
obtaining tropical cyclone information, use of this method while in port is becoming more popular
as access costs decrease and personal computer use among mariners increases.
A majority of NWS forecasts and warnings are now available on-line from NWS web servers.
Specifically, all tropical cyclone products are available in this format directly from TPC/NHC.
Additionally, these products can also be found via other National Weather Service and government
web servers. Although the Internet is not part of the National Weather Service’s operational data
stream and should never be relied upon as the primary method of obtaining the latest forecast and
warning data, web servers maintained by the National Weather Service are usually reliable and can
serve as a valuable source of information for the Mariner. TABLE 2 indicates current web sites
32
available for Atlantic tropical cyclone information. Finally, any active marine warning, including
tropical cyclone related warnings can also be found on the Interactive Weather Information Network
(IWIN) of the Emergency Mangers Weather Information Network (EMWIN) at the following
internet address.
http://iwin.nws.noaa.gov/iwin/textversion/nationalwarnings.html
TPC/NHC text files & graphic charts are available via email through a NWS FTPMAIL server. This
server allows Mariner’s who do not have direct access to the World Wide Web but who are
equipped with an email system to receive NWS products at sea or in port. Using this service, users
can request files from the NWS and have them automatically e-mailed back to the user. Turnaround
is generally less than three hours, however, performance may vary widely and receipt cannot be
guaranteed. However, this service can be a valuable tool to the Mariner in obtaining tropical cyclone
information as well as other weather information over open water areas.
To start using this service, obtain the FTPMAIL help file by:
1. Sending an email to:
PRODUCT
INTERNET SITE
INTERNET ALTERNATE
Tropical Weather
Outlook
http://www.nhc.noaa.gov/products.html
http://www.nlmoc.navy.mil/cgi-bin/main.pl?tropical
Tropical Weather
Discussion
http://www.nhc.noaa.gov/forecast.html
http://www.nlmoc.navy.mil/cgi-bin/main.pl?tropical
Tropical Cyclone
Forecast/
Advisory
http://www.nhc.noaa.gov/products.html
http://www.nlmoc.navy.mil/cgi-bin/main.pl?tropical
Tropical Cyclone
Discussion
http://www.nhc.noaa.gov/products.html
http://www.nlmoc.navy.mil/cgi-bin/main.pl?tropical
High Seas Text
Forecasts
http://www.nhc.noaa.gov/forecast.html
http://www.mpc.ncep.noaa.gov/graphictextF.html
Tropical Surface
Analysis
http://www.nhc.noaa.gov/forecast.html
http://weather.noaa.gov/fax/marsh.shtml#SFC
Wind/Seas
Graphics
Forecast
http://www.nhc.noaa.gov/forecast.html
http://weather.noaa.gov/fax/marsh.shtml#SFC
Tropical Cyclone
Graphic Products
http://www.nhc.noaa.gov/index.html
http://www.nhc.noaa.gov/index_text.html
TABLE 2: List of internet web sites containing latest Atlantic basin tropical cyclone information.

33
2.
Subject Line: Anything that you like
3.
Body: help
The help file that you receive via email will discuss procedures and methods of obtaining tropical
cyclone information along with a listing of available products using this method. In order to get
further information on tropical cyclone specific data available via this service:
1.
Send an email to: ftpmail@weather.noaa.gov
2.
Subject Line: Anything that you like
3.
Body of message (case and line sensitive):
open
cd fax
get marine2.txt
quit
This will generate an email response with a description of tropical cyclone products and file names
along with further instructions on obtaining this particular information via the FTPMAIL server.
HF Fax
The HF Fax, also known as the radiofax or WEFAX, for years has been the mainstay of weather
information for the mariner. During the tropical cyclone season in the Atlantic, information on
current tropical systems in text or graphical formats can be acquired via this method. Additionally,
satellite imagery is made available throughout the year via this circuit. Transmitters located in
Boston and New Orleans continuously transmit weather information for the Atlantic Basin available
to anyone at sea with the proper receiving equipment.
TABLE 3 lists the frequencies assigned to the Boston and New Orleans sites in addition to broadcast
times for each site’s current HF Fax schedule. Users should occasionally review the fax schedules at
each site for changes in available products and transmission times.
Transmitter
Frequencies (in kHz)
Broadcast Tim es
Broadcast Schedule
Transmitted (in UTC)
New Orleans
4317.9
8503.9
12789.9
Continuous
Continuous
Continuous
0630 & 1830
0630 & 1830
0630 & 1830
Boston
4235
6340.5
9110
12750
0230-1015 UTC
Continuous
Continuous
1430-2215 UTC
0243
0243 & 1905
0243 & 1905
1905
TABLE 3: HF Fax transmitter sites and assigned frequencies for the Atlantic Basin.
Typical dedicated radiofax receivers use assigned frequencies, while receivers or transceivers,
connected to external recorders or personal computers, are operated in the upper sideband (USB)
mode using the carrier frequencies. From the HF Fax assigned frequencies in TABLE 3 subtract 1.9
kHz for carrier frequency. All radiofax broadcasts of NWS products use a radiofax signal of 120
lines-per-minute (LPM) and an Index-of-Cooperation (IOC) of 576. Although radio reception in the
high-frequency band varies greatly with a multitude of factors, generally, frequencies above 10 MHz
work best during the day, while lower frequencies work best at night.

34
WWV HF Voice (Time Tick)
The National Institute of Standards and Technology (NIST) broadcasts a time and frequency service
from station WWV in Fort Collins, Colorado. The “Time Tick” is normally used as an aid to celes-
tial navigation but hourly voice broadcasts of Atlantic High Seas Warnings are transmitted at 8 & 9
minutes past the hour on the frequency signals: 2.5, 5, 10, 15, and 20 MHz.
TABLE 4: SITOR assigned frequencies for the
Atlantic Basin.
Transmitter
Frequencies
(in kHz)
Broadcast Times
BOSTON
6314
8416.5
12579
16806.5
0000-0200 UTC
Continuous
Continuous
1200-1700 UTC
U.S. Coast Guard HF SITOR (SImplex Teletype Over Radio)
Broadcasts of high seas forecasts and storm warnings are transmitted from the United States Coast
Guard’s Boston high seas communications station in the SITOR mode. These text broadcasts are
performed in mode B, FEC, with broadcast times & frequencies listed in TABLE 4. Information
included in these broadcasts range from weather to navigational safety text information. Transmis-
sion range of these broadcasts, as with all HF signals, is dependent on operating frequency, time of
day, and multiple environmental factors.
TABLE 5: HF Voice broadcast transmitter sites, assigned frequencies, & transmission times for offshore, high seas, &
tropical cyclone information in the Atlantic Basin. NOTE: HF voice broadcasts of weather information from the New
Orleans transmitter may be preempted, as this transmitter is shared with the New Orleans radiofax broadcast.
Transmitter
Upper
Sideband
Frequencies
(in kHz)
Broadcast Times
For Offshore Forecasts
& Hurricane Information
(in UTC)
Broadcast Times for High
Seas Forecasts & Hurricane
Information
(in UTC)
New Orleans
(NMG)
* See Note in
Label Below
4316
8502
12788
0330, 0930, 1600, 2200
0330, 0930, 1600, 2200
0330, 0930, 1600, 2200
0500, 1130, 1730, 2330
0500, 1130, 1730, 2330
0500, 1130, 1730, 2330
Chesapeake
(NMN)
4426
6501
8764
13089
17314
0330, 0930
0330, 0930, 1600, 2200
0330, 0930, 1600, 2200
1600, 2200
NONE
0500
0500, 1130, 2330
0500, 1130, 1730, 2330
1130, 1730, 2330
1730
U.S. Coast Guard HF Voice
High seas forecasts, offshore forecasts, and
tropical cyclone marine forecasts/advisories
are broadcast in voice format via two United
States Coast Guard transmitters operating in
the Atlantic Basin. The products are broadcast
via HF in the upper sideband (USB) mode
using a synthesized voice known as “Perfect
Paul”. This voice is very distinctive and serves
as an aid in identifying and copying these
weather broadcasts. TABLE 5 lists transmitter
sites, frequencies, and times to copy the HF
voice broadcast in the Atlantic basin.
U.S. Coast Guard MF Voice
Medium frequency broadcasts of NWS offshore waters forecasts and storm warnings are conducted
on 2670 kHz after an initial announcement on 2182 kHz (will become 2187.5 kHz sometime in the
future although exact date is unavailable at time of publication). These broadcasts originate from

35
various Coast Guard Groups located along the Atlantic & Gulf coasts of the United States with a
typical range of 50-150 NM during the day to about 150-300 NM at night. TABLE 6 lists the loca-
tion and transmission times of products sent via MF voice broadcast in the Atlantic Basin.
NWS offshore waters forecast products valid for the regions where the broadcasts originate are
disseminated throughout the year. The tropical weather outlook and any active tropical cyclone
forecast/advisories are broadcast from some of these transmitters during the Atlantic Hurricane
season of 1 June through 30 November. Additionally, Group New Orleans and Group Corpus
Christi broadcast various other coastal forecasts and marine or severe weather statements when
applicable throughout the year.
U.S. Coast Guard VHF Voice
Coastal water forecasts and storm warnings of interest to mariners are broadcast by the Coast Guard
on VHF channel 22A (156.8 MHz VHF FM) after an initial announcement on VHF channel 16
(157.1 MHz VHF FM). The Coast Guard VHF network provides nearly continuous coverage of all
coastal areas of the United States East and Gulf coasts to a range of approximately 20 NM from
shore. In regions where NOAA weather radio broadcasts provide complete coverage of the USCG
VHF network, the Coast Guard may elect to only broadcast storm warnings and not any NWS
marine weather information. TABLE 7 on the next page lists Coast Guard stations that transmit over
VHF voice along with transmission times.
NOAA Weather Radio
Local and coastal marine forecasts & warnings are broadcast across the NOAA weather radio
network on a constant basis. This network provides near continuous coverage of the coastal waters
in the Atlantic and Gulf of Mexico. Additionally, NOAA weather radio transmitters are located in
the Caribbean region transmitting over the coastal waters of Puerto Rico & the U.S. Virgin Islands.
TABLE 6: MF Voice broadcast transmitter sites and transmission times for offshore forecasts and tropical cyclone
information during the hurricane season in the Atlantic Basin. Frequency for all USCG MF transmitters is 2670 kHz
after an initial announcement on 2182 kHz (to become 2187.5 kHz some time in the future).
Coast Guard
Group
Broadcast
Tim e
(UTC)
Coast Guard
Group
Broadcast
Tim e
(UTC)
Coast Guard
Group
Broadcast Tim e
(UTC)
Southwest
Harbor
1135, 2335
Ham pton
Roads
0203, 1333
St.
Petersburg
0320, 1420
Portland
1105, 2305
Cape
Hatteras
0133, 1303
M obile
1020, 1220,
1620, 2220
Boston
1035, 2235
Fort Macon
0103, 1233
New Orleans
0550, 1035,
1235, 1635
W oods Hole
0440, 1640
Charleston
0420, 1620
New Orleans
2235
M oriches
0010, 1210
M ayport
0620, 1820
Galveston
1050, 1250,
1650, 2250
Atlantic City
1103, 2203
M iam i
0350, 1550
Corpus
Christi
1040, 1240,
1640, 2240
Eastern
Shore
0233, 1403
Greater
Antilles
0305, 1505

36
Reception ranges of 25 NM from the coast are typical, however coverage may be more or less
depending on location of vessel and transmitter.
Coastal
Area
Broadcast
Time (UTC)
Coastal
Area
Broadcast
Time (UTC)
Coastal
Area
Broadcast
Time (UTC)
Southwest
Harbor
1135, 2335
Eastern
Shore
0200, 1145
St.
Petersburg
1300, 2300
Portland
1105, 2305
Hampton
Roads
0230, 1120
Mobile
Broadcast
Warnings Only
Boston
1035, 2235
Cape
Hatteras
0100, 1055
New
Orleans
1035, 1235,
1635, 2235
Woods Hole
1005, 2205
Fort Macon
0103, 1233
Galveston
1050, 1250,
1650, 2250
Moriches
0010, 1210
Charleston
1200, 2200
Corpus
Christi
1040, 1240,
1640, 2240
Long Island
Sound
1120, 2320
Mayport
1215, 2215
New York
1050, 2250
Miami
Beach
1230, 2230
Atlantic City
1103, 2303
Key West
1200, 2200
Baltimore
0130, 1205
Greater
Antilles
1210, 2210
TABLE 7: USCG VHF Voice broadcast transmitter sites and transmission times for coastal forecast and marine warning
information. Frequency for all USCG VHF transmitters is 156.8 MHz VHF FM (VHF Channel 22A) after an initial
announcement on 157.1 MHz VHF FM (VHF Channel 16).
Most VHF radios have the ability to receive NOAA weather radio over the frequencies listed in
TABLE 8. However, it is recommended that a separate NOAA Weather Radio receiver be used to
copy this broadcast so that the marine VHF channels can remain clear in order to copy other impor-
tant information at sea.
During severe weather situations, an automated 1050 Hz tone is transmitted to automatically turn on
compatible NOAA weather radio receivers. Most, but not all, NOAA weather radios possess this
feature. However, an active NOAA Weather Radio channel must be selected in order for the mariner
to be alerted. Additionally, newer NOAA weather radios utilize SAME (Specific Area Message
Encoding) technology. This feature allows weather radios to alert only for specific weather condi-
tions or certain geographic areas. It is recommended that SAME technology weather radios operated
by mariners making coastal transits be set to the ‘All County Code Option’ in order to avoid the
need for continual reprogramming of the radio during transit. This also reduces the likelihood of
missing any important weather warning information while underway.
TABLE 8: NOAA Weather Radio
frequencies and broadcast
channels.
Broadcast Channel
Broadcast Frequency in MHz
WX 1
162.550
WX 2
162.400
WX 3
162.475
WX 4
162.425
WX 5
162.450
WX 6
162.500
WX 7
162.525

37
NAVTEX Element of the Global Maritime Distress & Safety System
NAVTEX is a low-cost, simple, and automated means of receiving important marine information
aboard ships. It is an internationally accepted medium frequency (518 kHz) direct-printing service
for delivery of navigational information and meteorological warnings/forecasts to ships. NAVTEX
is similar to SITOR in many aspects, however SITOR does not offer the same degree of functional-
ity that NAVTEX does, such as avoiding repeated messages. The NAVTEX system possesses typical
operating ranges of approximately 200 NM from the coast.
All NAVTEX stations in the United States are operated by the Coast Guard and provide offshore
forecasts of weather conditions for the region in which the transmitter is located. TABLE 9 is a
listing of NAVTEX transmitter sites and scheduled broadcast times for locations along the Atlantic
& Gulf coasts along with some offshore waters in the vicinity of Puerto Rico in the Caribbean
region. TABLE 9 also lists the required station identifiers needed by the NAVTEX receivers in order
to obtain broadcasts.
It is recommended that all mariners in U. S. waters program their NAVTEX receivers to include
subject indicator “E” in order to receive both warnings & routine weather forecasts via NAVTEX.
This will decrease the possibility of missing important tropical weather information at sea.
TABLE 9:
NAVTEX
stations,
identifiers, and
weather
broadcast
schedule for
transmitter
sites operating
in the Atlantic
Basin.
NAVTEX
STATION
STATION
IDENTIFIER
WEATHER BROADCAST SCHEDULE (In UTC)
BOSTON
F
0045, 0445, 0845, 1245, 1645, 2045
PORTSMOUTH
N
0130, 0530, 0930, 1330, 1730, 2130
SAVANNAH
E
0040, 0440, 0840, 1240, 1640, 2040
MIAMI
A
0000, 0400, 0800, 1200, 1600, 2000
SAN JUAN
R
0200, 0600, 1000, 1400, 1800, 2200
NEW ORLEANS
G
0300, 0700, 1100, 1500, 1900, 2300
INMARSAT-C SafetyNET
Inmarsat-C SafetyNET is an internationally adopted, automated satellite system for promulgating
weather forecasts/warnings, marine navigational warnings, and other safety related information to
all types of vessels and is part of the Global Maritime Distress and Safety System (GMDSS).
National Weather Service high seas forecasts, warnings, and tropical cyclone information (when
applicable) for SafetyNET Area IV, the Atlantic Basin west of 35W Longitude and north of 7N
latitude, are broadcast four times per day at 0430, 1030, 1630, and 2230 UTC.
This information is sent over the INMARSAT system of geostationary satellites with each satellite
in the system transmitting on a designated channel at 1.5 GHz. Any ship sailing within the coverage
area of an Inmarsat satellite is able to receive all SafetyNET messages broadcast over the appropri-
ate channel of that satellite, so long as Inmarsat-C GMDSS equipment is programmed to the proper
Metarea/Navarea (Area IV for the Western Atlantic). Additionally, Inmarsat-C equipment must also
be interconnected with a GPS receiver or updated with a manually entered position at least every 12
hours or SafetyNET broadcasts for several Metareas/Navareas will be received unintentionally.
Finally, the broadcast transfer technology of this system is extremely reliable ensuring a high prob-
ability of receiving messages correctly during first transmission, irrespective of the atmospheric
conditions or the ship’s position within the satellite coverage.

PRODUCT
TITLE/FILE
or CHART
NAME
DESCRIPTION
TYPE
ISSUE TIME
(UTC unless
noted)
DISTRIBUTION
NOTES
Atlantic Tropical
Weather
Discussion
AXNT20 KNHC or
MIATWDAT
Covers tropical & subtropical Atlantic discussing & describing
significant synoptic weather features while tracking easterly
tropical waves through the Atlantic Basin.
Text
0005, 0605,
1205, 1805
INTERNET
FTP MAIL
Atlantic Tropical
Weather Outlook
ABNT20 KNHC or
MIATWOAT
Covers tropical & subtropical Atlantic discussing areas of
disturbed weather and their potential for development out to
48 hours.
Text
0530, 1130,
1730, 2230
Eastern Local
Time
INTERNET
FTP MAIL
MF VOICE
Only issued from June 1 to Nov 30.
Atlantic Tropical
Cyclone Forecast/
Advisory
WTNT2X KNHC or
MIATCMATX where X
is active storm number
1 through 5
Issued for every tropical cyclone in the Atlantic Basin.
Contains forecast through 72 hours for as long as the system
remains a tropical cyclone.
Text
0300, 0900,
1500, 2100
INTERNET
FTP MAIL
HF VOICE
MF VOICE
Forecast/Advisories on subtropical cyclones will use
the same WMO/AFOS headers with the actual
advisory labelled SUBTROPICAL. Special
Forecast/Advisories can be issued at intermediate
times as conditions warrant. These will use the same
header as the scheduled forecast/advisory.
Atlantic Tropical
Cyclone
Discussion
WTNT4X KNHC or
MIATCDATX where X
is the active storm
number 1 through 5
Issued in conjunction with the Tropical Cyclone
Forecast/Advisory to explain the forecasters reasoning
behind analysis and forecast of the Tropical Cyclone.
Text
0300, 0900,
1500, 2100
INTERNET
FTP MAIL
Special Tropical
Disturbance
Statement
WONT41 KNHC or
MIADSAAT
Issued to provide information on strong, formative, non-
depression systems focusing on the major threats
associated with the disturbance.
Text
As Required
INTERNET
FTP MAIL
Atlantic High Seas
Forecast (North
Atlantic from 7N
to 67N W of 35W)
FZNT01 KWBC or
NFDHSFAT1
Provides analysis & forecast information on wind & sea
conditions in the region out to 48 hours. During periods with
active tropical cyclones in the basin, this product will include
latest initial postion/intensity along with the 36, 48, & 72 hour
forecast positions/intensities taken from the TCM. Tropical
Cyclone position/intensity at the 12 & 24 hour forecast
periods will only be included if expected to be
upgraded/downgraded.
Text
0430, 1030,
1630, 2230
INTERNET
FTP MAIL
HF FAX
WWV HF VOICE
HF SITOR
HF VOICE
INMARSAT-C
Forecast commences at latest previous synoptic time
from the time product is issued. Therefore forecasts
commence at 0000, 0600, 1200, 1800 UTC. This
product is the combined Atlantic, Gulf of Mexico, &
Caribbean Sea forecasts. This product is directed
toward the largest ocean going vessels.
TABLE 10: Summary Of Tropical Weather Products
38

PRODUCT
TITLE/FILE
or CHART
NAME
DESCRIPTION
TYPE
ISSUE TIME
(UTC unless
noted)
DISTRIBUTION
NOTES
Atlantic High Seas
Forecast (Atlantic
S of 31N W of
35W including the
Gulf of Mexico &
Caribbean Sea)
FZNT02 KNHC or
MIAHSFAT2
Provides analysis & forecast information on wind & sea
conditions in the region out to 48 hours. During periods with
active tropical cyclones in the basin, this product will include
latest initial position/intensity along with the 36, 48, & 72 hour
forecast positions/intensities taken from the TCM. Tropical
Cyclone position/intensity at the 12 & 24 hour forecast
periods will only be included if expected to be
upgraded/downgraded.
Text
0430, 1030,
1630, 2230
INTERNET
FTP MAIL
HF FAX
WWV HF VOICE
HF SITOR
HF VOICE
INMARSAT-C
Forecast commences at latest previous synoptic time
from the time product is issued. Therefore forecasts
commence at 0000, 0600, 1200, 1800 UTC. This
product is directed toward the largest ocean going
vessels.
Offshore
Forecasts
FZNT21 KWBC or
NFDOFFNT1
FZNT22 KWBC or
NFDOFFNT2
FZNT23 KNHC or
MIAOFFNT3
FZNT24 KNHC or
MIAOFFNT4
Provides analysis & forecast information on wind and sea
conditions to mariners operating mainly a day or more from
safe harbor. 3-5 day outlook for the region is included at the
end of this product.
Text
430 AM,
1030AM, 430
PM, 1030 PM
Local
standard
time.
*Remember
to add 1 hour
during
Daylight
Savings Time
INTERNET
FTP MAIL
HF VOICE
MF VOICE
NAVTEX
NOAA WEATHER
RADIO (In Select
Locations)
There are four headers for this product depending on
geographic location of forecast. New England waters
are FZNT21. West Central North Atlantic are FZNT22.
SW North Atlantic and Caribbean Sea is FZNT 23.
Gulf of Mexico is FZNT24. Availability of this product
on NOAA Weather Radio is based on transmitter
availability. Contact nearest NWS Forecast Office to
see if this product is transmitted via NOAA weather
radio in your area.
Coastal Forecasts
VARIOUS
**See Notes for further
information
Provides analysis & forecast information on wind and sea
conditions to Mariners operating in the near shore
environment. 3-5 day outlook for the region is included at the
end of this product.
Text
430 AM,
1030AM, 430
PM, 1030 PM
Local
standard
time.
*Remember
to add 1 hour
during
Daylight
Savings Time
INTERNET
MF VOICE
USCG VHF VOICE
NOAA WEATHER
RADIO
File names and product headers are determined by
the National Weather Service Forecast Office issuing
the product. For particular file name and header
information for a particular coastal forecast contact
the nearest NWS Forecast Office.
TABLE 10: Summary Of Tropical Weather Products
39
PRODUCT
TITLE/FILE
or CHART
NAME
DESCRIPTION
TYPE
ISSUE TIME
(UTC unless
noted)
DISTRIBUTION
NOTES
Tropical Surface
Analysis
Fax Chart Name:
PYEA8X where X is 6
for the 0000 UTC
analysis, 7 for the 0600
UTC chart, 5 for the
1200 UTC, and 8 for
the 1800 UTC
Analysis of the Atlantic Basin from 5N to 35N including the
Gulf of Mexico and Caribbean Sea. These charts include
current position, intensity, and motion of any active tropical
cyclone in the basin when applicable. Additionally, this chart
shows the trough axis of any easterly tropical wave being
tracked by the Tropical Prediction Center.
Graphic
As soon as
completed
after the
synoptic
times of
0000, 0600,
1200, 1800
UTC
INTERNET
FTP MAIL
HF FAX
Wind/Wave Chart
Fax Chart Name: For
NOWCAST/12 HR
chart file name is
PYEA9X where X is: 6
for the chart valid
0000/1200 UTC, 7 for
chart valid 0600/1800
UTC, 8 for chart valid
1200/0000 UTC, and 9
for chart valid
1800/0600 UTC. For 24
HR/36 HR chart file
name is PWED9X
where X is 8 for the
chart valid 0000/1200
UTC, and 9 for chart
valid 1200/0000 UTC.
Issued in 2 forms. The first is a NOWCAST/12 HR forecast
issued four times daily. The second is a 24 HR/36 HR
forecast issued 2 times daily. These charts include latest
forecast position and intensity of any active tropical cyclone
in the basin. Analyzed and forecasted combined sea heights
are also found on this chart.
Graphic
For the
NOW/12 HR
product is
issued by
0055, 0655,
1255, 1855.
For the 24/36
HR product is
issued by
0000, 1200.
INTERNET
FTP MAIL
HF FAX
Marine Predicition
Center Graphical
Products
Various Chart Headers.
See the BOSTON HF
Fax schedule or visit
the MPC web site for
details on product
availability.
Graphical surface analysis charts
Forecast surface charts out to 96 hours
Forecast 500 MB charts out to 96 hours
Sea height analysis
Satellite Imagery
Graphic Various
INTERNET
FTP MAIL
HF FAX
Products focused on area of the Atlantic from 31N-
67N including Portions of the Gulf of Mexico. Format
and content of products is similar to those issued from
the Tropical Prediction Center.
Web Site Adress for MPC:
http://www.mpc.ncep.noaa.gov/
Strike Probabilities
WTNT71-75 or
MIASPFAT1-5
Gives the percentage chance of a tropical/subtropical
cyclone passing within 75 nm to the right or within 50 nm to
the left of a specified point, looking in the direction of cyclone
motion.
Text
0300, 0900,
1500, 2100
INTERNET
Probabilities are given for 0-24, 24-36, 36-48, & 48-72
hours, with 0-72 hour given by adding the indivdual
probabilities together.
TABLE 10: Summary Of Tropical Weather Products
40

41
NWS Telephone Support
Many National Weather Service forecast offices offer recorded marine & local weather forecasts
similar to those found on NOAA Weather Radio. Numbers to these recorded forecasts can usually
be found by contacting the nearest coastal National Weather Service Forecast Office (NWSFO).
Some recorded tropical cyclone forecast/advisories can be obtained by contacting the Tropical
Prediction Center/National Hurricane Center (TPC/NHC) directly at (305) 229-4483. Further infor-
mation regarding tropical cyclone forecasts/advisories can be obtained from the marine forecasters
at TPC by calling (305) 229-4425/4424. However, these phone lines often become unavailable due
to the high volume of calls during a tropical cyclone event and may be busy for long periods of time.
Chapter 4 - Guidance For Hurricane Evasion In The North Atlantic
There is no single rule of thumb that can be used by vessel masters to ensure at least minimum safe
separation from a tropical cyclone. Constant monitoring of tropical cyclone potential and a continual
risk analysis when used with some fundamental guidelines are the basic recommended tools to help
minimize a tropical cyclone’s impact to a vessel at sea or in port. Even today, as our understanding
and the predictability of tropical cyclones increases, there is still much error inherent in forecasting
the movement and intensity of such complex systems. Similarly, each year, ships continue to be
caught in port or at sea struggling for survival in tropical cyclones. However, the topic of this chap-
ter is focused on minimizing the impact tropical cyclones will have on the mariner through objective
analysis and recurring assessment of the tropical cyclone threat to the mariner.
With an understanding of basic tropical cyclone motion and intensity characteristics along with the
ability to acquire current forecasts, advisories, and discussions, we can begin to objectively analyze
the tropical cyclone threat and consider possible courses of action that could be taken to avoid these
tempests.
This chapter includes discussion on risk analysis, both at sea and in port, along with some issues
that must be considered by the mariner in order to make the best possible decisions regarding
navigation to evade tropical cyclones. A risk analysis checklist of things to consider along with a
North Atlantic Hurricane Tracking Chart are included as Appendices 1 & 2 at the end of this docu-
ment in order to help the mariner monitor, evaluate, and react to the tropical cyclone threat. Finally,
the decisions to sortie from port, seek shelter in port, or navigating to evade at sea remain the sole
responsibility of the ship captain or vessel master. Hopefully, this guide will help those with that
obligation make the right decisions and avoid damage or loss of life due to tropical cyclones.
Risk Analysis
The purpose of conducting a recurring risk analysis both in port and at sea is to ensure that all
possible scenarios regarding a tropical cyclone’s impact to the mariner are considered in a cautious
and objective manner. The number of times a mariner should do this analysis is dependent upon the
tropical cyclone threat. During the tropical season, the risk analysis should be made a minimum of
twice daily during inactive tropical cyclone periods. However, this risk analysis needs to be made
four times daily when an active tropical cyclone is approaching or near the region where the vessel
is operating or expected to operate. The four per day risk analysis coincides with the number of
TCM’s issued daily by NHC when a tropical cyclone is active in the basin. Therefore, the risk
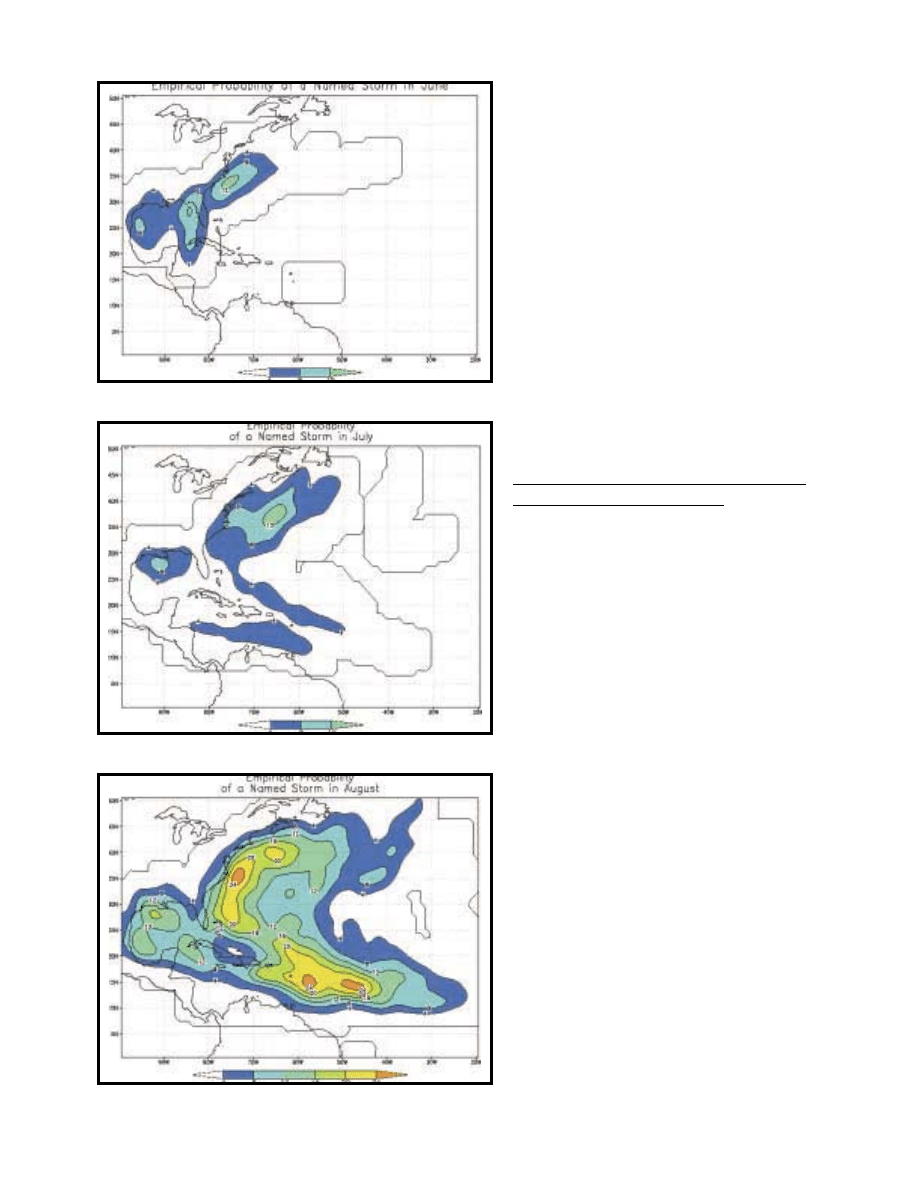
42
analysis should be done in conjunction
with these messages to help ensure that
the sailor is reviewing the latest informa-
tion while evaluating the tropical cyclone
problem. Although the analysis can be
somewhat tedious, time consuming, and
slow if never before performed, the time
spent conducting the risk analysis will
reap a substantial return during those
undesirable instances when a tropical
cyclone directly threatens a vessel and it’s
crew. Finally, as the mariner becomes
more familiar with the risk analysis, the
time required to accomplish it will de-
crease dramatically, requiring only a few
minutes and returning increased safety to
vessel and sailor alike.
History of Regional Hurricane Tracks
and Intensification Factors
As was shown in chapter 2 of this guide,
there are historically favored areas for
tropical cyclone development in the North
Atlantic Basin. Similarly, there are also
climatologically favored tracks that these
tropical cyclones tend to take within the
Basin. Both are significant to either the
vessel at sea or the ship pier side in order
to begin assessing risks involved with
remaining in port or getting underway
during the hurricane season. Hurricane
development & track history (climatology)
are the first significant aids in helping the
mariner to avoid tropical cyclones in the
North Atlantic.
Using FIGURES 17a-f in chapter 2, the
mariner can determine what months tend
to be more active and where the average
tracks of tropical cyclones tend to occur
during each month of the season. This
should alert the mariner on potential ‘hot
spots’ in the basin throughout the tropical
cyclone season.
Similarly, FIGURES 26a-f were produced
by Todd Kimberlain (Colorado State
FIGURE 26a: June Probability of Named Storm within 100 NM
of any point. Courtesy Kimberlain & Landsea.
FIGURE 26b: July Probability of Named Storm within 100
NM of any point. Courtesy Kimberlain & Landsea.
FIGURE 26c: August Probability of Named Storm within 100
NM of any point. Courtesy Kimberlain & Landsea.
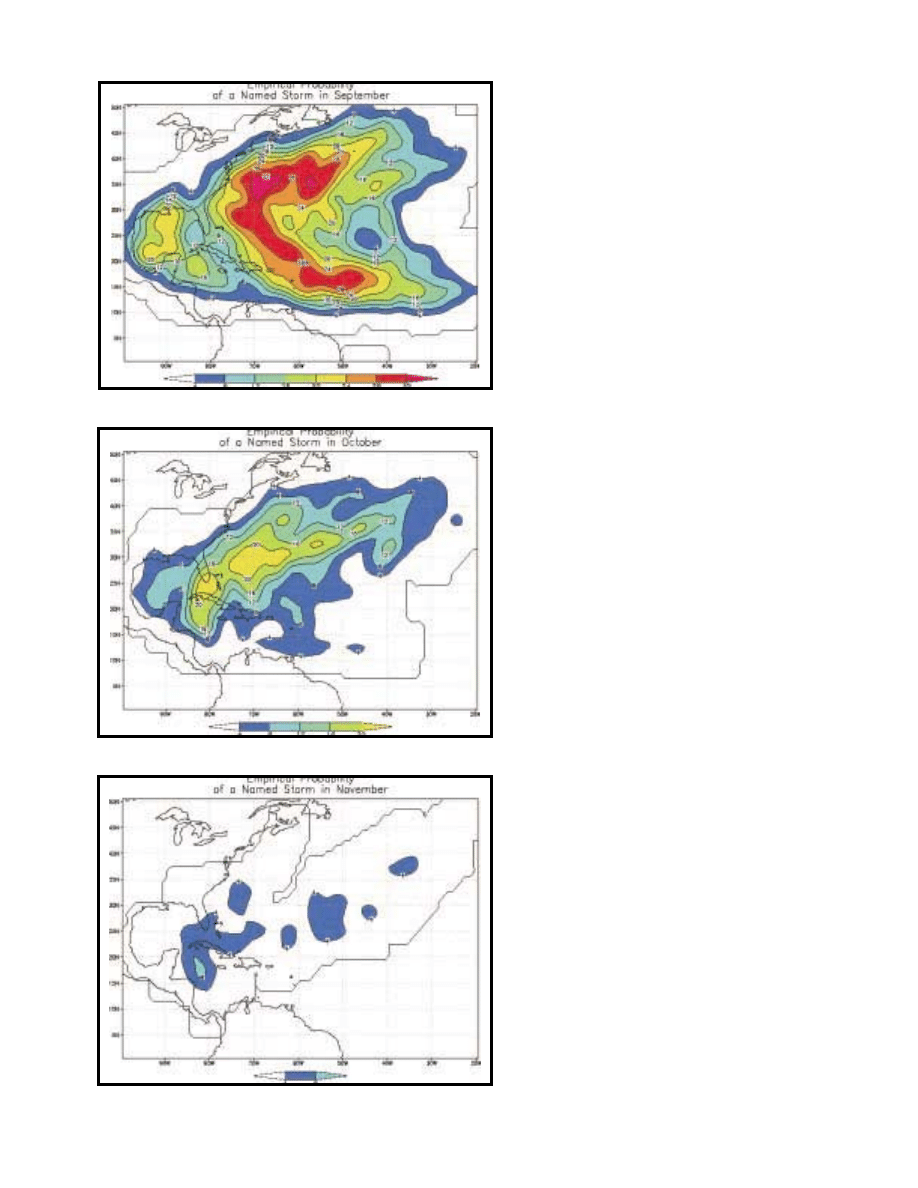
43
University) & Dr. Christopher Landsea
(NOAA/Atlantic Oceanographic and
Meteorological Laboratory/Hurricane
Research Division) to show for any
particular location, what the chance that a
tropical storm or hurricane will affect the
area sometime during each individual
month of the Atlantic hurricane season.
For the information provided in FIGURES
26a-f, the years 1944 to 1997 were used in
the analysis and counted as hits when a
tropical storm or hurricane was within
about 100 NM of each point in the basin.
For example, in FIGURE 26d, vessels in
port New Orleans, LA would roughly
have about a 20% chance (the gold yellow
color) per year of experiencing a strike by
a tropical storm or hurricane in the month
of September. Aside from highlighting
active areas throughout the basin, these
charts are useful to the Mariner in deter-
mining which ports and port areas have a
greater potential for tropical cyclone
activity during the Atlantic hurricane
season. For instance, Tampa Bay, FL has a
relatively low probability (less than 12 %)
that a named tropical cyclone will ap-
proach within 100 NM of that port during
the month of September. Information such
as this is critical for the mariner to under-
stand and evaluate. Voyage planning and
long term berthing considerations should
take these factors into account if only to
heighten the awareness of mariners to the
potential for tropical cyclone activity in
their operating areas.
Impact of Ocean Currents, Eddies,
and Warm Water
Similar to the historical development
areas and climatological tracks, there are
also certain areas in the Basin that often
support rapid intensification of tropical
cyclones. Understanding the significant
contribution that warm water plays in the
growth of a tropical cyclone, it is easy to
FIGURE 26d: September Probability of Named Storm within 100
NM of any point. Courtesy Kimberlain & Landsea.
FIGURE 26e: October Probability of Named Storm within 100
NM of any point. Courtesy Kimberlain & Landsea.
FIGURE 26f: November Probability of Named Storm within 100
NM of any point. Courtesy Kimberlain & Landsea.

44
appreciate that ocean regions with high sea-surface temperatures (greater than 79° F or 26° C) are
often dangerous locations for the mariner to be caught in or near as a tropical cyclone threatens.
Knowledge of North Atlantic sea-surface temperatures and ocean current/eddy structures are impor-
tant factors to consider in the risk analysis. Areas with high sea-surface temperatures (SST) often
coincide with historical instances of rapid tropical cyclone intensification.
In the North Atlantic Basin, the two most prominent areas to possess this potential danger are the
Gulf of Mexico and the Gulf Stream. Both of these areas contain an abundant depth of warm water,
capable of fueling sudden and sustained rapid intensification in tropical cyclones. In instances of
otherwise neutral conditions for hurricane growth, the extremely warm ocean waters in these areas
can often accentuate intensification and even rapid intensification of tropical cyclones. Mariners
operating in these regions need to pay particularly close attention to tropical waves, disturbances, or
other synoptic scale mechanisms that can initiate the tropical cyclone intensification process and
quickly place a vessel in harm’s way.
Aside from the effects of sea-surface temperature, an additional negative impact that Gulf Stream
and tropical cyclone interaction can place on a vessel is enhanced sea states in the vicinity of the
current. Similar to the often written about ‘North Wall’ events that routinely hazard vessels off the
coast of Cape Hatteras during the winter season, winds of tropical storm or hurricane force opposing
an ocean current can quickly create very steep, short period waves making navigation through these
areas a difficult proposition at best. It is important that the mariner is aware of the location of the
current so that it can be factored into any prospective course considerations to evade a tropical
cyclone in the Western Atlantic.
Sea-surface temperature and Gulf Stream analyses are available from some of the internet sites
listed in this manual. Most of these charts graphically depict the most recent location of the Gulf
Stream and warm ocean eddies along with actual sea-surface temperatures for portions of the West-
ern Atlantic. As part of the risk analysis these charts should be consulted at least every 3-4 days in
order to evaluate the latest Gulf Stream position and SST’s throughout the basin. This knowledge
can then be applied to the risk analysis for tropical cyclone avoidance.
Predictability of Tropical Cyclone Motion and Intensity
This is the second major factor involved in the mariner’s recurring tropical cyclone risk analysis. As
discussed earlier in this manual, tropical cyclone motion and intensity can often be very unpredict-
able. Even today with the arrival of super high-speed computers and complex numerical hurricane
forecast models, fairly significant errors can still be found in track and intensity forecasts of tropical
cyclones.
Generally speaking, the smallest errors associated with hurricane track forecasts occur while a
system is moving in a general west to west-northwest track, south of the Atlantic subtropical ridge.
Conversely, the largest errors involved with hurricane forecast tracks tend to occur during
recurvature and beyond as systems first slow as they begin to recurve, then typically accelerate
northeast into the central North Atlantic. Similarly, increased uncertainty in track forecasting often
occurs when a system is in an area of little to no environmental steering. This latter uncertainty
tends to occur most often in the Western Caribbean Sea and the Gulf of Mexico, however, it has
even been seen with tropical cyclones as far as 35-40 degrees North latitude in the Atlantic.
Errors associated with intensity forecasting can be quite large through the 72-hour forecast period in
the TCM. FIGURE 27 is a graph displaying the recent average intensity errors associated with
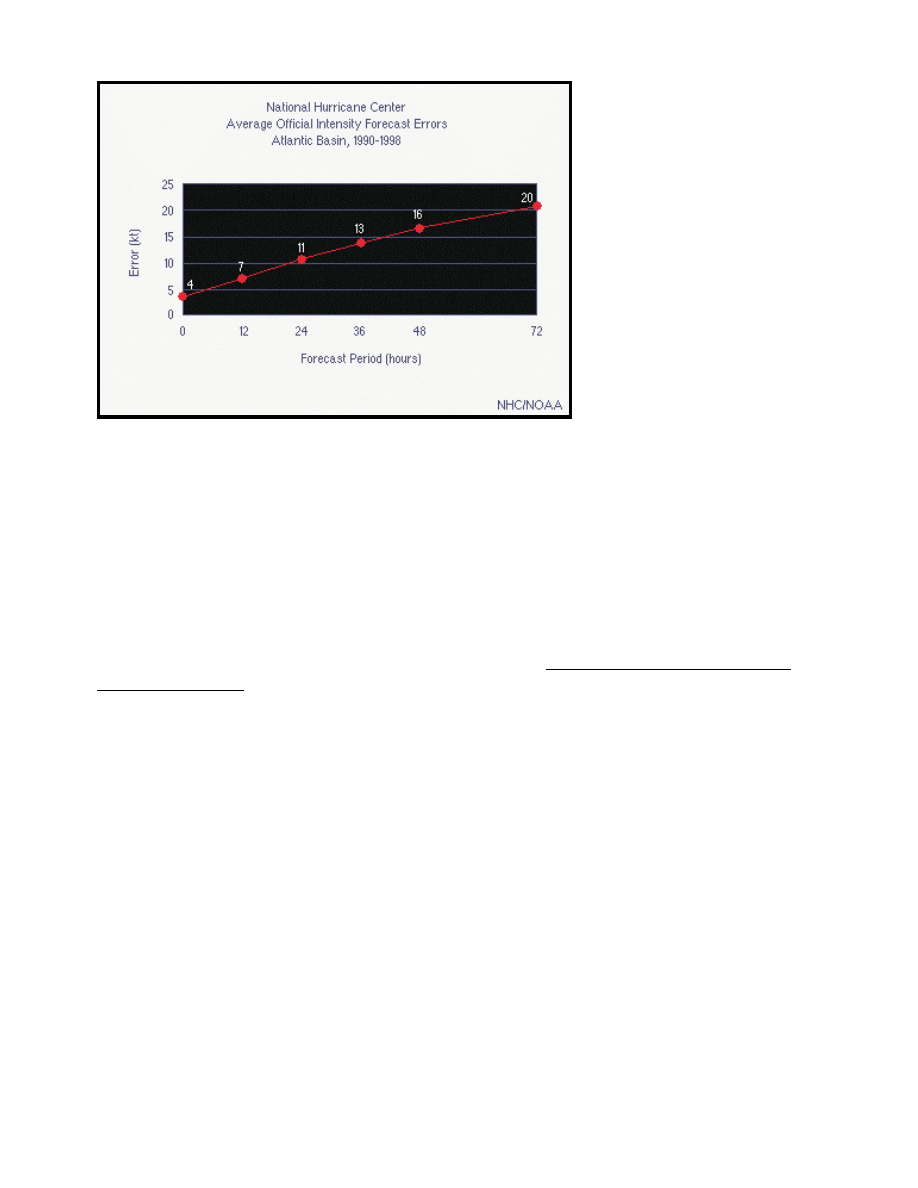
45
Atlantic Basin tropical cyclones. These errors are often further accentuated by the fact that a poor
forecast of intensity normally results in an even worse forecast of the radius of tropical storm force
winds associated with the tropical cyclone. Additionally, unlike tropical cyclone track forecasting,
very few operational computer models exist for the purpose for determining forecasts of tropical
cyclone intensity & the radius of tropical storm force winds. Therefore, the forecaster is left with
very little guidance to utilize in predicting the strength of these systems.
Understanding the inherent forecast errors in predicting tropical cyclone tracks and intensities are
critical to the mariner. Factors regarding track and intensity error must be considered together every
time the mariner begins to contemplate decisions on tropical cyclone avoidance. Similarly, knowl-
edge of these errors provides further testimony for the need to monitor the latest tropical cyclone
forecast information in order to refine those decisions on hurricane evasion. Safety of life and
property at sea in the vicinity of these systems requires an understanding of, and a respect for, the
forecast errors in order to minimize the potential impacts of a tropical cyclone on a ship.
34 KT Rule
For vessels at sea, avoiding the 34 KT wind field of a tropical cyclone is paramount. Any ship in the
vicinity of a tropical cyclone should make every effort to remain clear of the maximum radius of
analyzed or forecast 34 KT winds associated with the tropical cyclone. Knowing that the area of 34
KT around tropical cyclones is rarely symmetric but instead varies within semi-circles or quadrants
is important. Understanding that each tropical storm or hurricane has it own unique 34 KT wind
field are necessary factors to account for when attempting to remain clear of this dangerous area
around a tropical cyclone. NHC forecasts attempt to define the structure of this wind field and use of
the latest TCM in determining the maximum radius of 34 KT winds is necessary when trying to
avoid this dangerous threshold.
Winds of 34 KT are chosen as the critical value because as wind speed doubles, the force it gener-
ates increases approximately by a factor of four. When 34 KT is reached, sea state development
approaches critical levels that result in rapidly decreasing limits to ship maneuverability. The result
of this decreased maneuverability is a greater restriction on subsequent ship course and speed
options then available to clear the tropical cyclone.
FIGURE 27: Chart displaying the
average official intensity forecast
errors for tropical cyclones in the
Atlantic Basin from 1990-1998. Note
that during this period, forecasts of
tropical cyclone intensity 72 hours into
the future on average differed from the
actual intensity of the tropical cyclone
by approximately 20 KT. That alone
could be a significant factor in under
forecasting the radius of 34 KT winds
in a tropical cyclone.

46
It should also be noted at this point, that the state of the sea outside of the radius of 34 KT winds in
a tropical cyclone can also be significant enough as to limit course & speed options near a tropical
cyclone. Impacts of sea height on maneuverability of a ship outside of the 34 KT radius is depen-
dent on a number of factors including crew experience level, ship characteristics (Displacement,
Anti-Roll Devices, Length/Beam Ratio, Propulsion System, etc...), and wave characteristics in the
vicinity of the vessel. Only the ship’s captain and crew can determine what sea state can be safely
handled so as not to degrade maneuverability in the worse case scenario where rapid course and
speed changes are required to ensure minimum safe separation from a tropical cyclone.
1-2-3 Rule
The single most important aid in accounting for tropical cyclone forecast track error is the 1-2-3
rule. It should be understood and used by all Mariners when an active tropical system is found in the
North Atlantic. The 1-2-3 rule is derived from the latest 10-year average forecast errors associated
with tropical cyclones in the North Atlantic. TABLE 11 shows the National Hurricane Center’s
average initial position & track forecast errors over ten year periods from 1960 through 1999. It can
be seen from this table that during the last 40 years, tropical cyclone track forecasts have gotten
better within the basin. There are still, however, some rather large errors particularly at the 48 and
72-hour periods. Using the latest ten-year average from 1990-1999, the 1-2-3 rule attempts to
account for some of the inherent track forecast uncertainty associated with tropical cyclones.
Application of the 1-2-3 rule requires a few pieces of information from the latest TCM along with a
few other details that are easily derived from information within the TCM. Current position fore-
casts through 72 hours along with the maximum radii of 34 KT winds at the 24 & 36 hour forecast
positions must be known. Additionally, the maximum radius of 50 KT winds at the 36, 48 and 72
hour forecast times are also required to complete the simple calculations used in constructing the 1-
2-3 rule.
At the present time, NHC forecasts for tropical cyclones do not attempt to define the extent of 34
KT winds at the 48 and 72 hour forecast times. This is due to the extremely limited skill in forecast-
ing tropical cyclone intensity and wind radii beyond 36 hours. However, the mariners focus is on
avoiding the 34 KT winds in a tropical cyclone. Therefore in order to construct a danger area, or
“line in the sea” to gauge navigation options, 2 and 3 day estimates of maximum 34 KT wind radii
must be computed by the sailor and subsequently applied to the 1-2-3 rule.
TABLE 11: National Hurricane Center 10 year average initial position & forecast errors for North Atlantic Tropical
Cyclones & the relationship to the 1-2-3 Rule. *Beginning in 1961. **Beginning in 1964
10 Y EA R
TIM E
P E R IO D
A VE R A GE 0 H R
PO SITIO N
E R RO R (NM )
A VE R A GE 24 HR
FO RE CAS T P OS ITIO N
E R RO R (NM )
A VE R A GE 48 HR
FO RE CAS T P OS ITIO N
E R RO R (NM ) *
A VE R A GE 72 HR
FO RE CAS T P OS ITIO N
E R RO R (NM ) **
1960-1969
--
119
259
416
1970-1979
--
116
252
384
1980-1989
17
111
226
345
1990-1999
12
85
158
234
1-2-3
RU LE
0
100
200
300

47
In order to obtain an estimation of the maximum 34 KT wind radii at 48 and 72 hours, a simple
calculation based on the percent change of the 50 KT wind radii from the 36 hour forecast to the 72-
hour forecast is applied. For instance, assume that a tropical cyclone’s forecast 50 KT wind radii at
36 hours is 50 NM while the 34 KT wind radii at the same time is 100 NM. At the 48-hour forecast,
the 50 KT wind radii was increased to 75 NM. With this information, a rough approximation of the
maximum 34 KT wind radii at the 48 hour time period can be calculated using the following simple
formula:
HR
HR
Forecast
Estimate
KT
x
KT
KT
KT
36
36
34
50
50
34
=
Where:
34KT
Estimate
=
Approximation of maximum 34 KT wind radius at either 48 or 72 hours.
50KT
Forecast
=
Value given in TCM for maximum radius of 50 KT winds at either the 48 or 72 hour fore
cast time. Using the value given in the 48-hour forecast will yield a maximum radius of 34
KT winds at 48-hours. Similarly, using the 72-hour value for the maximum radius of 50 KT
winds will result in an estimate of the maximum 34 KT radius at 72 hours.
50KT
36 HR
=
Value given in TCM for maximum radius of 50 KT winds given in the 36-hour forecast from
the TCM.
34KT
36 HR
=
Value given in TCM for maximum radius of 34 KT winds given in the 36-hour forecast from
the TCM.
Using the equation above, an estimate of the 34 KT wind radii at 48 hours can be made.
NM
x
KT
Estimate
150
100
50
75
34
=
=
Therefore the mariner would use the value of 150 NM as the maximum radius of 34 KT at the 48-
hour forecast position. FIGURE 28 on the following page shows two more examples of this method
for obtaining estimated maximum 34 KT wind radii. In cases where the calculation results in values
less than 30 NM, mariners should always round up to a minimum value of 30 NM to provide a
slight safety margin. Additionally, this minimum value of 30 NM helps account for the likely inten-
sity errors that often result in long range forecasts of tropical cyclones.
The need to continually review the latest forecast guidance in the TCM should become readily
apparent as estimations for the maximum 34 KT wind radii are not necessarily precise. Due to the
inability of accurate tropical cyclone intensity forecasting coupled once again with the unpredictable
nature of these beasts, it is imperative that the mariner continues to monitor the TCM every six
hours in order to review and incorporate changes of track and intensity into the avoidance plan.
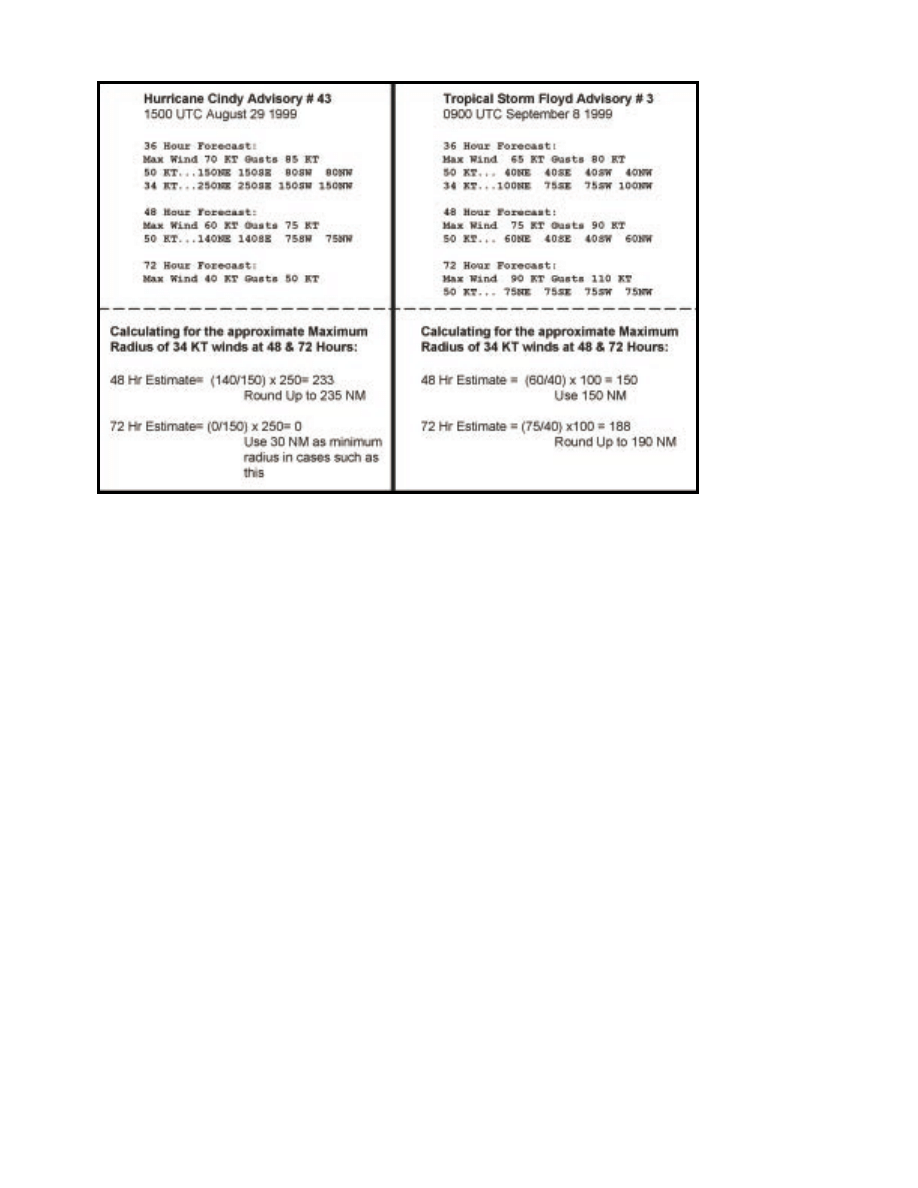
48
In possession of all the necessary inputs, the mariner can begin to construct the danger area of the
tropical cyclone using the 1-2-3 rule in the following process.
1.
Plot the current and forecast tropical cyclone positions taken from the latest TCM.
2.
Find the maximum radius of 34 KT winds at the current and each forecast time period of the
TCM out to 72 hours.
For example, the radii of 34 KT winds given for the 24 hour forecast position
in the latest TCM are:
34 KT...175NE 150SE 150SW 150NW
Therefore, the maximum radius of 34 KT winds associated with the tropical
cyclone at its 24-hour forecast position is 175 NM.
3.
Next apply the 1-2-3 rule to each of the radii at the 24, 48, and 72 hour forecast positions.
At the 24-hour forecast position (1 day): add 100 NM to the maximum radius
of 34 KT winds found in the 24 hours forecast of step two.
>>> 175 NM (Forecast radius of 34 KT) + 100 NM = 275 NM
At the 48-hour forecast position (2 days): add 200 NM to the maximum radius
of 34 KT winds found in the 48 hour forecast of step two.
At the 72-hour forecast position (3 days): add 300 NM to the maximum radius
of 34 KT winds found in the 72 hour forecast of step two.
FIGURE 28:
Two examples of
calculations for
determining an
estimated radius
of 34 KT winds
for the 48 and
72 hour
forecasts of
position,
intensity, and
maximum radius
of 50 KT winds
given in the
TCM.

49
4.
Now draw a circle around the 24, 48, and 72 hour forecast positions of the tropical cyclone
using the radii found in step 3.
5.
Connect a line tangent to each circle constructed in step 4. The area enclosed by these
tangent lines is known as the danger area of the tropical cyclone and must be avoided as a
vessel attempts to navigate in the vicinity of the tropical cyclone. FIGURE 29 is a graphical
illustration of the 1-2-3 rule.
Note of caution. This rule establishes a minimum recommended distance to maintain from a tropi-
cal cyclone in the Atlantic Basin. Larger buffer zones can and should be established in situations of
tropical cyclones with large forecast uncertainty, limited crew experience, decreased vessel han-
dling, or other factors as determined by the vessel master. The 1-2-3 rule does not account for
sudden & rapid intensification of tropical cyclones that could result in a rapid outward expansion of
the 34 KT wind field. Also, the 1-2-3 rule does not account for the typical outward expansion of the
wind field as a system transitions from tropical cyclone to extratropical gale or storm in the North
Atlantic. Finally, mariners should not equate the radius of 34 KT winds with the area of 12-foot seas
in the vicinity of a tropical cyclone. The 1-2-3 rule relies solely on avoiding the radius of 34 KT
winds in a tropical cyclone and does not take sea heights into consideration. Vessels with lower sea
keeping limits should also make adjustments to the 1-2-3 rule in order to minimize exposure to seas
that will dangerously hamper ship stability and maneuverability. The radius of current 12-foot seas
is issued in the TCM and can serve as a gauge for vessels with lower sea keeping limits in order to
remain clear of potentially damaging higher seas. Further guidance on forecasted seas in excess of
12 feet in the vicinity of any active tropical cyclone is available in the Atlantic High Seas Forecasts
issued by TPC and MPC.
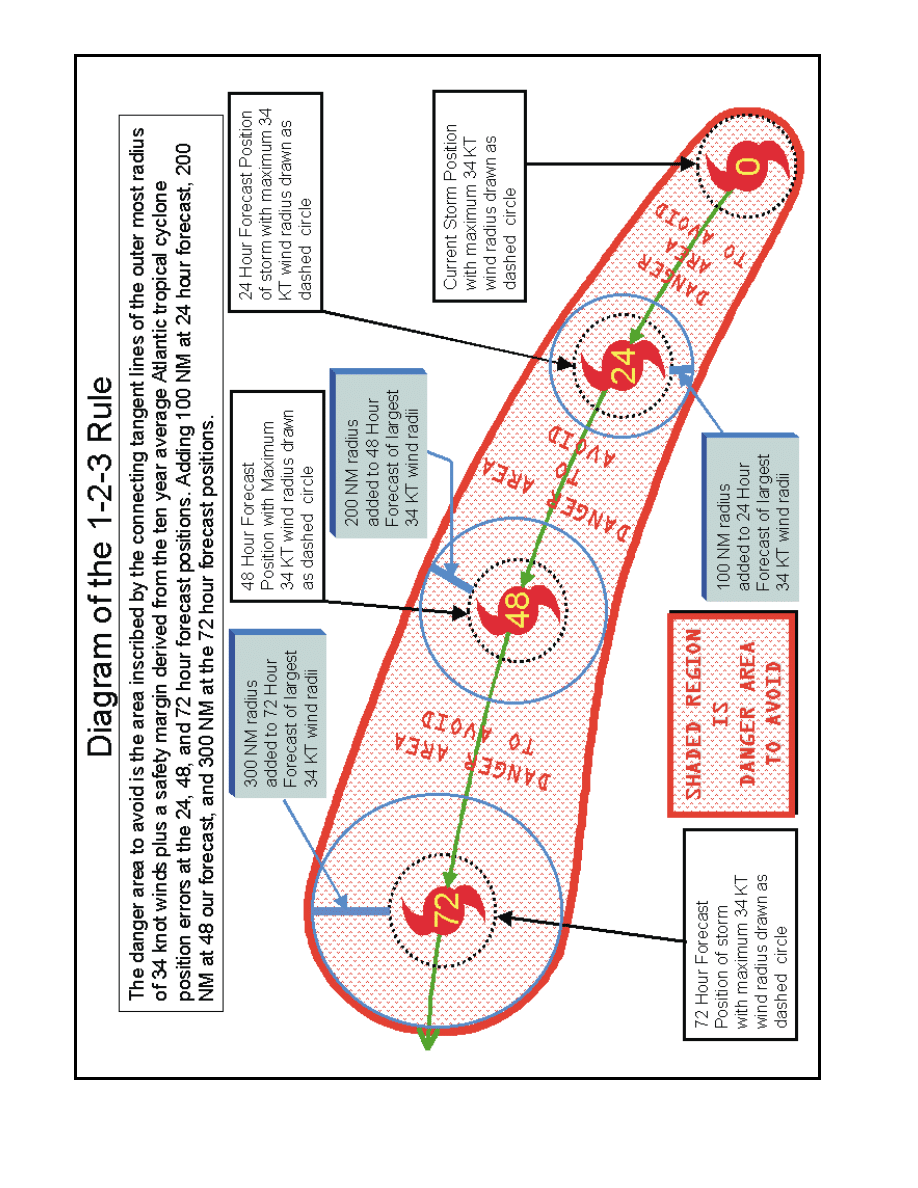
50
FIGURE 29: Diagram of the 1-2-3 Rule used to construct the MINIMUM DANGER AREA TO AVOID in attempting to
navigate around tropical cyclones in the North Atlantic Basin.

51
Ship Versus Tropical Cyclone Track Analysis
In the dynamic state of moving ships and tropical cyclones, recurring comparison of the tropical
cyclone track versus projected ship track is mandatory. This combined with continual monitoring of
the latest official NHC forecasts can greatly increase the mariner’s confidence with respect to vessel
safety and the future movement of the tropical cyclone.
In the process of continual comparison between vessel & tropical cyclone forecast track, it is neces-
sary to analyze and assess the ever-changing evasion options available to the mariner. Any delibera-
tions over evasion or escape routing must also include the options to use in worst case situations
where the tropical cyclone approaches the vessels projected track. At the same time, this review of
forecast ship and tropical cyclone tracks may also show some slowly evolving tendencies in the
tropical cyclone that are likely to go unnoticed in a single glance.
Never Cross The “T”
In track analysis, never plan to cross the track (cross the “T”) of a tropical cyclone in the Atlantic.
This is done out of respect for the detrimental effects that heavy weather places on vessel speed &
handling. Additionally, sudden accelerations in tropical cyclone motion can ultimately place a vessel
in conditions not originally expected or anticipated when setting course or speed to cross the “T”.
Making adjustments to course and speed in order to remain outside the danger area of the tropical
cyclone are the most prudent navigation decisions a mariner can make in order to remain somewhat
secure from the tropical cyclone threat.
Similarly, an understanding of climatological tropical cyclone tracks should also give the mariner a
better perspective on avoidance decisions beyond the 72-hour forecast provided in the TCM. For
instance, it is known that tropical cyclones will tend to accelerate as they recurve to the NE in the
Atlantic basin. Knowing this fact, one may be extremely skeptical of transiting between Bermuda
and Mid-Atlantic coast of the United States as a tropical cyclone approaches the southeast United
States with a forecast track that is showing indications of recurvature at the 36 & 48 hour forecast
position. Knowing the regions of “typical” tropical cyclone recurvature and the fact that systems
tend to accelerate upon recurvature should alert the mariner to any potential course options that may
cause the vessel to cross the “T” beyond the 72-hour forecast time.
Forecast Track Tendencies
A comparison of the most recent NHC forecast track with NHC forecast tracks from the past 24
hours can sometimes prove useful in determining a trend in the forecasted motion of a tropical
cyclone. For instance, a comparison of NHC forecast tracks issued every six hours over the last 24
hours, may show a noticeable shift to the right or left (with respect to storm motion) of the forecast
over the 24 hour period. Using this information, a mariner operating in the vicinity of this system
may want to consider increasing the buffer zone between vessel and tropical cyclone in that semi-
circle of the track to where the forecast is tending. This technique can sometimes be extremely
valuable in helping the mariner plan ship course & speed for tropical avoidance, particularly in the
2-3 day forecast range and beyond.
This technique should never be used to decrease the distance of minimum safe separation between
ship and tropical cyclone as discussed in the 34 KT and 1-2-3 rules. Instead, the focus of this tech-
nique is to highlight that region which may later come into the tropical cyclone danger area as the
forecast and actual track of the system shifts over time.
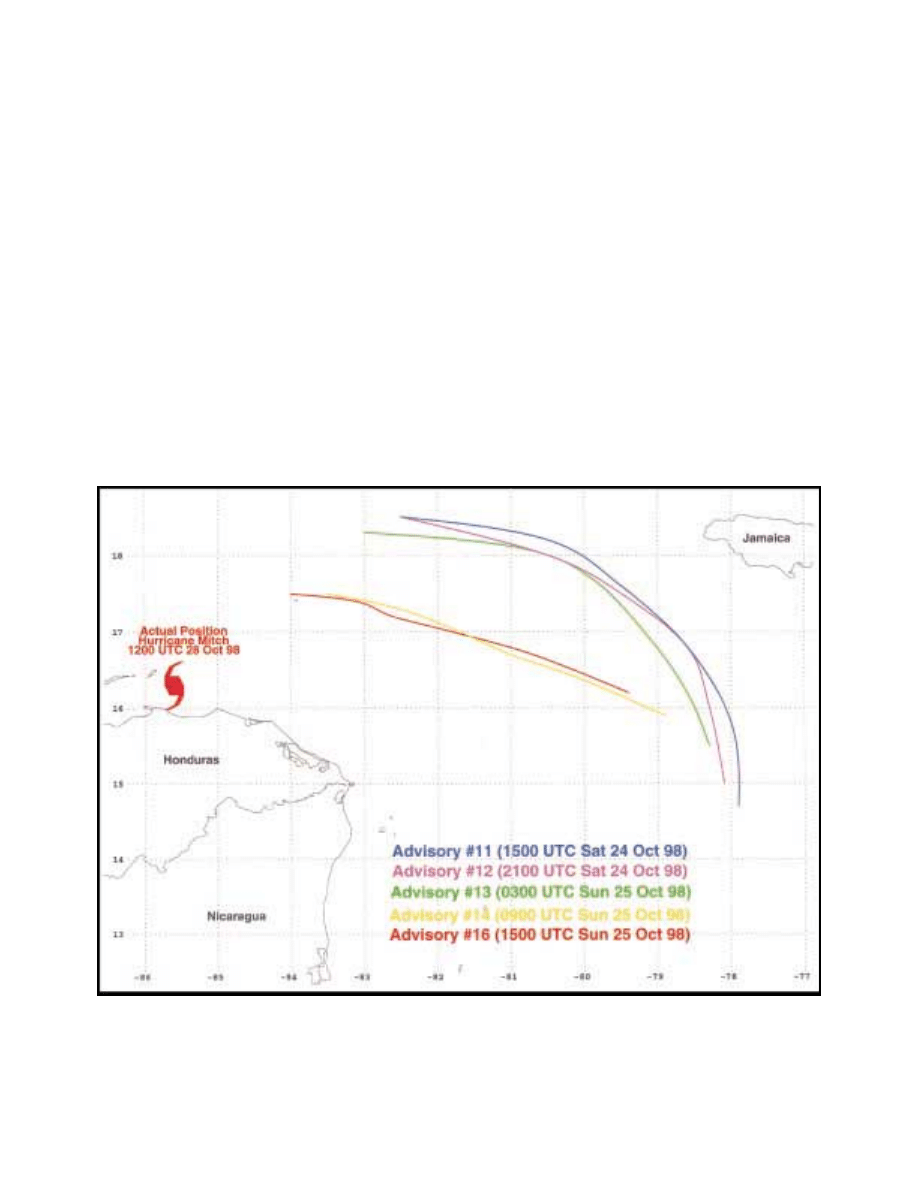
52
FIGURE 30 is an example of a forecast track analysis for Hurricane Mitch (1998) in the Caribbean
Sea. Plotting the forecast tracks of Mitch over the 24 hour period from 1500 UTC 24 October to
1500 UTC 25 October shows a very slight shift left in the forecast track of Mitch over the first 12
hours with an even larger shift left during the later plotted forecasts. Similarly, the continual plotting
of the tropical cyclone over the 24-hour period also shows that each initial fix location of the hurri-
cane was southwest of the expected position from previous forecast track. This continual bias to the
southwest of the forecast track remained until advisory 16 when the tropical cyclone’s position was
actually slightly north of the expected position based on the previous forecast track. Use of this
information should alert the mariner that areas south of the forecast track and beyond the normal
danger area of the 1-2-3 rule may fall into the danger area as Mitch moves West. A likely conclusion
reached in this forecast track analysis would be to increase the danger area over the southern portion
of the forecast track.
It is important to realize that forecast track analysis does not always provide information as clear cut
and valuable as that illustrated above. However, when done consistently during the course of a
tropical cyclone’s life cycle in the Atlantic, it may help provide the mariner with some additional
information that could help to determine subsequent course and speed options to ensure minimum
safe separation from the tropical cyclone.
FIGURE 30: Forecast track analysis for Hurricane Mitch (98). Advisories 11, 12, 13, 14, and 16 are plotted together to
show any trends in the forecast track of Mitch. The leftward shift of the forecast track over the 24 hour time period
shown should have cautioned the mariner to include an additional buffer zone left of track when plotting for the 1-2-3
rule. Not plotted in the image above, Advisory 15 was an intermediate advisory issued by NHC to establish a hurricane
watch for the Cayman Islands at 1200 UTC on Sun Oct 25. With a forecast track identical to Advisory 14, it was omitted
from this graphic for clarity.

53
Calculating Closest Point of Approach (CPA)
A final evaluation of ship track versus tropical cyclone track is accomplished by calculating CPA.
After plotting the latest NHC tropical cyclone forecast track, calculating for the 1-2-3 rule and
establishing any additional buffer from the storm that may be dictated, the last item to complete in
the at-sea risk analysis is comparison of CPA between current and possible evasion options. In-
creases in CPA between vessel and tropical cyclone based on current navigation decisions should
help to increase the mariner’s confidence that those decisions remain effective in keeping clear of
the tropical cyclone. However, decreases in CPA with the tropical cyclone should be dealt with
using the utmost urgency. An immediate review of all evasion options combined with a further look
into the latest official forecasts and discussions needs to be accomplished with the goal of establish-
ing a new evasion course and speed option to once again increase CPA from the tropical cyclone.
Assessing Options
Mariners must be cautioned never to leave themselves with only a single navigation option when
attempting to avoid a tropical cyclone in the Atlantic. Sea room to maneuver is not too significant a
factor in the wide open waters of the North Atlantic, but can become an extremely significant
consideration when operating in the confined waters of the Western Caribbean Sea and Gulf of
Mexico. More often than not, EARLY DECISIONS TO LEAVE RESTICTED MANUEVER AR-
EAS ARE THE MOST SENSIBLE CHOICE. Also, at the very least, evasion considerations should
include safe hurricane havens and sheltered waters when operating in either of these regions.
Port Specific Risk Analysis Considerations
Vessels seeking shelter in port or considering movement toward or away from port need to consider
all the factors discussed above. Additionally, mariners in these situations must also acknowledge
other factors to finalize their risk analysis for tropical cyclone avoidance.
Tropical Cyclone Approach To Port
Aside from the inherent forecast difficulties discussed in the predictability of tropical cyclone
motion and intensity above, mariners must also consider some other factors regarding tropical
cyclone track forecasts and relationships to port facilities. In general, tropical cyclones forecast to
make a perpendicular landfall tend to have the smallest amount of track forecast error. Conversely,
systems that are forecast to parallel the coast, as is often noted in the Mid-Atlantic region of the
United States, tend to have larger track errors similar to those experienced when a system recurves
in the basin.
Additionally, tropical cyclones that make landfall within 50-100 NM of a particular port tend to be
more destructive than those that approach the port from overland or parallel the coast in the vicinity
of the port. Also, ports located in the right front quadrant (based on direction of movement) of
tropical cyclones during landfall tend to have higher winds, seas, storm surge, and a greater poten-
tial of tornadic activity as these systems close the coast. FIGURE 31 on the following page graphi-
cally illustrates these points.
Go & No Go Decisions To Leave Port
The decision to leave port for tropical cyclone avoidance must be made very early. Throughout the
recurring risk analysis, consideration to the latest possible safe departure time and likely avoidance
routes must be balanced with a number of other factors. One of the most important of these factors
is time versus distance. The risk of damage to a vessel at sea increases as the speed of advance of
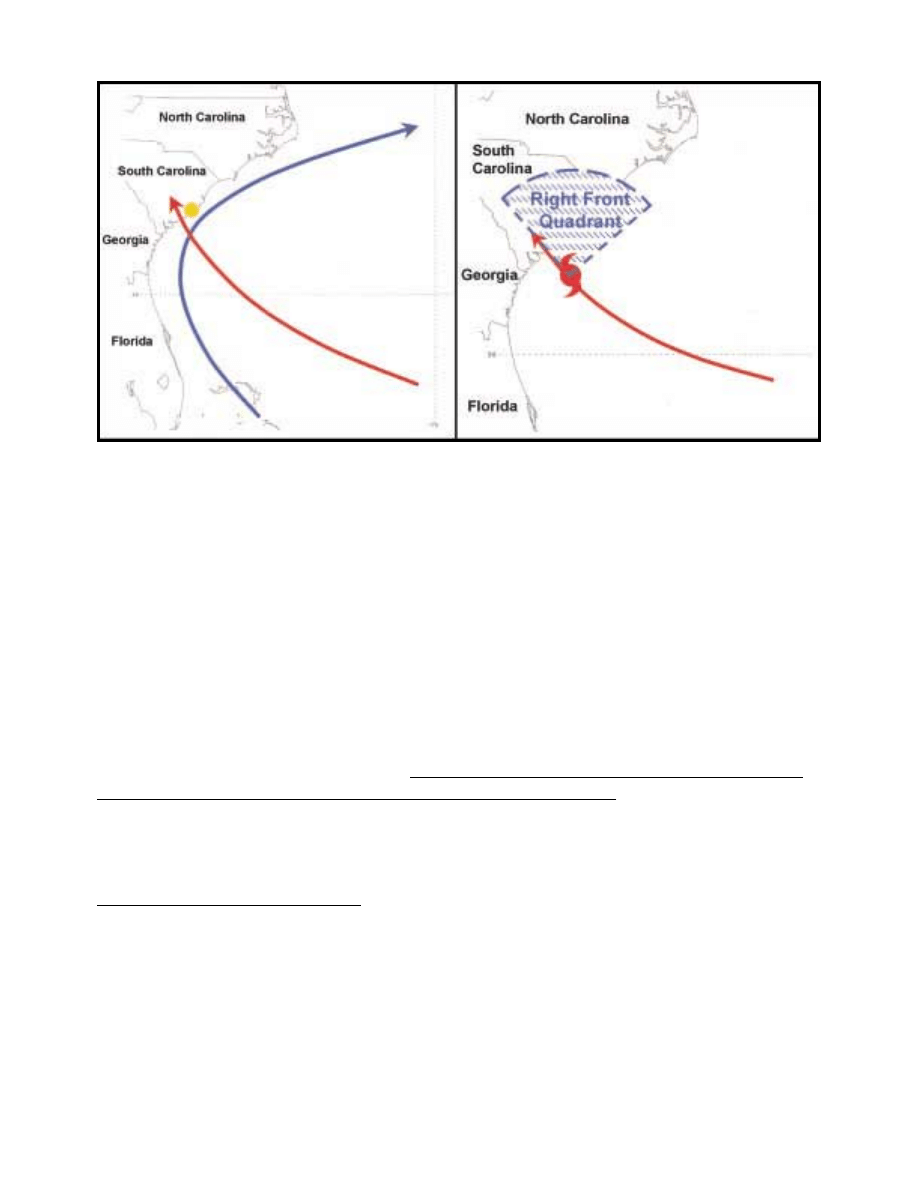
54
the tropical cyclone increases towards the maximum safe speed of the vessel attempting to leave
port in advance of a tropical cyclone. This is as much true with a vessel already at sea attempting to
avoid a tropical cyclone as it is with a ship deciding to leave port in an attempt to ride out a tropical
cyclone at sea. When reviewing these time and distance considerations, mariners must include the
effects that “squally weather” associated with the outer rainbands in a tropical cyclone will have on
underway preparations and movement from port to sea. Similarly, building wind and sea conditions
found at sea and ahead of the tropical cyclone can also hamper speed & maneuverability of any
vessels attempting to evade a tropical cyclone.
Recognizing these time/distance problems, it cannot be emphasized enough that early decisions to
leave port in attempt to avoid tropical cyclones are extremely important. There have been a number
of recorded instances where vessels have made the right decision to sortie from port in attempts to
avoid tropical cyclones, yet were still either damaged or lost because that decision to leave came too
late.
Berthing & Shelter Requirements
Considerations to remain in port during the passage of a tropical cyclone must begin with an evalua-
tion of the amount of protection that will be afforded in a specific location during the tropical
cyclone’s passage. Understanding the track, intensity, and impacts of the tropical cyclone as it
moves through the region should help the mariner in making that decision. Evaluation of the direc-
tion from which the strongest winds are forecast to blow along with the potential for storm surge
should be looked at by the mariner when deciding whether to seek haven pier side, at anchorage, or
further inland to more protected anchorages.
For instance, depending on the direction of approach that the tropical system may take with respect
FIGURE 31: Image on left shows 2 forecast tracks for a tropical cyclone along the SE coast of the United States. In
general, the
red track
(perpendicular approach to the coast) will tend to have smaller forecast track errors than will the
blue track
(parallel track along the coast). The gold circle in the image to the left denotes the port region of
Charleston. A tropical cyclone approaching the Charleston area along the red track will tend to be more destructive to
vessels in Charleston than would a tropical cyclone moving along the blue track. This is because a system moving along
the red track would have its’ right front quadrant crossing over Charleston, as shown in the image to the right.

55
to a specific port, storm surge can pose a significant problem to a vessel tied pier side. Substantial
rises in water level accompanying the storm surge may place a vessel, previously in a protected
wind/wave regime, into an area exposed to significantly greater winds and waves. Similarly, many
port and dock facilities, particularly in the Caribbean region are fixed. Although sufficient to sup-
port the normally small tidal range observed in the region, they can quickly become submerged
when exposed to even minimal tropical cyclone related storm surge. Additionally, attention to the
tying of lines is also of considerable importance. This is because the force on a moored vessel will
nearly double for every 15 knots of wind from tropical storm force (34 KT) to hurricane force (64
KT) with a slightly smaller increase beyond hurricane force. Therefore, a vessel tied to the pier
under normal situations can quickly break from that pier during periods of higher sustained winds
and gusts causing substantial damage to it and the other vessels nearby as a tropical cyclone passes.
Evaluation of hurricane havens is extremely important in those situations where the mariner decides
the best course of action is to remain in port during the passage of a tropical cyclone. The United
States Navy continually evaluates some of the major deep-water ports in the Atlantic for their
susceptibility and survivability during a tropical cyclone. The manual, entitled “Hurricane Havens
Handbook for the North Atlantic Ocean” (NAVENVPREDRSCHFAC TECHNICAL REPORT TR
82-03) is available to the public and should be required reading for any mariner needing to make
hurricane avoidance or hurricane haven decisions. This manual is also available on the World Wide
Web at the following web site.
https://www.cnmoc.navy.mil/nmosw/tr8203nc/0start.htm
Although this manual may not include the actual port considered by a mariner when seeking
weather haven, it does highlight some of the concepts needed in making decisions to seek haven or
sortie from port during a tropical cyclone event.
Caught At Sea: Navigating To Clear The Tropical Cyclone
Unfortunately, any manual of this type would be incomplete without a discussion on what to do
when either the risk analysis fails or the mariner is caught unaware at sea in the vicinity of a tropical
cyclone. Hopefully, with the aid of this manual, the prospects of closely encountering a tropical
cyclone will be lessened. However, if there is one thing to be taken away from this text, it is that
knowledge and preparation are the keys to safely remaining clear of the tropical cyclone threat.
Therefore, this information is included with the hope that it will never be required, but still should
be known by the mariner.
The guidelines for maneuvering to clear a tropical cyclone are based on knowing the location of the
system center and the speed and direction of movement for the tropical cyclone. Latest advisories
from NHC should be sought out immediately, as these messages give the information required to
navigate clear of the tropical cyclone. If these messages are unavailable, then local observations
discussed below and in chapter 1 of the manual should help in gathering the requisite knowledge
needed to plan the “escape route”.
Changes in wind direction and speed along with changes to shipboard barometric pressure are the
fundamental guides to locating a vessel within the tropical cyclone’s circulation. Winds veering over
time indicate that the ship is in the right semi-circle (with respect to tropical cyclone motion) of the
system. Conversely, backing winds over time indicate that a vessel is in the left semi-circle of a
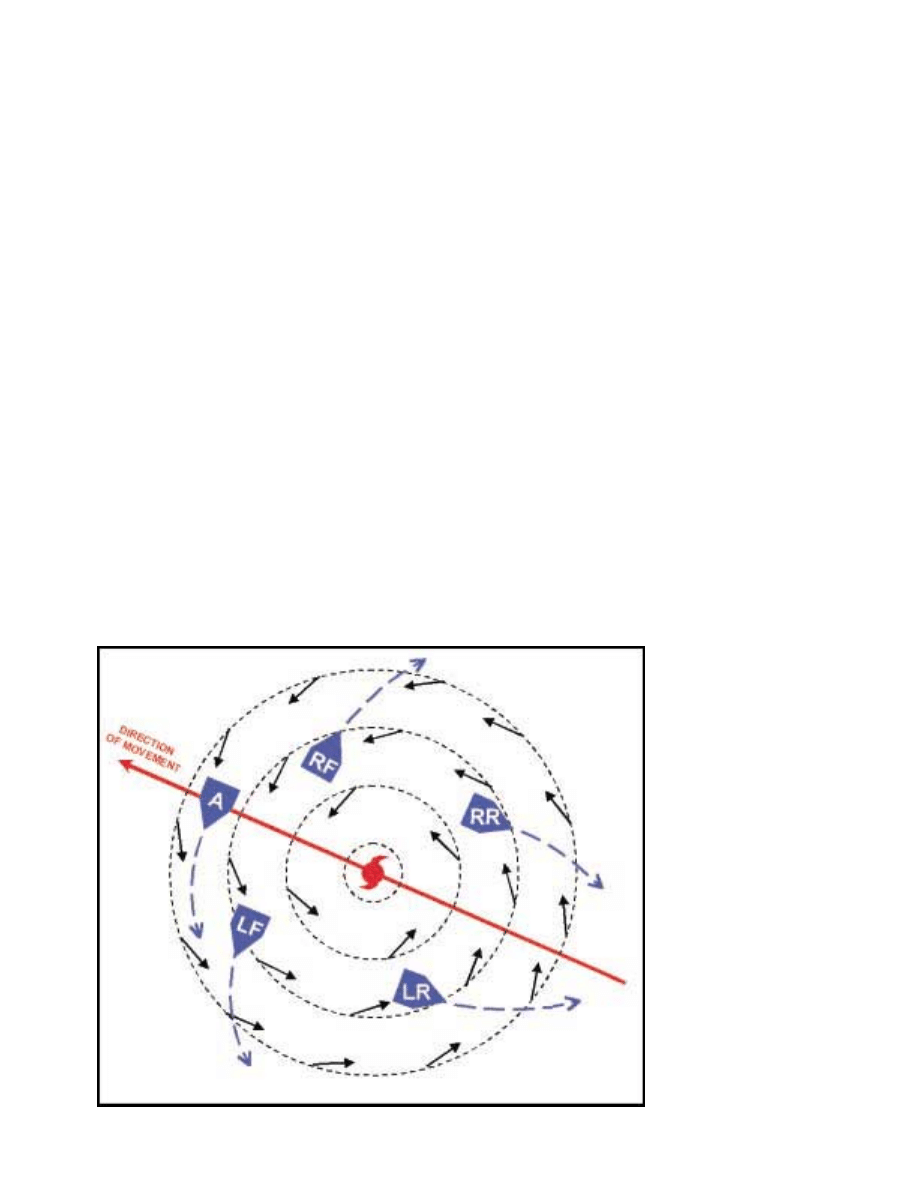
56
system. If wind direction remains steady but continues increasing in speed, a vessel is likely located
ahead of the tropical cyclone. Additionally, in those instances where a vessel is caught ahead of a
tropical cyclone, the barometric pressure will also continue to fall, in some cases quite rapidly as the
system center moves closer. Alternatively, winds that remain steady in direction but decrease in
speed are a good indication that the vessel is located to the rear of the tropical cyclone along its
track. Another indication of this is a steady rise in barometric pressure. Once the location of the
vessel with respect to the center of the tropical cyclone is known, the mariner can begin to make
course adjustments to clear.
If the vessel is found to be located in the right semi-circle of the tropical cyclone, put the wind at
045° on the starboard side while attempting to make best speed to clear the tropical cyclone. Vessels
caught ahead of a tropical cyclone should steer best course and speed attempting to place the wind
at 160° on the starboard quarter of the vessel until the ship is well into the left semicircle of the
system. For ships located in the left semi-circle of the system, place the wind at 135° on the star-
board quarter, making best speed to clear the tropical cyclone. Finally, for ships found to the rear of
a tropical cyclone, choose best course and speed that will increase distance from the vessel to the
tropical cyclone. It is important to emphasize at this point that the wave action accompanying a
tropical cyclone is often fairly complex, confused and dangerous with as many as three distinct
wave patterns prevalent at any given time. This is particularly true in the right rear quadrant (with
respect to direction of motion) of the tropical cyclone. A constant struggle between maintaining
appropriate course requirements without losing speed and vessel stability often becomes an epic
battle between mariner and Mother Nature. At this point, remaining as near to evasion course
requirements while attempting to maintain ship stability and maneuverability is the only available
option. FIGURE 32 below and TABLE 12 on the next page summarize required navigation to clear
a tropical cyclone when caught near to its center of circulation.
FIGURE 32: Vessel at A:
put wind at 160° relative
to the ship on the
starboard side making best
course and speed into the
left semi-circle of the
system. Vessel at RF and
RR: put the wind at 045°
relative to the ship on the
starboard side attempting
to make best course &
speed to clear the system.
NOTE: Wind and seas in
the area of RF and RR may
result in drastically
reduced forward speeds of
a ship attempting to open
from the tropical cyclone.
Vessel at LF & LR: put the
wind at 135° relative to the
ship on the starboard side
making best course and
speed to increase
separation between ship
and tropical cyclone.

57
TABLE 12: Required navigation actions based on where vessel is located relative to the direction of movement of
a tropical cyclone in the North Atlantic Basin.
V e s s e l L o c a t i o n
N a v i g a t i o n A c t i o n
A h e a d O f T r o p ic a l
C y c lo n e
P u t th e w in d a t 1 6 0
°
re la t iv e t o th e s h ip o n t h e s t a rb o a r d s id e m a k in g
b e s t c o u rs e a n d s p e e d in t o th e le ft s e m i- c irc le o f t h e s y s t e m .
R ig h t S e m ic irc le O f
T r o p ic a l C y c lo n e
P u t th e w in d a t 0 4 5
°
re la t iv e t o th e s h ip o n t h e s t a rb o a r d s id e
a t t e m p t in g to m a k e b e s t c o u r s e a n d s p e e d t o c le a r t h e s y s t e m . W in d
& w a v e in th is r e g io n c a n o ft e n d ra s tic a lly r e d u c e s h ip fo r w a rd s p e e d .
L e f t S e m ic irc le O f
T r o p ic a l C y c lo n e
P u t th e w in d a t 1 3 5
°
re la t iv e t o th e s h ip o n t h e s t a rb o a r d s id e m a k in g
b e s t c o u rs e & s p e e d t o i n c r e a s e s e p a r a t io n b e t w e e n s h i p & t r o p ic a l
c y c lo n e .
B e h in d T h e T ro p ic a l
C y c lo n e
M a in ta in b e s t rid in g c o u r s e a n d s p e e d t o in c r e a s e s e p a r a tio n
b e t w e e n s h ip a n d t ro p ic a l c y c lo n e .
Summary and Acknowledgments
Greater understanding of the concepts and mechanisms driving tropical cyclone development,
movement, and decay should help to make the mariner more aware of the threat posed from tropical
cyclones. Knowing where to get the latest information regarding these systems and how to apply it
in a risk analysis for hurricane avoidance should further aid the mariner in the decision making
process of how to evade a tropical cyclone in the North Atlantic Basin.
Hopefully, the information presented in this manual will help mariners better understand and avoid
tropical cyclones in the North Atlantic Ocean. With lives and property lost at sea each Hurricane
Season as a result of these often disastrous systems, the intention of this guide was to increase the
awareness of mariners regarding the Atlantic tropical cyclone threat. At the same time, providing a
relatively simple and somewhat objective technique to evaluate that threat and evade these tropical
tempests. It is hoped that during those instances when sailors are placed in unfortunate circum-
stances, forced to evade a tropical cyclone, that this manual can be of some value in helping them
through the decision-making process.
In completing this manual I would like to thank a number of people who supported and contributed
to this project. A sincere and special thanks to Michael Carr of the Maritime Institute of Technology
and Graduate Studies whose enthusiasm, energy, and ideas for this project helped to keep me fo-
cused and provided much of the substance for this manual. Similar thanks to Lee Chesneau of the
Marine Prediction Center for providing a great deal of review, feedback, and encouragement for the
manual. Many thanks go to the staff of the Tropical Prediction Center, in particular Dr. Jack Beven
and Dr. Ed Rappaport for their thorough reviews and recommendations for this document. Special
thanks to Max Mayfield, Director of the Tropical Prediction Center and Christopher Burr, Chief of
the Tropical Analysis and Forecast Branch for giving me the opportunity to work on such an impor-
tant project. Additional thanks to the Technical Support Branch of the Tropical Prediction Center, in
particular, Brian Maher, Chris Sisko, and Michelle Huber for their computer and graphics support.
Finally, I would also like to acknowledge Steve Bingham, Patrick Dixon, & the numerous other
civilian and military Fleet Forecasting & Routing personnel at the Naval Atlantic Meteorology &
Oceanography Center, Norfolk Virginia. All of whom taught me so much about ship routing &
hurricane avoidance during my tenure as a Ship Routing Officer.
This manual would not be complete without acknowledging all sailors who continually leave the
comfort of home, family, and friends taking to sea and facing all that Mother Nature can muster in
order to provide for their countries and their families. May God bless you with ‘Fair Winds and
Following Seas’.

Appendix 1
Mariners Tropical Cyclone Risk Analysis Checklist
o
1.
Review regional tropical cyclone climatology for area of expected operations.
à
Look for tropical cyclone track and development tendencies.
à
Locate areas of possible rapid intensification (Gulf Stream, Gulf of Mexico).
à
Consider likely areas for sea room in order to maneuver for avoidance.
o
2.
Obtain latest Marine Prediction Center & Tropical Prediction Center analysis/forecast charts; including
surface, upper level, & Sea State (wind/wave) charts.
à
Evaluate evolution of wind/ wave over the forecast period.
à
Look for evolution of synoptic patterns & possible relationship to any tropical cyclone track and intensity changes.
à
Obtain Sea Surface Temperature charts in order to refine location of Gulf Stream & areas with abundant warm
water/warm-core ocean eddies.
o
3.
Locate & plot tropical (easterly) waves, disturbances, and tropical cyclones.
o
4.
If available, examine current satellite imagery.
à
View relationship and evolution of cloud features and intense convection with respect to any current orpotential
tropical cyclone. Note evolution & change of Central Dense Overcast (CDO) associated with any activetropical
cyclone as this can sometimes provide a general indication of the extent of 34 KT winds.
o
5.
Obtain latest tropical cyclone advisory messages. Plot current/forecast positions of all active/sus
pected tropical cyclone activity.
o
Ensure vessel will meet requirements of 34 KT rule
o
Calculate and plot for the 1-2-3 rule
à
Ensure vessel meets MINIMUM requirements of this rule.
o
Conduct forecast track comparison of latest 24-hour period (previous 5 advisories).
à
Evaluate any increase to buffer zone around the tropical cyclone based on forecast track tendencies observed
over the last 24 hour forecast period
o
6.
Plot completed tropical cyclone danger area to avoid chart.
o
7.
Determine possible courses of action (at least 2) for vessel to take in order to remain clear of the Danger
Area To Avoid in the tropical cyclone.
à
Evaluate courses of action based on:
1. Current Forecast Track
2. Historically Possible Forecast Track (even beyond the 72 hour forecast period)
3. Worse Case Forecast Track
à
Consider impact of changes in wind, wave, & weather conditions and how they may impede movement of vessel in
each course of action.
à
Be aware of sea height impacts that dynamic fetch & Gulf Stream Current with opposing winds can have on vessel
movement in each course of action.
o
8.
Evaluate current/nearby port & hurricane haven locations that may be considered for tropical cyclone
avoidance.
à
Consider tropical cyclone forecast track to haven
à
Evaluate berthing & shelter requirements. Consider berthing availability.
à
Compute time/distance considerations of ship versus tropical cyclone both into port or sortie from port.
à
IF ALREADY IN PORT, MAKE EARLY DETERMINATION TO REMAIN IN PORT OR EVADE AT SEA.
o
9.
Calculate Closest Point of Approach (CPA) to tropical cyclone for all courses of action based on latest
forecast/advisory.
o
10. Make decision on course of action to follow and execute. Continue to closely monitor tropical cyclone’s
progress returning to step 1 of the risk analysis when new meteorological analysis & forecast information
becomes available.
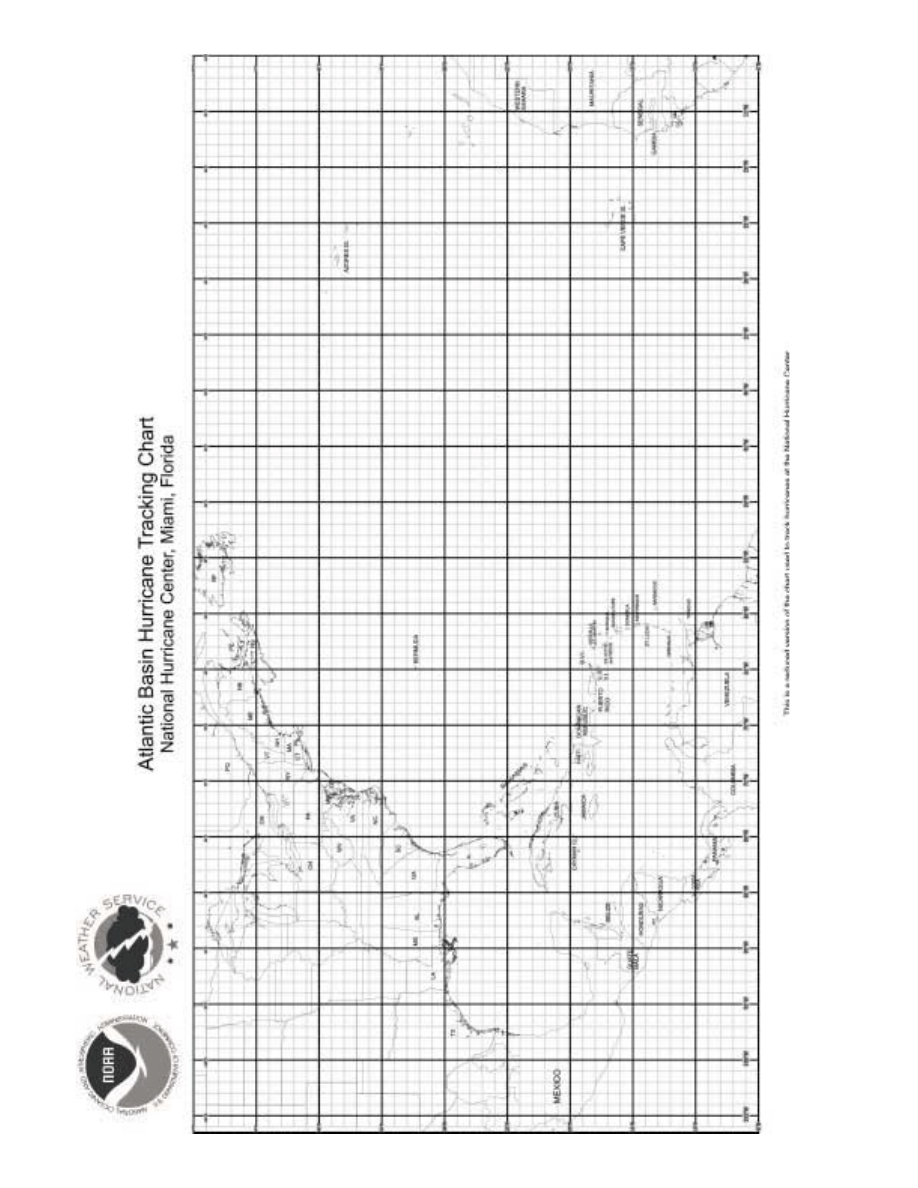
Appendix 2

G-1
GLOSSARY OF TERMS
Anticyclonic – The sense of rotation about the local vertical opposite to that of the earth’s rotation;
that is clockwise in the Northern Hemisphere, counter-clockwise in the Southern Hemisphere, and
undefined at the equator. It is the type of flow evident around high pressure systems throughout the
world. The opposite of cyclonic.
Buffer Zone – Any additional margin of safety radius added to the minimum values of the 1-2-3
rule. The addition of any buffer zone is solely at the discretion of the ship captain and should be
based on observed or indicated forecast uncertainty and the impact that expected weather/wind/
wave conditions in the vicinity of the tropical cyclone can have on ship maneuverability. Buffer
Zones should only be used to add separation between the ship and tropical cyclone. It should never
be used to decrease separation below the minimum values of the 1-2-3 rule.
Cold Core System – A cyclonic system where at any given level of the atmosphere, the center of
the low is colder than the environment surrounding it. Extra-tropical cyclones and winter lows are
examples of normally cold core weather systems.
Convective Activity – A general term used to describe the manifestations of convection in the
atmosphere, alluding particularly to the development of convective clouds and resulting in weather
phenomena, such as showers, thunderstorms, squalls, hail, tornadoes. The vertical extent of these
features determines the type and description of convection. Deep convection is normally found to
extend upward to the tropopause while shallow convection, normally observed as showers, has a
much smaller vertical extent.
Cyclogenesis – The development or strengthening of a cyclonic circulation in the atmosphere. It is
applied to the development of a cyclonic circulation where one did not previously exist.
Cyclonic – The sense of rotation about the local vertical the same as that of the earth’s rotation: that
is, as viewed above, counterclockwise in the Northern Hemisphere, clockwise in the Southern
Hemisphere, and undefined at the equator. It is the type of flow evident around low pressure systems
and tropical cyclones throughout the world. The opposite of anticyclonic.
Danger Area – That region surrounding the forecast track of a tropical cyclone that mariners must
avoid due to a high likelihood of experiencing sustained winds greater than 34 KT associated with
the tropical cyclone in the vicinity. All vessels in the vicinity of a tropical cyclone should, at a
minimum, remain outside of this danger area. However, sea heights outside of this danger area can
often be quite large and mariners are urged to use extreme caution when attempting to remain along
the outer boundary of the danger area while navigating to evade a tropical cyclone.
Dynamic Fetch – This is a situation where fetch and the associated wave generating wind field
move in phase with each other over an extended period of time. This situation allows for greater
wave growth than would normally be expected as the developing seas can remain within the wave
generation region over longer periods of time. In conditions with dynamic fetch, one can expect sea
heights much greater than those experienced in cases where the fetch and/or the wave generating

G-2
wind field remain fixed at a location. Dynamic fetch can occur with both tropical and extra-tropical
cyclones.
Extratropical Transition – The process whereby a tropical cyclone begins to lose its’ characteris-
tics of deep convection near the center and a warm core throughout the troposphere. At this point
the system begins to take on the traits of an extratropical low pressure system whereby the convec-
tion becomes less intense and concentrated. During this time, convection often becomes removed
from the center of circulation. Tropical cyclones undergoing extra-tropical transition often display
an outward expansion of the tropical storm force wind field that can be extremely hazardous to
ships in the region.
Frontolysis – The process in which a front dissipates. This occurs when the temperatures and
pressures equalize across a front.
Global Maritime Distress & Safety System (GMDSS) – System established with goals to provide
more effective & efficient emergency & safety communications and disseminate Maritime Safety
Information (MSI) to all ships on the world’s oceans regardless of location or atmospheric condi-
tions. MSI includes navigational warnings, meteorological warnings/forecasts, & other urgent safety
related information. GMDSS goals are defined in the International Convention for the Safety Of
Life At Sea (SOLAS) 1974, as amended in 1988, & affects vessels over 300 gross tons along with
passenger vessels of any size. The National Weather Service participates directly in the GMDSS by
preparing meteorological forecasts/warnings for broadcast via NAVTEX & INMARSAT-C
SafetyNET.
INMARSAT-C SafetyNET – Inmarsat provides the space segment necessary for instant and
reliable distress and safety satellite communications for the maritime community. Additionally,
Inmarsat offers three satellite communications systems, designed to provide most of the GMDSS
medium and long-range functions: Inmarsat-A, Inmarsat-B and Inmarsat-C. All of these systems
make use of 2-digit codes for easy access to various types of assistance. Finally, Inmarsat also now
offers a distress alerting facility through Inmarsat-E, which is an L-band Emergency Position Indi-
cating Radio Beacon (EPIRB).
Minimum Safe Separation – That distance between ship and tropical cyclone, as determined by the
master or captain of a ship, which will allow the vessel to maintain sufficient speed and maneuver-
ability in order to further evade a tropical cyclone.
Rapid Intensification – The sudden decrease in the minimum sea-level pressure of a tropical
cyclone. Average rates of decrease in surface pressure during rapid intensification are approximately
1.25 MB per hour over a 24 hour period, 2.5 MB per hour over a 12 hour period, or 5 MB per hour
for at least a 6 hour period.
Recurvature – The turning of a tropical cyclone from an initial path toward the west and poleward
to a subsequent path toward the east and poleward. This normally occurs while the tropical cyclone
moves poleward of the lower and middle tropospheric subtropical ridge axis.

G-3
Sortie – The act of departing from port in an attempt to minimize the impacts that a tropical cyclone
will have on a vessel. Any decisions to sortie from port should be made early enough in order to
clear the port and channel reaching a safe evasion point prior to the onset of winds, seas, and
weather that may begin to negatively impact vessel speed and maneuverability.
Subtropical Ridge – A semi-permanent high pressure zone normally found centered near 30°N
latitude in the North Atlantic Ocean. This feature also possesses significant vertical extent up
through the lower and middle troposphere often times acting as the dominant steering influence in a
tropical cyclone.
Synoptic Scale – The scale size of migratory high and low pressure systems occurring in the tropo-
sphere having wave lengths on the order of 550 NM to 1350 NM. Extra-tropical low pressure
centers, cold/warm fronts, and high pressure centers are examples of weather features normally
thought of on the synoptic scale.
Tropopause – The boundary at the top of the troposphere which separates it from the stratosphere
above. This layer is very stable, allowing for very little transport of air from below to above and vice
versa.
Troposphere – That portion of the atmosphere from the earth’s surface to the tropopause; that is,
the lowest 5 NM to 11 NM of the atmosphere. The troposphere is characterized by appreciable
vertical wind, water vapor content, and weather.
Upper Level – Roughly the highest one-third of the troposphere. Although there is no distinct limit
applied to this term, it is considered that portion of the troposphere located at and above the 300 MB
level of the atmosphere still beneath the tropopause.
Warm Core System – A cyclonic system where at any given level of the atmosphere, the center of
the low is warmer than the environment surrounding it. Tropical cyclones are warm core systems.
WMO Header – Globally standardized meteorological product identifiers that give each product
issued by military and government weather agencies worldwide a unique identifying name.

R-1
REFERENCES
Anthes, R.A., 1982: Tropical Cyclones: Their Evolution, Structure, and Effects. Meteor. Monogr.,
Volume 19, No. 41, Amer. Meteor Soc., 208 pp.
Avila, L.A., 1998: Forecasting Tropical Cyclone Intensity Changes: An Operational Challenge.
Preprint, Symposium On Tropical Cyclone Intensity Change, 78
th
Annual AMS Meeting, Phoe-
nix, AZ, Amer. Meteor. Soc., 1-3.
Bowyer, P.J., 2000: Phenomenal Waves with a Transistioning Tropical Cyclone (Luis, The Queen,
and the Bouys). Preprint, 24
th
Conference on Hurricanes and Tropical Meteorology, Amer.
Meteor. Soc., 294-295.
Carr, M., G. Burkley, and L. Chesneau, 1999: Hurricane Avoidance Using the 34 Knot Wind Radius
and 1-2-3 Rules. Mariners Weather Log, Aug. 1999, 4-6.
Coles, K.A., 1992: Heavy Weather Sailing. International Marine, Camden ME, 411 pp.
Crawford, W.P., 1978: Mariner’s Weather. Norton, New York NY, 299 pp.
Cunliffe, T., 1988: Heavy Weather Cruising. International Marine, Camden ME, 64 pp.
Dashew, S., and L. Dashew, 1998: Mariner’s Weather Handbook, 1
st
Ed. Beowulf Inc., Tucson, AZ,
594 pp.
DeMaria, M., and J. Kaplan, 1997: An operational evaluation of a statistical hurricane intensity
prediction scheme (SHIPS). Preprint, 22nd Conf. on Hurricanes and Tropical Meteorology, Ft.
Collins, CO, Amer. Meteor. Soc., 280-281.
______, and J. Kaplan, 1999: An Updated Statistical Hurricane Intensity Prediction Scheme
(SHIPS) for the Atlantic and Eastern North Pacific Basins. Weather and Forecasting, 14, 326-
337.
Dunlap, G.D., and H.H. Shufeldt, 1972: Dodd’s Modern Seamanship, 12
th
Ed. Naval Institute Press,
Annapolis MD, 734 pp.
Dunn, G.E., and B.I. Miller, 1960: Atlantic Hurricanes. Lousiana State University Press, Baton
Rouge LA, 377 pp.
Dutton, B., 1985: Dutton’s Navigation & Piloting. Naval Institute Press, Annapolis MD, 556 pp.
Dvorak, V.F., 1984: Tropical cyclone intensity analysis using satellite data. NOAA Tech. Rep.
NESDIS 11, National Oceanic and Atmospheric Administration, Washington, D.C., 47 pp.
Elsberry, R.L. (ed.), W.M. Frank, G.J. Holland, J.D. Jarrell, and R. L. Southern, 1987: A Global
View of Tropical Cyclones. Office of Naval Research, Marine Meteor. Program, 185 pp.

R-2
Fett, R.W., 1979: Environmental Phenomena and Effects. Navy Tactical Applications Guide, Vol. 2.
Naval Environmental Prediction Research Facility, Monterey CA. 161 pp.
Fitzpatrick, P.J., 1997: Understanding and Forecasting Tropical Cyclone Intensity Change with the
Typhoon Intensity Prediction Scheme (TIPS). Weather and Forecasting, 12, 826-846.
Frank, W.M., 1977: The structure and energetics of the tropical cyclone. I. Storm Structure. Mon.
Wea. Rev., 105, 1136–1150.
_____, and W.M. Gray, 1980: Radius and Frequency of 15 m/s (30 KT) Winds around Tropical
Cyclones. J. Applied Meteor., 19, 219-223.
_____, and P.J. Herbert, 1974: Atlantic Tropical Systems of 1973. Mon. Wea. Rev., 102, 290-295.
Gross, J., 2000: Correspondence dated 28 July 2000 regarding NHC track errors from 1960 to
present time. Tropical Prediction Center, NWS, NOAA. [Available from the author at the Tropi-
cal Prediction Center]
Goldman, J., 1993: How High Can Giant Waves Get?. Mariners Weather Log, 37, 48-50.
Guard, C., 1997: A Preliminary Assessment of Tropical Cyclone Wind Distribution Forecast Capa-
bilities. Preprint, 22nd Conf. on Hurricanes and Tropical Meteorology, Ft. Collins, CO, Amer.
Meteor. Soc., 476-477.
Guiney, J.L., 1999: Preliminary Report Hurricane Cindy 19-31 August 1999. Tropical Prediction
Center, NWS, NOAA.
Guiney, J.L., 1999: Preliminary Report Tropical Storm Harvey 19-22 September 1999. Tropical
Prediction Center, NWS, NOAA.
Guiney, J.L., 1999: Preliminary Report Hurricane Lenny 13-23 November 1999. Tropical Prediction
Center, NWS, NOAA.
Haeften, D.L., 1997: How To Cope With Storms. Sheridan House, Dobbs Ferry N.Y., 168 pp.
Harris, D.L., 1963: Characteristics of the hurricane storm surge. U.S. Weather Bureau, Technical
Data Report No. 48, U.S. Department of Commerce, Washington D.C.
Ho, F.P., 1987: Hurricane Climatology for the Atlantic and Gulf Coasts of the United States. NOAA
Tech. Report 38. NOAA/NWS. 195 pp.
Hong, X., S.W. Chang, S. Raman, L.K. Shay, and R. Hodur, 2000: The Interaction between Hurri-
cane Opal (1995) and a Warm Core Ring in the Gulf of Mexico. Mon. Wea. Rev., 128, 1347-1365
Huschke, R.E., 1959: Glossary of Meteorology. Amer. Meteor. Soc., Boston MA. 638 pp.
James, R.W., 1974: Dangerous Waves Along the North Wall of the Gulf Stream. Mariners Weather
Log, 18, 363-366.

R-3
Kotsch, W.J., 1983: Weather for the Mariner. Naval Inst. Press, Annapolis MD, 315 pp.
Landsea, C.W., 2000: FAQ: Hurricanes, Typhoons, and Tropical Cyclones. NOAA/AOML/Hurri-
cane Research Division. Web Page Version 2.10 of 9 August. [Available via World Wide Web at
address - http://www.aoml.noaa.gov/hrd/tcfaq/tcfaqHED.html]
Lawrence, M.B., and T.B. Kimberlain, 1999: Preliminary Report Hurricane Bret 18-25 August
1999. Tropical Prediction Center, NWS, NOAA.
Lawrence, M.L., 1999: Preliminary Report Hurricane Gert 11-23 September 1999. Tropical Predic-
tion Center, NWS, NOAA.
Luttrell, C., and J. Luttrell, 1998: Heavy Weather Boating Emergencies: Survival Guide for Fresh-
water Powerboat Operators. Marlor Press, St. Paul MN. 288 pp.
McLaren, A.K., 1993: President Madison and the Christmas Day Typhoon. Mariners Weather Log,
37, 54-56.
MacAfee, A.W., and P.J. Bowyer, 2000: Trapped-Fetch Waves in a Transitioning Tropical Cyclone
(Part 1 – The Need and the Theory). Preprint, 24
th
Conference on Hurricanes and Tropical
Meteorology, Amer. Meteor. Soc., 292-293.
______, and P.J. Bowyer, 2000: Trapped-Fetch Waves in a Transitioning Tropical Cyclone (Part 2 –
Analytical and Predictive Model). Preprint, 24
th
Conference on Hurricanes and Tropical Meteo-
rology, Amer. Meteor. Soc., 165-166.
Maritime Inst. Of Technology & Graduate Studies, 1999: Marine Weather Warning, Analysis, and
Forecasting Handbook. MITAGS, Linthicum Heights MD, 14 pp.
Markell, J., 1988: The Sailor’s Weather Guide. Sheridan House, Dobbs Ferry N.Y., 263 pp.
McAdie, C.J., and M.B. Lawrence, 2000: Improvements in Tropical Cyclone Track Forecasting in
the Atlantic Basin, 1970-98. Bull. Amer. Meteor. Soc., 81, 989-997.
Monroe, J.W., 1993: Shiphandling in Heavy Seas. Mariners Weather Log, 37, 8-12.
Naval Atlantic Meteorology & Oceanography Center, 1997: Optimum Track Ship Routing and
Tropical Cyclone Avoidance. Presentation delivered to U.S. Atlantic Fleet Ship Captains and
Navigators.
Navy Education and Training Command, 1988: Aerographer’s Mate Second Class Volume 1.
NAVEDTRA 10370. U.S. Government Printing Office, Washington D.C.
Navy Education and Training Command, 1990: Aerographer’s Mate Second Class Volume 2.
NAVEDTRA 10371. U.S. Government Printing Office, Washington D.C.
Neumann, C.J., 1980: The prediction of tropical cyclone motion – an overview. Selected Papers of
the 13
th
Technical Conference on Hurricanes and Tropical Meteorology, AMS, 68-78.

R-4
_____, 1981: Trends in Forecasting the Tracks of Atlantic Tropical Cyclones. Bull. Amer. Meteor.
Soc., 62, 1473-1485.
_____, B. R. Jarvinen, C. J. McAdie, and G. R. Hammer, 1999: Tropical Cyclones of the North
Atlantic Ocean, 1871–1998. Historical Climatology Series 6-2, National Climatic Data Center,
Asheville, NC, 206 pp.
_____, and J.M. Pelissier, 1981: An analysis of Atlantic tropical cyclone forecast errors 1970-1979,
Monthly Weather Review, 109, 1248-1266.
_____, and M.J. Pryslak, 1981: Frequency and Motion of Atlantic Tropical Cyclones. NOAA Tech-
nical Report NWS 26, U.S. Department of Commerce, Washington D.C., 64 pp.
Nickerson, J.W. 1993: Freak Waves!. Mariners Weather Log, 37, 14-19.
Noel, J.V., and F.E. Bassett, 1977: Knight’s Modern Seamanship, 16
th
Ed.. Van Nostrand Reinhold
Co. New York N.Y., 676 pp.
Paine, G., 1995: Heavy Weather Avoidance. Mariners Weather Log, 39, 16-19.
Pasch, R.J., T.B. Kimberlain, and S.R. Stewart, 1999: Preliminary Report Hurricane Floyd 7 - 17
September, 1999. Tropical Prediction Center, NWS, NOAA.
Pike, A.C., and C.J. Neumann, 1987: The Variation of Track Forecasting Difficulty Among Tropical
Cyclone Basins. Wea. Forecasting, 2, 237-241.
Pielke, R.A., Jr. and R.A. Pielke Sr., 1997: Hurricanes: Their Nature and Impacts on Society. Wiley
& Sons, 279 pp.
Pierson, W.J., G. Neuman, and R.W. James, 1955: Practical methods for for observing and forecast-
ing ocean-waves by means of wave spectra and statistics. H.O. Publ. 603, U.S. Navy Hydro-
graphic Office.
Rappaport E.N., and J. Fernández-Partagás, 1995: The Deadliest Atlantic Tropical Cyclones, 1492-
1994. NOAA Tech Memo NWS/NHC 47. NOAA/National Weather Service. 41 pp.
Ramage, C.S., 1995: Forecasters Guide to Tropical Meteorology. AWS/TR-95/001 Air Weather
Service, Scott Air Force Base, Illinois, 392 pp.
Riehl, H., 1950: A model of hurricane formation. J. Appl. Phys., 21, 917–925.
_____, 1954: Tropical Meteorology. McGraw-Hill, 392 pp.
Rousmaniere, J., and M. Smith, 1999: The Annapolis Book of Seamanship. Simon & Schuster, NY,
403 pp.
Sanderson, R., 1982: Meteorology at Sea. Stanford Marine, London England, 227 pp.

R-5
Shay, L.K., G.J. Gioni, and P.G. Black, 2000: Effects of a Warm Oceanic Feature on Hurricane
Opal. Mon. Wea. Rev., 128, 1366-1383.
Simpson, R.H., 1954: Hurricanes. Scientific American, vol. 190. no. 6, pp. 32-37
Sverdrup, H.U., and W.M. Munk, 1947: Wind, sea, and swell: Theory of relations for forecasting.
H.O. Publ. 601, U.S. Navy Hydrographic Office, 44 pp.
Turpin, R.J.B., and S. Brand, 1982: Hurricane Havens Handbook for the North Atlantic Ocean.
Technical Rep TR 82-03, Naval Environmental Prediction Research Facility Monterey CA, 282
pp.
U.S. Department of Commerce, 1999: National Hurricane Operations Plan FCM-P12-1999. Federal
Coordinator for Meteorological Services, NOAA.
U.S. Department of Commerce, 1999: NWS Marine Product Dissemination Information. NOAA/
National Weather Service. [Available via the World Wide Web at address - http://
www.nws.noaa.gov/om/marine/home.htm]
U.S. Department of Commerce, 2000: Worldwide Marine Radiofacsimile Broadcast Schedules.
NOAA/National Weather Service. 94 pp. [Available via World Wide Web at address - http://
www.nws.noaa.gov/om/marine/home.htm]
U.S. Department of Commerce, 1999: Weather Service Operations Manual (WSOM) Chapter C-41,
Tropical Cyclone Program. NOAA/National Weather Service.
University Corporation for Atmospheric Research, and NOAA/NWS, 1999: COMET Module,
Community Hurricane Preparedness Version 1. HTML Based Instruction Program. [Available
from FEMA, NWS, and COMET]
Wojdylak, H. 1986: Encounters of the President Taft with Typhoon Wayne and Typhoon Vera.
Memorandum and report prepared by Oceanroutes, Inc. taken from course materials for MITAGS
Heavy Weather Avoidance Course. MITAGS, Linthicum Heights MD, 22 pp.
Walsh, E.J., C.W. Wright, D.C. Vandemark, W.B. Krabill, A.W. Garcia, S.H. Houston, M.D. Powell,
P.G. Black, and F.D. Marks, 2000: Hurricane Directional Wave Spectrum Spatial Variation at
Landfall. Preprint, 24
th
Conference on Hurricanes and Tropical Meteorology, Amer. Meteor. Soc.,
327-328.
Williams, M., 1990: The Boater’s Weather Guide. Cornell Maritime Press, Centreville MD, 150 pp.
Wright, C.W., E.J. Walsh, D.C. Vandemark, W.B. Krabill, A.W. Garcia, S.H. Houston, M.D. Powell,
P.G. Black, and F.D. Marks, 2000: Hurricane Directional Wave Spectrum Spatial Variation in the
Open Ocean. Preprint, 24
th
Conference on Hurricanes and Tropical Meteorology, Amer. Meteor.
Soc., J1-J2.
Document Outline
- Mariner's Guide Title Page
- Table Of Contents
- Introduction & Purpose
- Disclaimer
- Chapter 1
- Chapter 2
- Chapter 3
- Chapter 4
- Summary & Acknowledgements
- Appendix 1
- Appendix 2
- Glossary Of Terms
- References
Wyszukiwarka
Podobne podstrony:
06 User Guide for Artlantis Studio and Artlantis Render Export Add ons
Guide for Parameterization
A Guide for Counsellors Psychotherapists and Counselling
ESL Seminars Preparation Guide For The Test of Spoken Engl
A Meditation Guide For Mahamudra
Going 3D Survival Guide for 2D CAD Users
Making Gin & Vodka A Professional Guide for Amateur Distillers J Stone
Disenchanted Evenings A Girlfriend to Girlfriend Survival Guide for Coping with the Male Species
Bill Hurter Master Lighting Guide for Wedding Photographers (2)
AMACOM, A Survival Guide for Working With Bad Bosses Dealing With Bullies, Idiots, Back stabber
Ada 95 A guide for C and C programmers S Johnston
Installation Guide for WindowsXP
Guide for solubilization of membrane proteins and selecting tools for detergent removal
Consulting Risk Management Guide For Information Tecnology Systems
Foraging A Beginners Guide for Foraging Wild Edible Plants
Antisocial Guide To Horror Film The Essential Guide For Low Bud (2)
Notice that you must leave a brief guide for landlords and tenants
A Student Guide for Homer The Iliad
więcej podobnych podstron